Single-cell transcriptome reveals insights into the development and function of the zebrafish ovary
- Department of Molecular and Cellular Biology, University of California, Davis, United States
- Mount Desert Island Biological Laboratory, United States
Figures
Figure 1 with 3 supplements
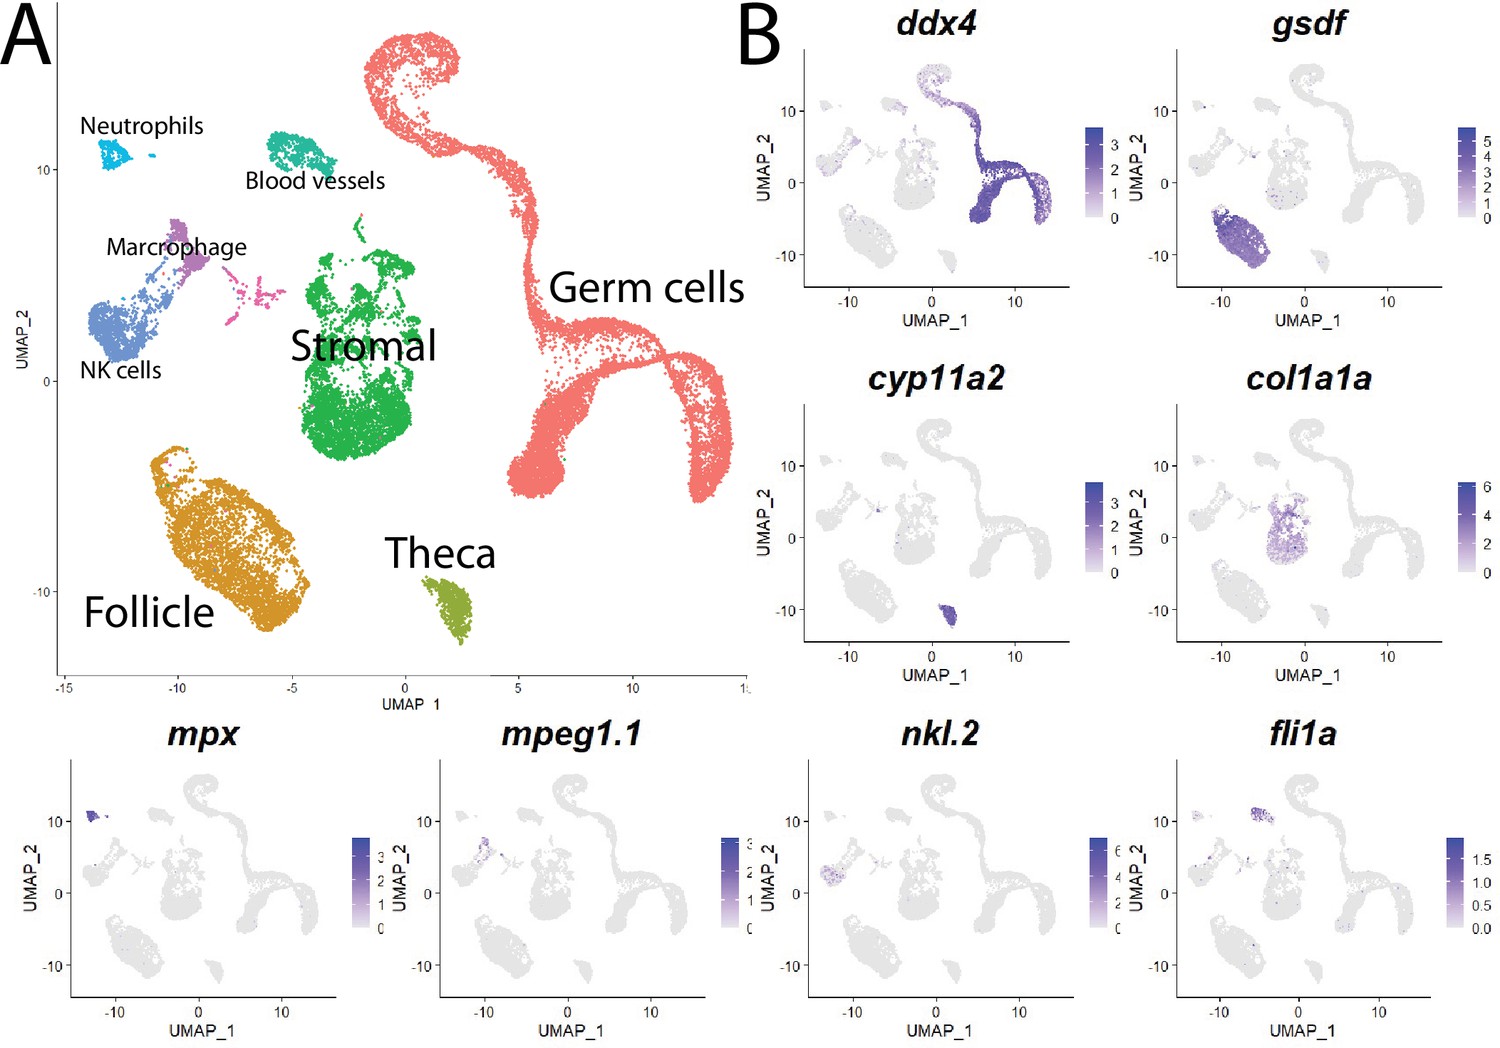
Single-cell RNA sequencing of 25,089 single cells isolated from 40-day-old zebrafish ovaries.
(A) Single-cell uniform manifold approximation and projection (UMAP) plot of the 40-day-old zebrafish ovary. Cells are color-coded by computationally determined cell clusters. (B) Gene expression plots of known cell-specific marker genes identify the major cell type (labeled in A) that each cluster corresponds to. Cells expressing the indicated gene are colored purple, and the relative intensity indicates relative expression levels (intensity scale for each plot is on the right).
Figure 1—figure supplement 1
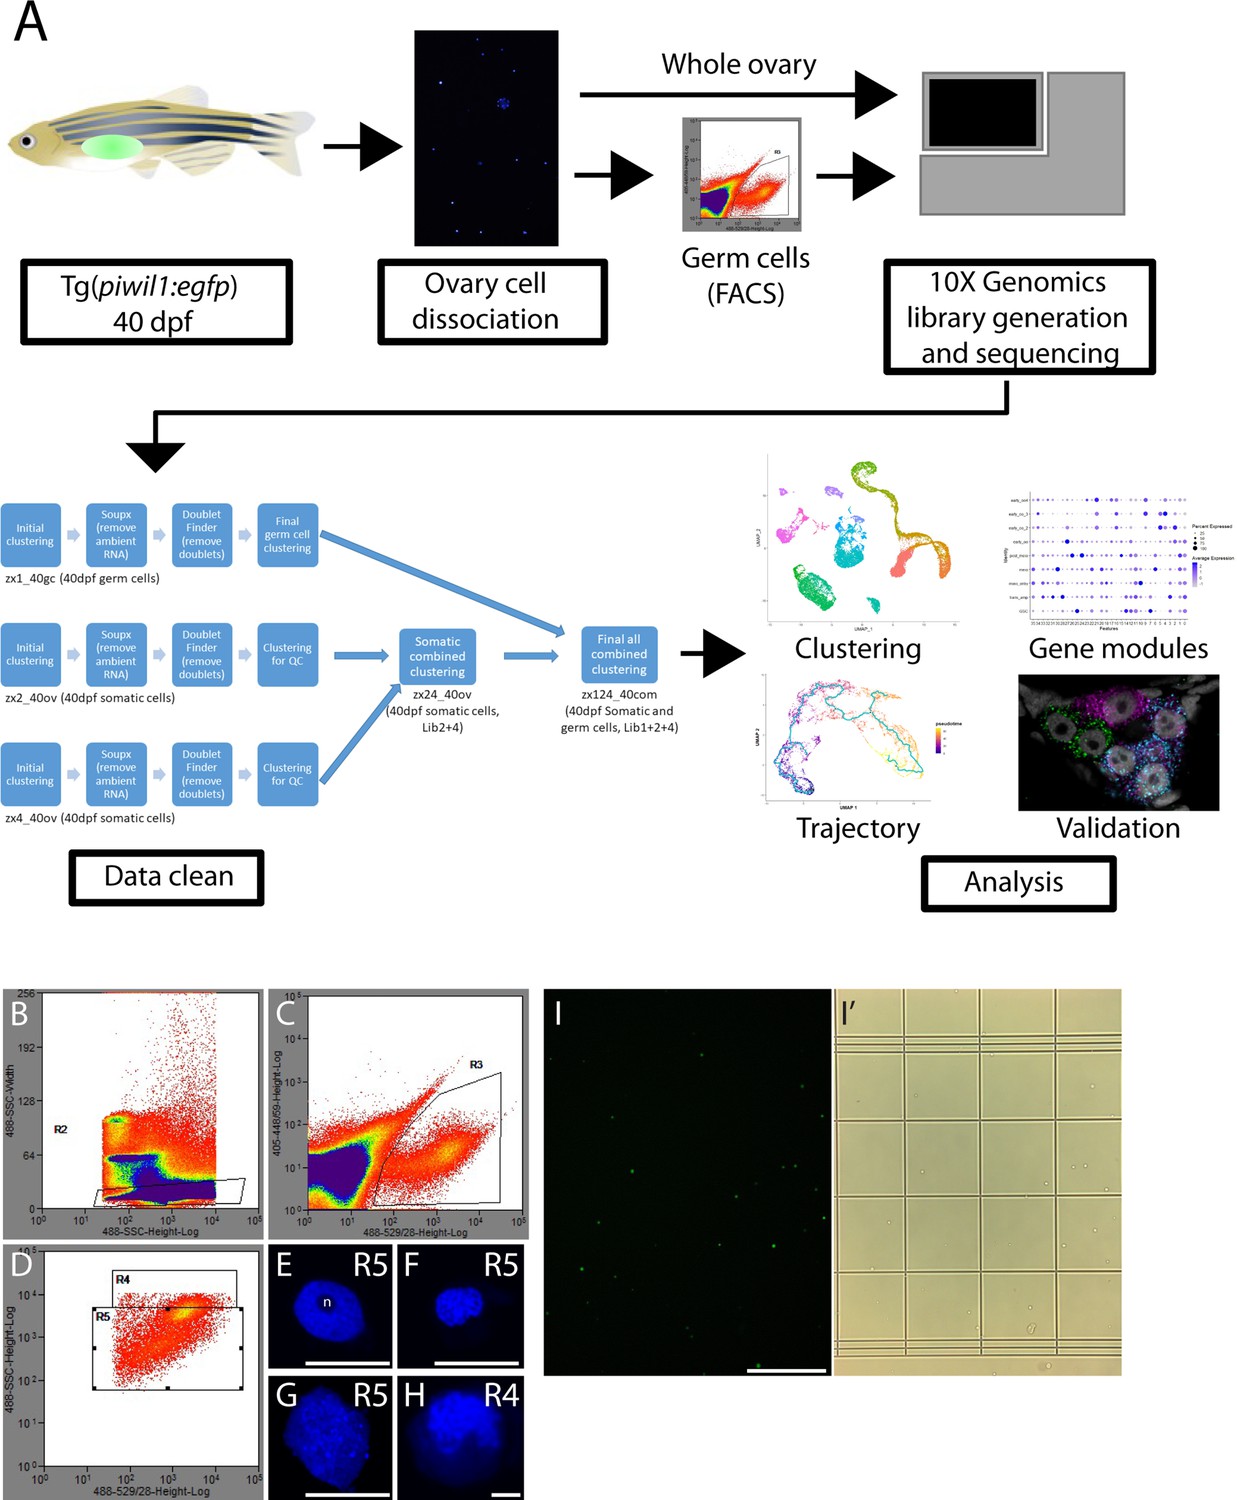
Workflow for single-cell RNA sequencing library preparation, data cleaning, analysis, and validation.
(A) Experimental pipeline for the production of the single-cell RNA-seq library. Briefly, 40-day post-fertilization (dpf) ovaries were isolated from Tg(piwil1:egfp) zebrafish and dissociated to single cells using two dissociation methods. The whole ovary dissociation method favored dissociation of somatic cells but led to loss of germ cells. A less stringent method was used to dissociate germ cells from somatic cells, followed by purification of germ cells by fluorescent-activated cell sorting (FACS). (B–D) FACS pseudocolor scatter plots with gating overlays. (B) The R2 gate selected for GFP+ single cells based on GFP fluorescence intensity (X-axis) and side scatter to measure cell size (Y-axis). (C) The R3 gate selected for GFP signal (X-axis) relative to cell autofluorescence (Y-axis). The R4 and R5 gates selected for cell size (Y-axis) and GFP signal (X-axis). The R5 gate contained smaller cells that were likely premeiotic, meiotic and early-stage oocytes, while R4 gate selected for larger cells that were likely more advanced oocytes. (E–H) Representative images of DAPI-stained nuclei from cells obtained from either the R5 (E–G) or R4 gates. (E) The prominent single nucleolus (n) contained within this nucleus is indicative of a premeiotic germ cell. (F, G) The diffuse chromatin in these nuclei is characteristic of premeiotic oocyte progenitor cells. (H) The presence of condensed and synapse chromosomes is characteristic of cells that have entered meiosis. Note that the nucleus in (H) is 30 µm in diameter while those in (E, F) are between 7 and 10 µm in diameter. Scale bars 10 µm. (I, I’). Fluorescence (I) or bright-field (I’) micrographs of GFP+ cells obtained from gate 5. Scale bars, (E–H) 10 µm; (I, I’) 250 µm.
Figure 1—figure supplement 2
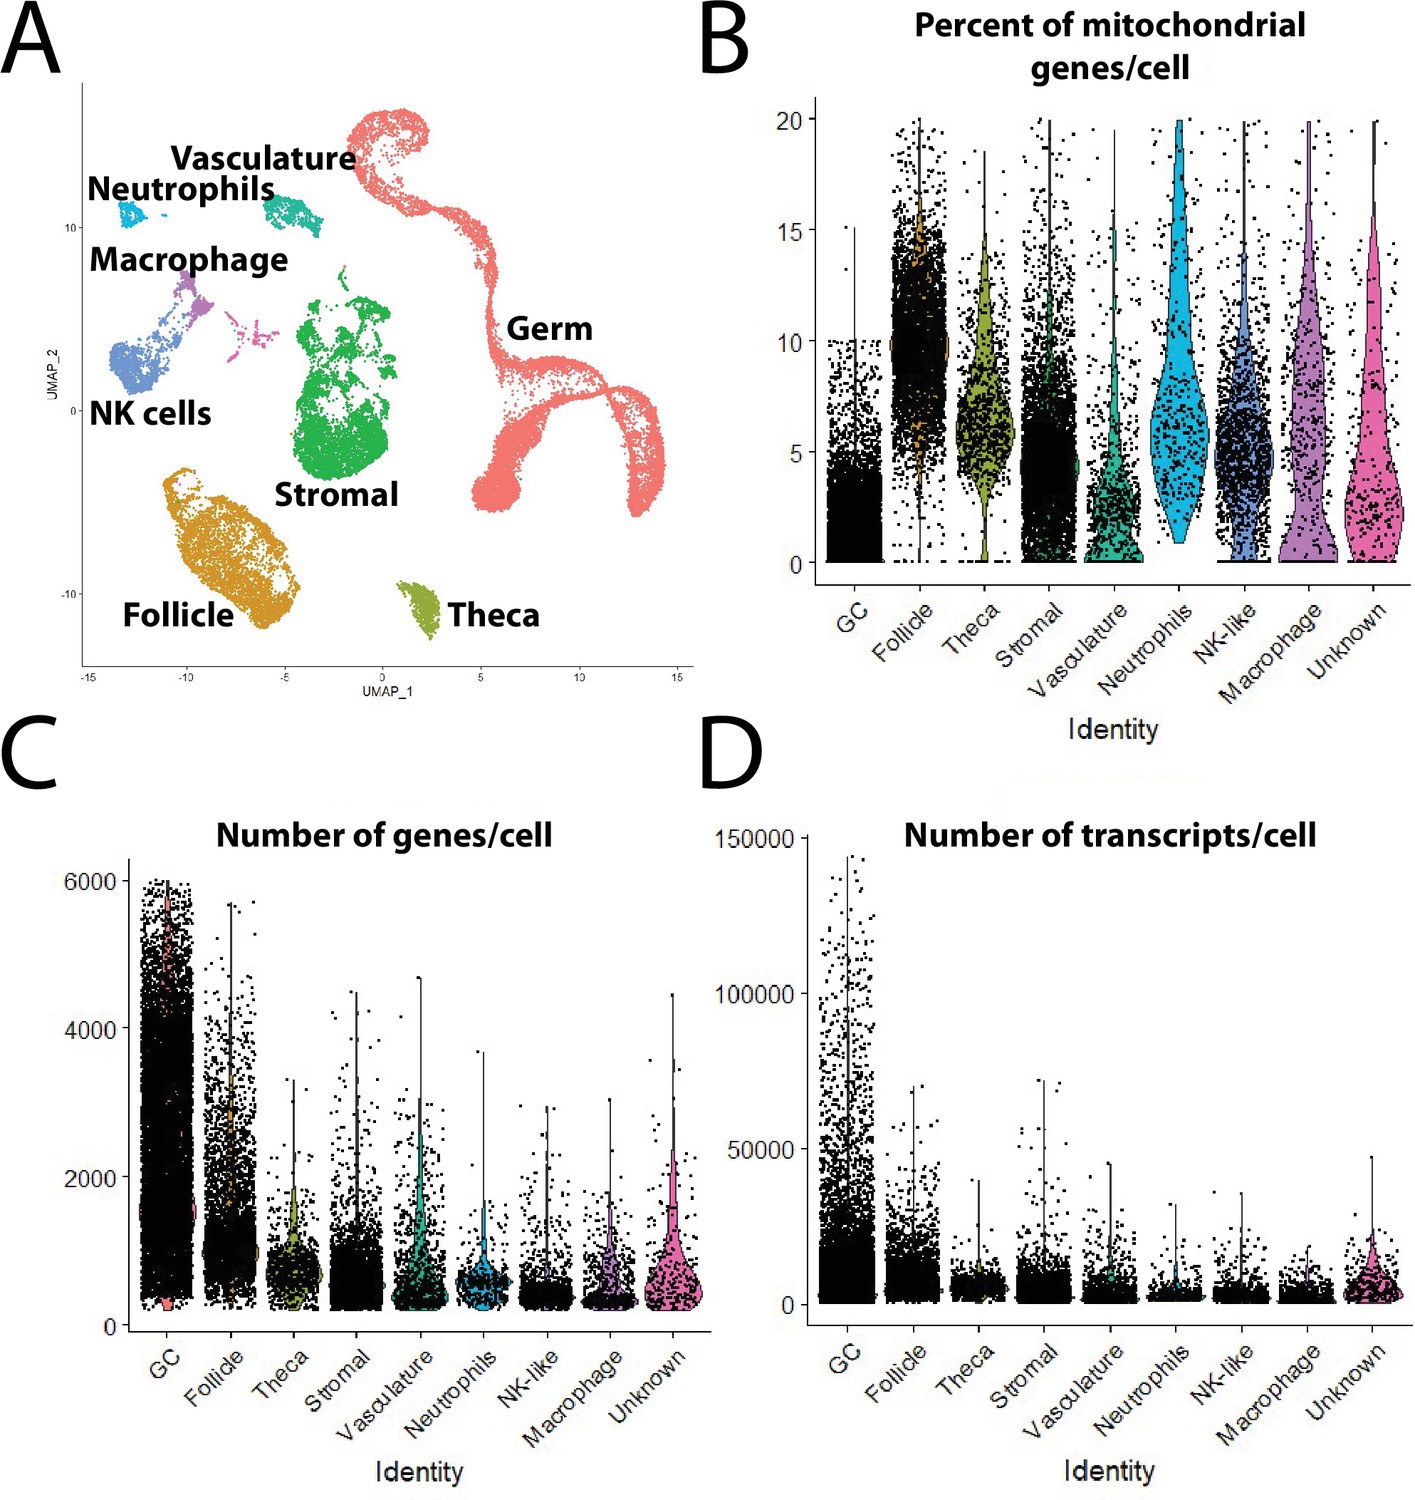
Major cell-type statistics.
(A) Single-cell uniform manifold approximation and projection (UMAP) plot of 40-day-old zebrafish ovary with combined clusters based on major cell types. (B–D) Violin plot of percent of mitochondria genes (B), number of genes per cell (C), and number of transcripts per cell (D), in each major cell type in the final dataset.
Figure 1—figure supplement 3

Differential expression heatmap and top markers of major cell types.
(A) Gene expression heatmap of differentially expressed genes between major cell types. Yellow represents highly expressed genes, purple represents lowly expressed genes, and black represents no expression. (B) Top 5 marker genes computationally identified in each major cell type based on statistical significance.
Figure 2 with 5 supplements
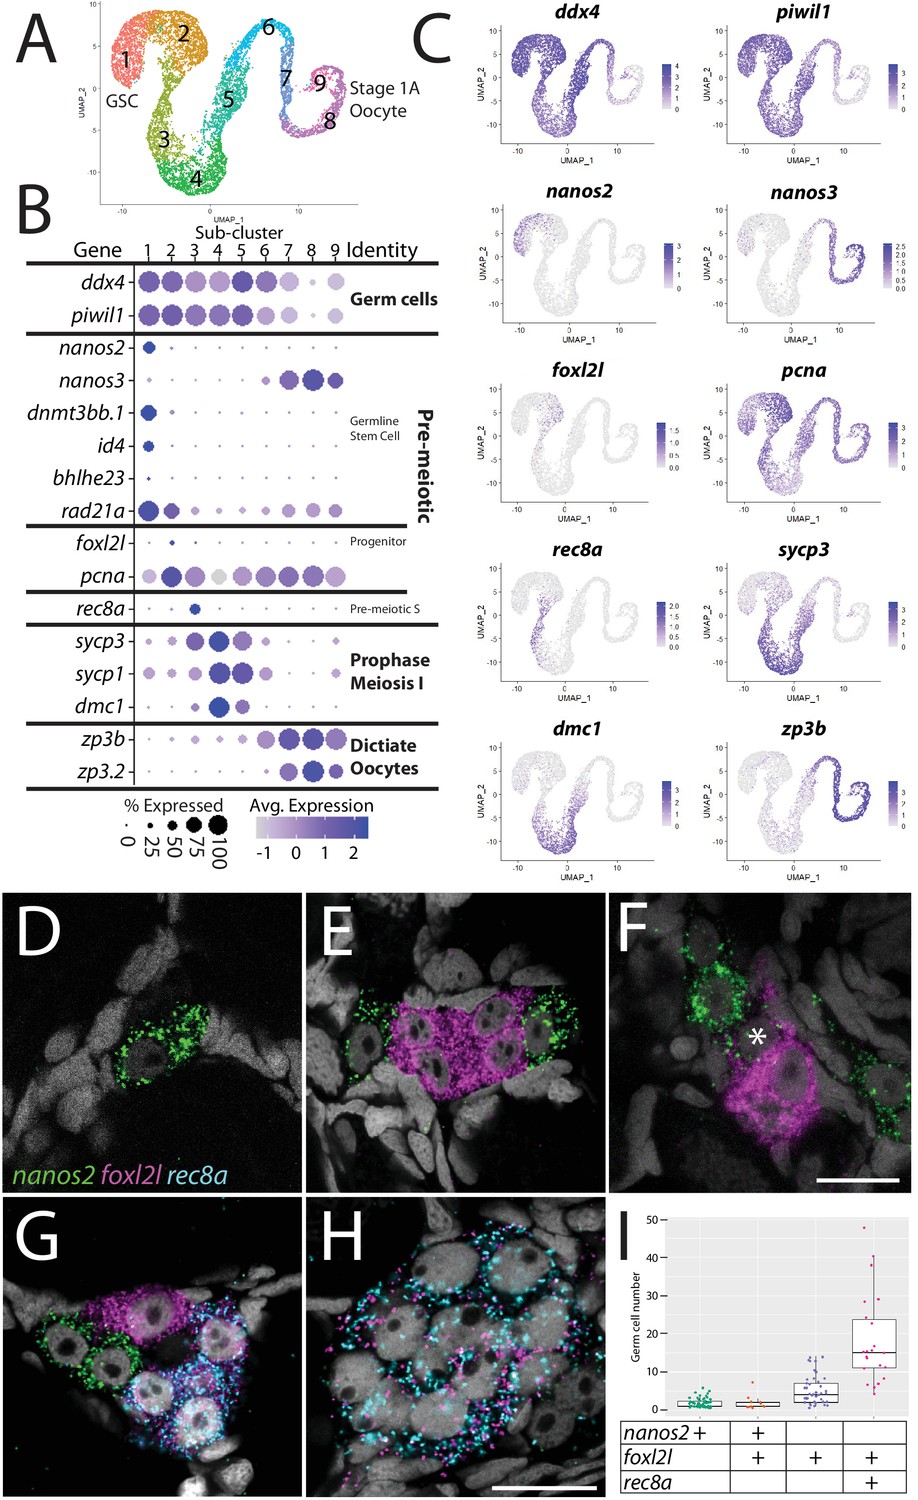
Germ cell subcluster analysis reveals developmental transitions of early germ cells.
(A) Germ cell subcluster uniform manifold approximation and projection (UMAP) plot, with cells color-coded by computationally determined cell subtypes. (B) Dot plot showing the relative expression of select genes in the germ cell subclusters. Some genes, like ddx4 and piwil1, are expressed in all germ cells, while others, such as nanos2 or rec8a, are only expressed in distinct subclusters. (C) Gene expression UMAP plots of select genes. (D–H) Triple hybridization chain reaction RNA fluorescent in situ hybridization (HCR RNA-FISH) for nanos2 (green), foxl2l (magenta), and rec8a (blue) in 40-day-old zebrafish whole-mount ovary. Asterisk in (F) indicates a cell double-positive for nanos2 and foxl2l. (I) Cell number quantification of individual cysts that express the genes indicated on Y-axis. n = 70, N = 3. Scale bar in (F), for (D–G) 10 µm; in (H) 10 µm.
Figure 2—figure supplement 1

Developmental trajectory analysis of the germ cell library using Monocle 3 produced a similar trajectory to that apparent in the SURAT-based cluster analysis.
(A) Germ cell subcluster trajectory uniform manifold approximation and projection (UMAP) plot from Monocle 3. (B) Pseudotime gene expression plots from Monocle 3 for several germ cell-relevant genes (see text for details).
Figure 2—figure supplement 2
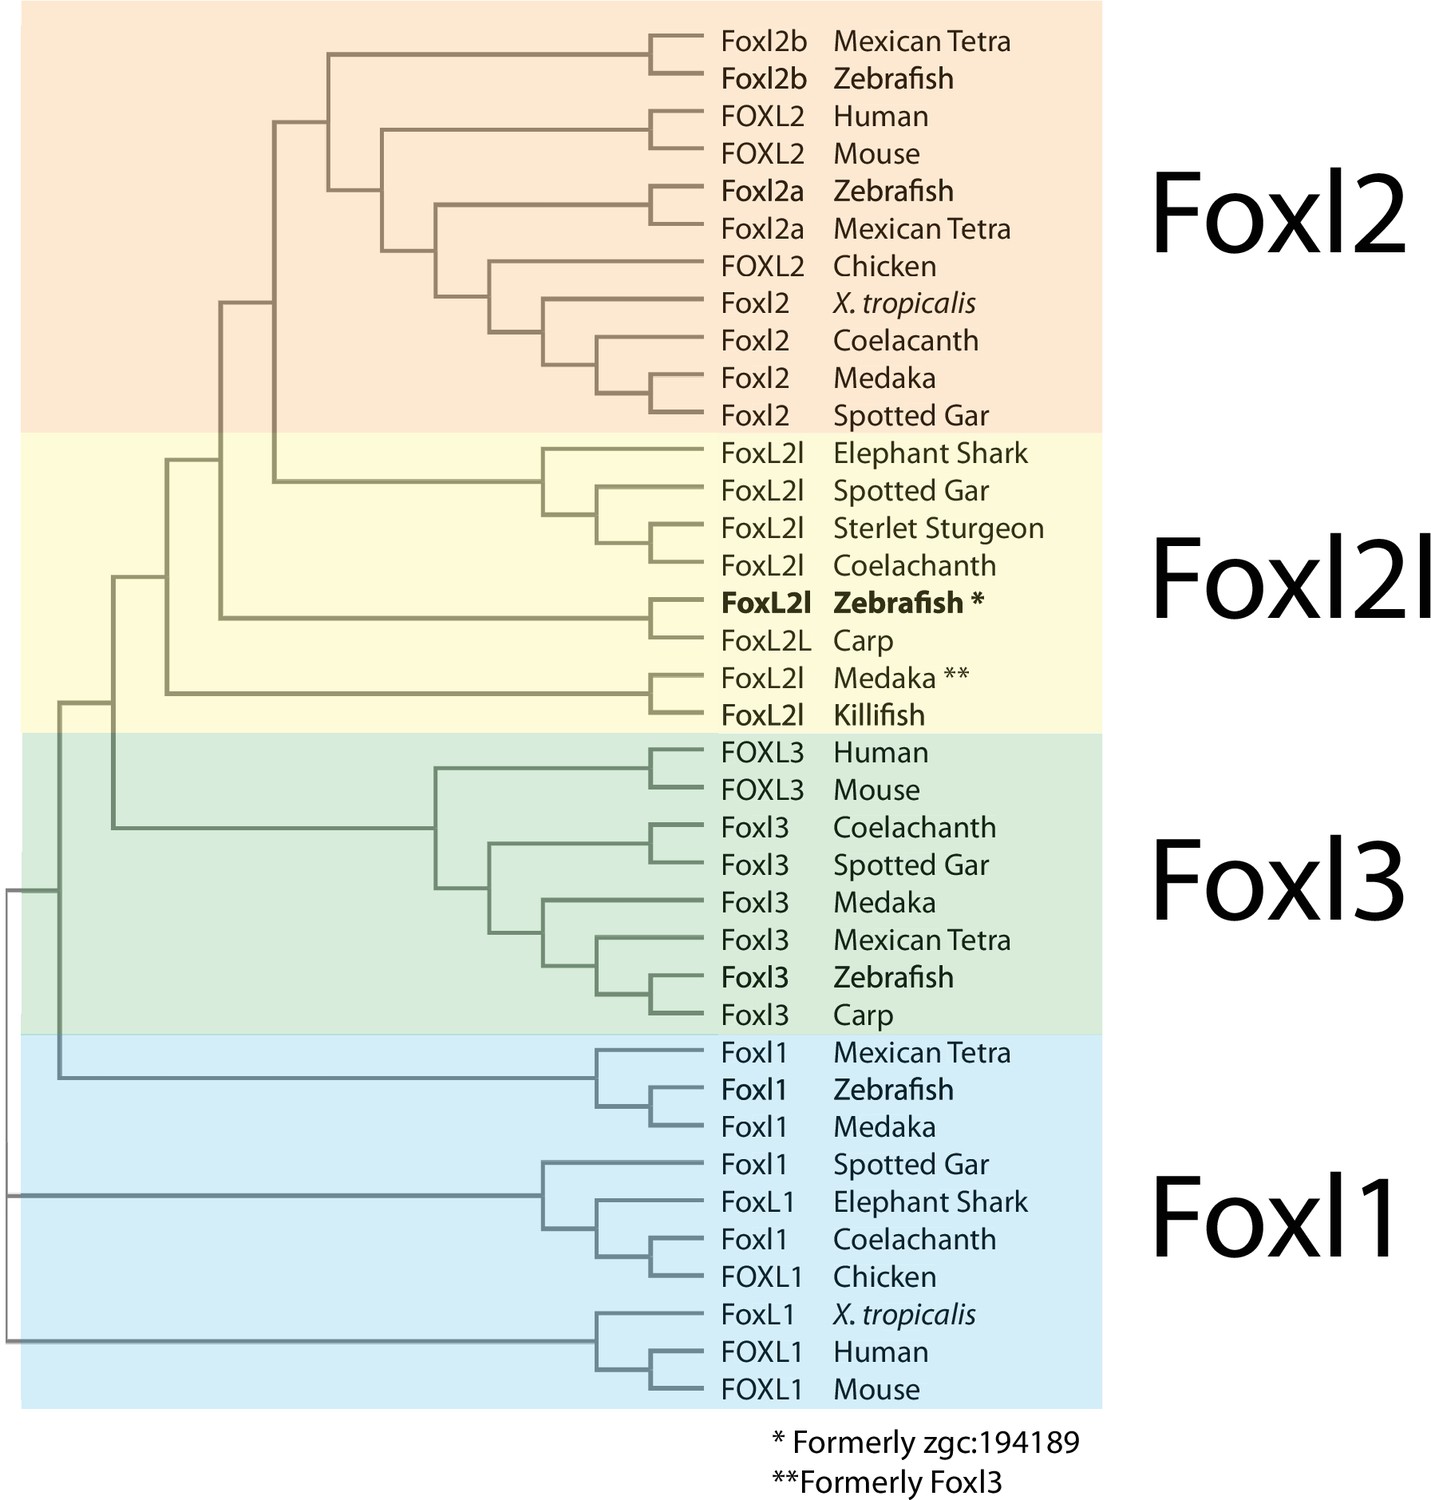
Phylogenetic analysis of Foxl2, Foxl2l, Foxl3, and Foxl1 proteins.
* denotes zebrafish Foxl2l (formerly annotated as zgc:194189) and ** denotes medaka Foxl2l (formerly called Foxl3). Accession numbers of genes used in this analysis can be found in Materials and methods.
Figure 2—figure supplement 3
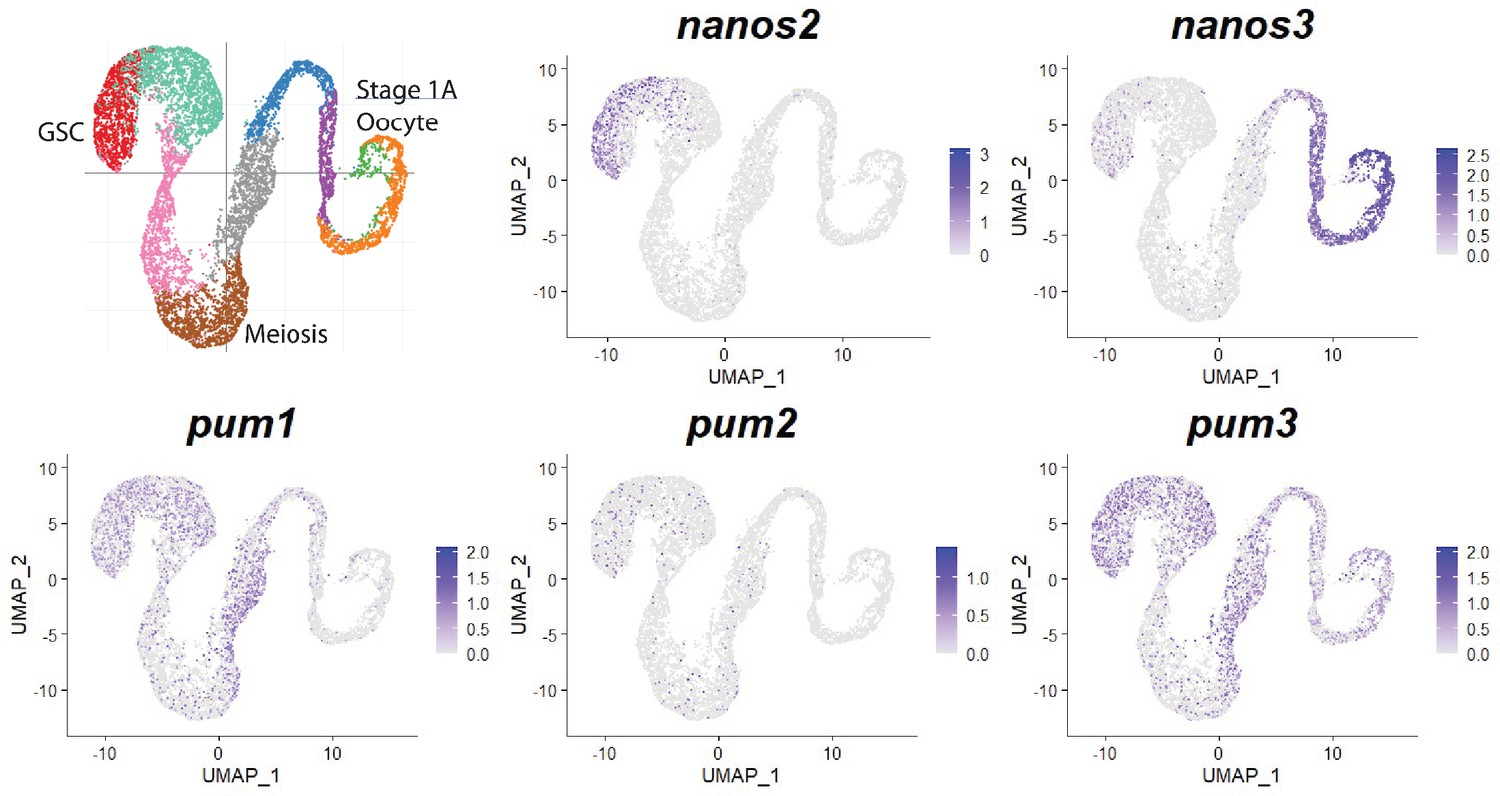
Expression of nanos and pumilio orthologs in zebrafish germ cells.
Gene expression uniform manifold approximation and projection (UMAP) plots of select genes. Cells expressing the indicated gene are colored blue, and the relative intensity indicates relative expression levels (intensity scale for each plot is on the right). The UMAP in the upper-left corner shows cells color-coded by computationally determined cell subtypes.
Figure 2—figure supplement 4

Germ cell library statistics and novel zebrafish germline stem cell (GSC) markers.
(A) Violin plot of the number of genes per cell, number of transcripts per cell, and percent of mitochondria genes in each germ cell subclusters. (B) Gene expression UMAP plots of select GSC-enriched genes. Cells expressing the indicated gene are colored blue, and the relative intensity indicates relative expression levels (intensity scale for each plot is on the right). (C, D) Multicolor fluorescent in situ hybridization (mFISH) on whole-mount 40-day post-fertilization (dpf) ovaries reveals the location confirms expression of id4 (red in panel C; n = 18/18 double-positive, four replicates) and chga (red in panel D; n = 4/22 double-positive, four replicates) in nanos2-expressing GSCs (green). In all panels, DNA is gray. 5 µm scale bars.
Figure 2—figure supplement 5
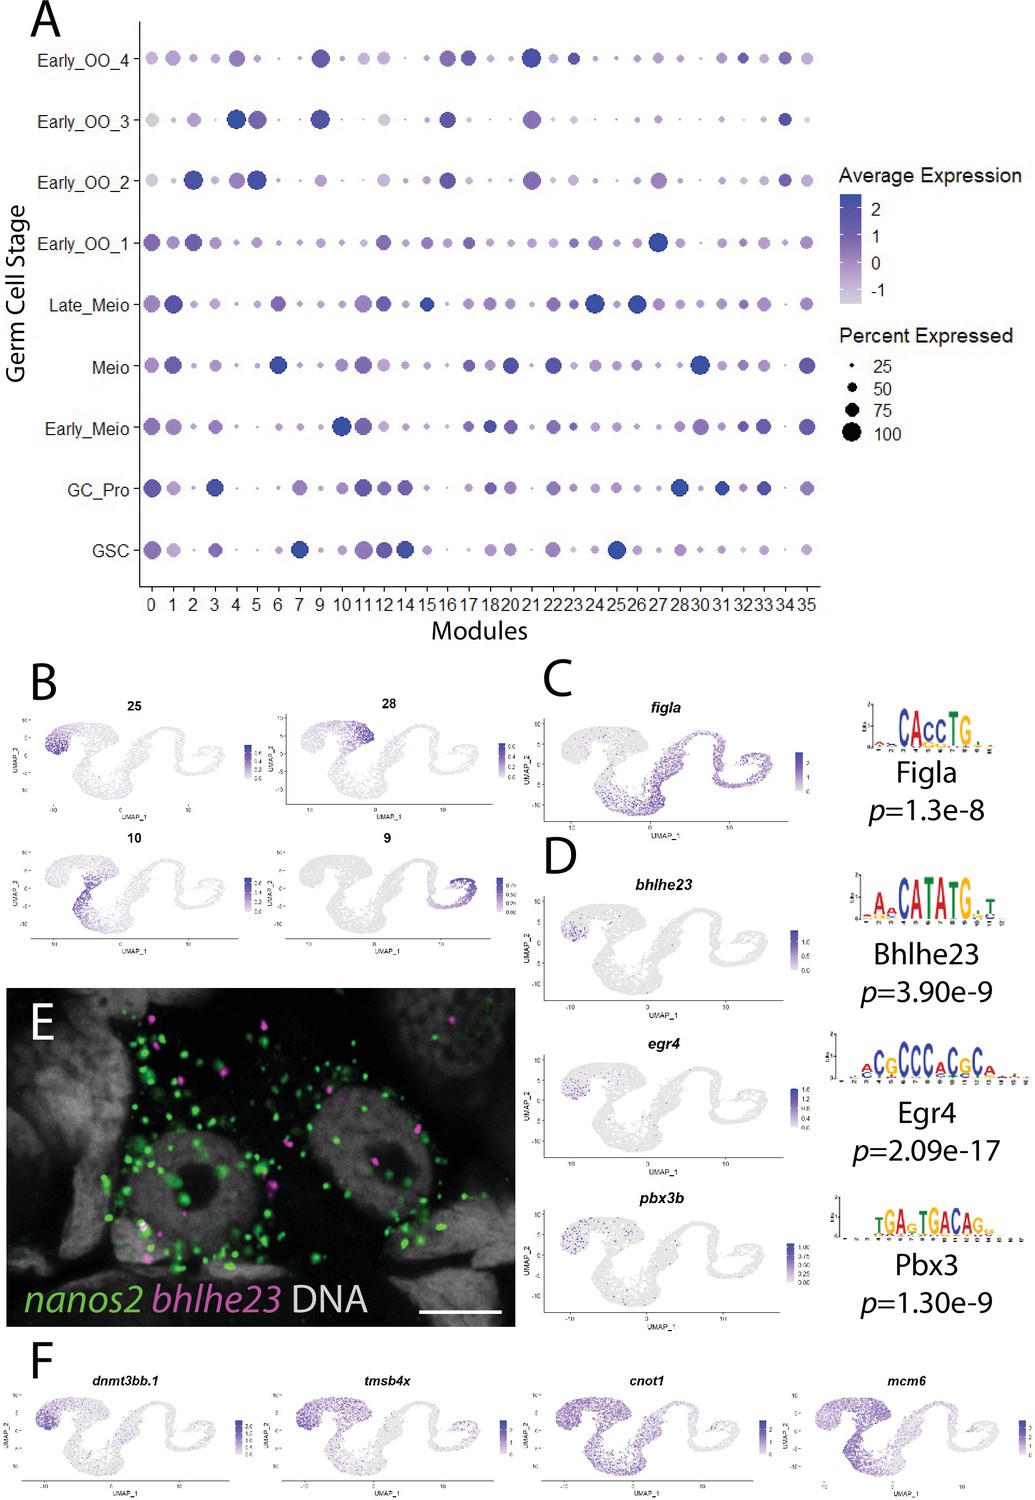
Gene module analysis and motif enrichment identify putative germline stem cell (GSC)-specific transcription factors.
(A) Dot plot of expression level and percent expressed of identified gene modules corresponding to germ cell clusters. (B) Average expression of genes in selected gene modules plotted in germ cell subcluster. (C) Gene expression plots and corresponding binding motifs of Figla (module 9). (D) Gene expression plots and GSC-enriched selected transcription factors that were identified from motifs (module 25). (E) Multicolor fluorescent in situ hybridization (mFISH) on whole-mount 40-day post-fertilization (dpf) ovaries confirms expression of bhlhe23 (red) in nanos2-expressing GSC (green). DNA is gray. 5 µm scale bars.
Figure 3
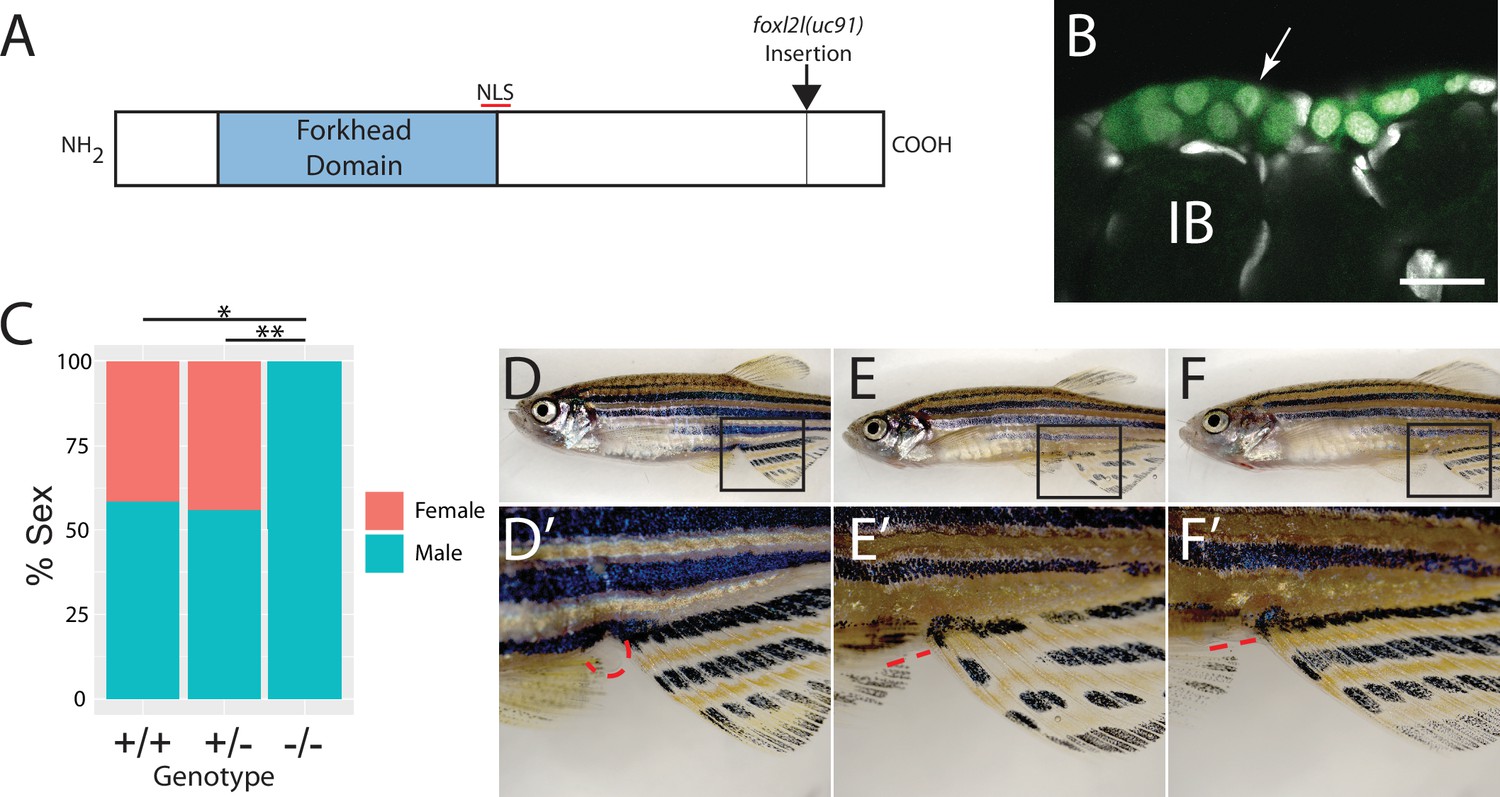
Mutational analysis of foxl2l.
(A) Schematic diagram of the Foxl2l protein showing the DNA-binding forkhead homology domain (blue), the location of the nuclear localization signal (NLS), and the viral-2A-egfp insertion site in the foxl2l(uc91) allele. (B) GFP expression in germ cells from a foxl2l(uc91) knock-in allele heterozygote recapitulates endogenous foxl2l expression (compare to Figure 2E and F). (C) Sex ratios of foxl2l(uc91) heterozygotes and homozygotes. (D–F) Representative light micrographs of fish examined in (C) (n = 274, N = 4, *p=1 × 10⁻⁷, **p=2 × 10⁻⁷). Wild-type adult female zebrafish (D) has characteristic light-yellow pigmentation on ventral belly and a prominent anal papilla (highlighted with red dashed lines) (D’). (E) Wild-type adult male zebrafish (E) has dark yellow pigmentation on ventral belly and lacks an anal papilla (highlighted with red dashed lines) (E’). foxl2l(uc91) homozygous mutant (F) is phenotypically male. IB, stage IB oocyte.
Figure 4 with 3 supplements

Follicle cell subcluster analysis reveals three main cell subtypes.
(A) Follicle cell subcluster uniform manifold approximation and projection (UMAP) plot, with cells color-coded by computationally determined cell subtypes. The three main subtypes are outlined. (B) Dot plot showing the relative expression of select genes in the follicle cell subclusters. Some genes, like gsdf, are expressed in all follicle cells, while others, such as lhx9, are only expressed in distinct subclusters. (C) Gene expression UMAP plots of select genes. Cells expressing the indicated gene are colored purple, and the relative intensity indicates relative expression levels (intensity scale for each plot is on the right). (D–G) Hybridization chain reaction RNA fluorescent in situ hybridization (HCR RNA-FISH) on whole-mount 40-day post-fertilization (dpf) ovaries reveals the location of cell subtypes. In all panels, DNA is gray. (D) gpc1a expression (pink) is detected in follicle cells surrounding stage IB oocytes, but not stage II oocytes. (E) gja11 expression (pink) is detected in follicle cells surrounding stage II oocytes, but not stage IB oocytes. Ddx4 indirect immunofluorescence (green) labels all germ cells. (F) Triple HCR RNA-FISH shows lhx9-expressing cells (blue) form tracts on the surface of the ovary (arrows) that colocalize with nanos2 (green) and dmc1 (pink)-expressing germline stem cells and early meiotic cells, respectively. Lateral edge of the ovary is indicated with a dashed line. (F’, F”) Higher-magnification views of regions boxed in (F) showing that lhx9+ cells (arrows) surround the germ cells. (G) Triple HCR RNA-FISH shows bmp6-expressing cells (blue) are concentrated near the lateral edge of the ovary, a region that contains nanos2 (green) and dmc1 (pink)-expressing germline stem cells (arrows) and early meiotic cells, respectively (inset in G shows nanos2 and DNA only for dashed boxed region). Asterisks identify autoflorescent red blood cells. (G’) bmp6 channel only. Scale bars in (D, E, G) for (G, G’) 50 µm; (F) 100 µm; (F’) (for F’ and F”) and (G, inset), 20 µm. IB, stage IB oocyte; II, stage II oocyte.
Figure 4—figure supplement 1

Gene expression uniform manifold approximation and projection (UMAP) plots of select follicle cell-enriched genes.
Cells expressing the indicated gene in all cells (left column) or in follicle cell subcluster (right column) are colored blue, and the relative intensity indicates relative expression levels (intensity scale for each plot is on the right). Fol, follicle cells; Str, stromal cells; The, theca cells; GC, germ cells; IB, stage IB follicle cells; II, stage II follicle cells, PF, pre-follicle cells.
Figure 4—figure supplement 2
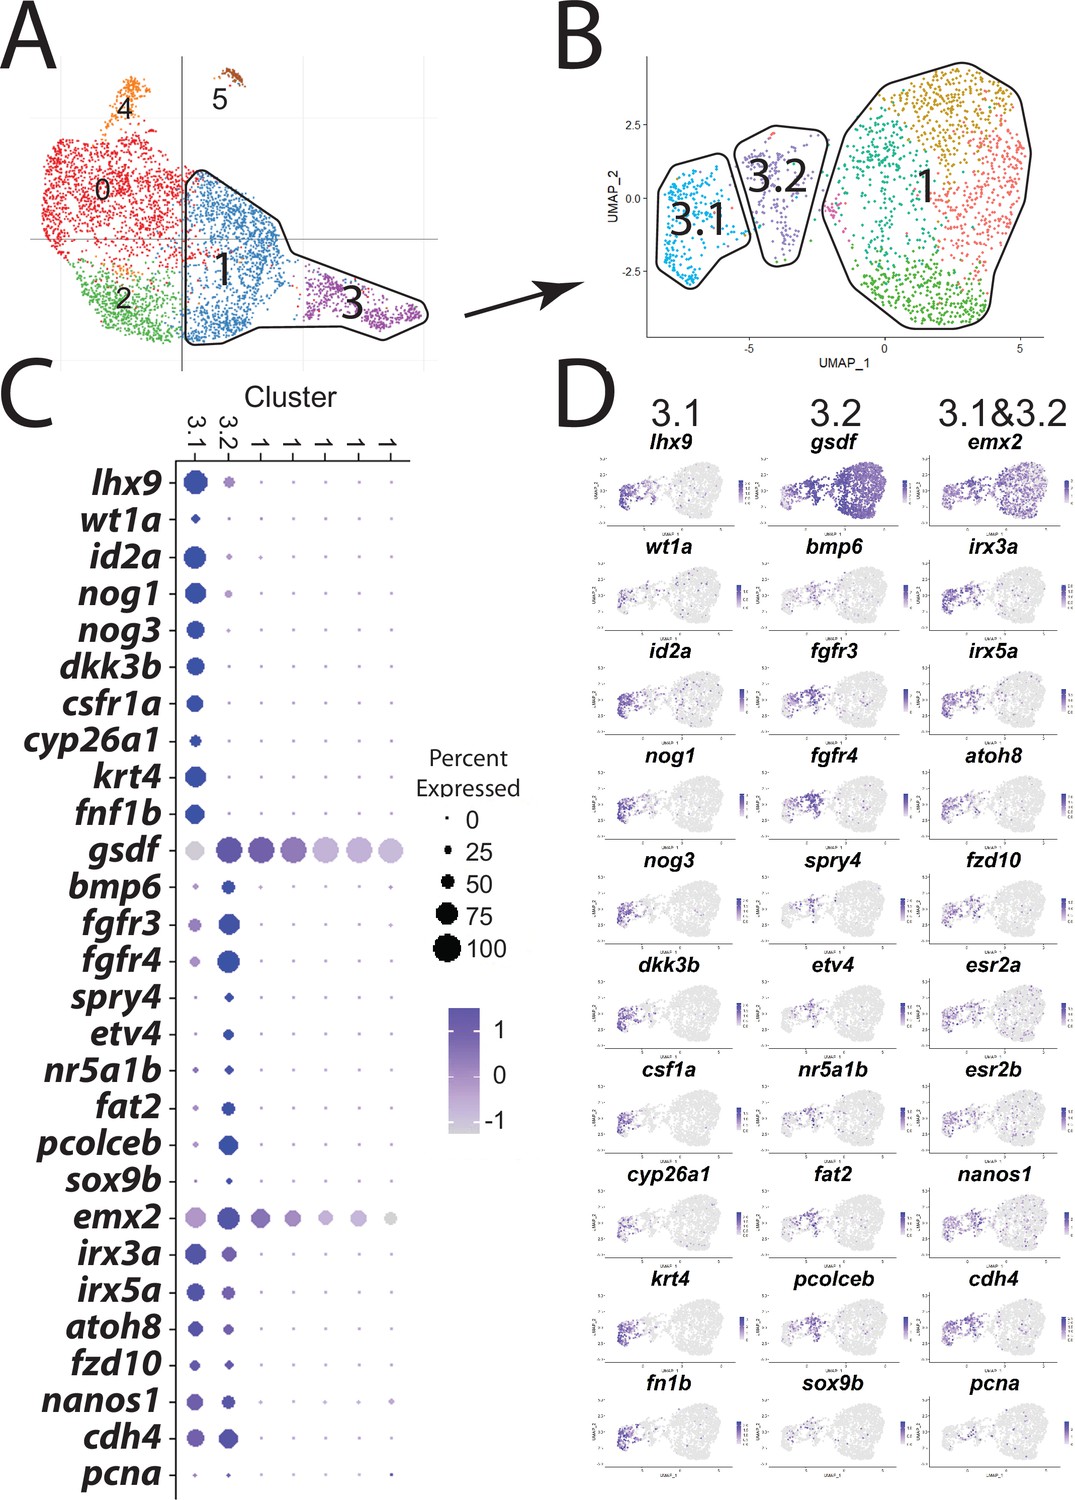
Subcluster analysis of pre-follicle cells (lhx9+).
(A). Follicle cell subcluster uniform manifold approximation and projection (UMAP) plot, with cells color-coded by computationally determined cell subtypes. The cells outlined, subclusters 1 and 3, were further subclustered, generating the UMAP plot shown in (B. B). UMAP plot of the lhx9 subcluster. For simplicity, the multiple subclusters have been combined into only three subclusters, which are referred to as SC3.1, SC3.2, and SC1, nomenclature that references their location in the original UMAP subcluster plot shown in (B. C). Dot plot showing the relative expression of select genes in the pre-follicle cell subclusters. (D) Gene expression UMAP plots of genes listed in (B).
Figure 4—figure supplement 3
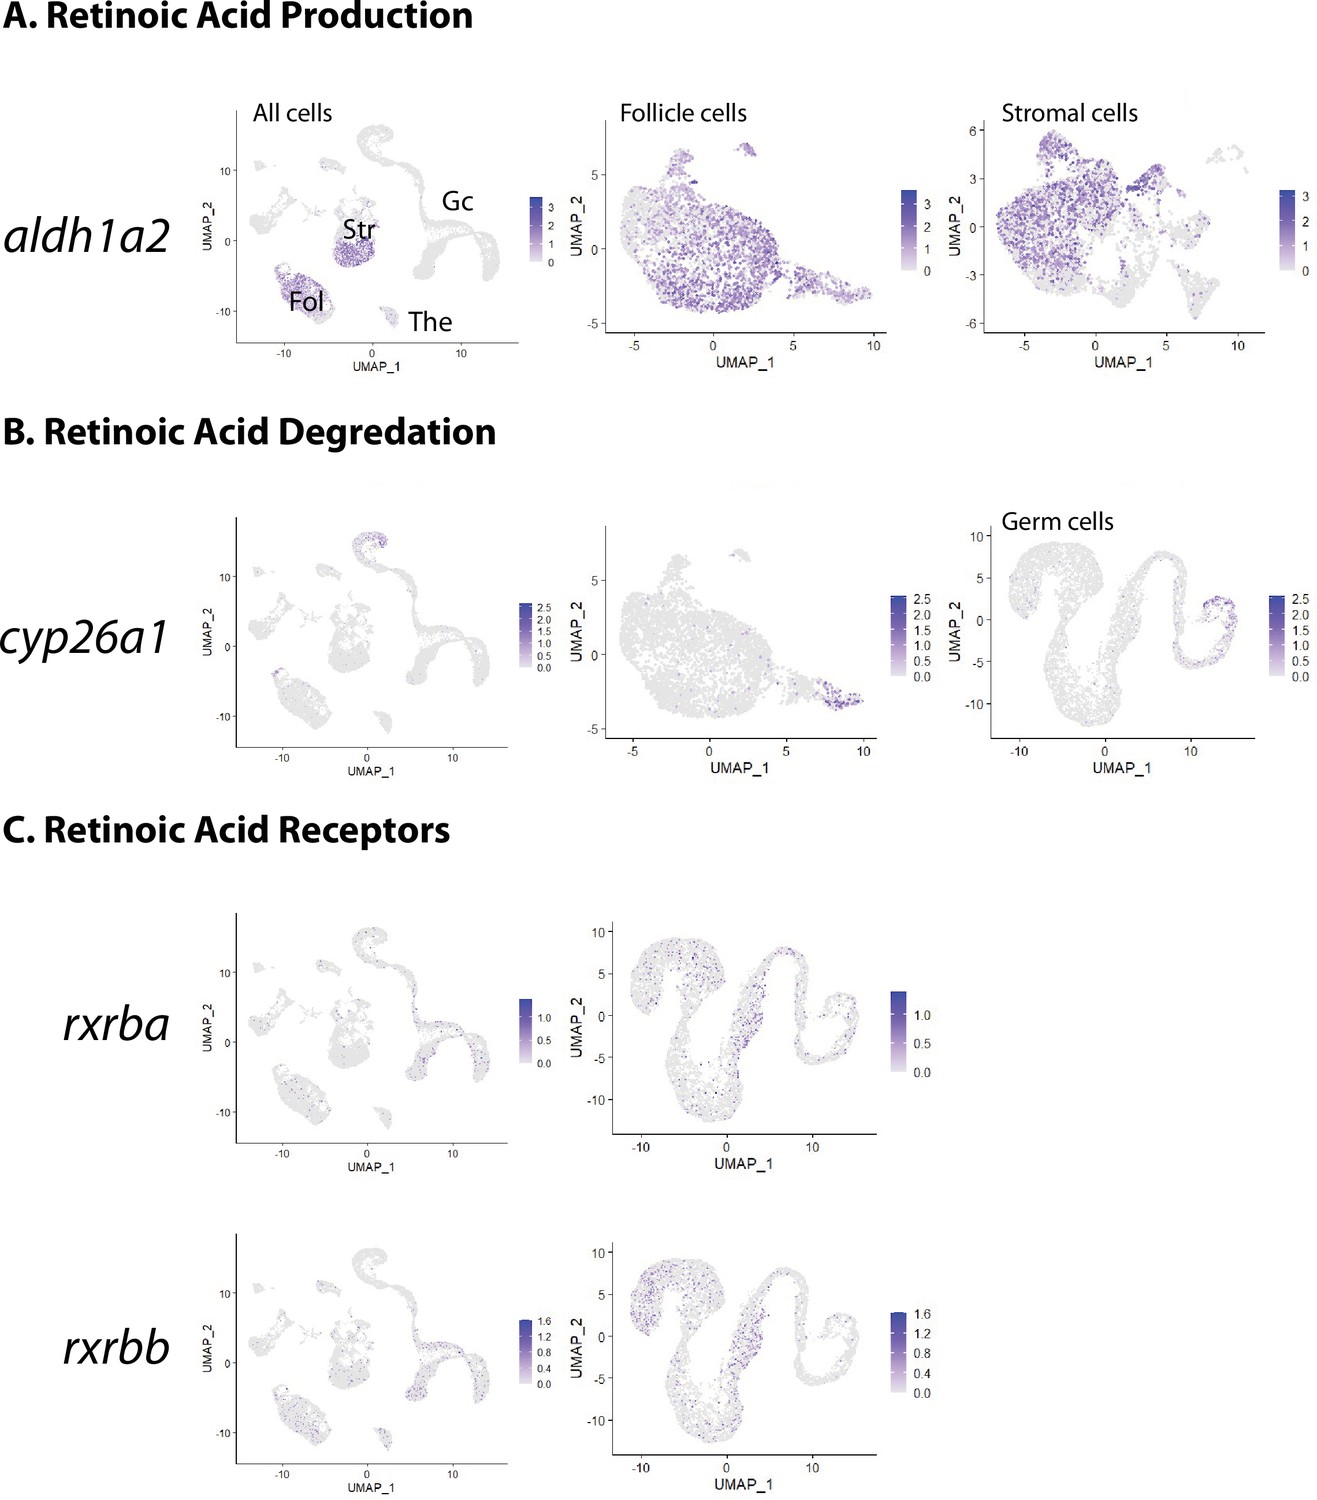
Gene expression uniform manifold approximation and projection (UMAP) plots for genes that function in the retinoic acid signaling pathway.
A. aldh1a2 encodes the last enzyme needed for retinoic acid synthesis. B. cyp26a1 encodes a retinoic acid-degrading enzyme. C. rxrba and rxrbb encode retinoic acid nuclear receptors. Fol, follicle cells; Str, stromal cells; The, theca cells; GC, germ cells.
Figure 5 with 1 supplement
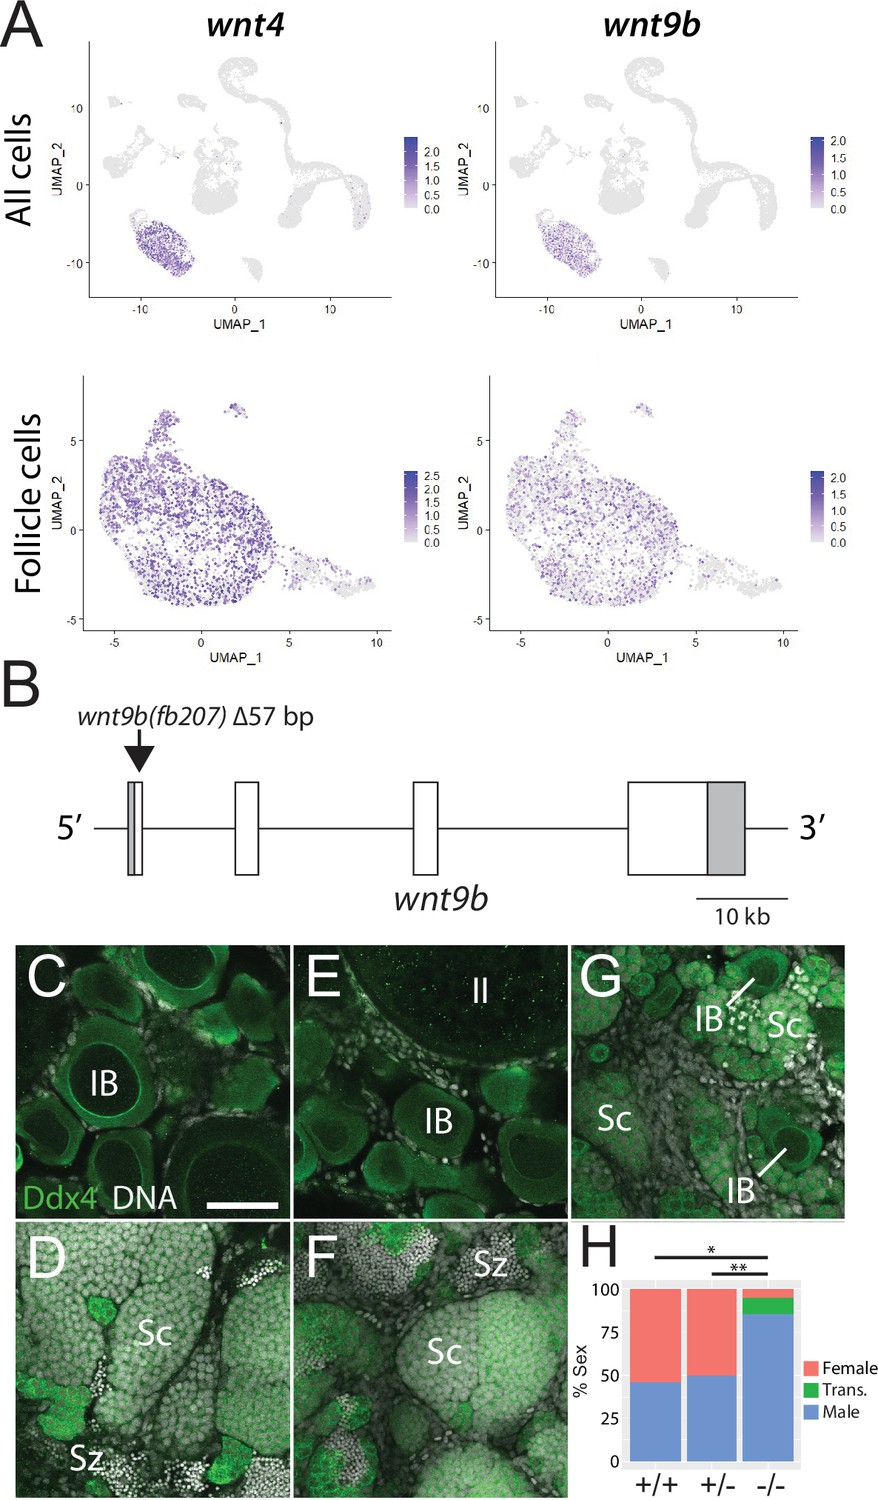
Expression and mutational analysis of wnt9b.
(A) Expression plots of wnt4a and wnt9b show that wnt9b is expressed only in follicle cells, in a pattern nearly identical to wnt4a. (B) Schematic of the wnt9b genomic locus. Boxes are exons, UTR sequences are shaded. Arrow indicates approximate location of the 57 bp deletion in the wnt9b(fb207) allele. (C–G) Representative regions of gonads stained for Ddx4 protein (green) to identify germ cells. wnt9b(+/+) ovaries (C) and testis (D). wnt9b(-/-) ovary (E) and testis (F). (G) wnt9b(-/-) gonad that contains mostly germ cells that have characteristics of spermatogenesis, but also has a few stage IB oocytes. (H) Sex ratios of offspring produced from wnt9b(fb207) heterozygous (+/-) parents (n = 384, N = 3, *p=0.016, **p=0.037). Trans., transitioning; IB, Stage IB oocyte; Sc, spermatocyte; Sz, spermatozoa. Scale bar in (C) for (C–G) 50 µm.
Figure 5—figure supplement 1
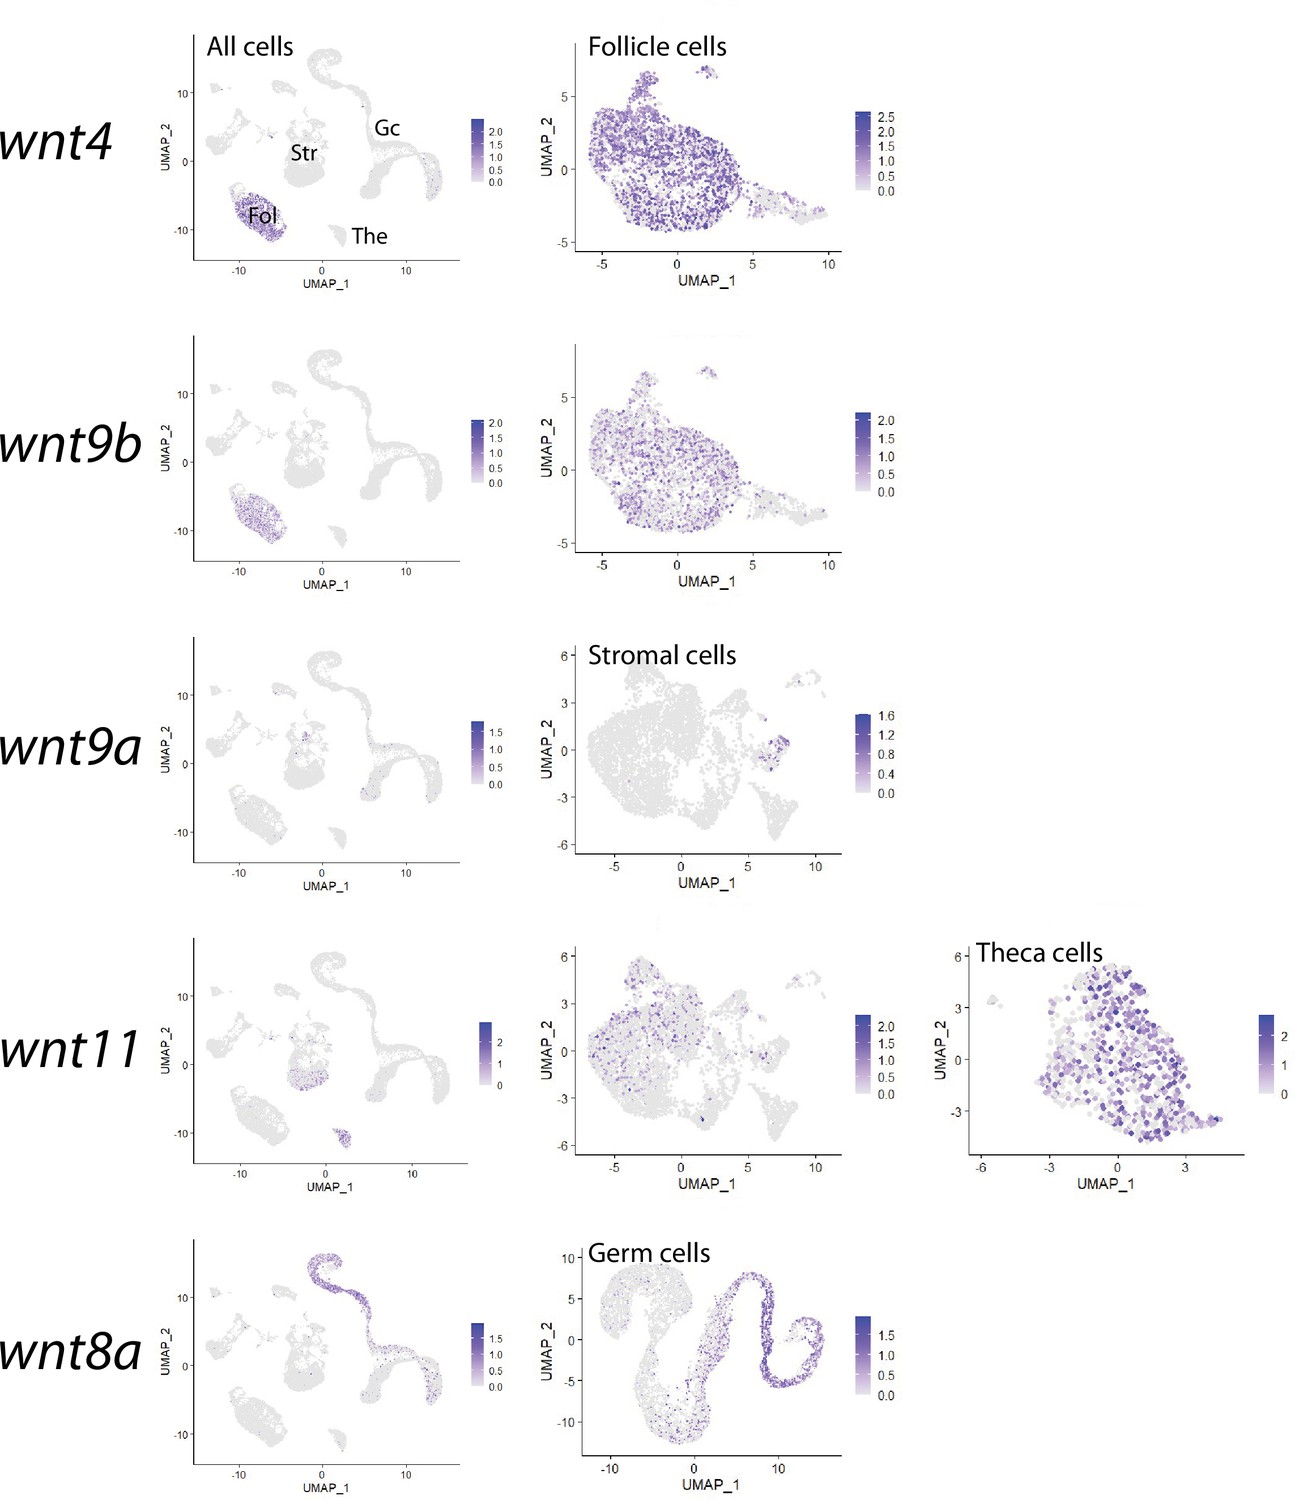
Gene expression uniform manifold approximation and projection (UMAP) plots for Wnt ligand-encoding genes in the 40-day post-fertilization (dpf) ovary.
Fol, follicle cells; Str, stromal cells; The, theca cells; Gc, germ cells.
Figure 6 with 4 supplements
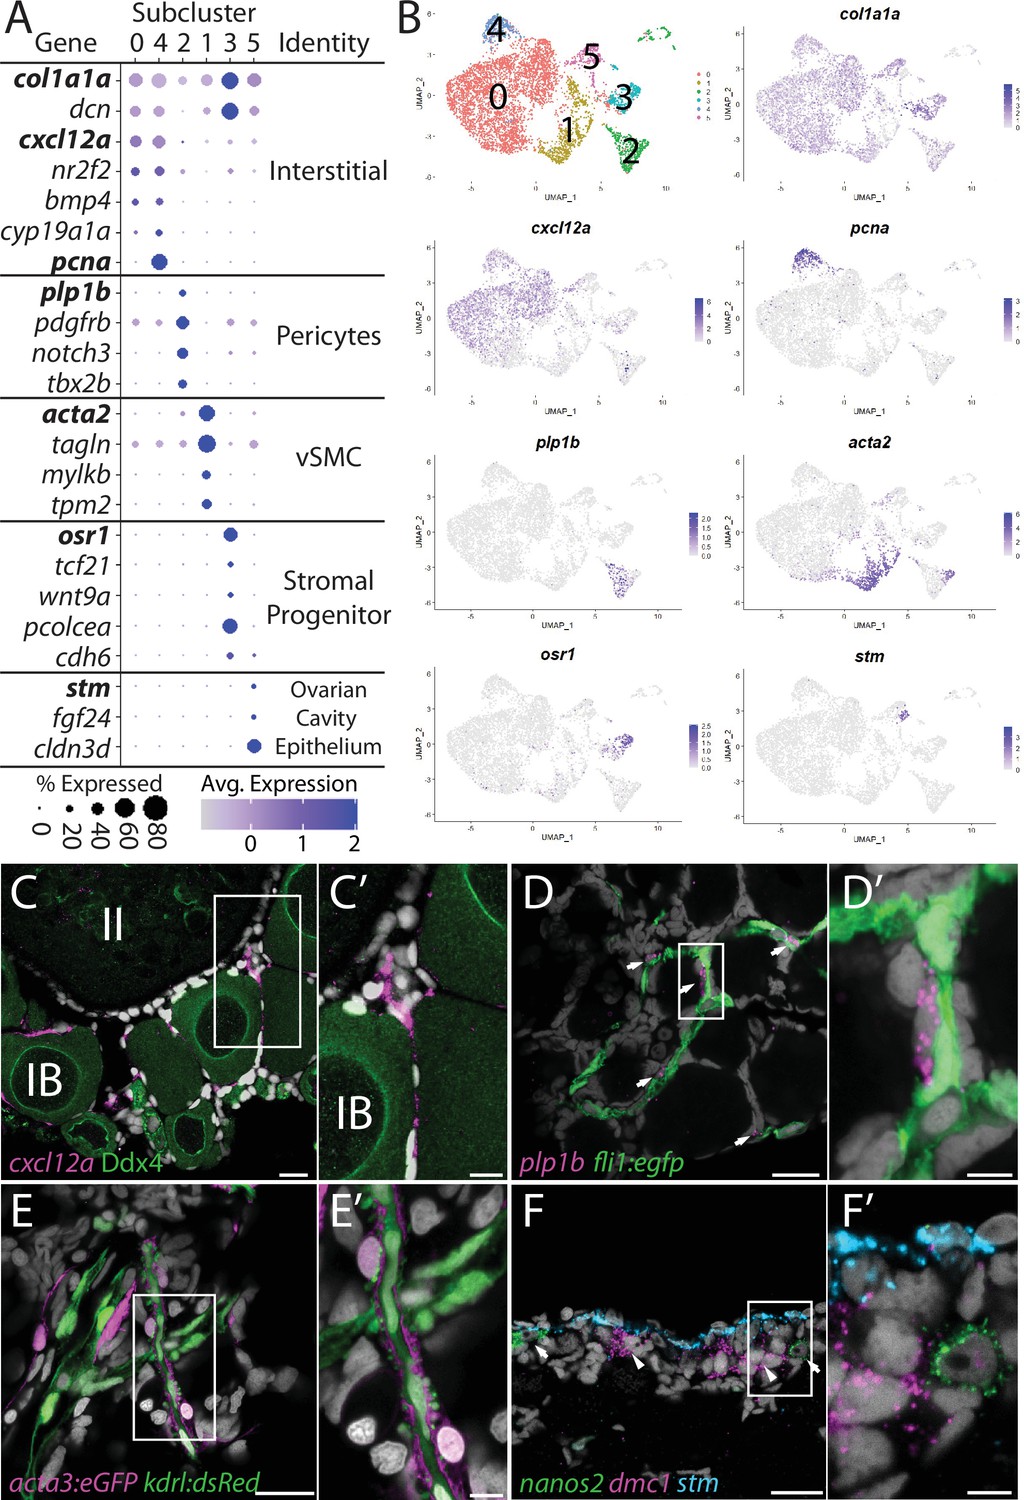
Stromal cell subcluster analysis reveals five main cell subtypes.
(A) Dot plot showing the relative expression of select genes in the stromal cell subclusters. Some genes, like col1a1a, are expressed in all stromal cells, while others, such as stm, are only expressed in a specific subcluster. Uniform manifold approximation and projection (UMAP) plots of genes in bold are shown in (B). Gene expression UMAP plots of select genes. Top-left panel shows cells color-coded by computationally determined cell subtype. Cells expressing the indicated gene are colored purple, and the relative intensity indicates relative expression levels (intensity scale for each plot is on the right). (C–G) Hybridization chain reaction RNA fluorescent in situ hybridization (HCR RNA-FISH) on whole-mount 40-day post-fertilization (dpf) ovaries reveals the location of cell subtypes. In all panels, DNA is gray. (C) cxcl12a-expressing interstitial cells localize around early-stage oocytes (≤stage IB), but not around stage II oocytes. Ddx4 indirect immunofluorescence (green) labels all germ cells. (C’) Higher magnification of the region boxed in (C). (D) plp1b- expression pericytes colocalize with fli1:egfp-expressing blood vessels (green). (D’) Higher magnification of region boxed in (D). (E). acta3:egfp expression vascular smooth muscle cells (red) surround kdrl:dsRed expression blood vessels (green). (E’) Higher magnification of the region boxed in (E). (F) stm (blue)-expressing cells localize to the lateral margin of the ovary and colocalize with nanos2 (green) and dmc1 (pink) germline stem cells and early meiotic cells, respectively. (F’) Higher magnification of the region boxed in (F). Scale bar in (C–E) 20 µm; (C’) 10 µm, (D’, E’, F’) 5 µm. IB, stage IB oocyte; II, stage II oocyte.
Figure 6—figure supplement 1
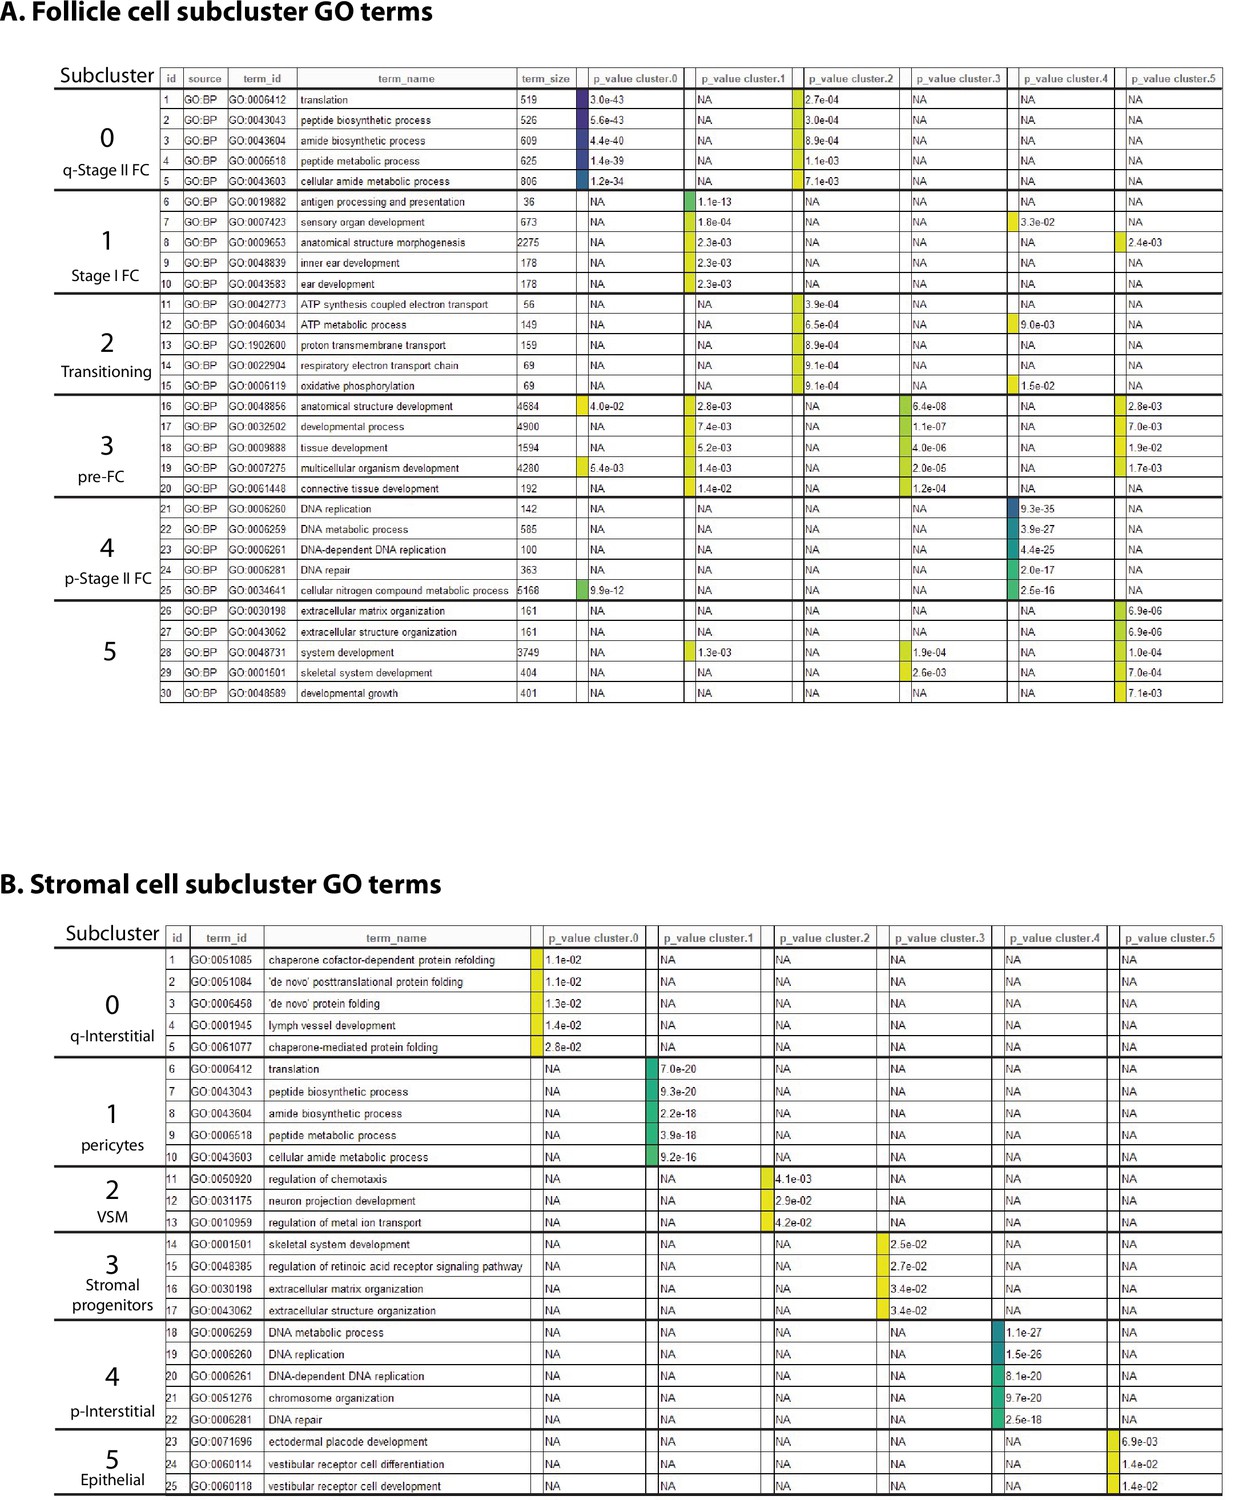
Gene Ontology (GO) terms associated with the follicle and stromal cell subclusters.
(A) Top 5 GO terms associated with individual follicle subclusters. (B) Top GO terms associated with the stromal subclusters. In both (A) and (B), blue indicates a high and yellow indicates low significance.
Figure 6—figure supplement 2
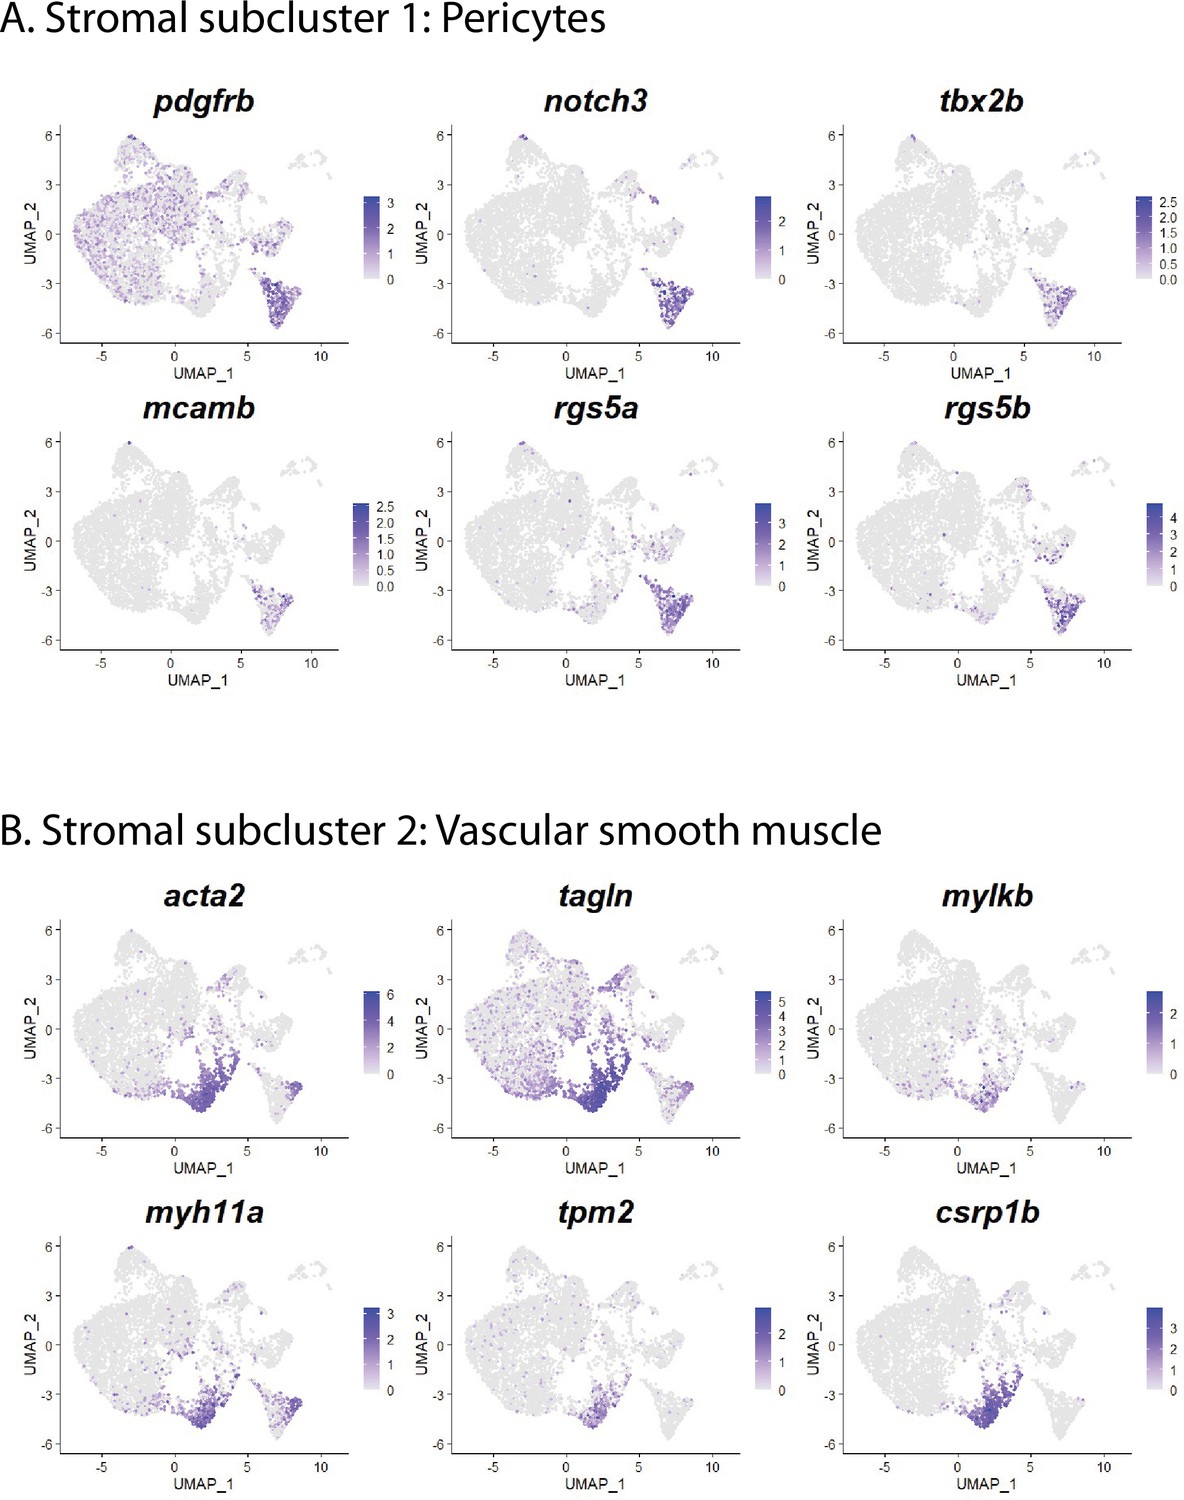
Stromal cell subclusters 1 and 2: pericytes and vascular smooth muscle cells.
(A) Gene expression uniform manifold approximation and projection (UMAP) plots for select genes whose expression is enriched in stromal cell subcluster 1 and are markers of pericytes. (B) Gene expression UMAP plots for select genes whose expression is enriched in stromal cell subcluster 2 and are markers of vascular smooth muscle cells.
Figure 6—figure supplement 3
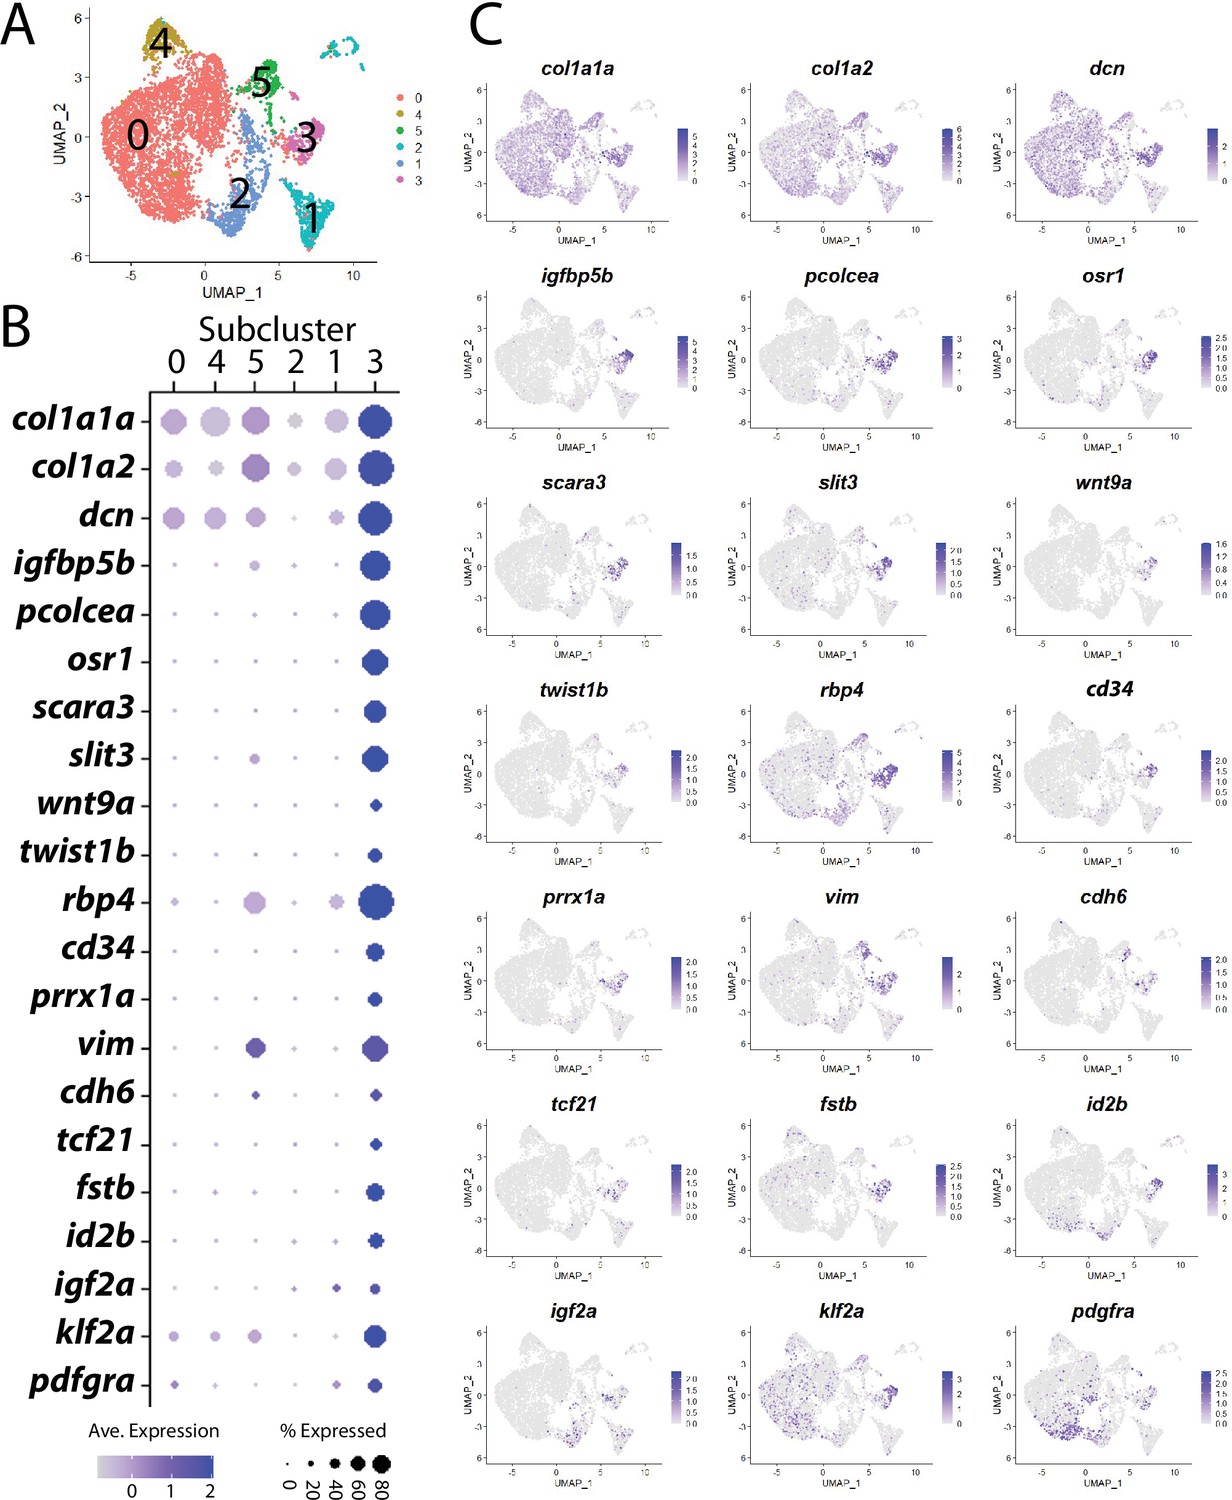
Stromal cell subcluster 3: stromal progenitor cells.
(A) Stromal cell subcluster uniform manifold approximation and projection (UMAP) plot, with cells color-coded by computationally determined cell subtypes. (B) Dot plot showing the relative expression of select genes in stromal cell subclusters that have enriched expression is subcluster 3. (C) UMAP gene expression plot for genes listed in (B). cd34 is annotated as si:dkey-261h17.1 in the dataset.
Figure 6—figure supplement 4
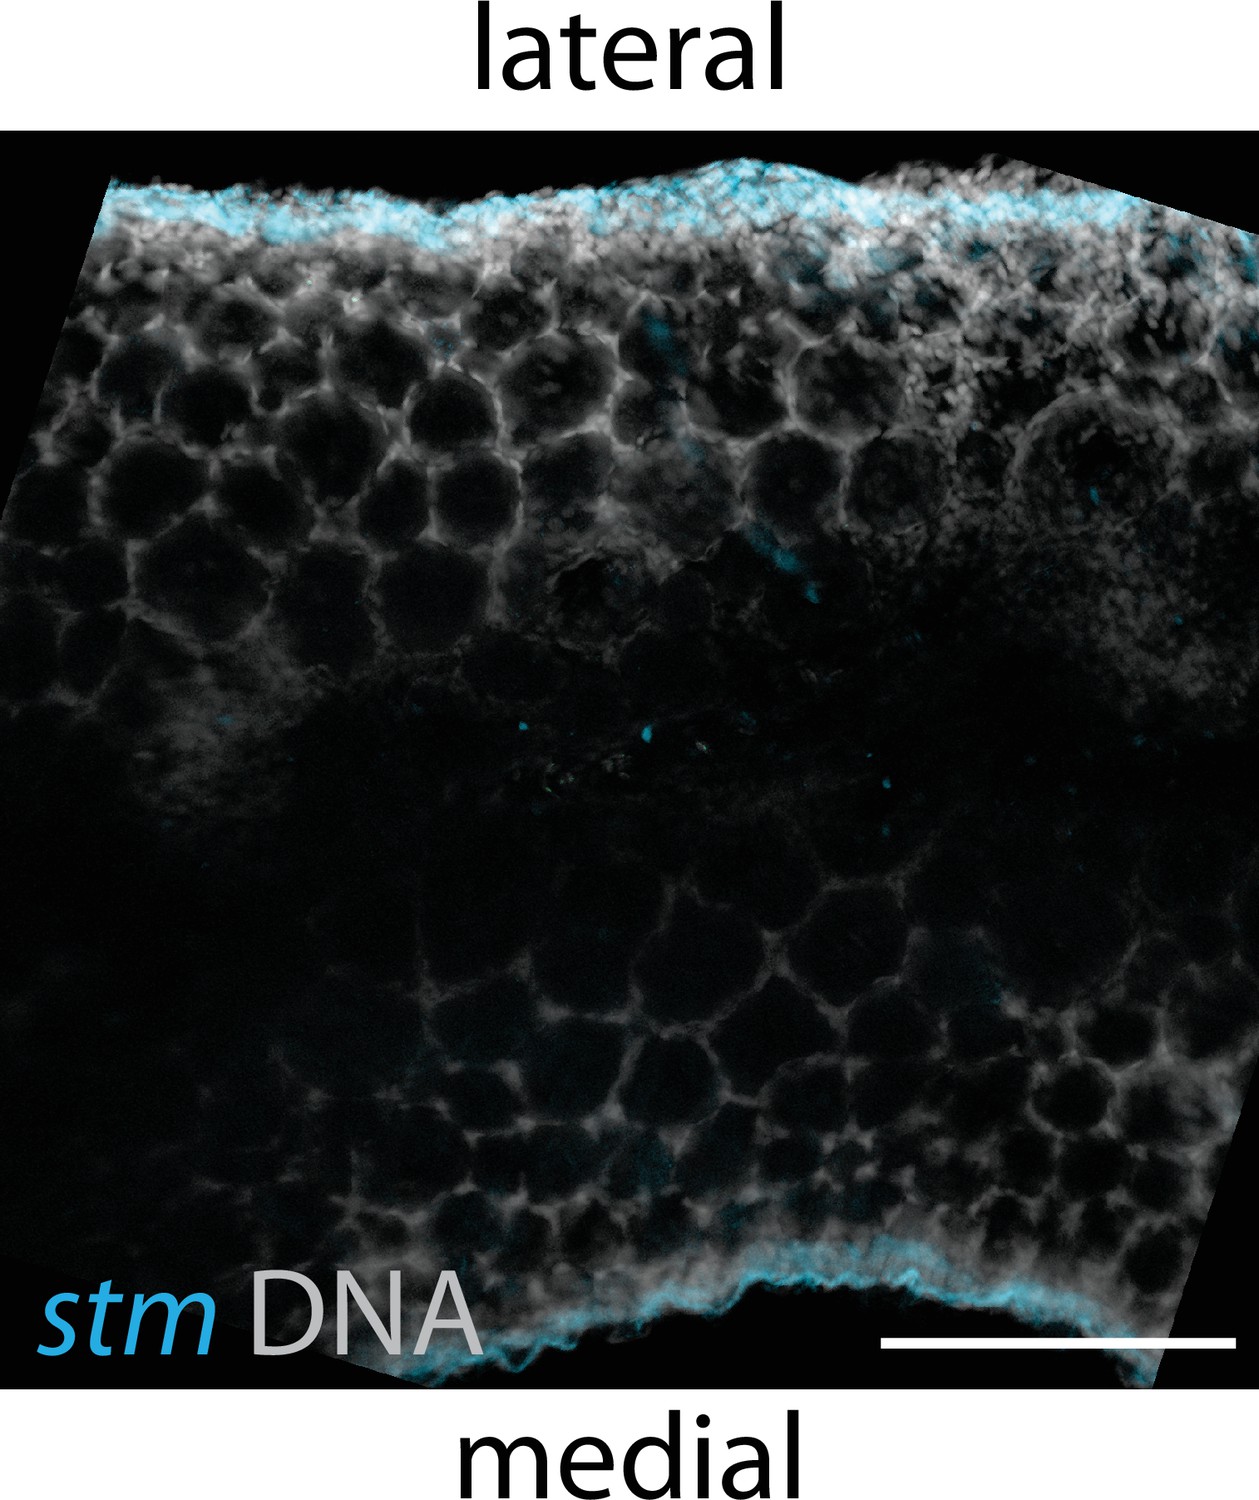
Max projection view of a confocal stack showing stm expression (blue) and DNA (gray) in a 40-day post-fertilization (dpf) ovary.
stm expression is limited to cells that localize to the lateral and medial edges of the ovary. Scale bar, 200 µm.
Figure 7

Stromal cell subcluster 3: ovarian cavity epithelium (OCE).
(A) Gene expression uniform manifold approximation and projection (UMAP) plots for select genes whose expression is enriched in stromal cell subcluster 3. (B) Hybridization chain reaction RNA fluorescent in situ hybridization (HCR RNA-FISH) on transverse sections from a 3-month-old ovary showing that stm (magenta) is expressed in the epithelium that lines the ovarian cavity (OC). DNA is gray. (C) Higher magnification of region boxed in (B) showing that early-stage germ cells localize to the region subjacent to where the OCE is attached to the lateral side of the ovary (arrowhead). (D, E) Histological transverse sections from a 3-month-old ovary showing correlation between where the OCE attaches to the ovary at the lateral (D, E) and medial (F, G) sides, and the presence of premeiotic germ cells, characterized by large, dark staining nucleoli, and early meiotic germ cells, characterized by condensed chromosomes (inset in E). (E) and (F) are higher-magnification views of regions boxed in (D) and (F), respectively. PC, peritoneal cavity; CE, coelomic epithelium; SB, swim bladder; Oo, premeiotic oogonia; Mei, early meiotic germ cell; IB, stage IB oocyte; III, stage III oocyte. Scale bar in (C, E, G) 10 µm; (B) 100 µm; (D) 200 µm; (F) 250 µm.
Figure 8 with 1 supplement
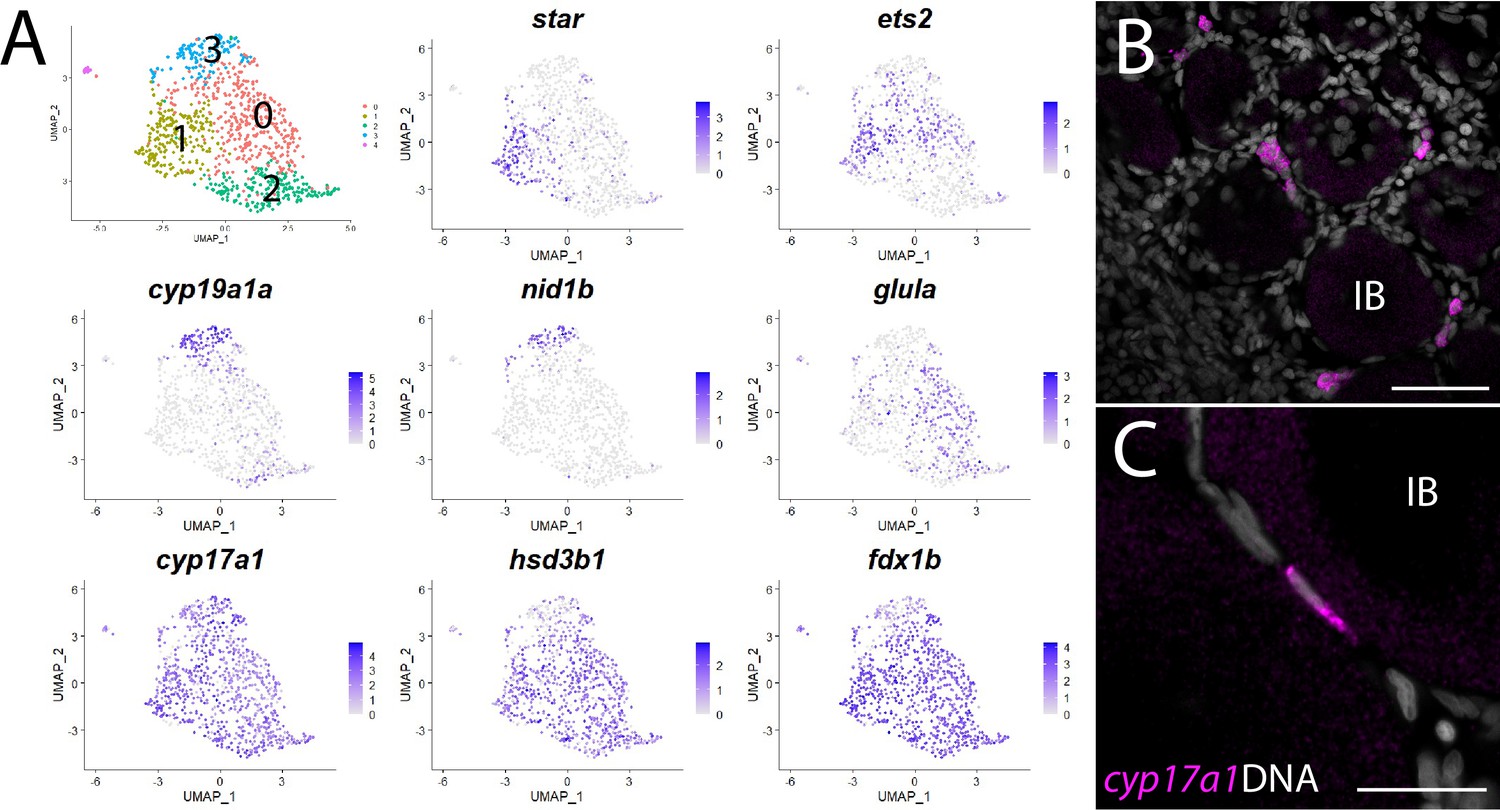
Theca cell subcluster analysis.
(A) Gene expression uniform manifold approximation and projection (UMAP) plots of select genes. Top-left panel shows cells color-coded by computationally determined cell subtype. Cells expressing the indicated gene are colored purple, and the relative intensity indicates relative expression levels (intensity scale for each plot is on the right). (B) Hybridization chain reaction RNA fluorescent in situ hybridization (HCR RNA-FISH) on whole-mount 40-day post-fertilization (dpf) ovaries reveals the location of cyp17a1-expressing theca cells. DNA is gray. (C) Higher magnification of cyp17a1-expressing theca cells. IB, stage IB oocyte. Scale bars in (B) 50 µm and (C) 20 µm.
Figure 8—figure supplement 1
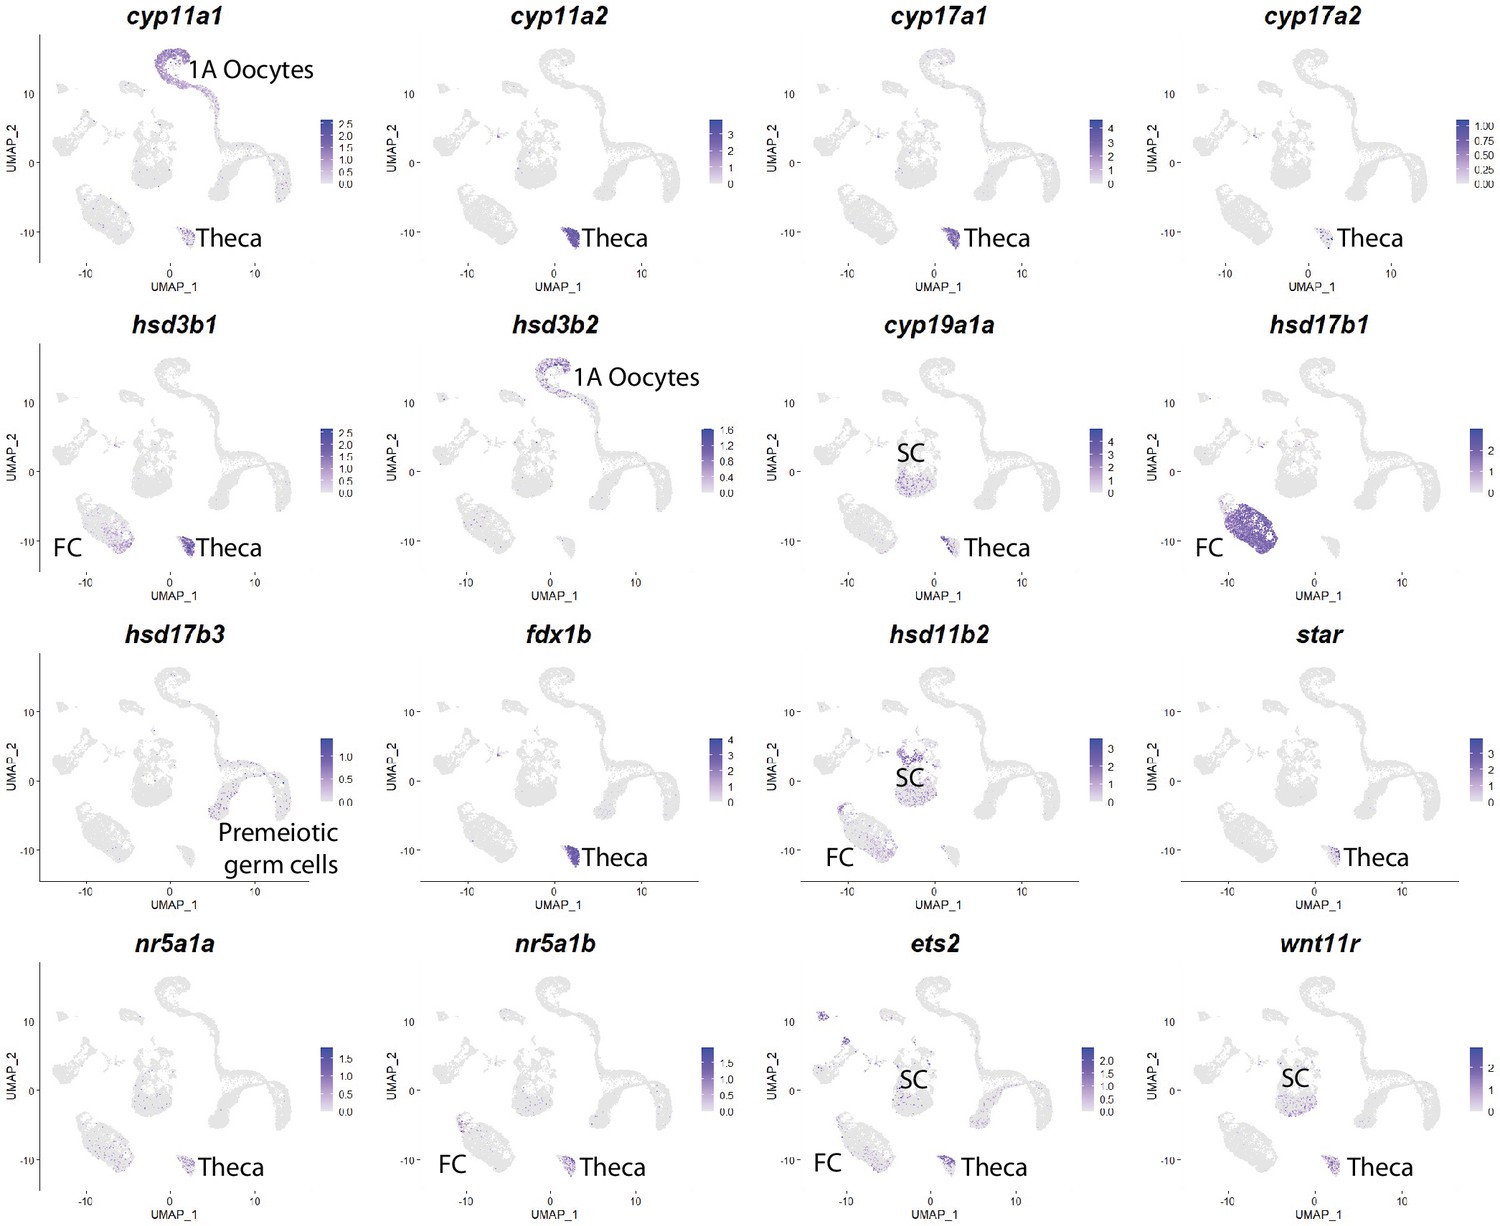
Expression of genes involved in theca cell development and steroid synthesis.
Uniform manifold approximation and projection (UMAP) gene expression plot for orthologs of genes known to be involved in sex steroid synthesis or theca cell development, mapped onto all cells. Fc, follicle cell; Sc, stromal cell.
Figure 9 with 1 supplement
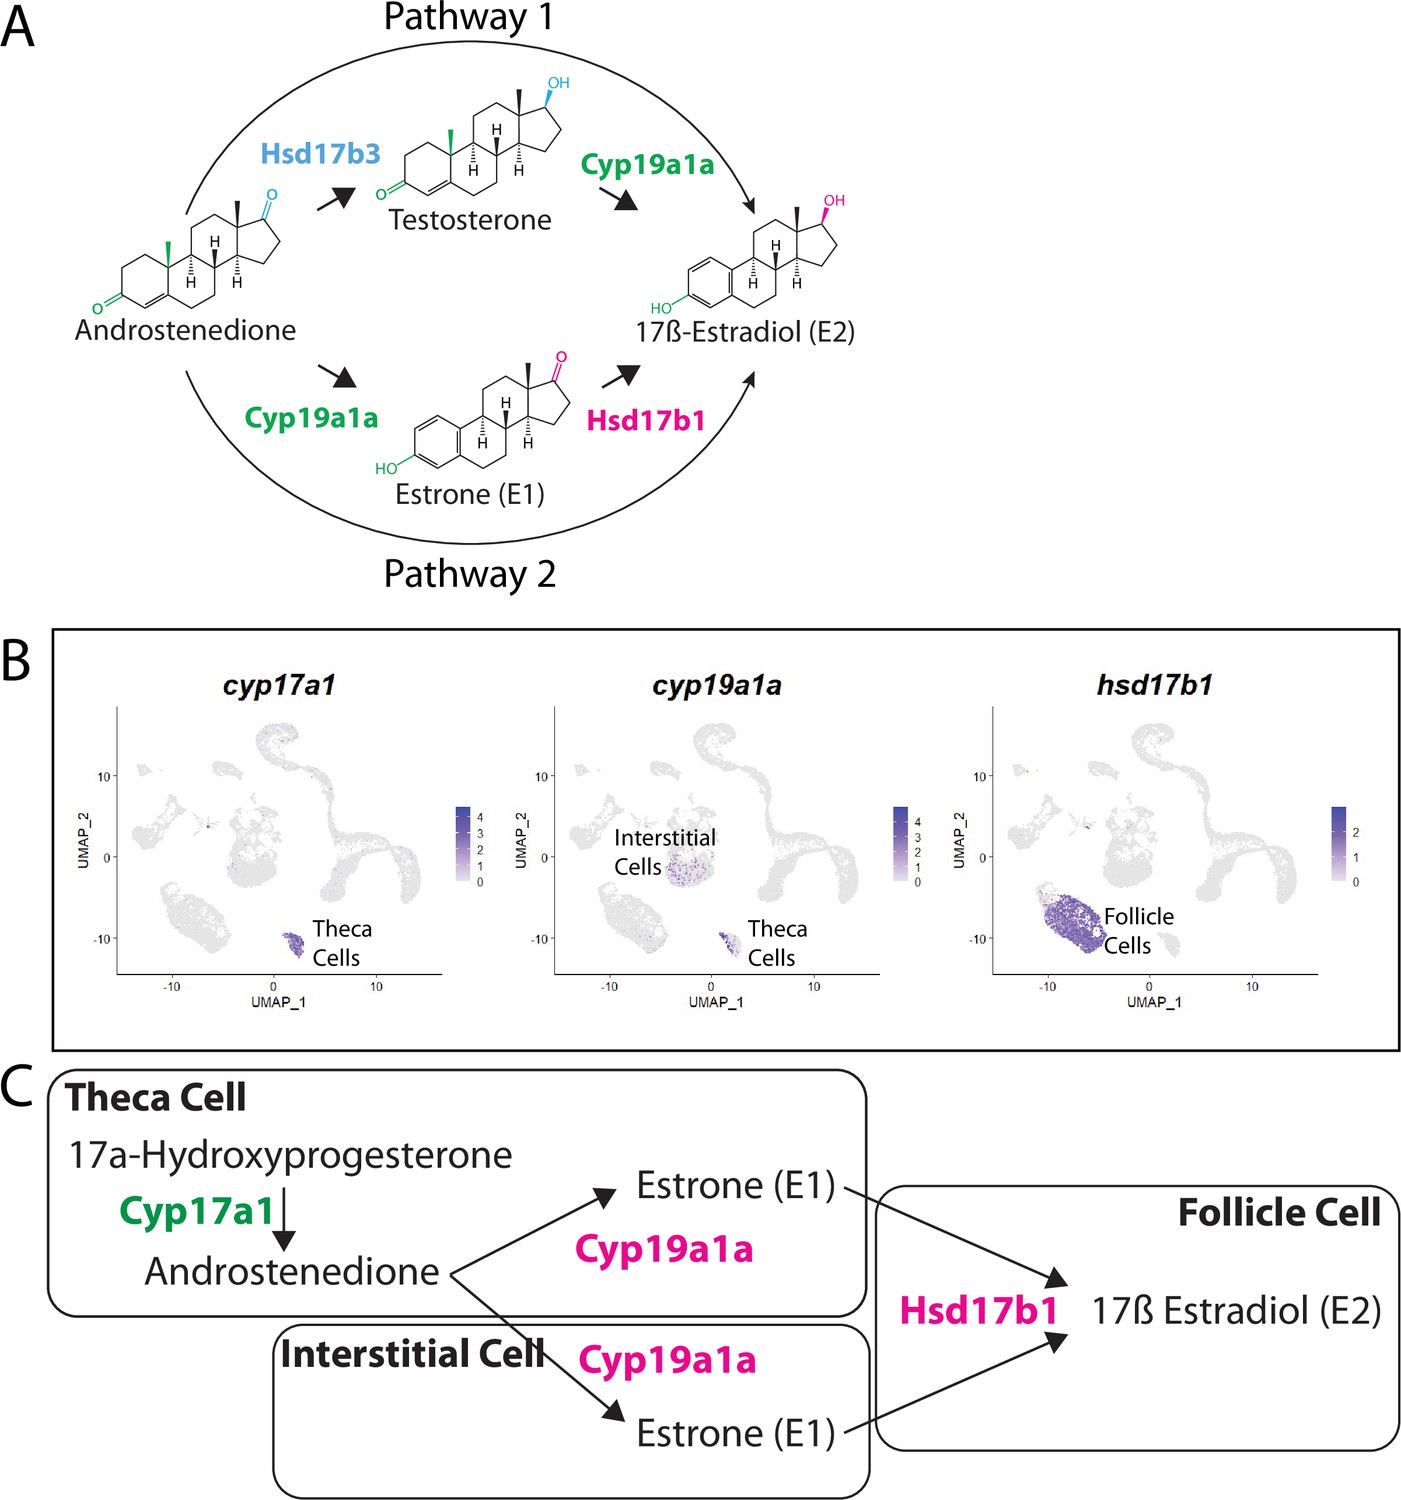
Pathway for 17ß-estradiol (E2) synthesis in the zebrafish ovary.
(A) Two possible pathways for E2 synthesis starting with androstenedione. Colors correspond to the region of the molecules being modified and to the enzyme that catalyzes the modification. (B) Gene expression uniform manifold approximation and projection (UMAP) plots of select genes. Top-left panel shows cells color-coded by computationally determined cell subtype. Cells expressing the indicated gene are colored purple, and the relative intensity indicates relative expression levels (intensity scale for each plot is on the right). (C) Proposed pathway for E2 synthesis in the zebrafish ovary, starting with the 17a-hydroxyprogesterone intermediate precursor, together with the cell types where each reaction occurs.
Figure 9—figure supplement 1
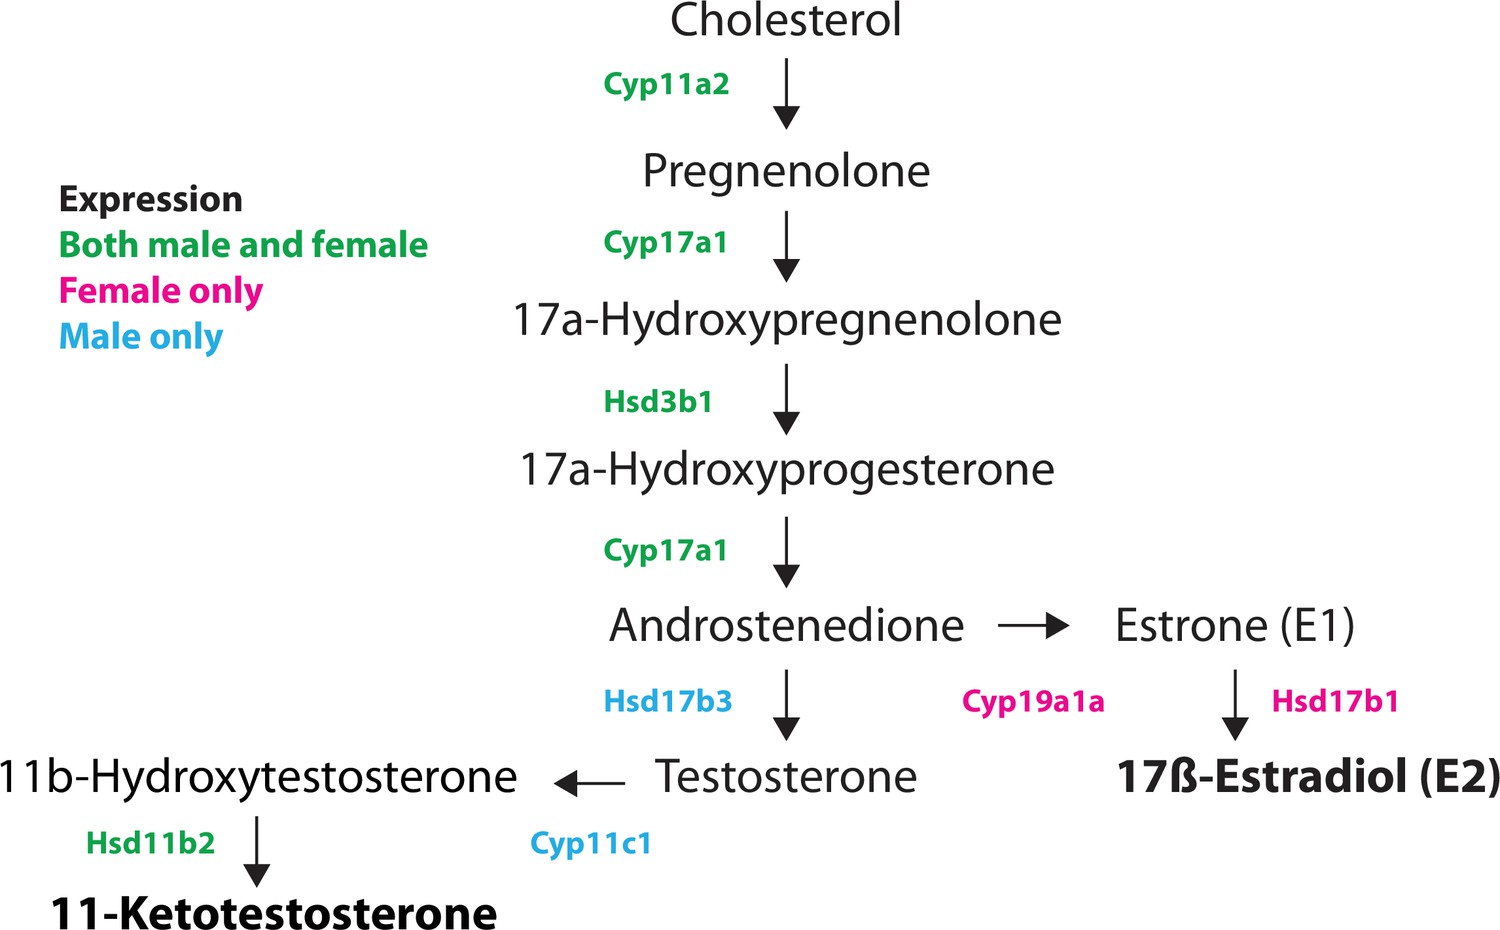
Pathway for sex hormone synthesis in the juvenile zebrafish.
Diagram shows a likely pathway for the synthesis of the two main sex steroids in zebrafish, 17ß-estradiol (E2; female) and 11-ketotestosterone (male), starting from cholesterol. Enzymes that catalyze each step are shown, with color indicating sex-specific expression. For example, Cyp17a1 is expressed in both males and females, while Cyp19a1a and Hsd17b1 are female-specific while Hsd17b3 and Cyp11c1 are male-specific.
Tables
Key resources table
| Reagent type (species) or resource | Designation | Source or reference | Identifiers | Additional information |
|---|---|---|---|---|
| Strain, strain background (Danio rerio) | AB (wild-type) | University of Oregon, Eugene | ZIRC Cat ID: ZL1 | Originally obtained from the University of Oregon, Eugene |
| Genetic reagent (D. rerio) | Tg(piwili1:egfp)uc02 | PMID:20737503 | ||
| Genetic reagent (D. rerio) | Tg(fli1:egfp)y1 | PMID:12167406 | ZIRC Cat ID: ZL1085 | |
| Genetic reagent (D. rerio) | Tg(kdrl:dsRed)pd27 | PMID:21397850 | ZIRC Cat ID: ZL4589 | |
| Genetic reagent (D. rerio) | Tg(acta2:eGFP)ca7 | PMID:24594685 | ZIRC Cat ID: ZL9948 | |
| Genetic reagent (D. rerio) | foxl2l(uc91) | This paper | CRISPR/Cas9-induced in-frame insertion of V2A-eGFP | |
| Genetic reagent (D. rerio) | wnt9b(fb209) | This paper | CRISPER/Cas9-induced deletion mutation | |
| Gene (D. rerio) | foxl2l | PMID:28193729 | ZDB-GENE-081022-71 | |
| Gene (D. rerio) | wnt9b | PMID:17948314 | ZDB-GENE-080201-1 | |
| Recombinant DNA reagent | pGTag-foxl2l-eGFP-ßactin (plasmid) | This paper | Foxl2l version of pGTag-eGFP-ßactin | |
| Antibody | Anti-Ddx4 (chicken polyclonal) | PMID:30653507 | IF (1:1500) | |
| Antibody | Anti-Ddx4 (rabbit polyclonal) | PMID:10811828 | IF (1:1500) | |
| Chemical compound, drug | Type II collagenase | Worthington | Cat# NC9870009 | |
| Chemical compound, drug | Trypsin | Worthington | Cat# LS003708 | |
| Chemical compound, drug | Trypsin inhibitor | MP Biomedicals | Cat# 100612 | |
| Chemical compound, drug | Collagenase I | Sigma-Aldrich | Cat# C0130 | |
| Chemical compound, drug | Collagenase II | Sigma-Aldrich | Cat# C6885 | |
| Chemical compound, drug | Hyaluronidase | Sigma-Aldrich | Cat# H4272 | |
| Chemical compound, drug | 10X TrypLE (trypsin) | Thermo Fisher | Cat# A1217701 | |
| Commercial assay or kit | Chromium Single-cell 3’ Library and Gel Bead kit V3 | 10X Genomics | ||
| Software, algorithm | Cell Ranger (v3.0.2) | 10X Genomics | ||
| Software, algorithm | SoupX (v0.3.1) | PMID:33367645 | ||
| Software, algorithm | DoubletFinder (v2.0.2) | PMID:30954475 | ||
| Software, algorithm | Seurat (v3.1.0) | PMID:31178118 | ||
| Software, algorithm | Monocle 3 (v0.1.3) | PMID:30787437 | ||
| Software, algorithm | MEME (v5.1.0) | PMID:25953851 |
Additional files
-
Supplementary file 1
Gene expression tables from the whole dataset.
- https://cdn.elifesciences.org/articles/76014/elife-76014-supp1-v2.zip
-
Supplementary file 2
Gene expression tables from reclustered germ cells.
- https://cdn.elifesciences.org/articles/76014/elife-76014-supp2-v2.zip
-
Supplementary file 3
Gene expression tables from the reclustered follicle cells.
- https://cdn.elifesciences.org/articles/76014/elife-76014-supp3-v2.xlsx
-
Supplementary file 4
Gene expression tables from the reclustered stage 1A follicle cells and pre-follicle cells.
- https://cdn.elifesciences.org/articles/76014/elife-76014-supp4-v2.xlsx
-
Supplementary file 5
Gene expression tables from the reclustered stromal cells.
- https://cdn.elifesciences.org/articles/76014/elife-76014-supp5-v2.xlsx
-
Supplementary file 6
Gene expression tables from the reclustered theca cells.
- https://cdn.elifesciences.org/articles/76014/elife-76014-supp6-v2.xlsx
-
Transparent reporting form
- https://cdn.elifesciences.org/articles/76014/elife-76014-transrepform1-v2.pdf
Download links
A two-part list of links to download the article, or parts of the article, in various formats.
Downloads (link to download the article as PDF)
Open citations (links to open the citations from this article in various online reference manager services)
Cite this article (links to download the citations from this article in formats compatible with various reference manager tools)
Single-cell transcriptome reveals insights into the development and function of the zebrafish ovary
eLife 11:e76014.
https://doi.org/10.7554/eLife.76014


