Non-uniform distribution of dendritic nonlinearities differentially engages thalamostriatal and corticostriatal inputs onto cholinergic interneurons
- Department of Medical Neurobiology, Institute of Medical Research Israel – Canada, The Faculty of Medicine, Israel
- Edmond and Lily Safra Center for Brain Sciences, The Hebrew University of Jerusalem, Israel
- Department of Neurosurgery, Hadassah Medical Center, Israel
Figures
Figure 1
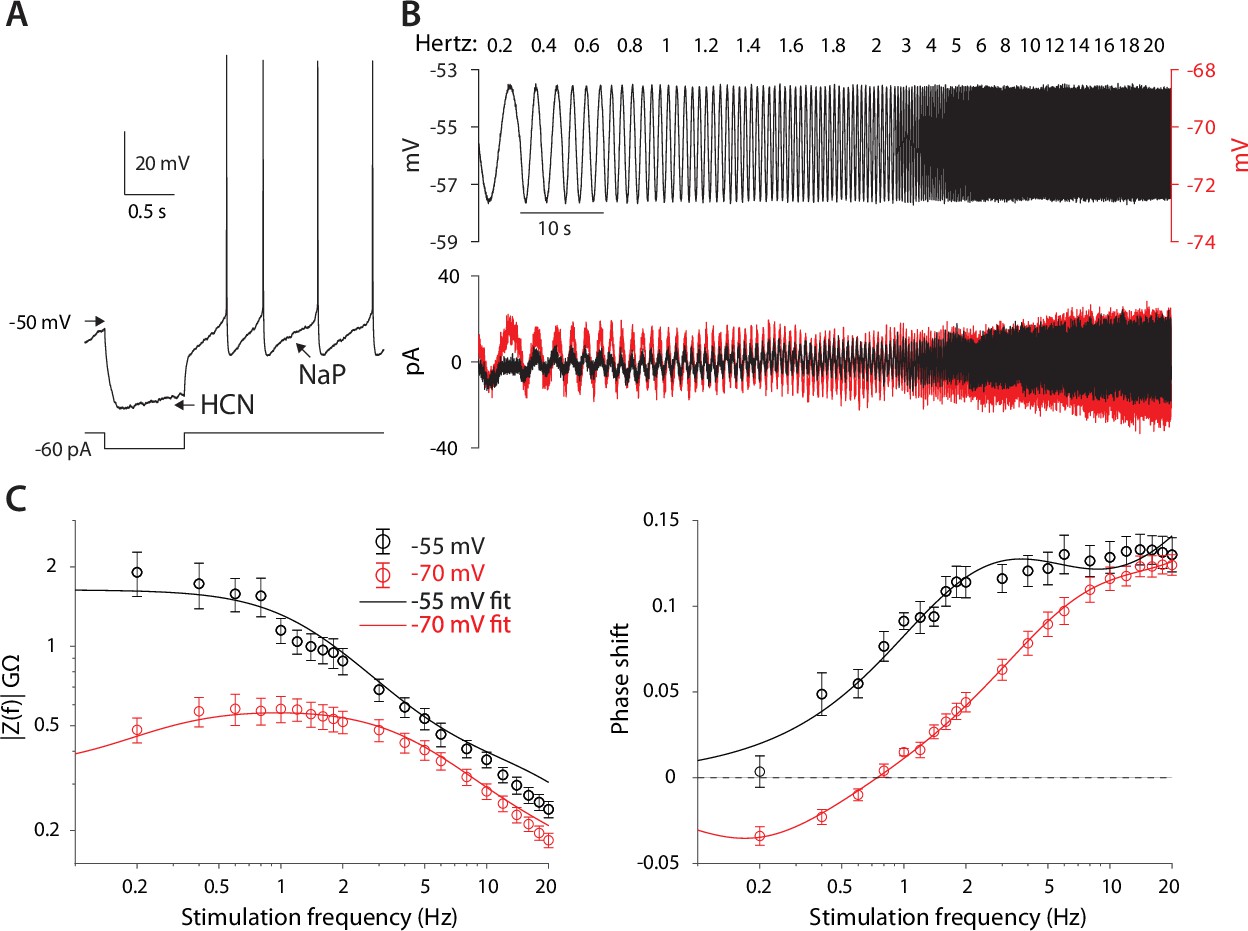
CIN membranes exhibit voltage-dependent quasi-linear properties.
(A) CINs exhibit a voltage sag due to HCN currents, and autonomous pacemaking due to NaP currents. (B) Application of 2 mV sinusoidal voltage commands to the soma, of increasing frequencies, elicits a current response that is voltage dependent (black trace, –55 mV; red trace, –70 mV). (C) Estimation of the impedance (left) and phase shift (right) show that at –55 mV, CINs exhibit an amplified impedance and that at –70 mV, CINs exhibit a resonance (non-monotonic impedance and negative phase delays). Solid lines are parameter fits for up to a scale factor (left), and phase shift, (right, see Equation 5).
Figure 2
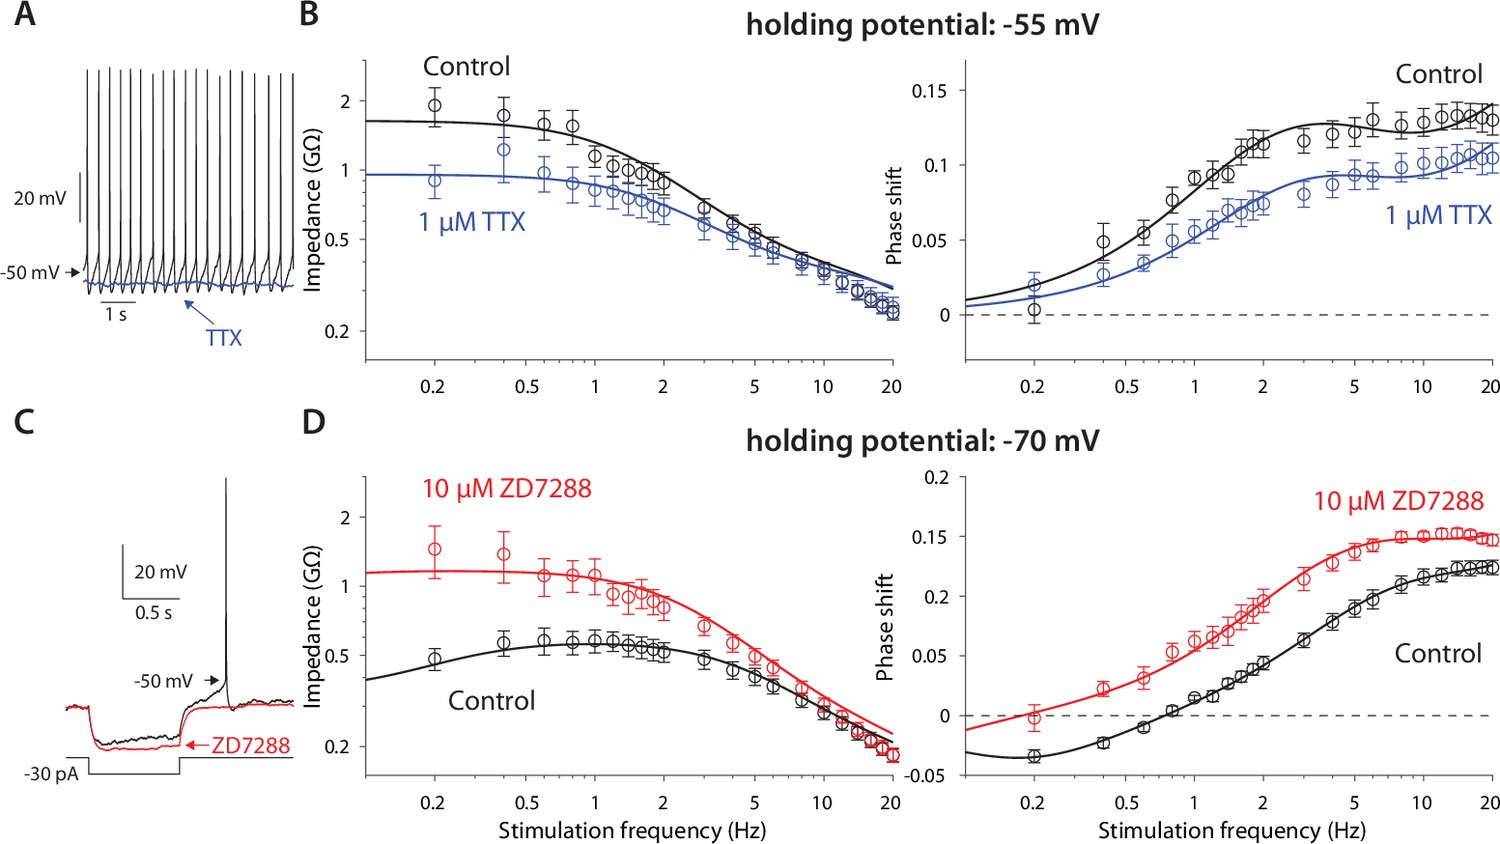
Amplification is caused by NaP currents, whereas resonance is caused by HCN currents.
(A) TTX (blue) prevents autonomous spiking (black). (B) TTX prevents amplification of the impedance (left), and reduces the phase shift (right). (C) ZD7288 (red) abolishes the voltage sag (black). (D) ZD7288 abolishes the resonance peak in the impedance, and the negative phase shifts in the subhertz range. Solid lines are parameter fits as in Figure 1.
Figure 3 with 2 supplements
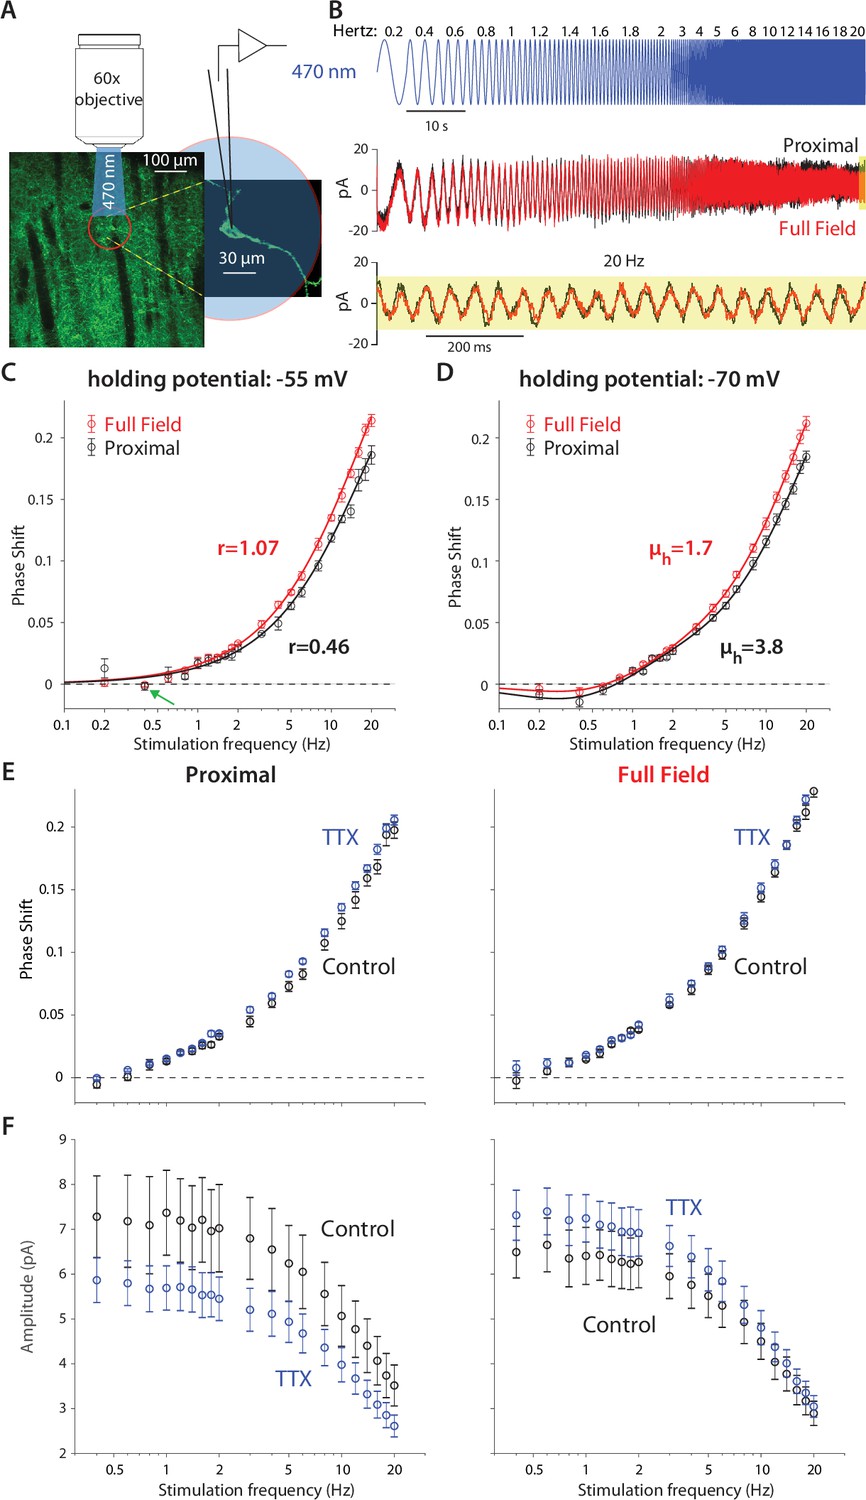
Optogenetic interrogation of the quasi-linear properties of CIN dendrites indicates that dendritic nonlinearities are more prominent proximally.
(A) A CIN in a sagittal slice from ChAT-ChR2 mouse is patch-clamped in the whole-cell mode while either a small proximal region around the soma or the full-field are illuminated with a sinusoidally modulated 470 nm LED. (B) The current response to the proximal (black) and full-field (red) illumination differ, with the phase of the full-field illumination right-shifted at the higher frequencies (20 Hz is highlighted in yellow). (C) Phase shifts at –55 mV holding potential, calculated for proximal (black) and full-field illumination (red). A tendency towards negative phase shifts is present at 0.4 Hz (green arrow). Fitting the passive model at –55 mV demonstrated that the effective range of illumination (r) is larger for the full field fit (Equation 2). (D) Phase shifts at –70 mV holding potential, exhibit a negative phase shift, and the resonance parameter (µh) is smaller for the full field fit, as is the magnitude of the amplification parameter (µn, see main text). The elevation in these parameters’ magnitudes when illuminating proximally relative to full-field suggests that the surface densities of NaP and HCN currents are higher proximally. (E) Phase response for proximal (left) and full-field illumination (right) in TTX at –55 mV. (F) Amplitude response for proximal (left) and full-field illumination (right) at –55 mV reveals an opposite effect of TTX.
Figure 3—figure supplement 1
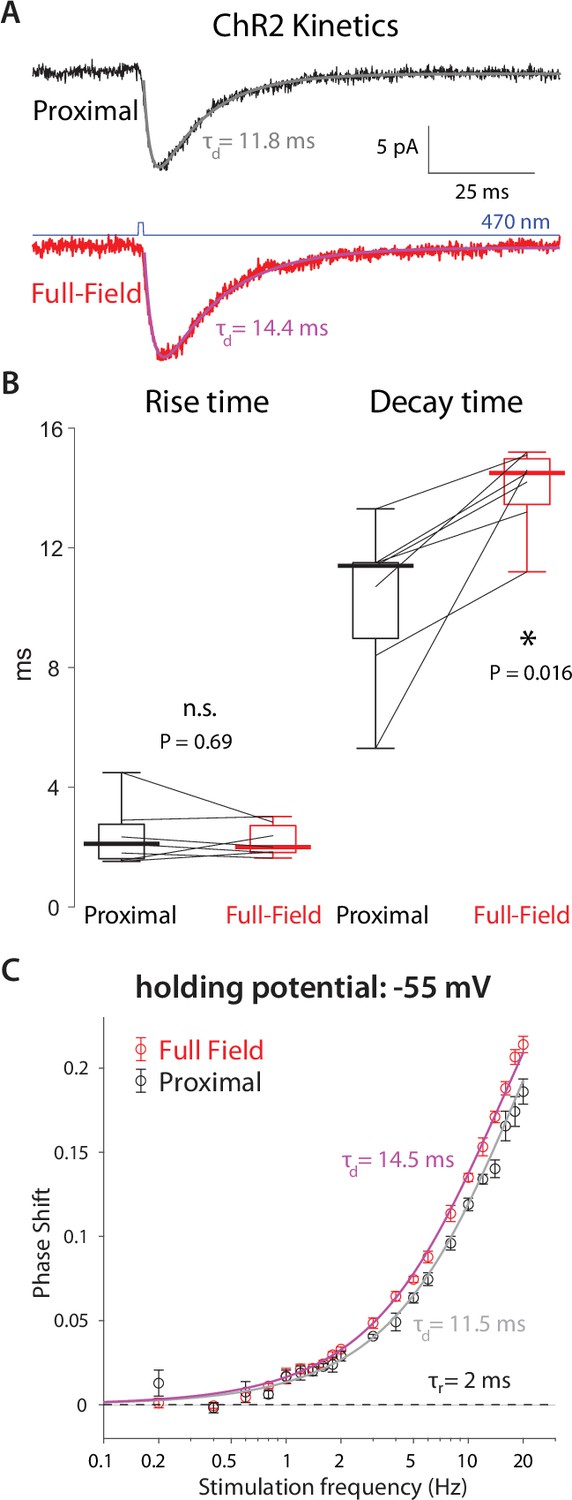
High-frequency phase delays in response to optogenetic activation are attributable to ChR2 kinetics and dendritic delays.
(A) Mean somatic current responses to a 1 ms-long proximal (black, alpha-function fit in gray) and full-field (red, fit in magenta) 470 nm illumination. (B) Distributions of rise and decay time constants (n=7 CINs, N=3 mice) demonstrate that the decay time constant was significantly larger by approximately 3 ms for the full-field illumination, due to dendritic delays. (C) Phase delays of an alpha function with the observed time constants fit the empirical phased delays observed at –55 mV.
Figure 3—figure supplement 2
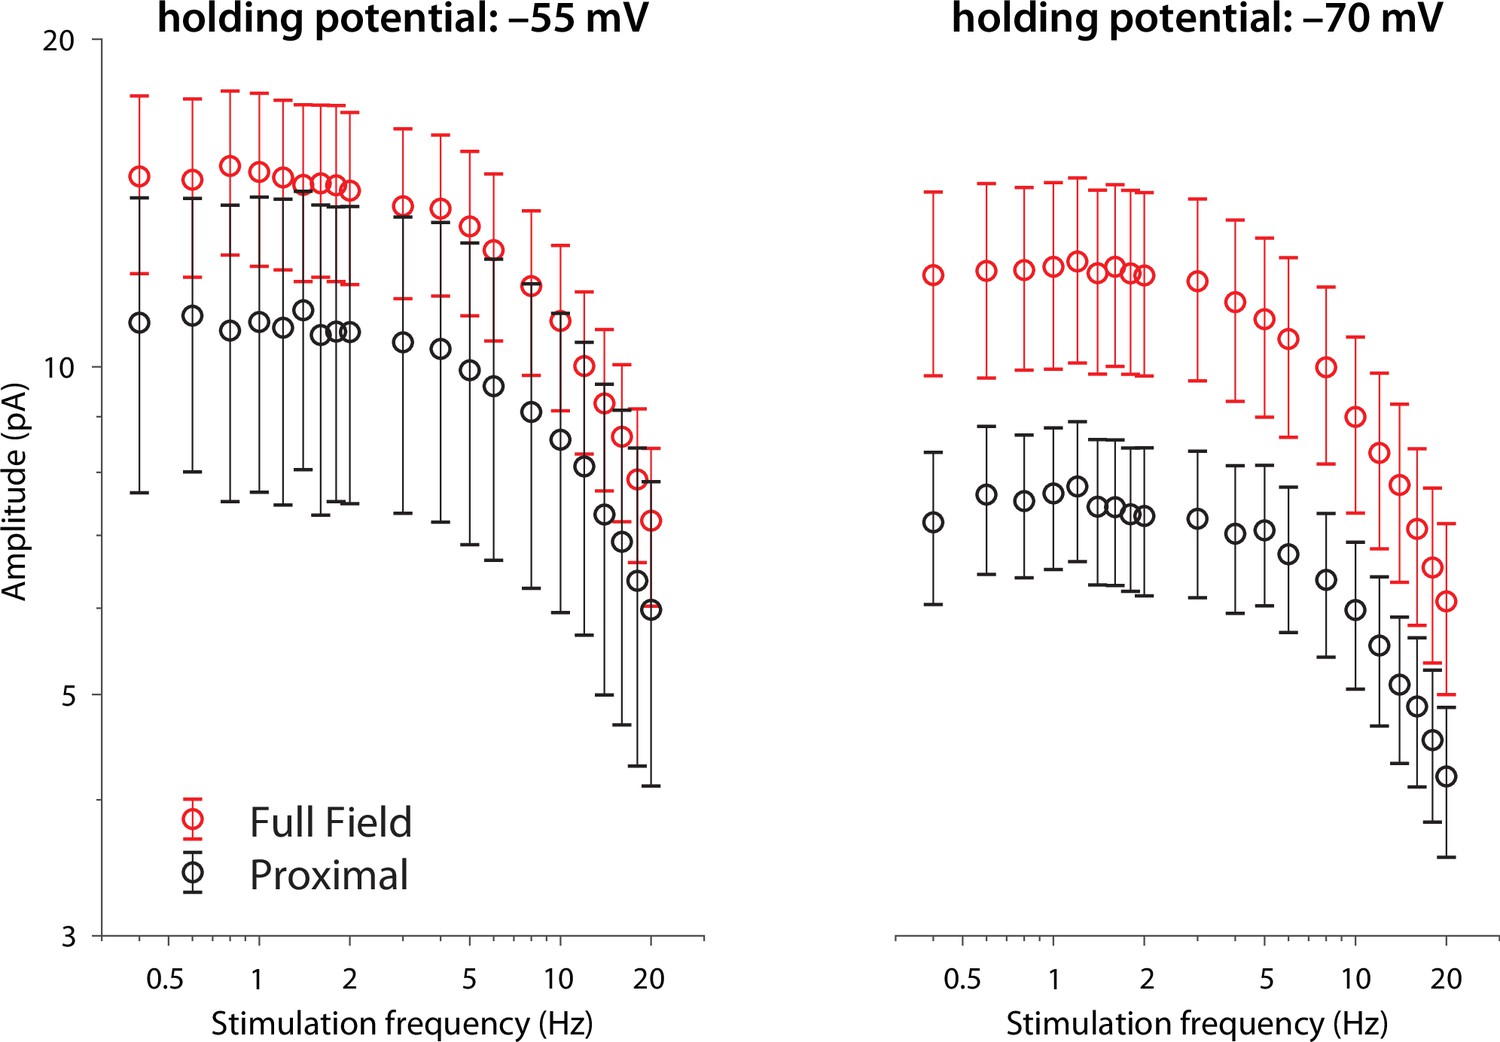
Amplitude responses to proximal (black) and full-field (red) illumination at the two holding potentials.
While the curves at –70 mV hint at the presence of a low frequency resonance, the large error bars provide minimal constraints to model fits.
Figure 4
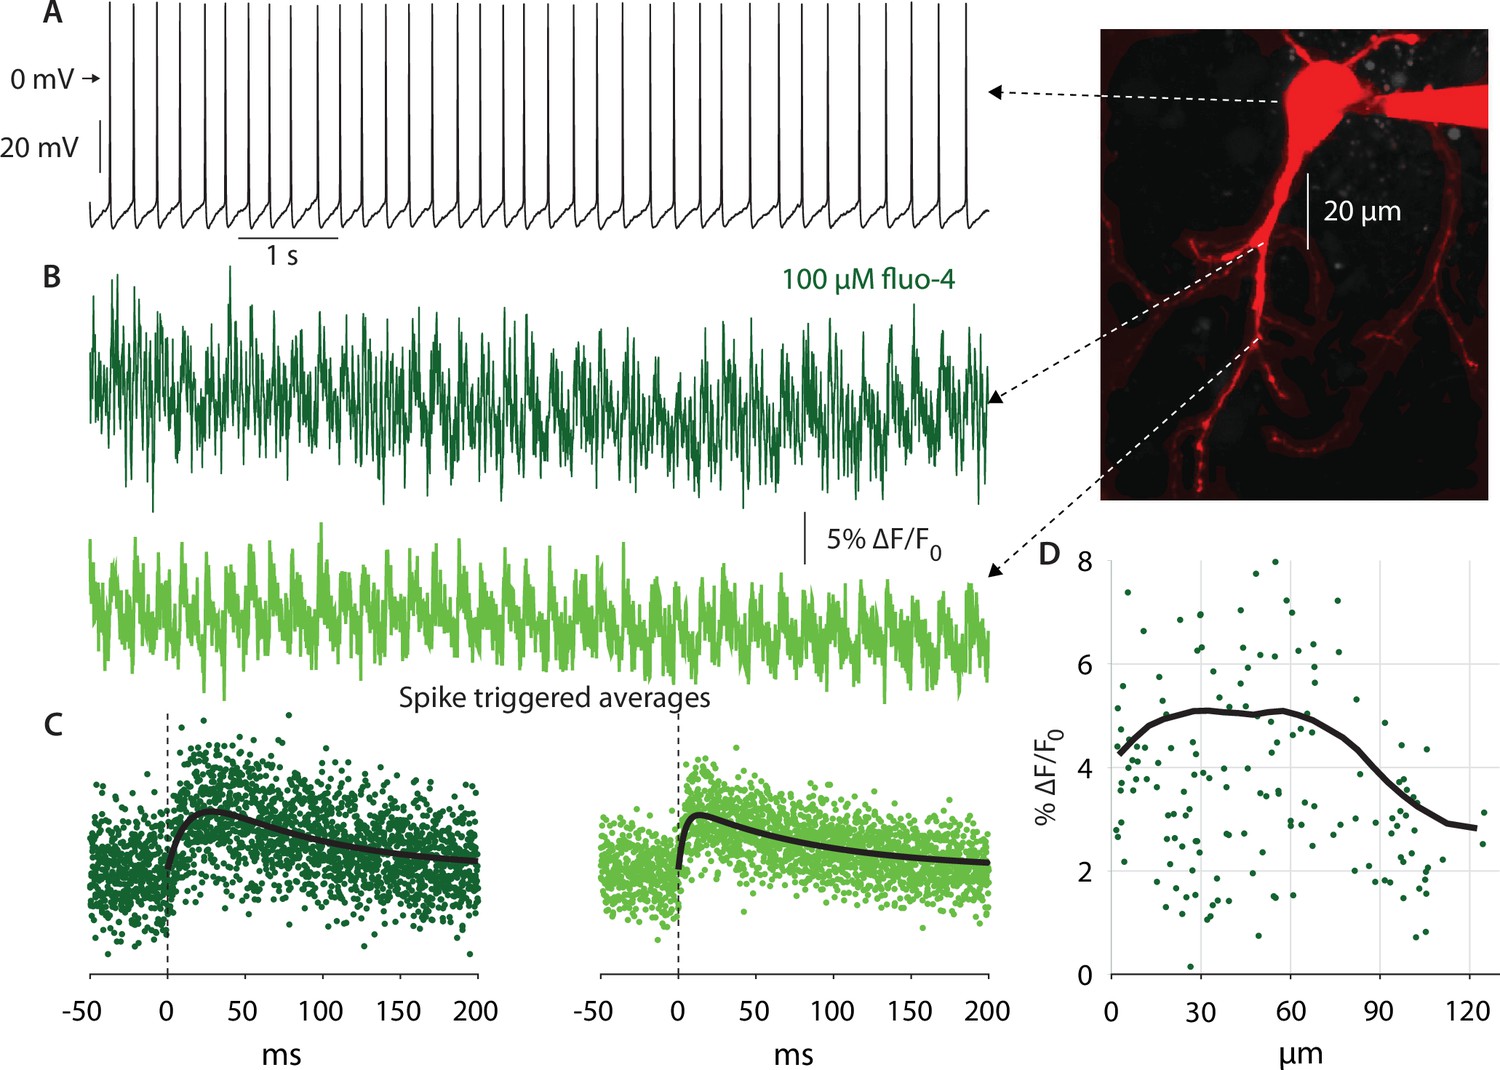
Autonomous action potentials actively back-propagate in CIN dendrites up to 70 µm from the soma.
(A) Autonomous discharge of a CIN that was patched and filled with fluo-4 and Alexa Fluor 568 for 2PLSM imaging (image). (B) Line scans at various distances from the soma exhibit Ca2+ oscillations caused by bAPs. (C) Calculating the spike-triggered average of these oscillations and fitting an alpha-function gives an estimate of the amplitude of these oscillations (in % ∆F/Fo). (D) The scatter plot of these amplitudes as a function of distance from the soma (11 CINs from 7 mice are pooled) exhibits a large degree of variability. However, a 35 µm moving average (black line) exhibits that the Ca2+ transients begin to decay approximately 70 µm from the soma, indicating that bAPs are supported by Nav channels up to that point (the initial increase up to 20 µm is due to the increase in the surface-to-volume ratio in the large proximal dendrites).
Figure 5 with 1 supplement

Thalamic – but not cortical EPSPs – onto CINs are boosted by NaP currents in wildtype mice.
(A) CINs were patched in current clamp in Thy1-ChR2 mice, so that 470 nm LED illumination of striatal slices activated nominally cortical terminals. (B) Optogenetically evoked monosynaptic cortical EPSPs were unaffected by ranolazine. (C) The parafascicular nucleus (PfN) of Vglut2-Cre mice was inoculated with AAVs harboring Cre-dependent ChR2, so that 470 nm LED illumination of striatal slices activated monosynaptic PfN terminals while CINs were patched in current clamp mode. (D) Optogenetically evoked thalamic EPSPs in CINs (held between –50 mV and –60 mV) were reduced by 30 µM ranolazine.
Figure 5—figure supplement 1

Monosynaptic excitatory cortical and thalamic paired-pulse ratios (PPRs) are not affected by ranolazine.
(A) Coronal slice via the PfN in a Thy1-ChR2-EYFP mouse express EYFP in fibers only but not in somata, ruling out that intrastriatal optogenetic activation in these mice recruits thalamic inputs. FR – fasciculus retroflexus. (B) Optogenetic EPSCs in all CINs recorded in Thy1-ChR2 (n=8 neurons, N=2 mice) and in 6/7 CINs from Vglut2-cre mice, whose PfN was inoculated with AAVs harboring floxed ChR2 (N=2) were monosynaptic, as 4-AP (100 µM) rescued release in the presence of TTX (1 µM). (C) Optical PPRs (100 ms interval) recorded in Thy1-ChR2 mice (left) or in Vglut2-cre mice whose PfN was transfected with AAVs harboring ChR2 (right) are unchanged by ranolazine.
Figure 6
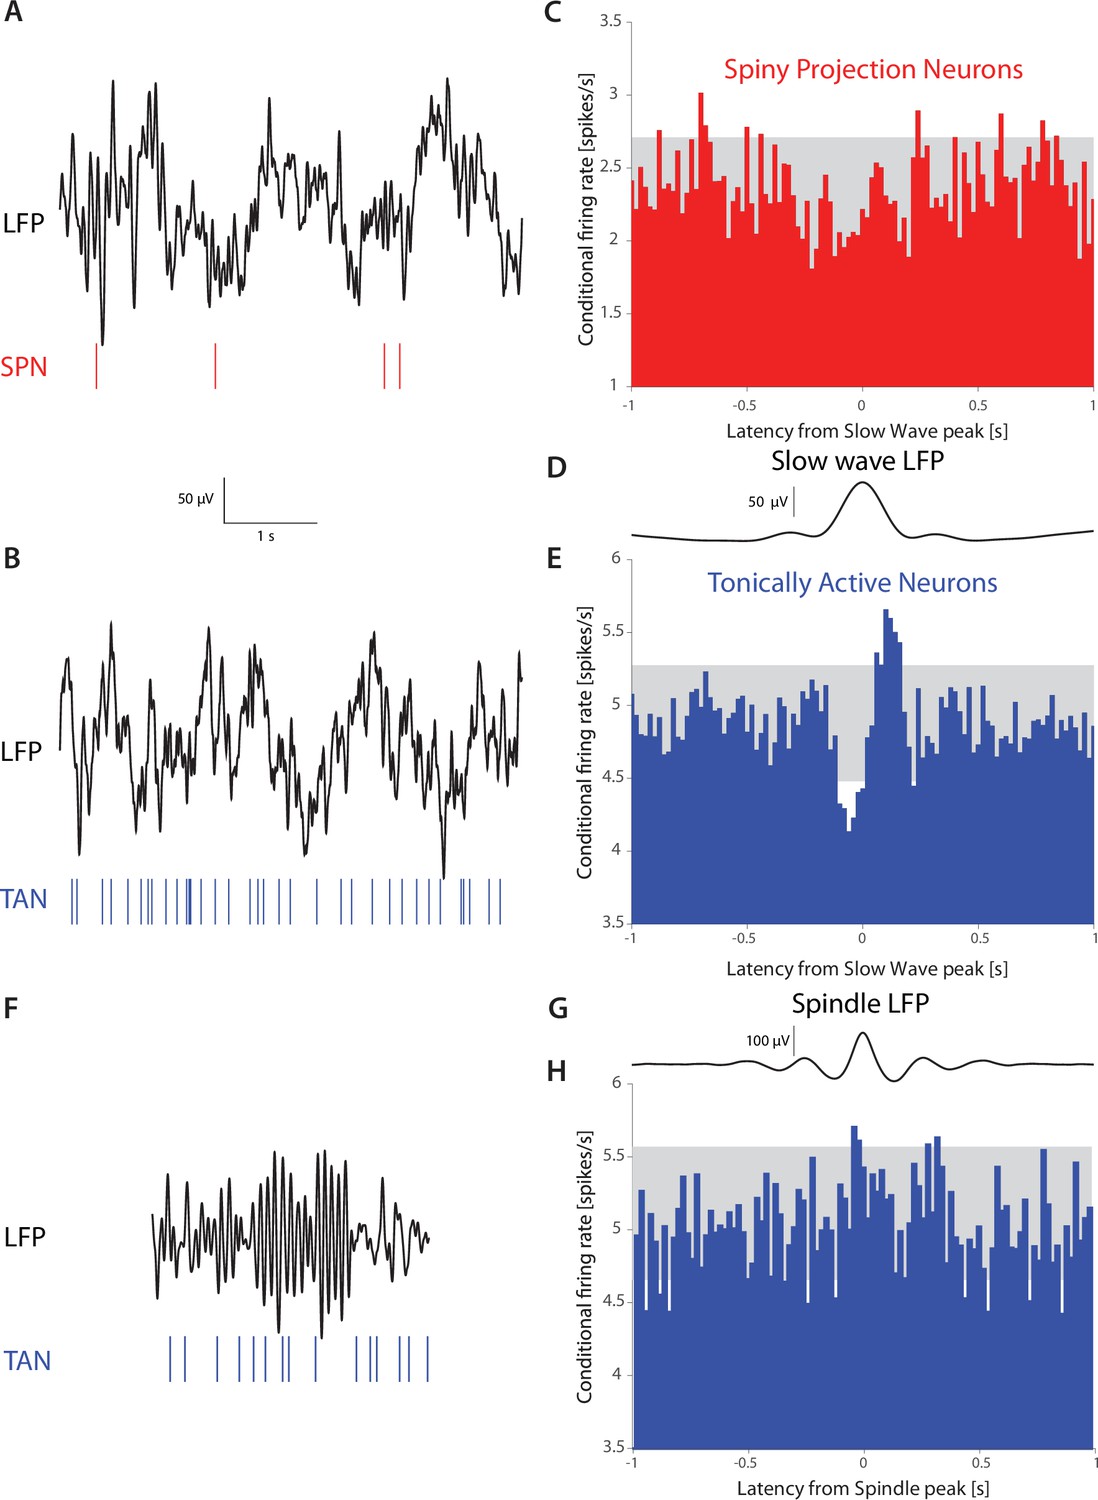
TANs, but not SPNs, exhibit a pause-like response to slow-wave events occurring during natural non-REM sleep in non-human primates (NHPs).
(A) Simultaneous recording of LFP and an SPN in an NHP during N2 and N3 stages of sleep. (B) Simultaneous recording of LFP and a TAN in an NHP during N2 and N3 stages of sleep. (C) SPN firing rate conditioned on the occurrence of an LFP slow wave event (6,065 triggers). (D) Average striatal LFP signal triggered on the occurrence of slow wave events (see Materials and methods). (E) TAN firing rate conditioned on the occurrence of slow wave event (28,603 triggers). (F).Simultaneous recording of LFP and a TAN in an NHP during a sleep spindle. (G) Average striatal LFP signal triggered on the occurrence of a sleep spindle (see Materials and methods). (H) TAN firing rate conditioned on the occurrence of a sleep spindle (5829 triggers). Gray box indicates the 99% confidence intervals.
Appendix 1—figure 1
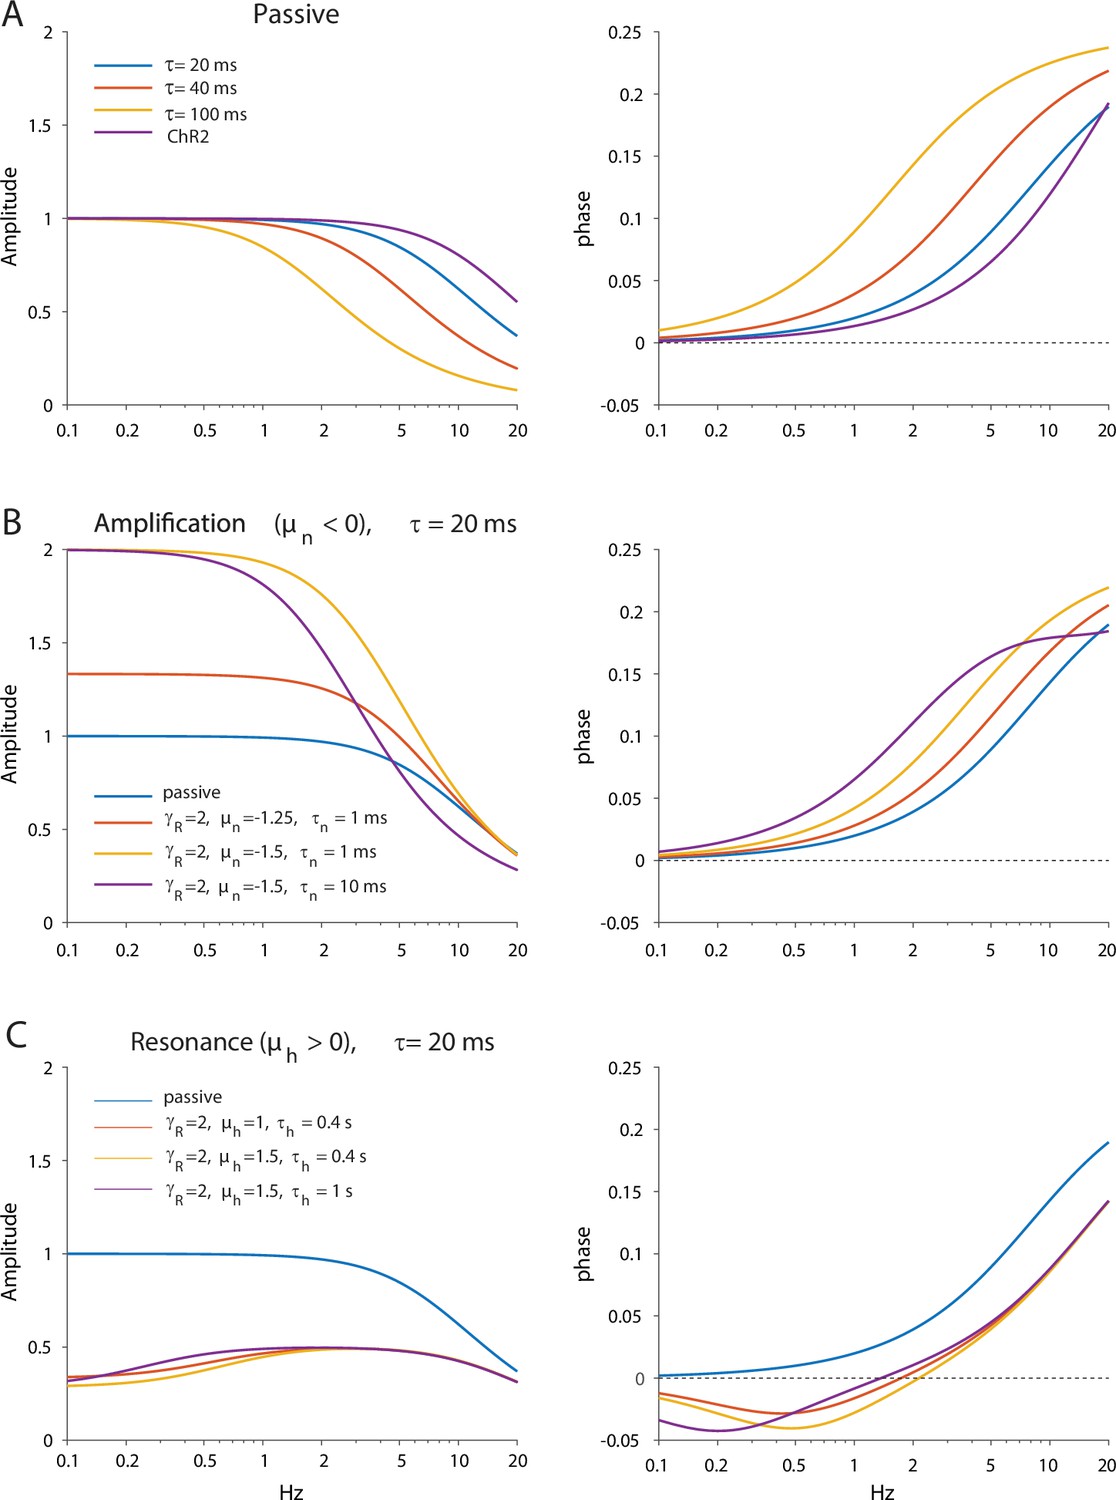
Dependence of amplitude and phase responses on parameters of the quasi-linear model.
(A) Passive dendrites are controlled by a single parameter τ. Amplitude and phase responses for typical values of the empirical alpha function used to model the ChR2 response (τr=2 ms, τd=11.5 ms) are is shown in purple for comparison. (B) Adding amplification increases the low frequency amplitude and phase response. (C) Adding resonance reduces the low frequency amplitude response and introduces negative phases in the low frequency phase response.
Appendix 1—figure 2
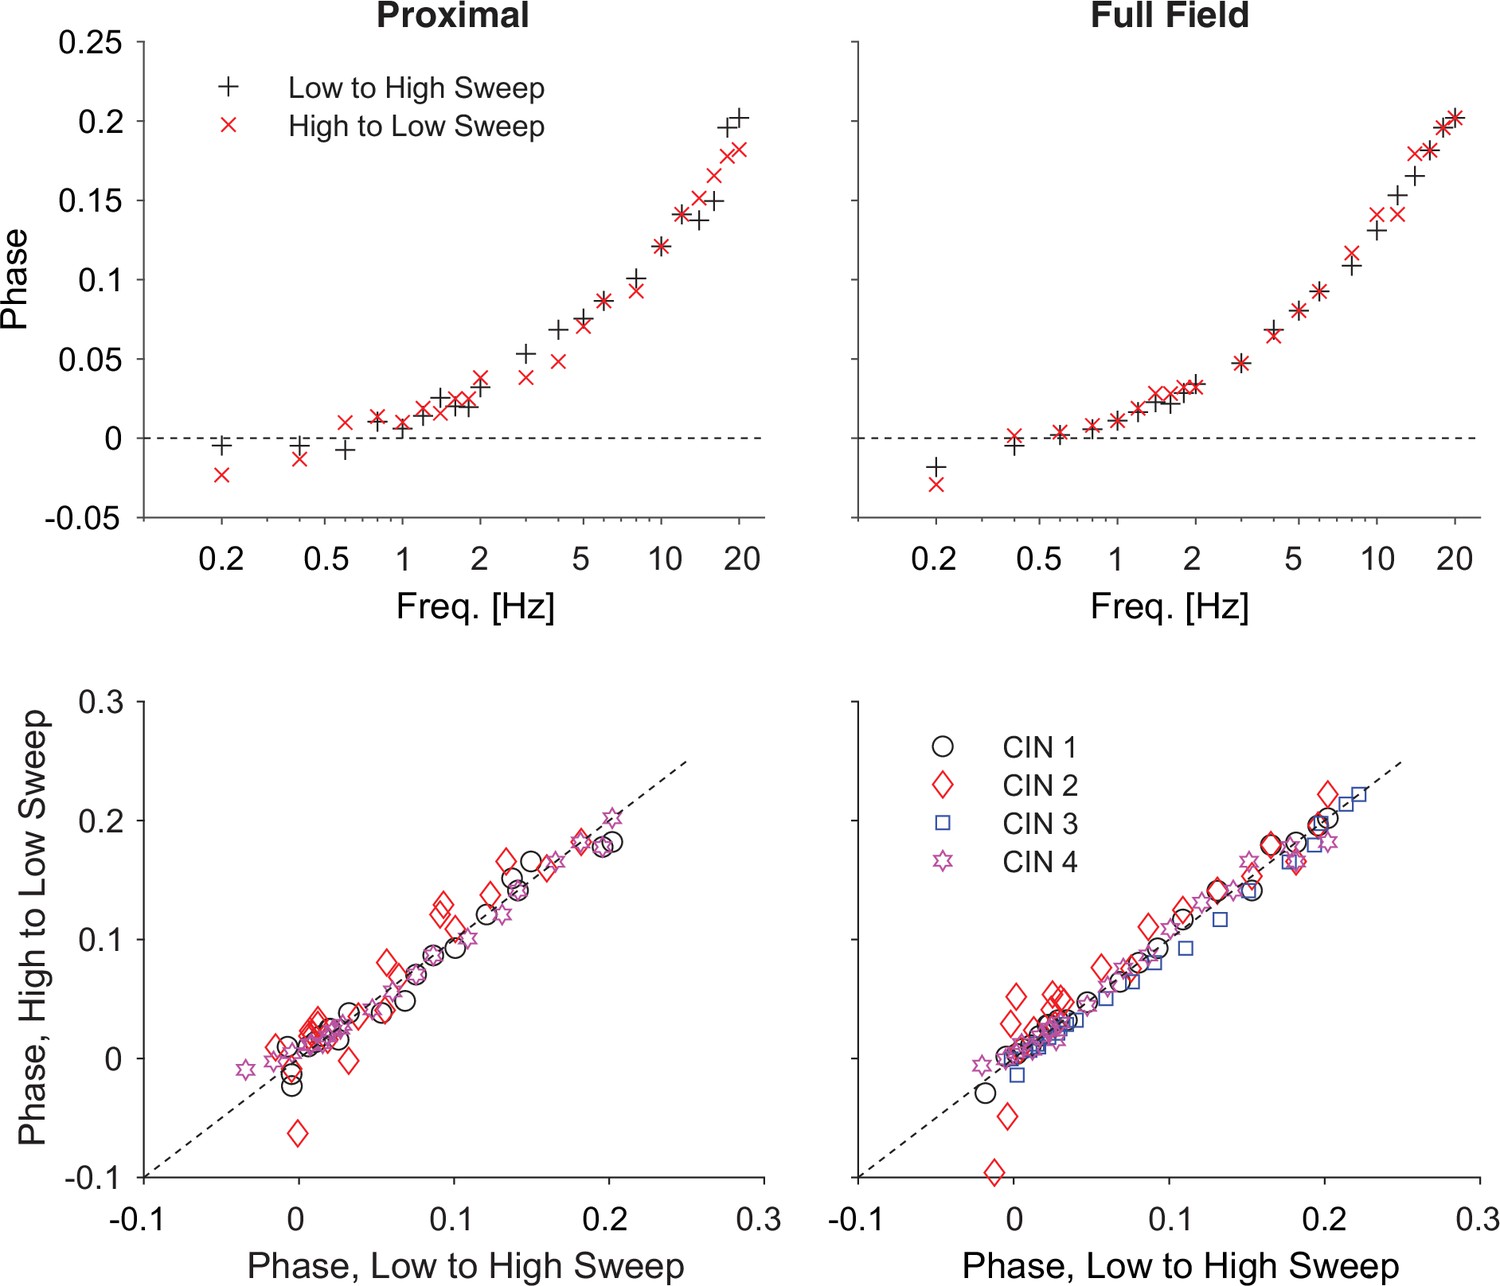
Reversing the optogenetic frequency sweep does not affect the phase estimates.
Top: estimates of the phases as a function of frequency for one neuron for increasing (black) and decreasing (red) frequencies for proximal and full-field illumination. Bottom: Scatter plot of phases recorded for decreasing vs. increasing frequencies (for 4 cells) shows that the values cluster around the diagonal. Holding potential: –70 mV.
Appendix 1—figure 3
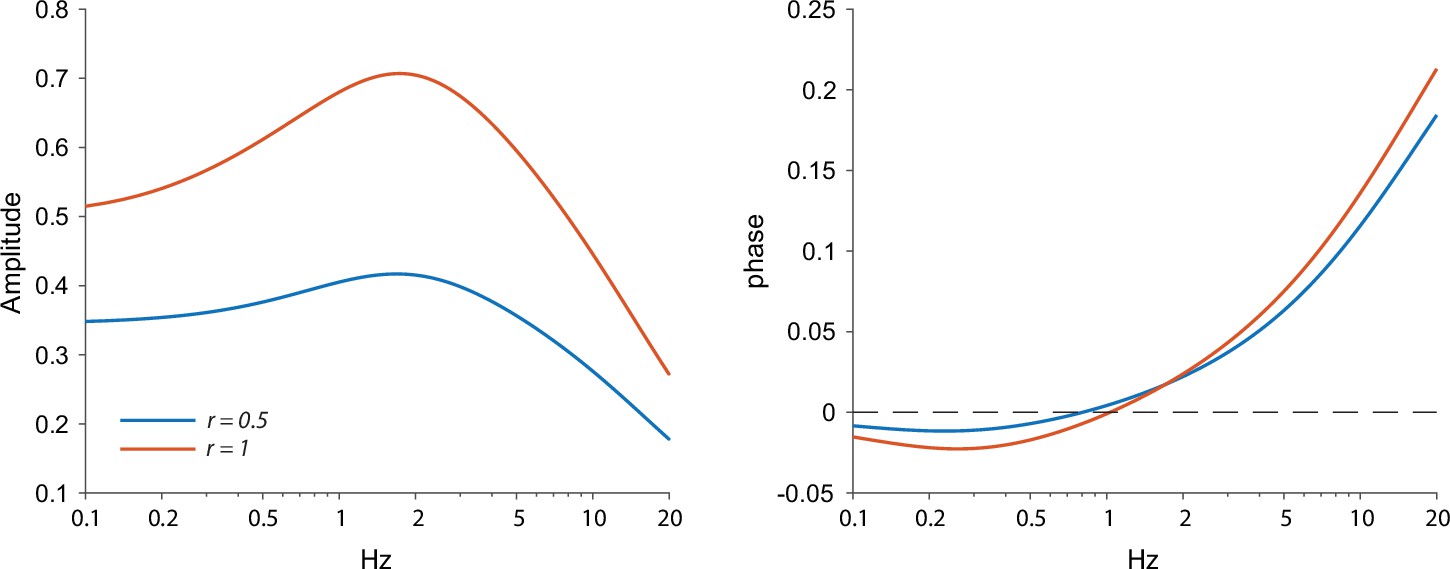
Amplitude and phase response arising from the ChR2 kinetics and a quasi-linear dendrite.
A homogeneous distribution of quasi-linear properties results in a stronger resonance when a larger portion of the dendrite (r=1 vs. r=0.5) is illuminated, which can be seen as a sharper peak and a negative phase region with more negative phases. Other parameters: γR=2, τ=20 ms, μn = –1.5, μh=2, τn=1 ms, τh=0.8 s, τr=0.2 ms, τd=10 ms.
Tables
Table 1
Parameters fit to quasi-linear model in Figures 1–3.
| Figure, Curve | µn | µh | τn (ms) | τh (ms) | γR | τ (ms) | r | Amp (GΩ) |
|---|---|---|---|---|---|---|---|---|
| 1C, –55 mV | –3.9189 | - | 28 | - | 5.4296 | 41.8 | - | 2.4728 |
| 1C, –70 mV | –3.3854 | 1.5863 | 11.6 | 1077.8 | 5.8722 | 26.1 | - | 1.4229 |
| 2B, TTX | –2.0178 | - | 31.7 | - | 3.4610 | 19.4 | - | 1.3809 |
| 2B, ZD7288 | –1.8988 | 0.4844 | 13.4 | 9107.5 | 2.6111 | 17.2 | - | 0.8323 |
| 3C, proximal | - | - | - | - | - | 35.8 | 0.4360 | - |
| 3C, distal | - | - | - | - | - | 26.8 | 1.0651 | - |
| 3D, proximal | –1.4763 | 3.4400 | 60.0 | 551.2 | 3.3405 | 33.6 | 0.5788 | - |
| 3D, distal | –0.8885 | 1.6646 | 49.2 | 403.3 | 3.8850 | 45.3 | 1.0646 | - |
Key resources table
| Reagent type (species) or resource | Designation | Source or reference | Identifiers | Additional information |
|---|---|---|---|---|
| Genetic reagent (M. musculus) | B6.129S-Chattm1(cre)Lowl/MwarJ | The Jackson Laboratory | Strain #:031661 RRID:IMSR_JAX:031661 | B6J.ChAT-IRES-Cre (Δneo) |
| Genetic reagent (M. musculus) | B6.Cg-Tg(Thy1-COP4/EYFP)18Gfng/J | The Jackson Laboratory | Strain #:007612 RRID:IMSR_JAX:007612 | Thy1-ChR2-YFP |
| Genetic reagent (M. musculus) | B6;129S-Gt(ROSA)26Sortm32(CAG-COP4*H134R/EYFP)Hze/J | The Jackson Laboratory | Strain #:012569 RRID:IMSR_JAX:012569 | Ai32(RCL-ChR2(H134R)/EYFP) |
| Genetic reagent (M. musculus) | STOCK Slc17a6tm2(cre)Lowl/J | The Jackson Laboratory | Strain #:016963 RRID:IMSR_JAX:016963 | Vglut2-ires-cre |
| Chemical compound, drug | Mecamylamine hydrochloride | Sigma-Aldrich | Lot # 019M4108V CAS: 826-39-1 | |
| Chemical compound, drug | Atropine sulfate salt monohydrate | Sigma-Aldrich | Lot # BCBH8339V CAS No.: 5908-99-6 | |
| Chemical compound, drug | SR 95531 hydrobromide (Gabazine) | Hello Bio | CAS: 104104-50-9 | |
| Chemical compound, drug | DNQX | TOCRIS | CAS: 2379-57-9 | |
| Chemical compound, drug | D-AP5 | Hello Bio | CAS:79055-68-8 | |
| Chemical compound, drug | CGP 55845 hydrochloride | Hello Bio | CAS: 149184-22-5 | |
| Chemical compound, drug | Dihydro-β-erythroidine hydrobromide | TOCRIS | CAS: 29734-68-7 | |
| Chemical compound, drug | Ranolazine dihydrochloride | Sigma-Aldrich | CAS Number: 95635-56-6 | Product Number R6152 |
| Chemical compound, drug | ZD7288 | MedChemExpress | CAS No.: 133059-99-1 | Synonyms: ICI D7288 |
| Chemical compound, drug | Tetrodotoxin citrate | Hello Bio | CAS: 18660-81-6 | |
| Chemical compound, drug | 4-Aminopyridine | Sigma-Aldrich | CAS Number: 504-24-5 | |
| Chemical compound, drug | Phosphate buffered saline tablets | Sigma-Aldrich | MDL number: MFCD00131855 | Product Number P4417 |
| Chemical compound, drug | Paraformaldehyde | Sigma-Aldrich | CAS Number: 30525-89-4 | |
| Chemical compound, drug | XYLAZINE AS HYDROCHLORIDE | EUROVET ANIMAL HEALTH B.V | CAS: 082-91-92341-00 | |
| Chemical compound, drug | CLORKETAM | VETOQUINOL | CAS: 1867-66-9 | |
| Chemical compound, drug | Meloxicam | Chanelle Pharmaceuticals Manufacturing ltd | CAS Number: 71125-38-7 | |
| Chemical compound, drug | isoflurane | Primal Critical Care | CAS Number: 26675-46-7 | |
| Software, algorithm | MATLAB | MathWorks | RRID:SCR_001622 | Data analysis |
| Software, algorithm | WinWCP | University of Strathclyde Glasgow | RRID:SCR_014713 | Data acquisition |
| Software, algorithm | FEMTOSmart Software: MESc | FEMTONICS | RRID:SCR_018309 | 2 P Data acquisition |
| Software, algorithm | NIS-Elements Basic Research | Nikon instruments | RRID:SCR_002776 | Confocal images acquisition |
| Software, algorithm | Signal 6 | Cambridge Electronic Design | RRID:SCR_017081 | |
| Software, algorithm | AlphaLab SnR | Alpha-Omega Engineering | https://www.alphaomega-eng.com/ | |
| Software, algorithm | Electrode Positioning System | Alpha-Omega Engineering | https://www.alphaomega-eng.com/ | |
| Other | Model 940 Small Animal Stereotaxic Instrument with Digital Display Console | Kopf Instruments | https://kopfinstruments.com/product/model-940-small-animal-stereotaxic-instrument-with-digital-display-console/ | See “Stereotaxic viral inoculation in Vglut2-ires-Cre mice” in Materials and Methods |
| Other | Sound-attenuating room | IAC acoustics | https://www.iacacoustics.com/ | See “Non-Human Primates (NHPs)” in Materials and Methods |
| Other | Glass-coated Tungsten electrodes | Alpha-Omega Engineering | https://www.alphaomega-eng.com/ | See “Non-Human Primates (NHPs)” in Materials and Methods |
Appendix 1—table 1
Parameter ranges and initial guesses for the quasi-linear dendritic model fits.
| Parameter | µn | µh | τn (ms) | τh (s) | γR | τ (ms) | r |
|---|---|---|---|---|---|---|---|
| min | –5 | 0 | 0.1 | 0.01 | 1 | 10 | 0 |
| max | 0 | 5 | 100 | 10 | 10 | 100 | 2 |
| initial guess | –1 | 1 | 20 | 1 | 2 | 50 | 1 |
Additional files
Download links
A two-part list of links to download the article, or parts of the article, in various formats.
Downloads (link to download the article as PDF)
Open citations (links to open the citations from this article in various online reference manager services)
Cite this article (links to download the citations from this article in formats compatible with various reference manager tools)
Non-uniform distribution of dendritic nonlinearities differentially engages thalamostriatal and corticostriatal inputs onto cholinergic interneurons
eLife 11:e76039.
https://doi.org/10.7554/eLife.76039


