Multi-omics insights into host-viral response and pathogenesis in Crimean-Congo hemorrhagic fever viruses for novel therapeutic target
- The Systems Virology Lab, Division of Clinical Microbiology, Department of Laboratory Medicine, Karolinska Institute, ANA Futura, Campus Flemingsberg, Sweden
- Manipal Institute of Virology (MIV), Manipal Academy of Higher Education, India
- Department of Infectious Diseases and Clinical Microbiology, Medical Faculty, Cumhuriyet University, Turkey
- Public Health Agency of Sweden, Sweden
- Public Health England, Porton Down, United Kingdom
- Oxford Brookes University, United Kingdom
- Department of Nutrition and Dietetics, Faculty of Health Sciences, Sivas Cumhuriyet University, Turkey
- Division of Chemistry I, Department of Medical Biochemistry and Biophysics, Karolinska Institutet, Sweden
- Division of Clinical Microbiology, Department of Laboratory Medicine, Karolinska Institute, ANA Futura, Campus Flemingsberg, Sweden
- National Bioinformatics Infrastructure Sweden (NBIS), Science for Life Laboratory, Department of Biochemistry and Biophysics, Stockholm University, Sweden
- National Institute of Immunology, Aruna Asaf Ali Marg, India
- Institute for Virology, FB10-Veterinary Medicine, Justus-Liebig University, Germany
- Faculty of Infectious and Tropical Diseases, London School of Hygiene and Tropical Medicine, United Kingdom
- National Veterinary Institute, Sweden
Figures
Figure 1 with 3 supplements
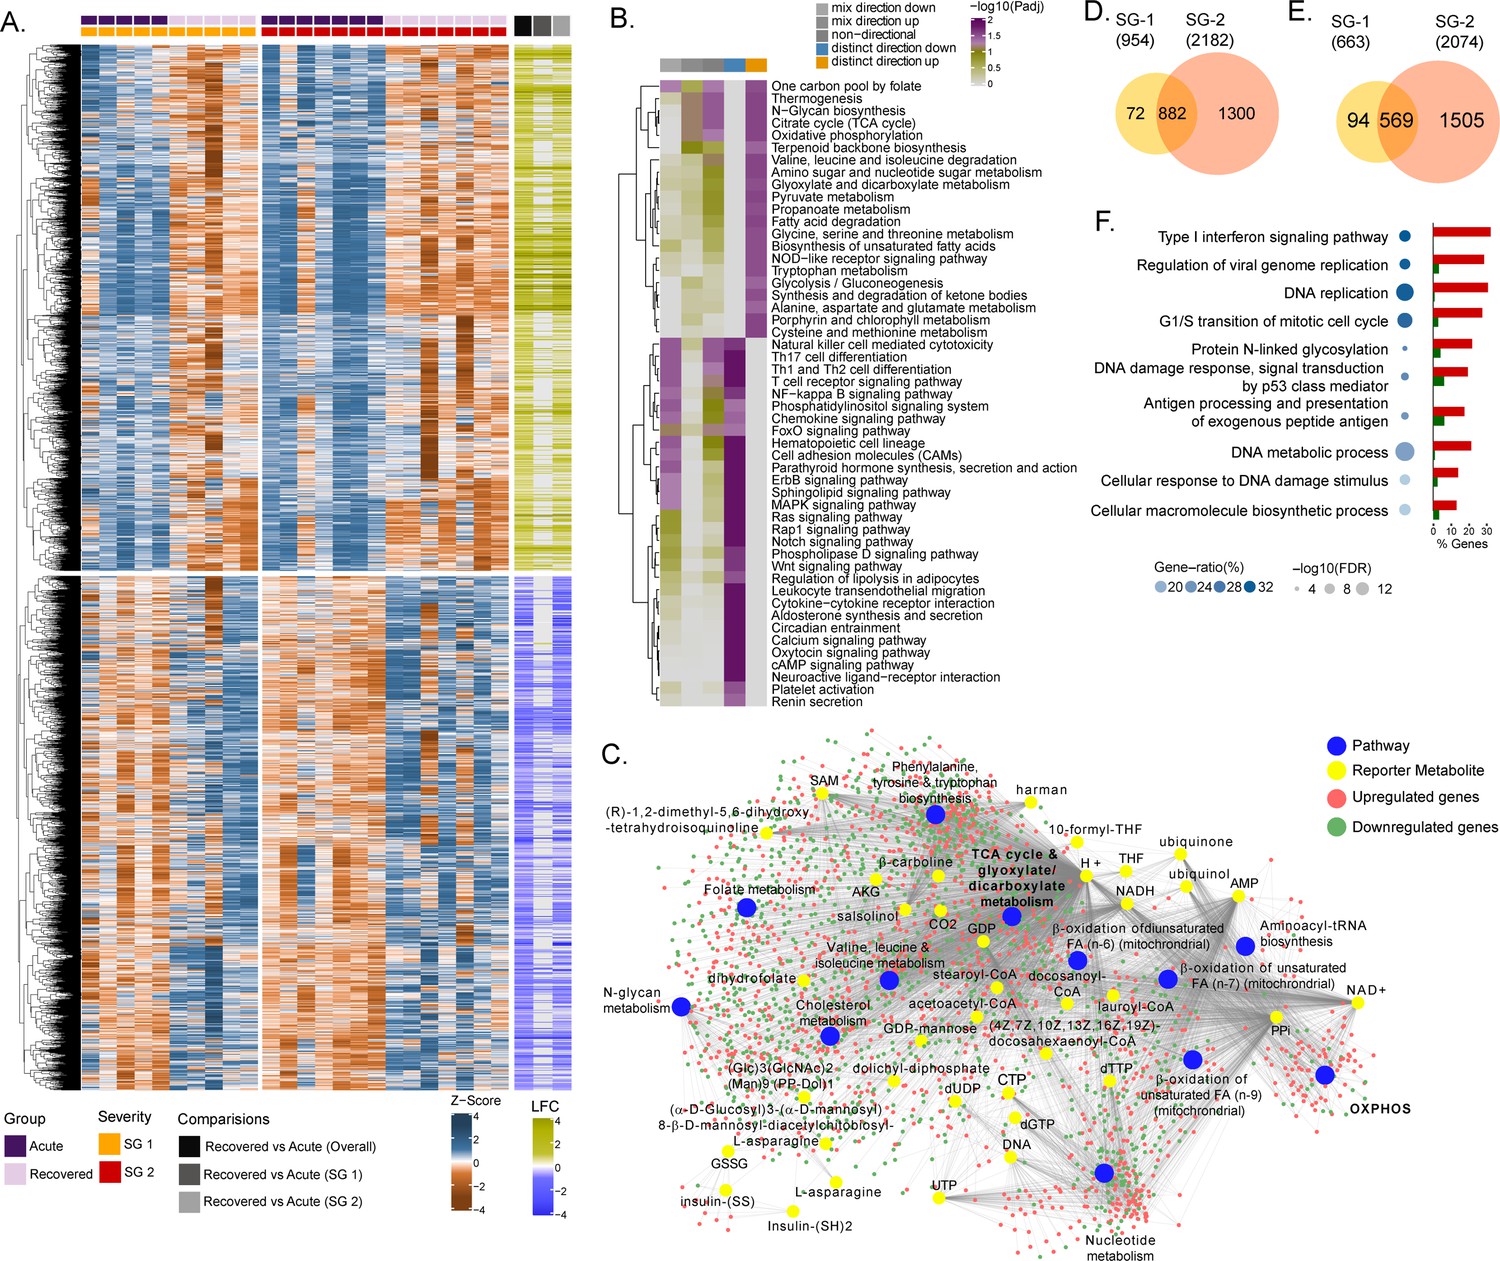
Differential gene expression and pathway analysis between acute and recovery phases.
(A) Heatmap of Z-score transformed expression values of significantly regulated genes in the pair-wise comparisons namely recovered vs. acute (overall), recovered vs. acute (SG-1), recovered vs. acute (SG-2). The columns represent the patient samples and their corresponding severity groups at different time points. The rows represent genes that are hierarchically clustered based on Euclidean distance. (B) Pathways were found to be significantly regulated (adj. p < 0.05) by genes expressed at the acute infection phase compared to recovered phase. The heatmap visualizes negative log scaled adjusted p-values of different directionality classes. Non-directional p-values were generated based on gene-level statistics alone without considering the expression direction. The mixed-directional p-values were calculated using subset of gene-level statistics of up and down-regulated genes respectively for mixed-directional up and down. Distinct directional up and distinct directional down p-values are calculated from gene statistics with expression direction (C) Network visualization of significant reporter metabolites (adj. p < 0.1) and reporter subsystems (pathways) identified in acute compared to recovered. The yellow node denotes reporter metabolite and blue node denotes reporter subsystems. Light red and green colored nodes represent upregulated and downregulated genes respectively. Each edge in the network denotes association of genes with reporter metabolites and subsystems based on the human genome-scale metabolic model. (D) Venn diagram of significantly up-regulated genes in recovered vs acute (SG-1) and recovered vs acute (SG-2) phases (E) Venn diagram of significantly down-regulated genes in recovered vs. acute (SG-1) and recovered vs. acute (SG-2) phases. (F) Gene ontology (GO, biological process) enrichment analysis results of commonly regulated genes (882 upregulated and 569 down-regulated) from (D) and (E). The color gradient and bubble size correspond to the gene ratio of each GO term and the adjusted p-value of the enrichment test, respectively. The adjacent bar graph represents the percentage of genes upregulated or downregulated in each GO term.
Figure 1—figure supplement 1
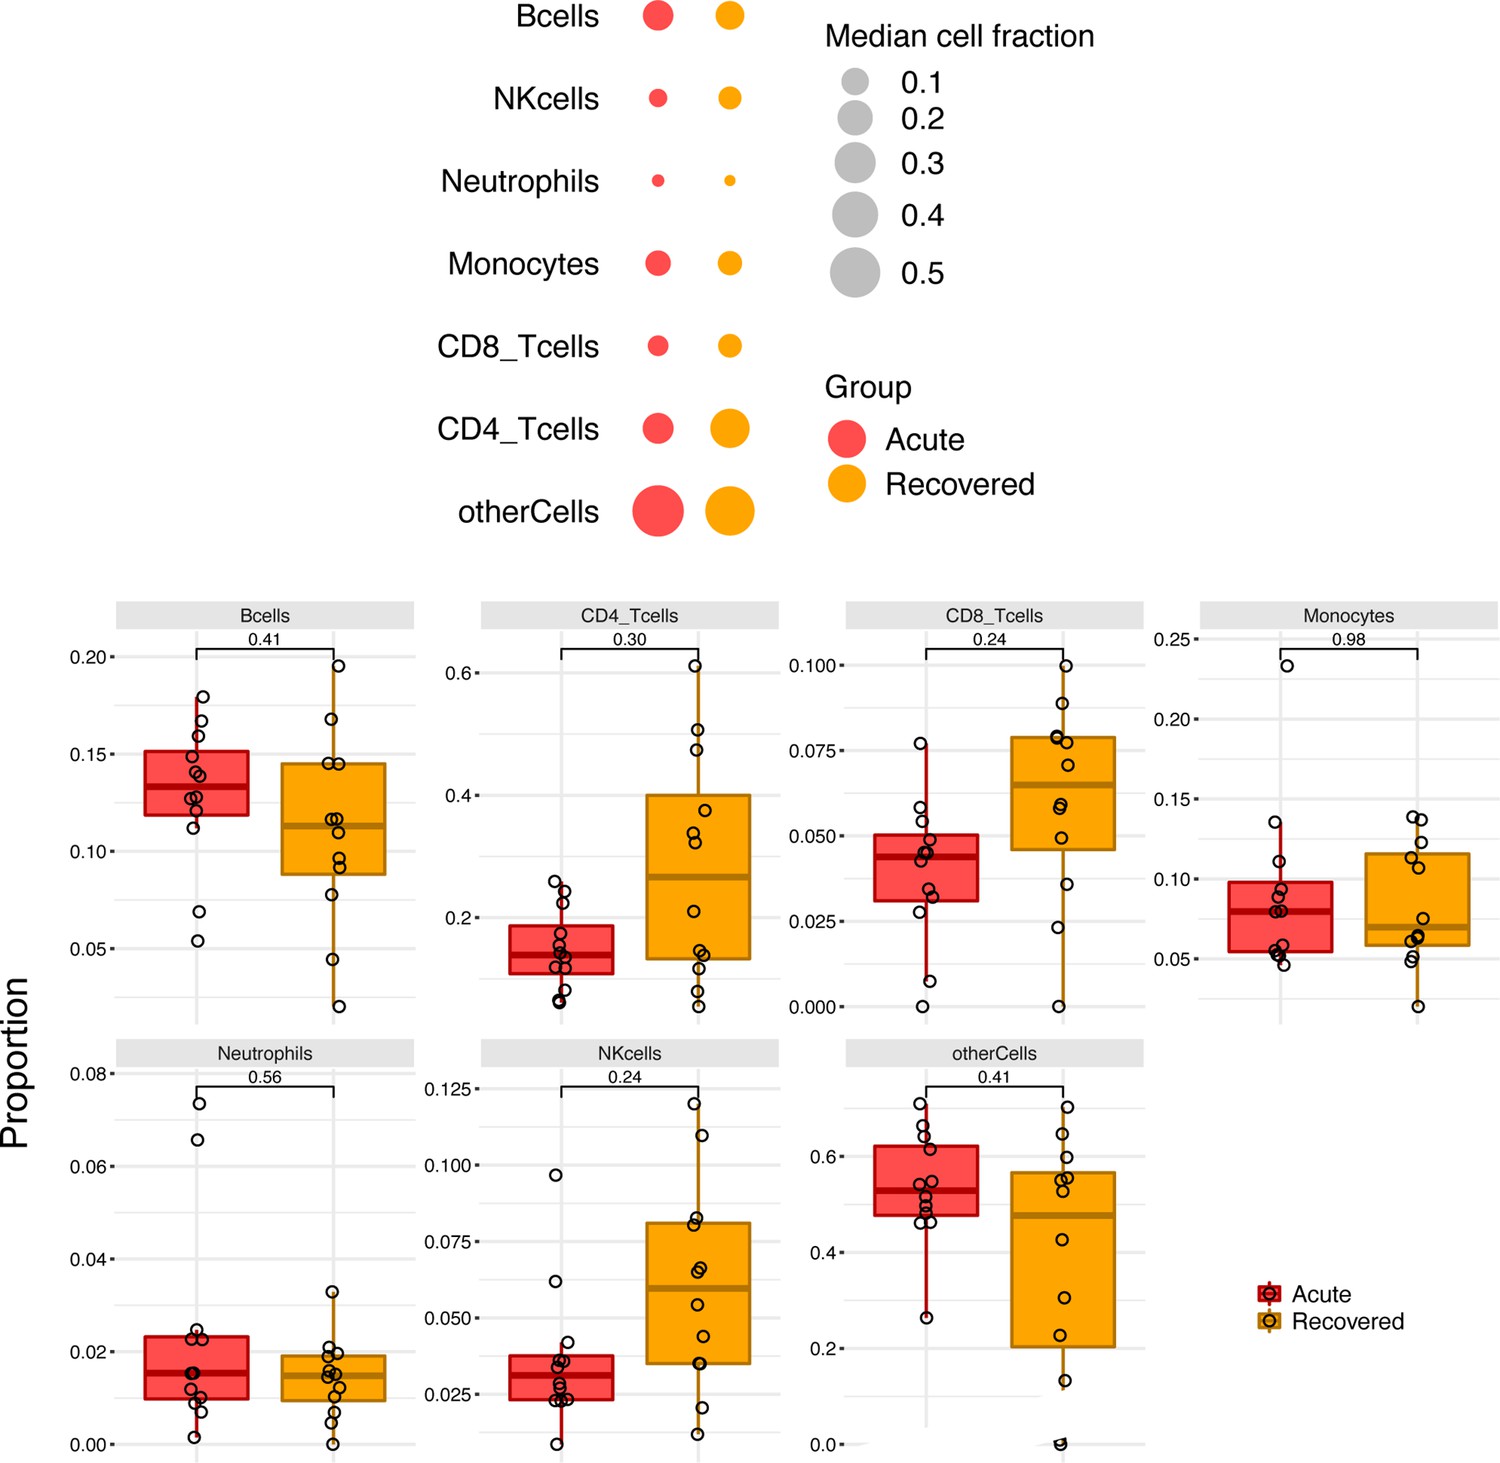
Digital cell quantification using EPIC.
Figure 1—figure supplement 2
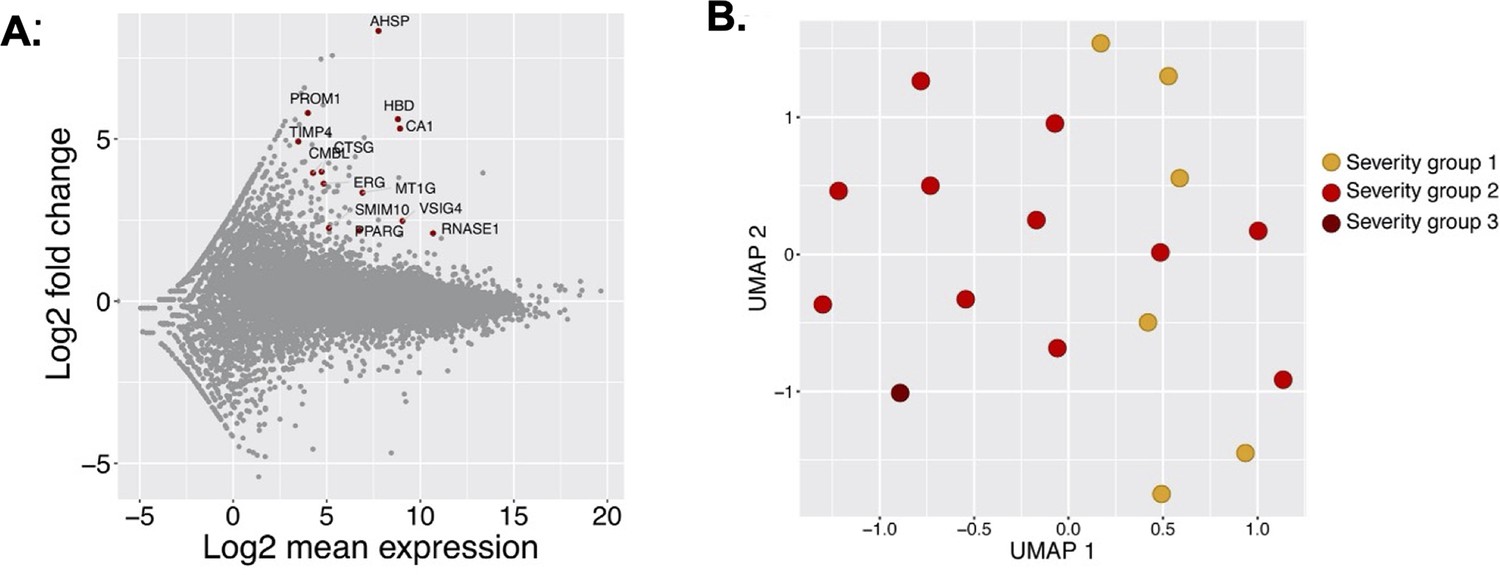
Severity group association with gene expression.
(A) MA-plot of differentially regulated genes during the acute phase between samples of severity group 1 and severity group 2 and 3. (B) Sample distribution during the acute phase of infection in different severity groups as reported.
Figure 1—figure supplement 3

Violin plot of 22 soluble markers as determined from Luminex assay assays.
Figure 2
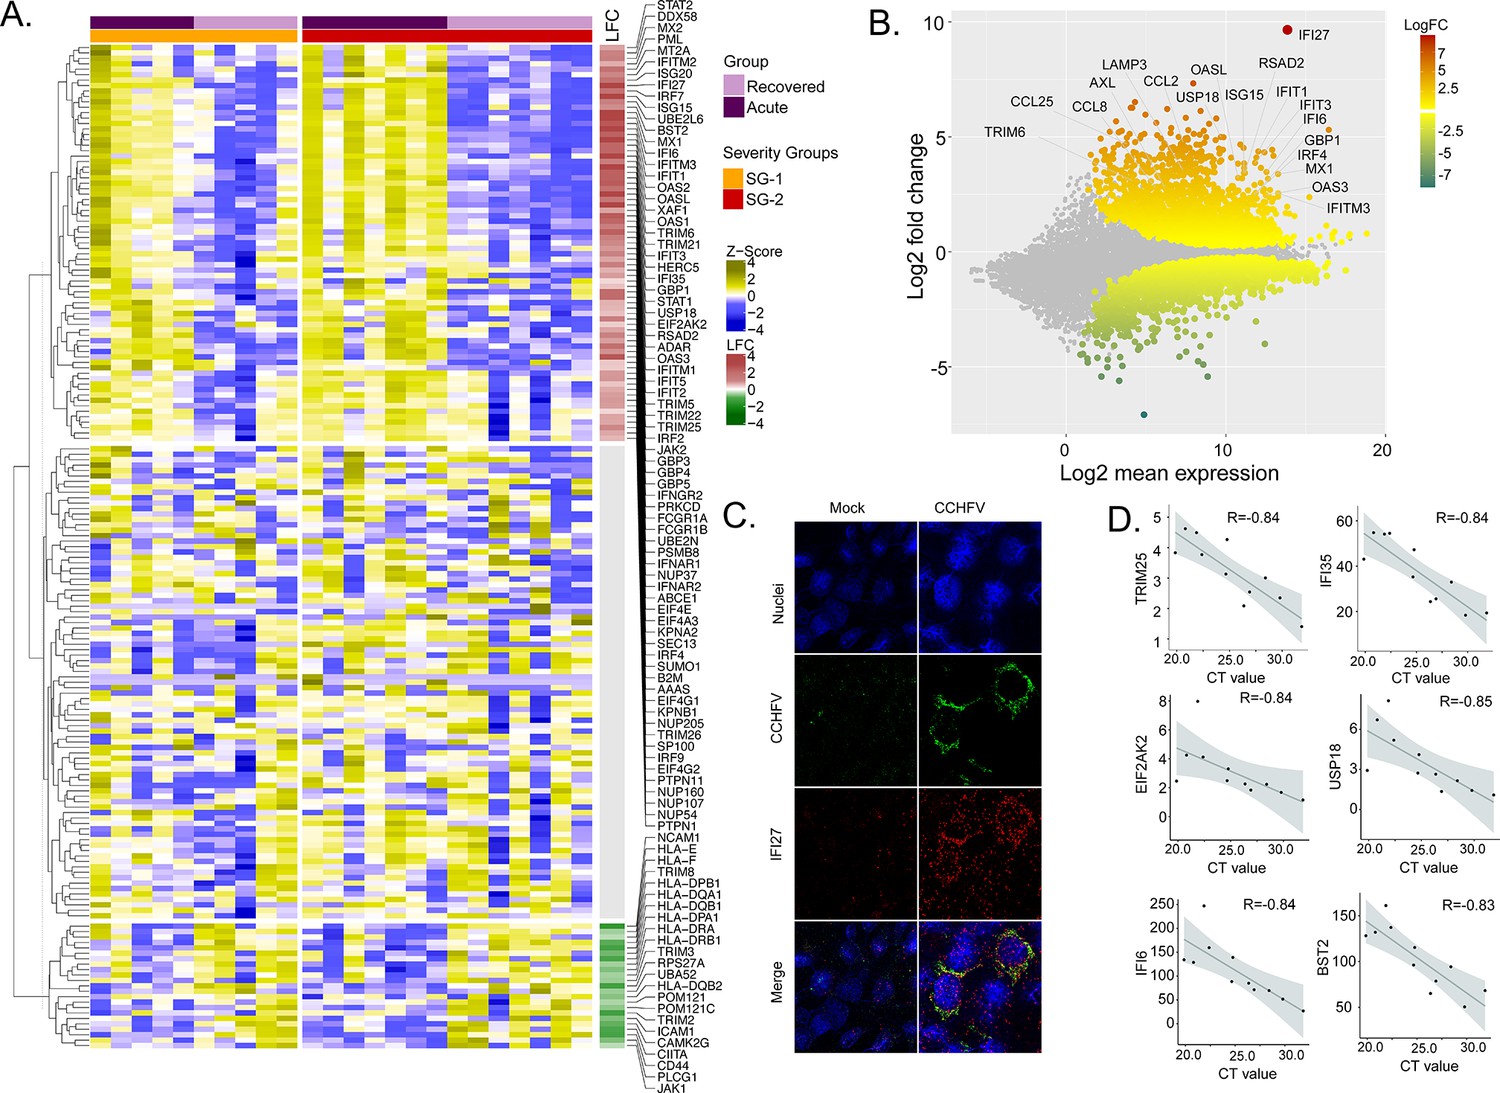
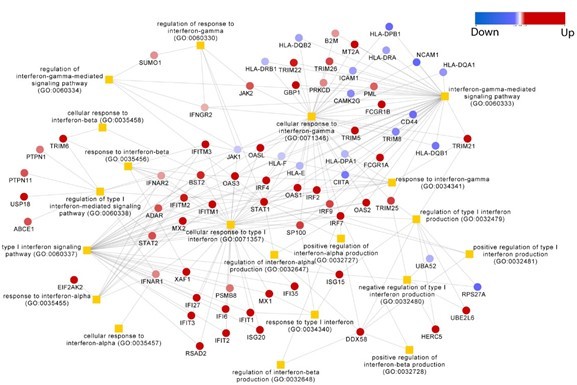
Differentially expressed genes in interferon (IFN) signaling pathways.
(A) Heatmap visualizes the expression pattern of IFN-signaling genes (including ISGs) significantly different between the recovered and acute phases. The columns represent the patient samples and their corresponding severity groups at different time points. The rows represent genes hierarchically clustered based on Euclidean distance. (B) MA-plot of differentially regulated genes between the recovered and acute phases. ISGs are marked. (C) RNAscope analysis targeting IFI27 genes in infected and non-infected cells. (D) Spearman correlation between viral load and IFN signaling genes (adj p < 0.05).
Figure 3 with 2 supplements
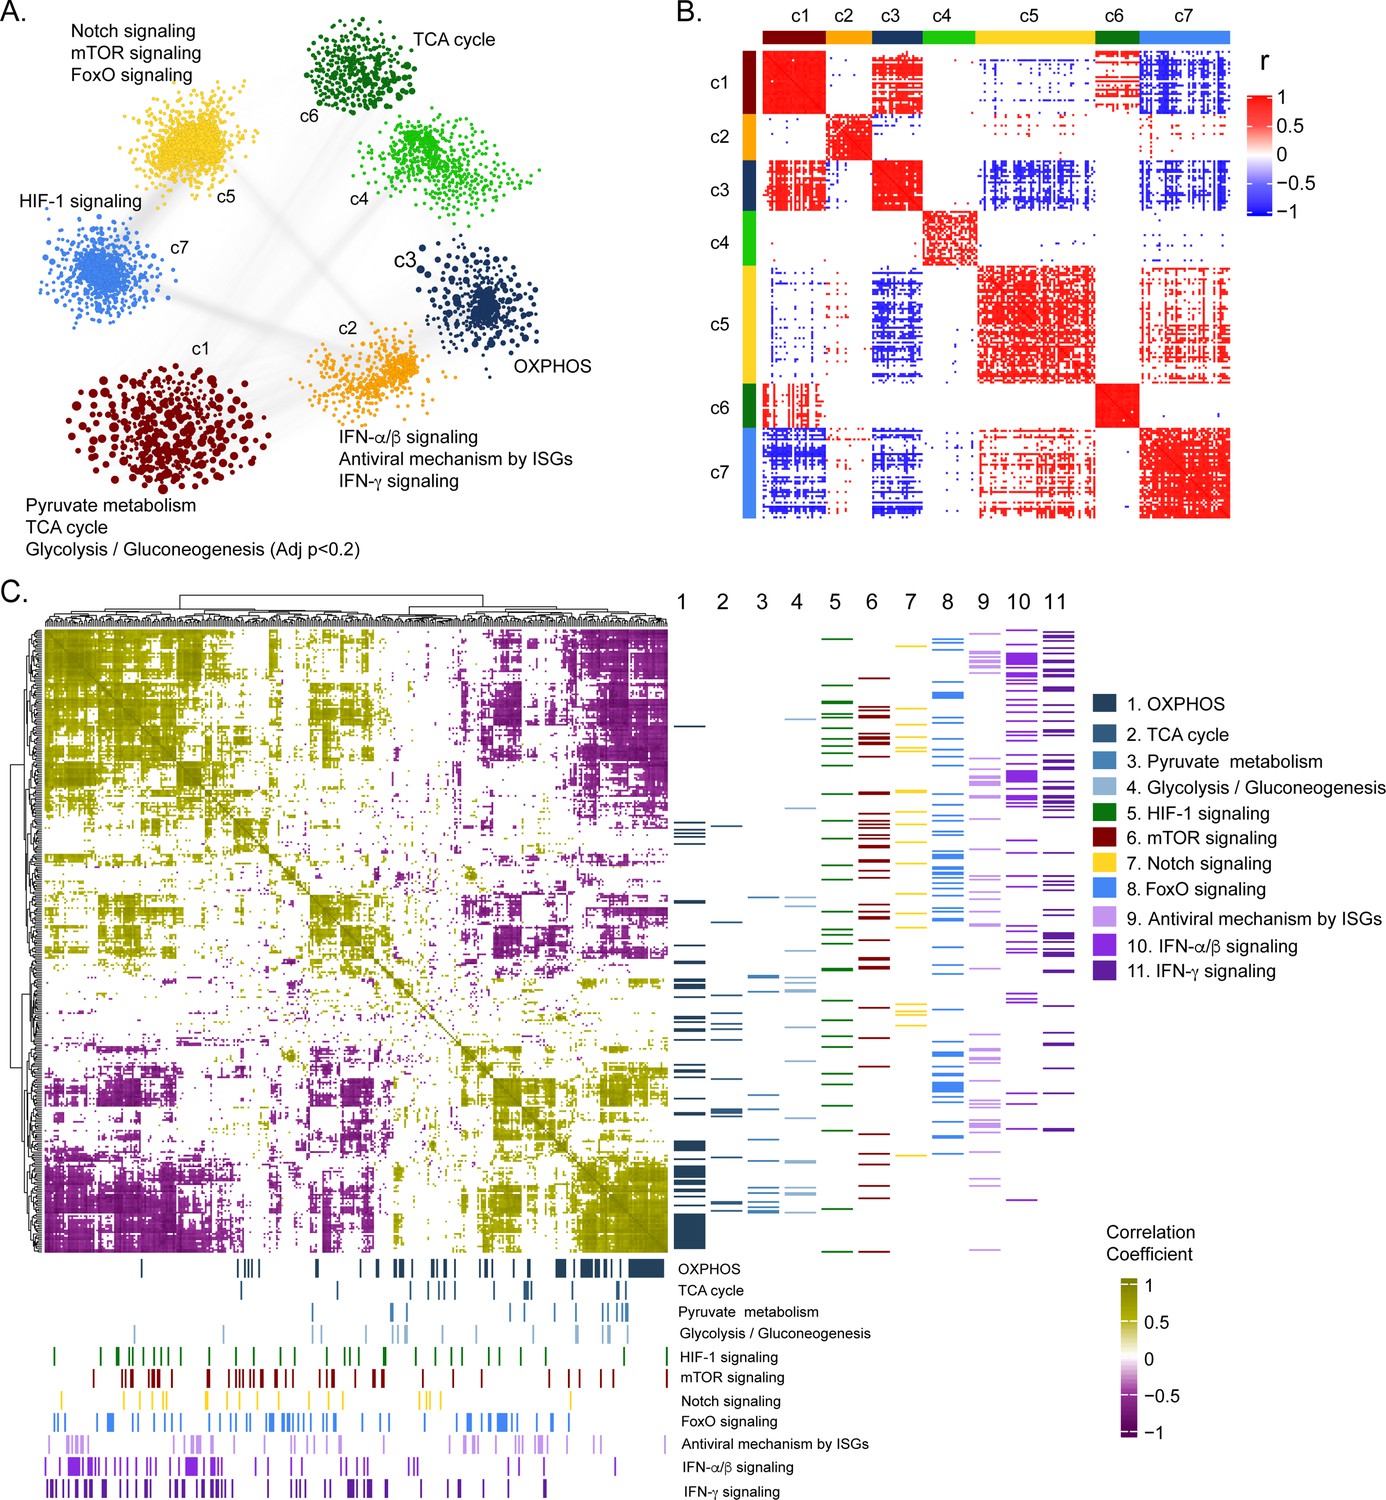
Weighted co-expression network analysis.
(A) Network visualization of seven gene co-expression communities identified. Nodes and node size represent genes and their centrality (degree) respectively and edges represent significant Spearman correlation (adj p < 0.001 and R > 84). Key significantly regulated pathways (adj. p < 0.05) in each community are labeled. (B) Heatmap of correlations among top 5% central genes in each community. Column and row annotation denotes corresponding communities. (C) Heatmap of significant correlation (adj. p < 0.05) between key metabolic and signaling pathways mentioned in (A). Column and row annotation denotes corresponding pathways.
Figure 3—figure supplement 1
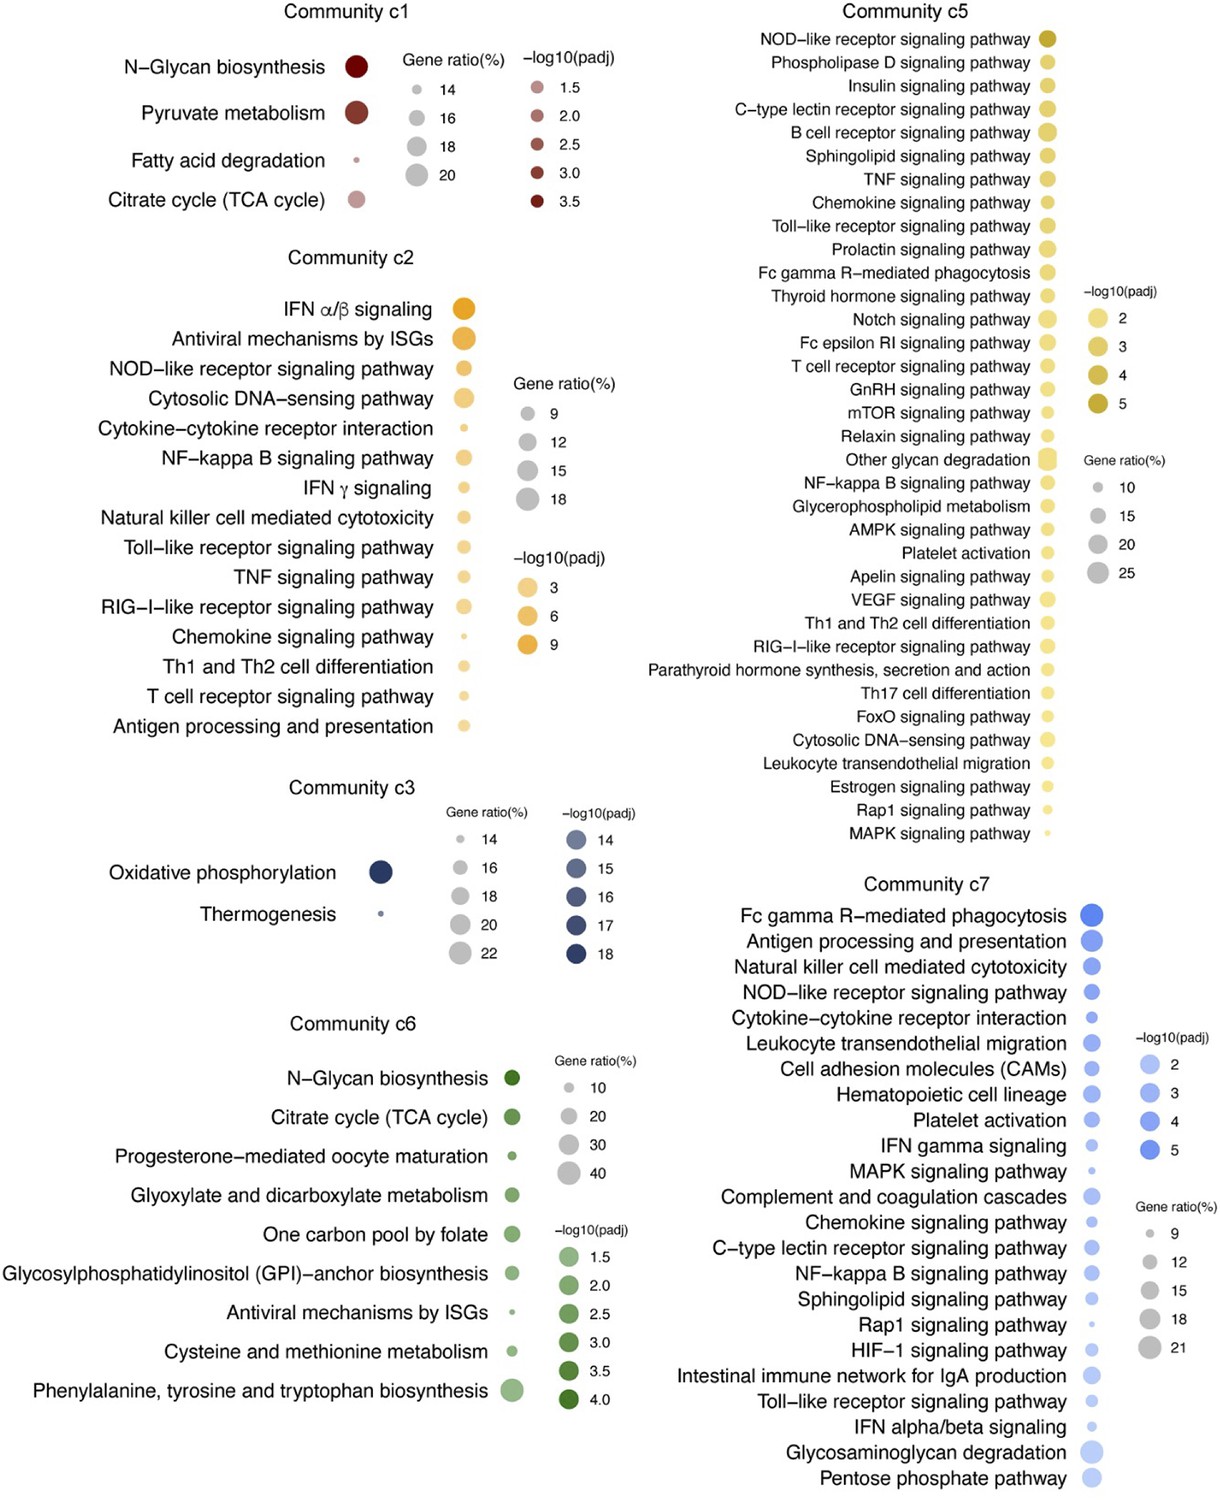
Gene set enrichment analysis of the individual communities.
Figure 3—figure supplement 2

Weight co-expression network of the negatively co-related genes We observed a high number of negative correlations between this community (c1) and those associated with Notch, mTOR, and FoxO signaling (c5) and HIF-1 signaling (c7).
Figure 4 with 1 supplement
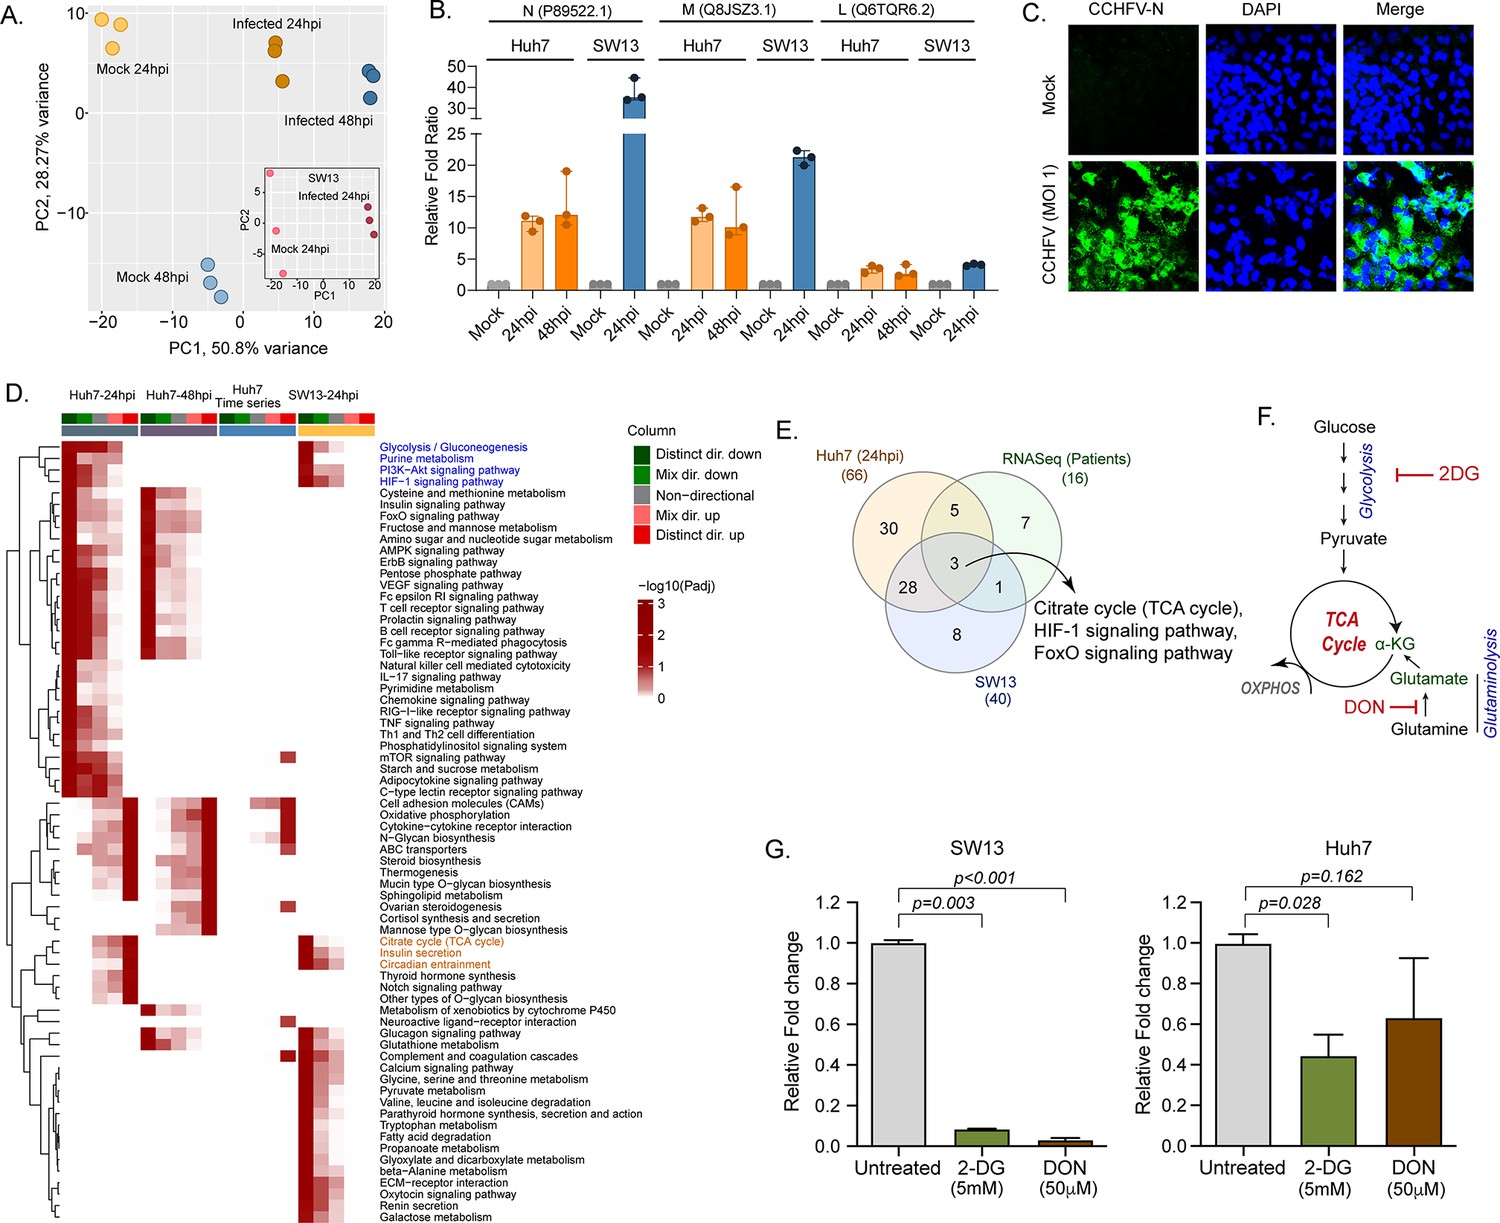
LC-MS/MS-based quantitative proteomics analysis in CCHFV-infected Huh7 and SW13 cells.
(A) Principal component analysis of proteomics samples of Huh7 cells and SW13 (inset) using only human proteins. (B) Identification of the CCHFV N (UniProtKB P89522.1), M (UniProtKB Q8JSZ3.1) and L (UniProtKB Q6TQR6.2) protein in the quantitative proteomics analysis. (C) Immunofluorescence staining of the CCHFV nucleoprotein to assess the infectivity. (D) Significantly regulated pathways (adj p < 0.05) in any of the pair-wise proteomics analyses in Huh7 and SW13 cells. The heatmap visualizes negative log scaled adjusted p-values of different directionality classes. Non-directional p-values are generated based on gene-level statistics alone without considering the expression direction. The mixed-directional p-values are calculated using subset of gene-level statistics of up and down-regulated genes respectively for mixed-directional up and down. Distinct directional up and distinct directional down p-values are calculated from gene statistics with expression direction. The first column annotation represents directionality of pathways and second column annotation denotes corresponding differential expression analysis. (E) Venn diagram showing commonly dysregulated pathways in patients transcriptomics and cell line proteomics. (F) Schematic diagram of the glycolysis and glutaminolysis and targeted drugs. (G) Metabolic control of viral replication in vitro. Fold change of the CCHFV L-gene following infection and treatment of 2-DG and DON at indicated concentrations compared to untreated in SW13 cells and Huh7 cells. A two-tailed paired Student t-test was performed, and p values are mentioned.
Figure 4—figure supplement 1

Quantitative proteomics of the Huh7 with 4 MOI infection 24hpi and comparisons with the 1 MOI infection indicated 2452 proteins were common that were significantly dysregulated.
Protein set enrichment analysis identified 33 pathways that were dysregulated where the top pathways remain unchanged.
Figure 5 with 1 supplement
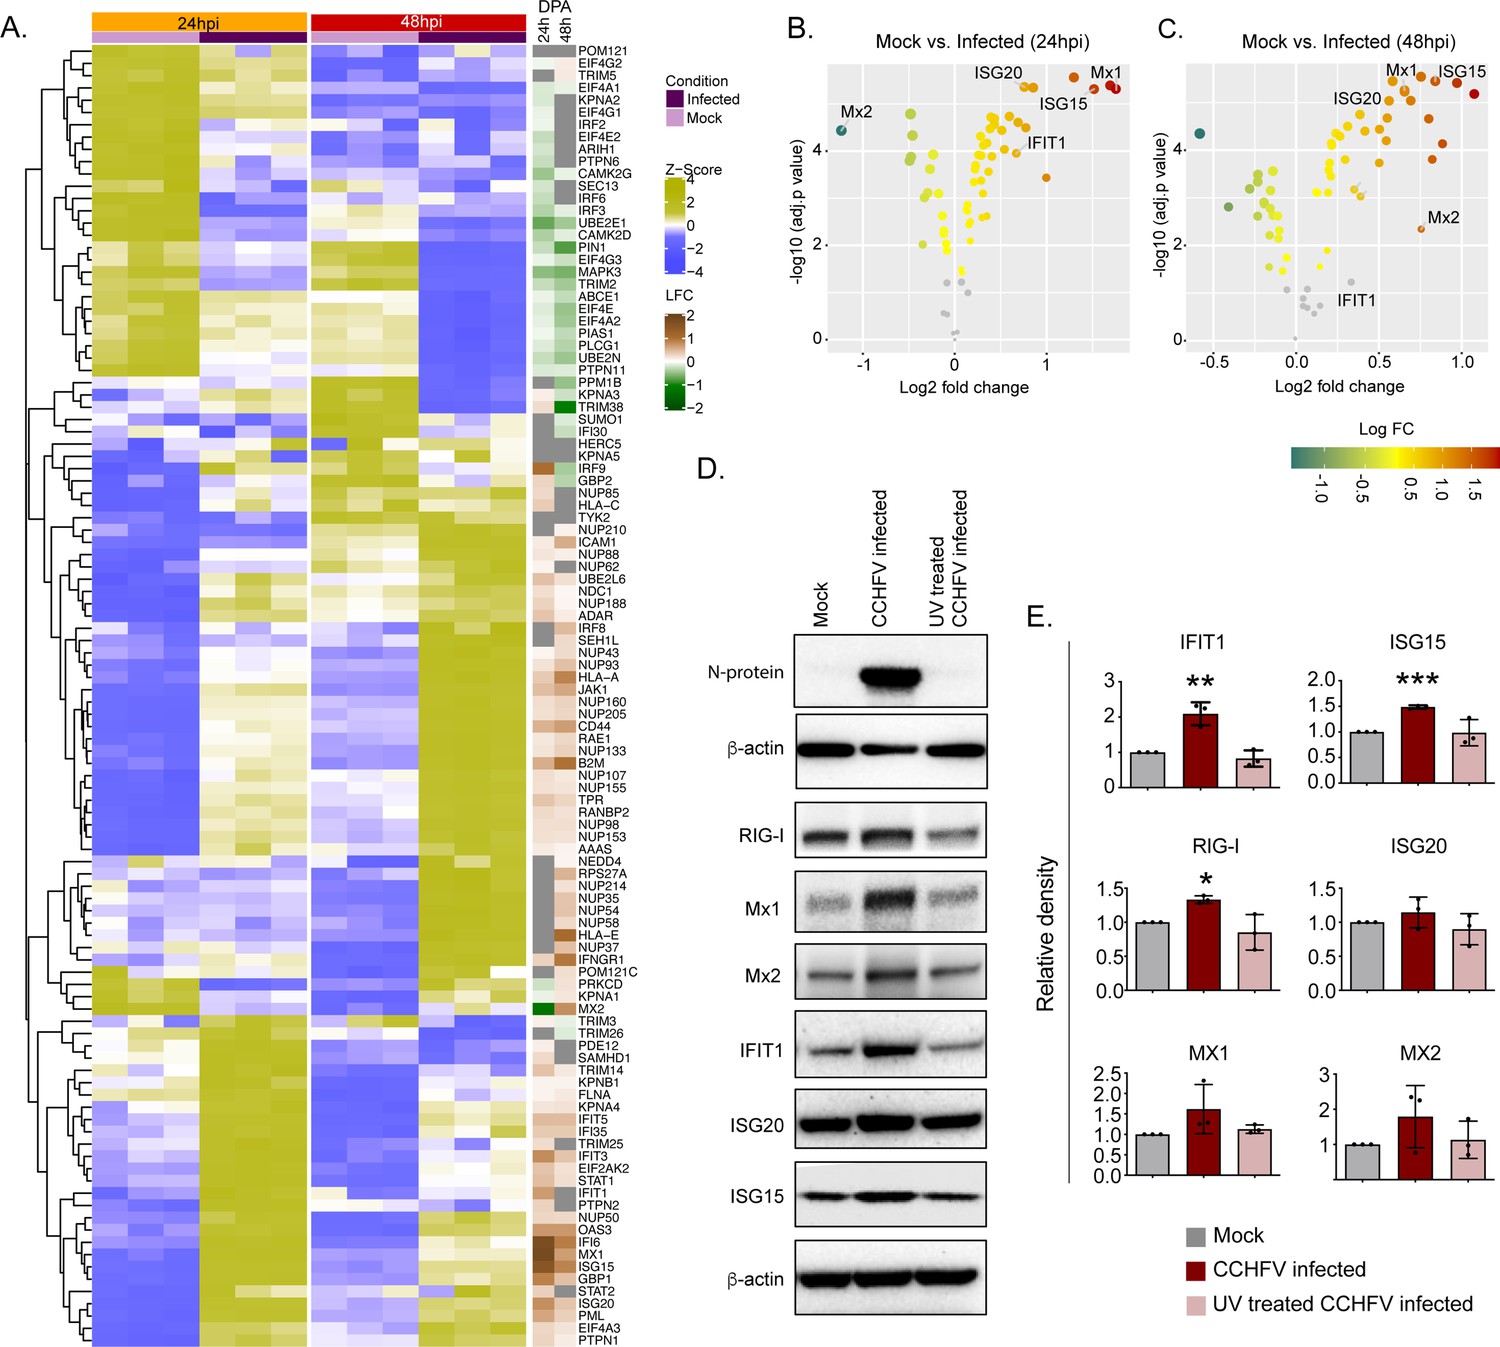
Temporal dynamics of interferon stimulating genes (ISGs).
(A) Heatmap of Z-score transformed expression values of proteins belonging to the cellular response to IFN signaling pathways in Mock-infected and CCHFV-infected Huh7 cells at 24hpi and 48hpi as identified in proteomics. The log-2-fold change in the genes corresponding to the indicated proteins identified in our patient transcriptomics data (recovered vs acute) is shown under the column name RNASeq. (B and C) Volcano plot of ISGs visualizing the expression status of Mock-infected and CCHFV-Infected samples at (B) 24hpi and (C) 48hpi. The size and color gradients of the dots correspond to the adjusted P values of differential expression analysis and the log2 fold change, respectively. (D) Representative western blots illustrate the indicated ISGs in Mock-infected, CCHFV-infected, and UV-inactivated CCHFV-infected Huh7 cells at 48hpi. ISG20 antibody gave a specific band at approx. 40 kDa without any non-specific band in the membrane that was cut at 50 kDa in the top. (E) The densitometric intensity of the bands was quantified using Fiji (ImageJ) software. The intensity of the individual bands was first normalized to the respective β-actin loading control and further relative normalization with respect to the mock-infected control was done. The bars are represented as means ± SD of three independent experiments. A two-tailed paired Student t-test was performed, and p values are represented as *p < 0.05, **p < 0.01 and ***p < 0.001.
-
Figure 5—source data 1
Raw western blot images.
- https://cdn.elifesciences.org/articles/76071/elife-76071-fig5-data1-v1.zip
Figure 5—figure supplement 1
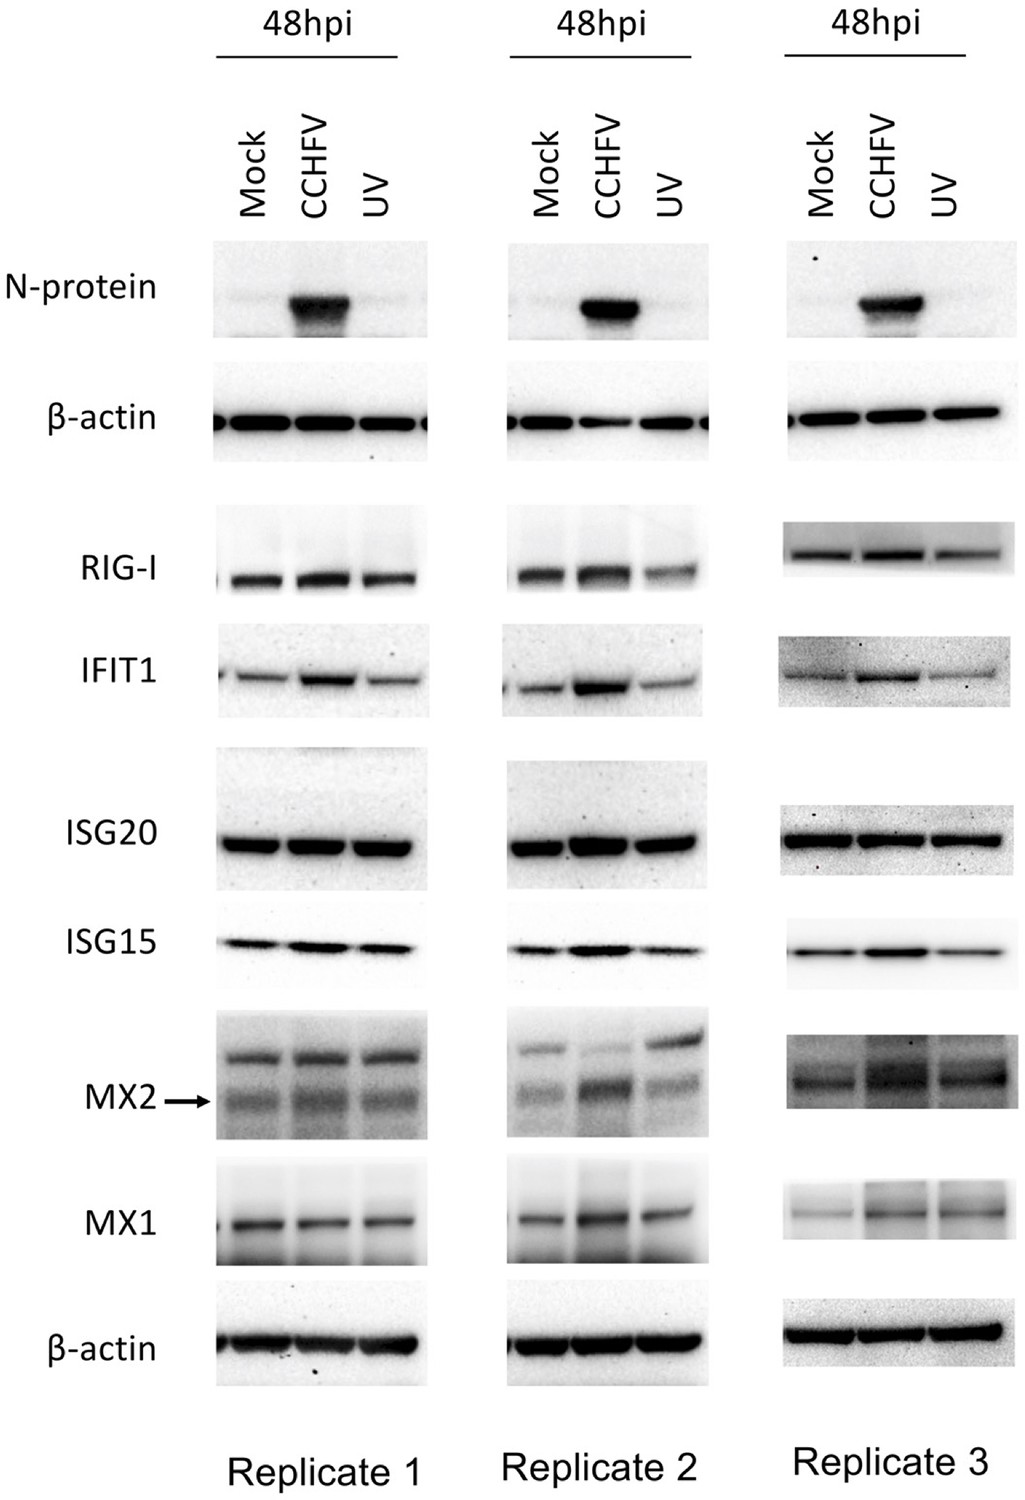
Western blot Images of ISGs (RIG-I, IFIT1, Mx1, Mx2, ISG20, ISG15), CCHFV-N protein and β-actin at 48hpi from three experimental replicates.
Author response image 1
Tables
Table 1
The CCHF patient characteristics.
| PID | Age | Gender | The date of symptoms onset | The date of hospitalization | Time to hospitalization (days) | The date of the first sampling | The date of the second sampling | SGS score | Severity group** | Rt-pcr | CT-values | Anti-CCHFV IgM | Outcome |
|---|---|---|---|---|---|---|---|---|---|---|---|---|---|
| P01 | 33 | Female | 30 May 2017 | 03 June 2017 | 4 | 03 June 2017 | 05 July 2018 | 5 | 1 | Positive | 31,85 | ND | Survived |
| P02 | 18 | Male | 06 June 2017 | 12 June 2017 | 6 | 12 June 2017 | ND | 7 | 2 | Positive | 25,89 | positive | Survived |
| P03 | 45 | Male | 12 June 2017 | 13 June 2017 | 1 | 14 June 2017 | 01 July 2018 | 0 | 1 | Positive | 21,87 | ND | Survived |
| P04 | 67 | Male | 13 June 2017 | 16 June 2017 | 3 | 17 June 2017 | 05 July 2018 | 8 | 2 | Positive | 22,38 | ND | Survived |
| P05 | 48 | Male | 12 June 2017 | 18 June 2017 | 6 | 19 June 2017 | 08 July 2018 | 7 | 2 | Positive | 29,79 | ND | Survived |
| P06 | 68 | Male | 13 June 2017 | 19 June 2017 | 6 | 20 June 2017 | 05 July 2018 | 5 | 1 | Positive | 28,41 | ND | Survived |
| P07 | 77 | Male | 19 June 2017 | 22 June 2017 | 3 | 23 June 2017 | 05 July 2018 | 6 | 2 | Positive | 24,77 | ND | Survived |
| P08 | 29 | Female | 20 June 2017 | 24 June 2017 | 4 | 25 June 2017 | 02 July 2018 | 6 | 2 | Positive | 26,91 | ND | Survived |
| P09 | 50 | Female | 20 June 2017 | 25 June 2017 | 5 | 26 June 2017 | 06 July 2018 | 4 | 1 | Positive | 26,36 | Positive | Survived |
| P10 | 35 | Female | 07 July 2017 | 12 July 2017 | 5 | 12 July 2017 | 04 July 2018 | 3 | 1 | negative | NA | Positive | Survived |
| P11 | 64 | Female | 15 July 2017 | 18 July 2017 | 3 | 19 July 2017 | ND | 10 | 2 | Positive | 22,46 | ND | Survived |
| P12 | 57 | Male | 16 July 2017 | 21 July 2017 | 5 | 22 July 2017 | 09 July 2018 | 9 | 2 | Positive | 20,81 | ND | Survived |
| P13 | 79 | Male | 22 July 2017 | 24 July 2017 | 2 | 24 July 2017 | ND | 11 | 3 | Positive | 22 | ND | Died |
| P14 | 36 | Male | 01 August 2017 | 06 August 2017 | 5 | 07 August 2017 | 04 July 2018 | 7 | 2 | Positive | 24,66 | ND | Survived |
| P15 | 62 | Male | 15 August 2017 | 20 August 2017 | 5 | 21 August 2017 | 06 July 2018 | 9 | 2 | Positive | 19,86 | ND | Survived |
| P16 | 48 | Male | 05 September 2017 | 07 September 2017 | 2 | 07 September 2017 | ND | 4 | 1 | Positive | 22,09 | ND | Survived |
| P17 | 55 | Male | 12 April 2018 | 17 April 2018 | 5 | 18 April 2018 | ND | 9 | 2 | Positive | 26,16 | ND | Survived |
| P18 | 44 | Female | 23 April 2018 | 27 April 2018 | 4 | 29 April 2018 | ND | 9 | 2 | Positive | 21,27 | ND | Survived |
-
ND: not determined; NA: not applicable; SGS: severity grading system; RT-PCR: real-time - polymerase chain reaction; CT: cycle threshold; CCHFV: Crimean-Congo hemorrhagic fever virus.
-
*
1: Low (0–5); 2: Intermediate (6-10); 3: High (11-16).
-
Table 1—source data 1
Severity grade scoring during hospitalization.
The symptoms onset and sampling time are marked.
- https://cdn.elifesciences.org/articles/76071/elife-76071-table1-data1-v1.xlsx
Additional files
-
Supplementary file 1
The DGE profile for the acute phase compared to the recovered phase in all patients.
- https://cdn.elifesciences.org/articles/76071/elife-76071-supp1-v1.xlsx
-
Supplementary file 2
Pathways significantly regulated by genes expressed at the acute infection phase compared to the recovered phase identified in PIANO.
- https://cdn.elifesciences.org/articles/76071/elife-76071-supp2-v1.xlsx
-
Supplementary file 3
Pathways significantly regulated by proteins in mock and CCHFV-treated Huh7 cells following 24hpi and 48hpi and time-series analysis identified in PIANO.
- https://cdn.elifesciences.org/articles/76071/elife-76071-supp3-v1.xlsx
-
Transparent reporting form
- https://cdn.elifesciences.org/articles/76071/elife-76071-transrepform1-v1.docx
-
Source data 1
Raw western blot images.
- https://cdn.elifesciences.org/articles/76071/elife-76071-data1-v1.zip
Download links
A two-part list of links to download the article, or parts of the article, in various formats.
Downloads (link to download the article as PDF)
Open citations (links to open the citations from this article in various online reference manager services)
Cite this article (links to download the citations from this article in formats compatible with various reference manager tools)
Multi-omics insights into host-viral response and pathogenesis in Crimean-Congo hemorrhagic fever viruses for novel therapeutic target
eLife 11:e76071.
https://doi.org/10.7554/eLife.76071


