Parasite defensive limb movements enhance acoustic signal attraction in male little torrent frogs
- CAS Key Laboratory of Mountain Ecological Restoration and Bioresource Utilization & Ecological Restoration and Biodiversity Conservation Key Laboratory of Sichuan Province, Chengdu Institute of Biology, Chinese Academy of Sciences, China
- Ministry of Education Key Laboratory for Ecology of Tropical Islands, Key Laboratory of Tropical Animal and Plant Ecology of Hainan Province, College of Life Sciences, Hainan Normal University, China
- Department of Ecological Sciences, Vrije Universiteit Amsterdam, De Boelelaan, Netherlands
Figures
Figure 1
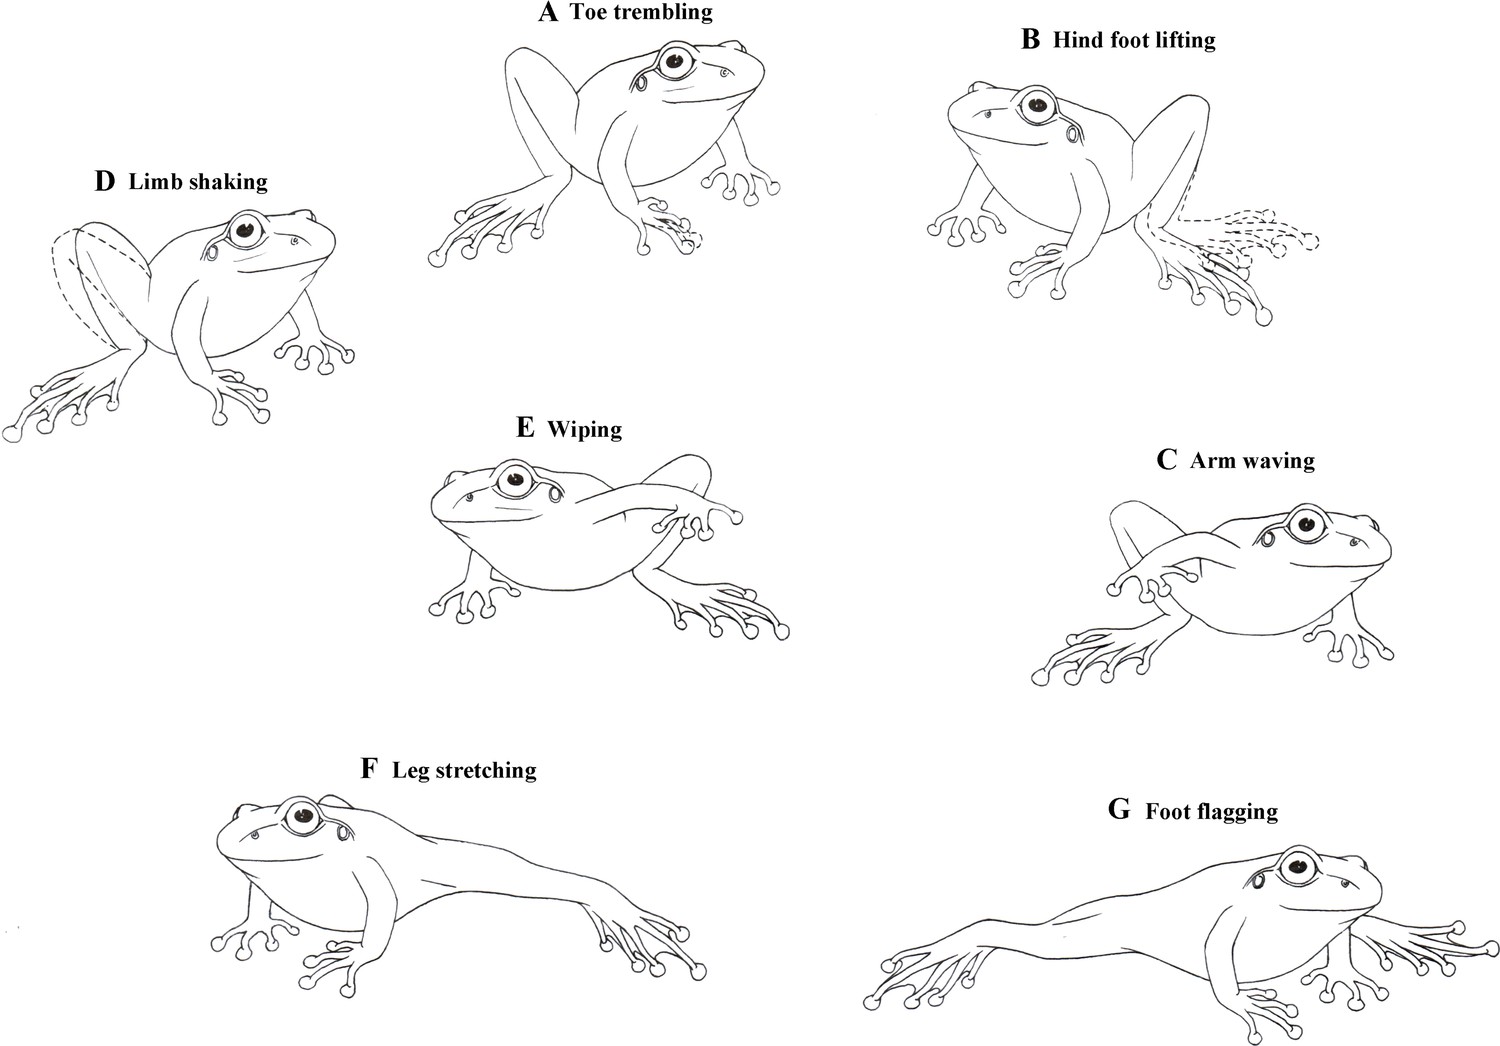
Diagrammatic drawings of seven limb motion displays shown by male little torrent frogs.
Figure 2
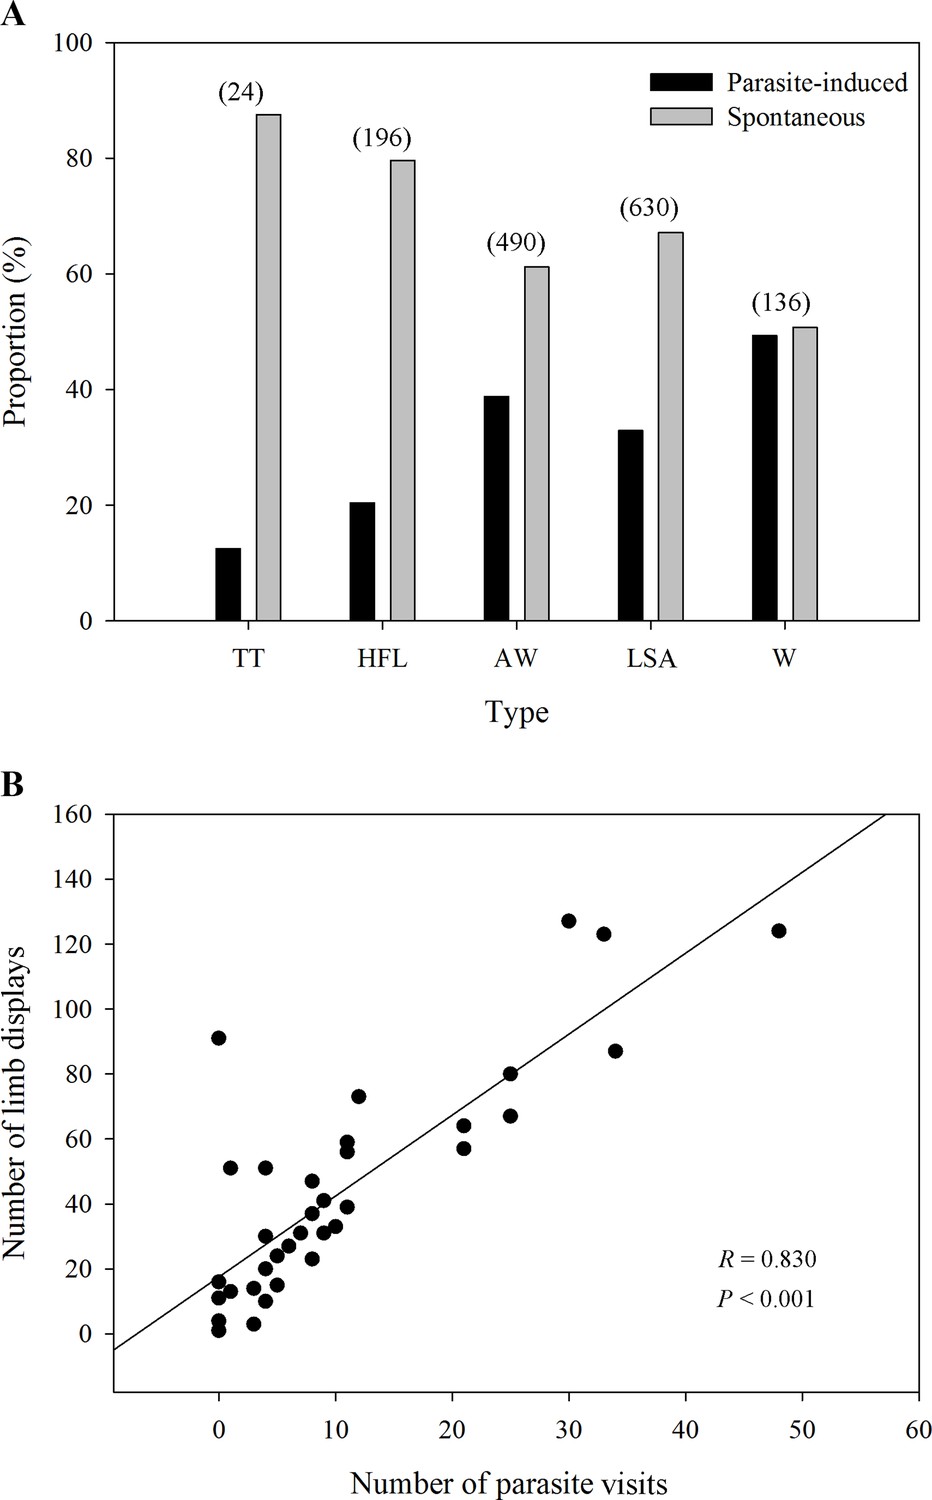
The proportion of different limb displays and the correlation between parasites and limb displays.
(A) The distribution ratio of parasite-induced and spontaneous displays in each limb movement (N=69 males). TT, toe trembling; HFL, hind foot lifting; AW, arm waving; LSA, limb shaking; W, wiping. The numbers in brackets above each bar pairs represent the number of each movement, showing the richness of those visual displays. (B) The relationship between parasite stress and the number of all limb movements (N=39 males). Black circles represent different individuals recorded in the field.
Figure 3
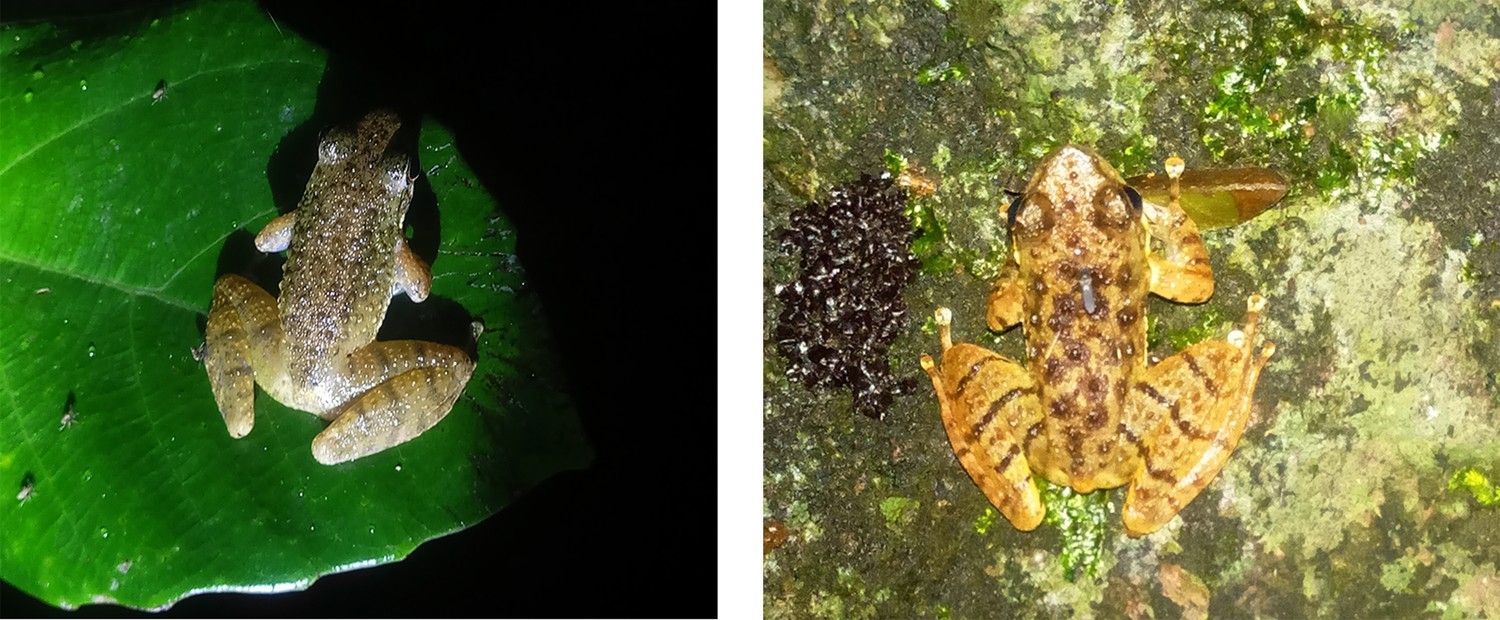
Photos of frogs being bitten by potential parasites.
Figure 4

Calling males (N=39) show more parasite-evoked limb movements than silent males (N=30).
AW, arm waving; W, wiping; LSA, limb shaking; HFL, hind foot lifting. *p < 0.05, ***p < 0.001. Black circles represent the extreme values of each group.
Figure 5
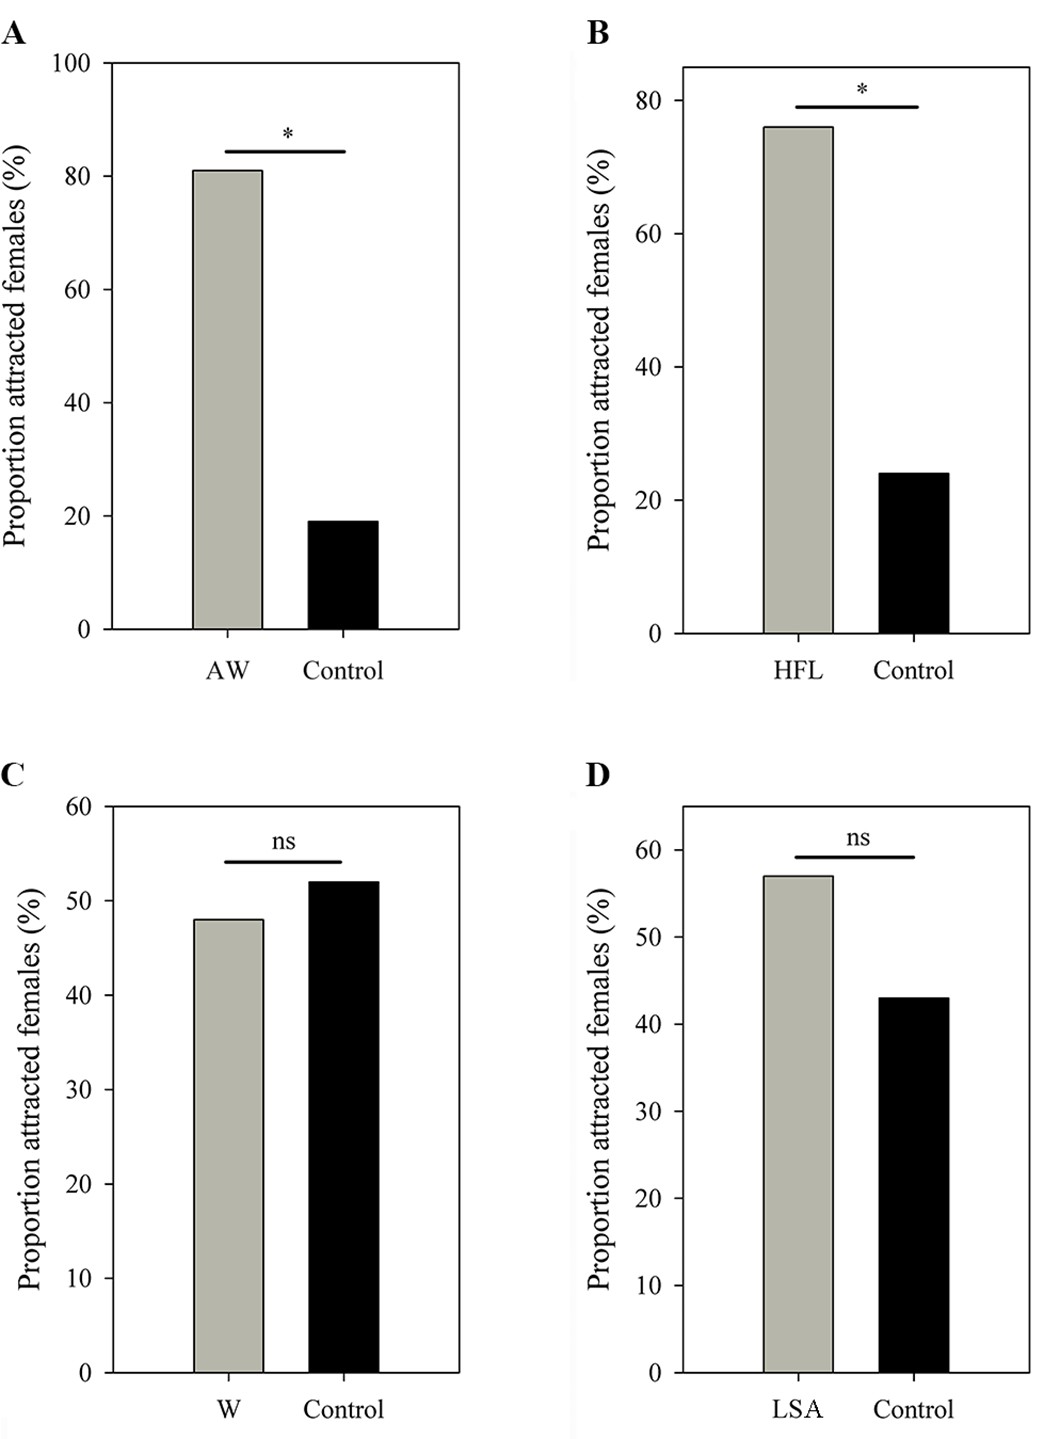
Female choices in (A) AW versus control, (B) HFL versus control, (C) W versus control, and (D) LSA versus control.
All limb display videos are accompanied by advertisement call and male movement, while the controls contain the same call and frog but in absence of limb movement. AW, arm waving; HFL, hind foot lifting; W, wiping; LSA, limb shaking. *p < 0.05. ns, not statistically significant.
Figure 6
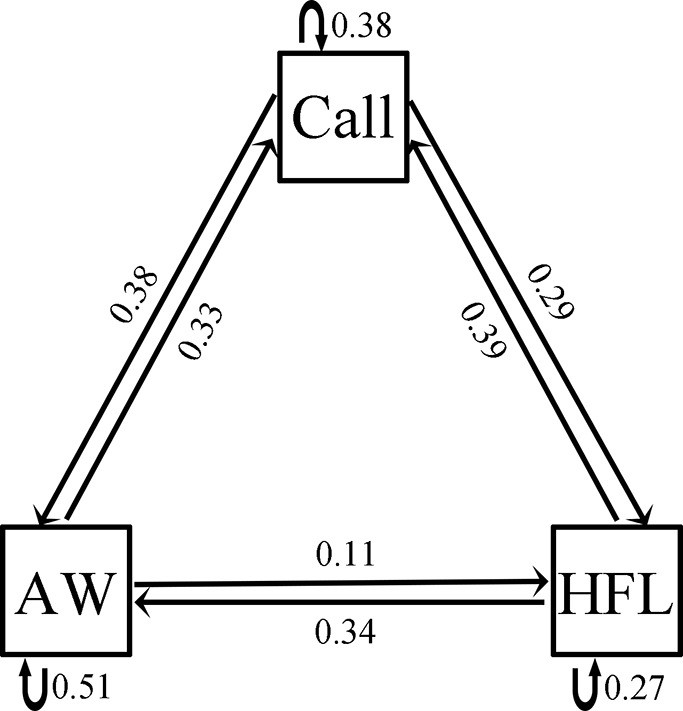
Transitional matrix between three behavioral units shown by male little torrent frogs.
Call, AW, and HFL represent advertisement call, arm waving, and hind foot lifting, respectively. Numbers next to lines and arrows indicate the transitional probabilities.
Figure 7
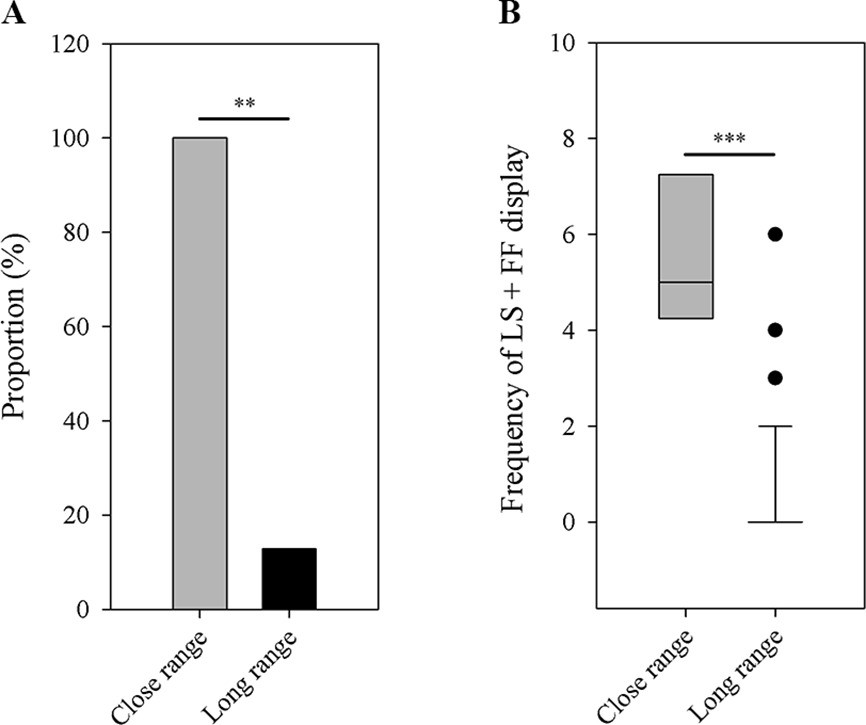
Differences between close-range group (N=4) and long-range group (N=39) in the number of male frogs that have the LS + FF movement (A) and the frequency of LS + FF display (B).
LS, leg stretching; FF, foot flagging. **p < 0.01, ***p < 0.001. Black circles in part B represent the extreme values of long-distance group.
Figure 8
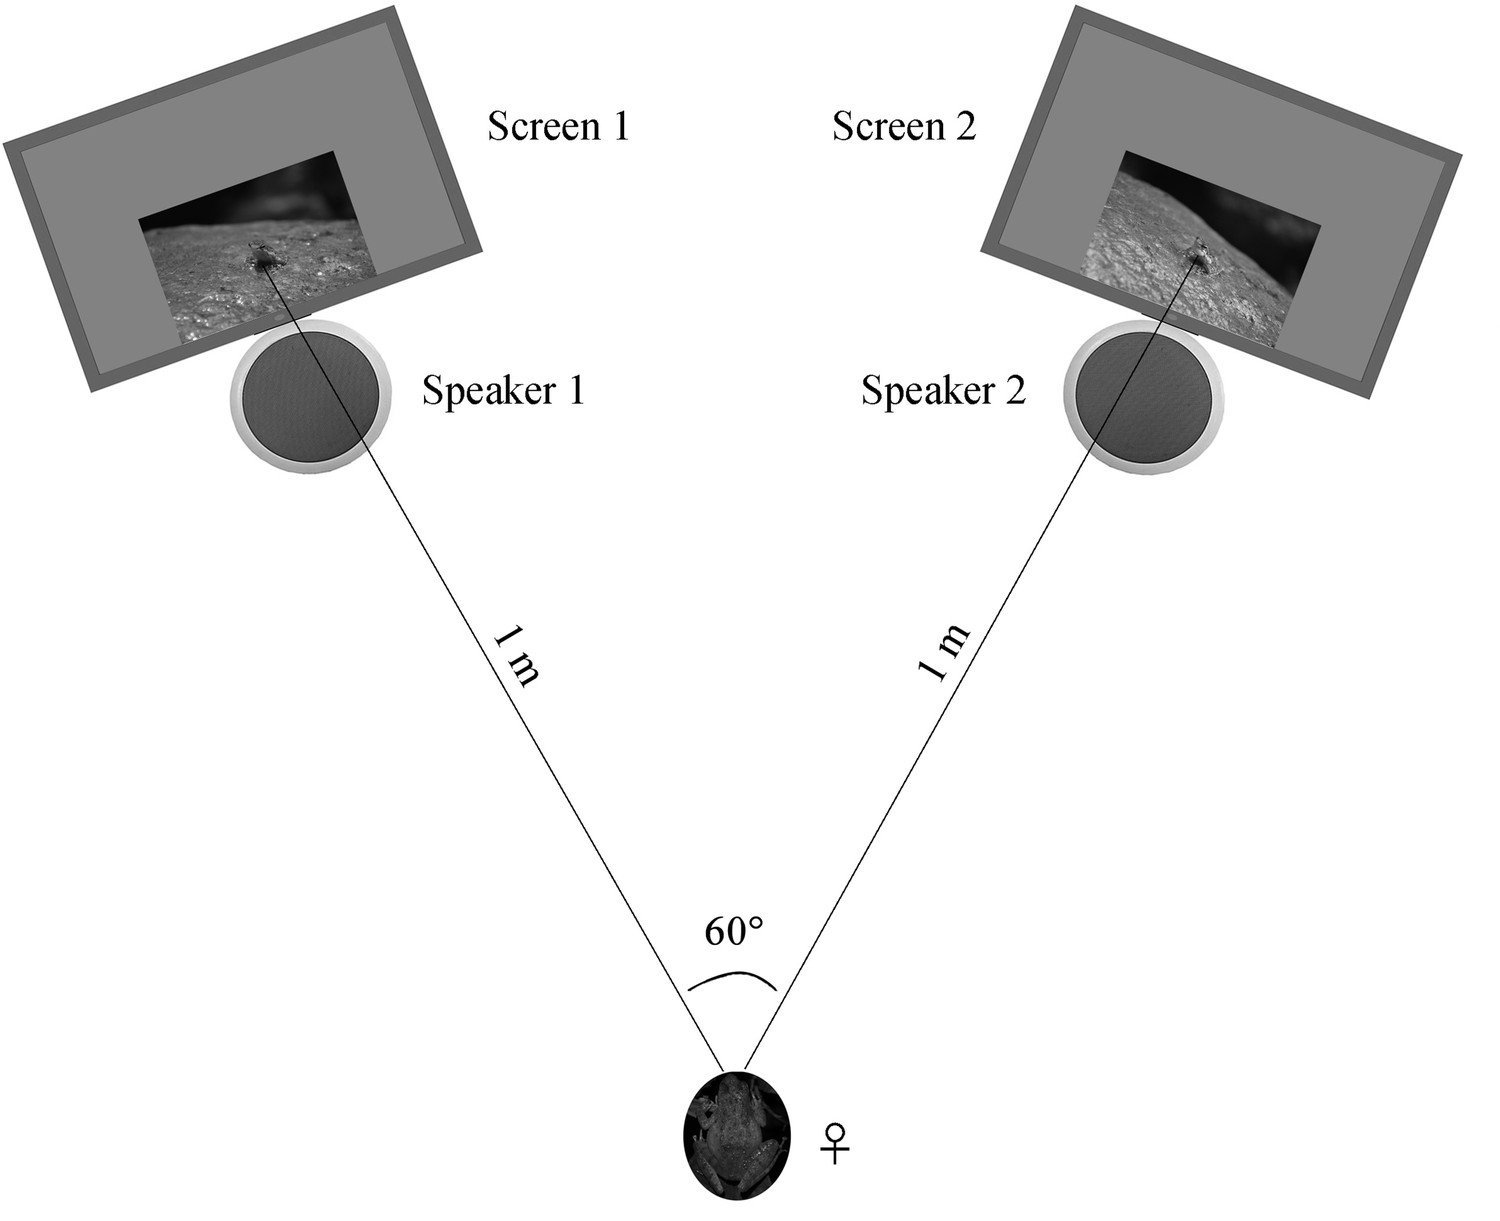
Schematic of the acoustic and visual playback arena.
The picture of the female frog represents the initial placement point for each playback test.
Videos
Video 1
Video that frog produces defensive motions in order to repel midges.
Video 2
Video that frog produces a movement toward a flying parasite.
Additional files
-
Supplementary file 1
Table S1.
The data of total (spontaneous and parasite-induced) and parasite-induced displays in each limb movement for calling males, silent males, and males that have females nearby.
- https://cdn.elifesciences.org/articles/76083/elife-76083-supp1-v2.docx
-
Supplementary file 2
Table S2.
Dyadic transition matrix of three behavioral units.
- https://cdn.elifesciences.org/articles/76083/elife-76083-supp2-v2.docx
-
Transparent reporting form
- https://cdn.elifesciences.org/articles/76083/elife-76083-transrepform1-v2.docx
Download links
A two-part list of links to download the article, or parts of the article, in various formats.
Downloads (link to download the article as PDF)
Open citations (links to open the citations from this article in various online reference manager services)
Cite this article (links to download the citations from this article in formats compatible with various reference manager tools)
Parasite defensive limb movements enhance acoustic signal attraction in male little torrent frogs
eLife 11:e76083.
https://doi.org/10.7554/eLife.76083


