A point mutation in the nucleotide exchange factor eIF2B constitutively activates the integrated stress response by allosteric modulation
- Howard Hughes Medical Institute, University of California at San Francisco, United States
- Department of Biochemistry and Biophysics, University of California at San Francisco, United States
- Chan Zuckerberg Biohub, United States
Figures
Figure 1 with 1 supplement
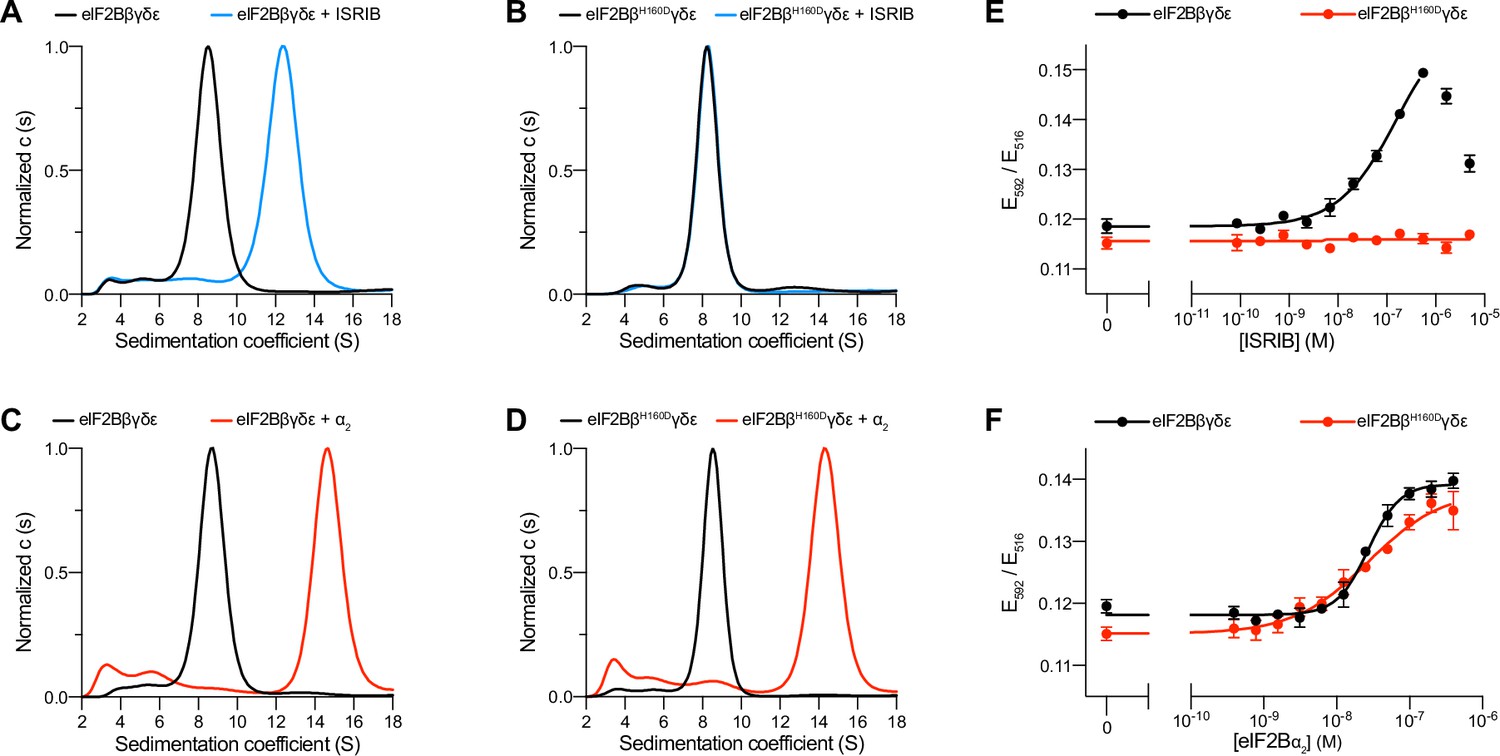
The eIF2B βH160D mutation prevents octamer assembly but not decamer assembly.
(A–D) Characterization by analytical ultracentrifugation (sedimentation velocity) of (A) 500 nM eIF2Bβδγε ± 1 μM ISRIB, (B) 500 nM eIF2BβH160Dδγε ± 1 μM ISRIB, (C) 500 nM eIF2Bβδγε ± 500 nM eIF2Bα2, and (D) 500 nM eIF2BβH160Dδγε ± 500 nM eIF2Bα2. The eIF2Bβδγε tetramer sediments with a sedimentation coefficient of ~8 S, the eIF2B(βδγε)2 octamer at ~12 S, and the eIF2B(αβδγε)2 decamer at ~14 S. (E–F) FRET signal (E592/E516) measured after 1 hr of eIF2Bβδγε-F tetramers incubation with (E) ISRIB or (F) eIF2Bα2. For assembly by ISRIB, WT EC50 = 170 ± 25 nM. For assembly by eIF2Bα2, WT EC50 = 29 ± 3 nM and βH160D EC50 = 33 ± 3 nM. WT and βH160D eIF2Bβδγε-F tetramers at 50 nM throughout. For (E,F), representative replicate averaging four technical replicates are shown. Biological replicates: n = 3. All error bars and ‘±’ designations are s.e.m.
-
Figure 1—source data 1
Raw data for AUC and FRET experiments.
Sed Coeff = sedimentation coefficient.
- https://cdn.elifesciences.org/articles/76171/elife-76171-fig1-data1-v2.xlsx
Figure 1—figure supplement 1
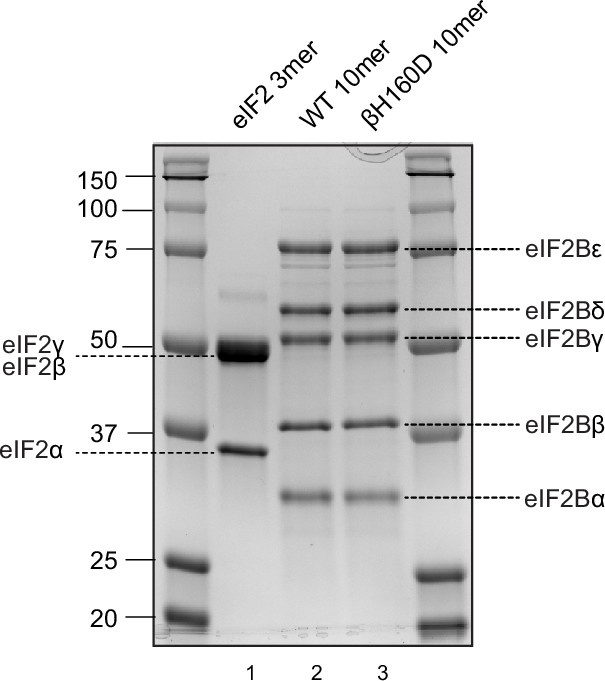
Coomassie-stained gel of purified proteins used in this study.
Human eIF2 trimer was purified from mammalian cells (HEK293) (lane 1). Wild type (WT) and βH160D eIF2B decamers (lane 2 and 3, respectively) were assembled from their respective tetramer (eIF2Bβδγε) and α-dimer (eIF2Bα2), both purified from Escherichia coli.
-
Figure 1—figure supplement 1—source data 1
Original image file for SDS-PAGE gel.
- https://cdn.elifesciences.org/articles/76171/elife-76171-fig1-figsupp1-data1-v2.zip
Figure 2 with 1 supplement
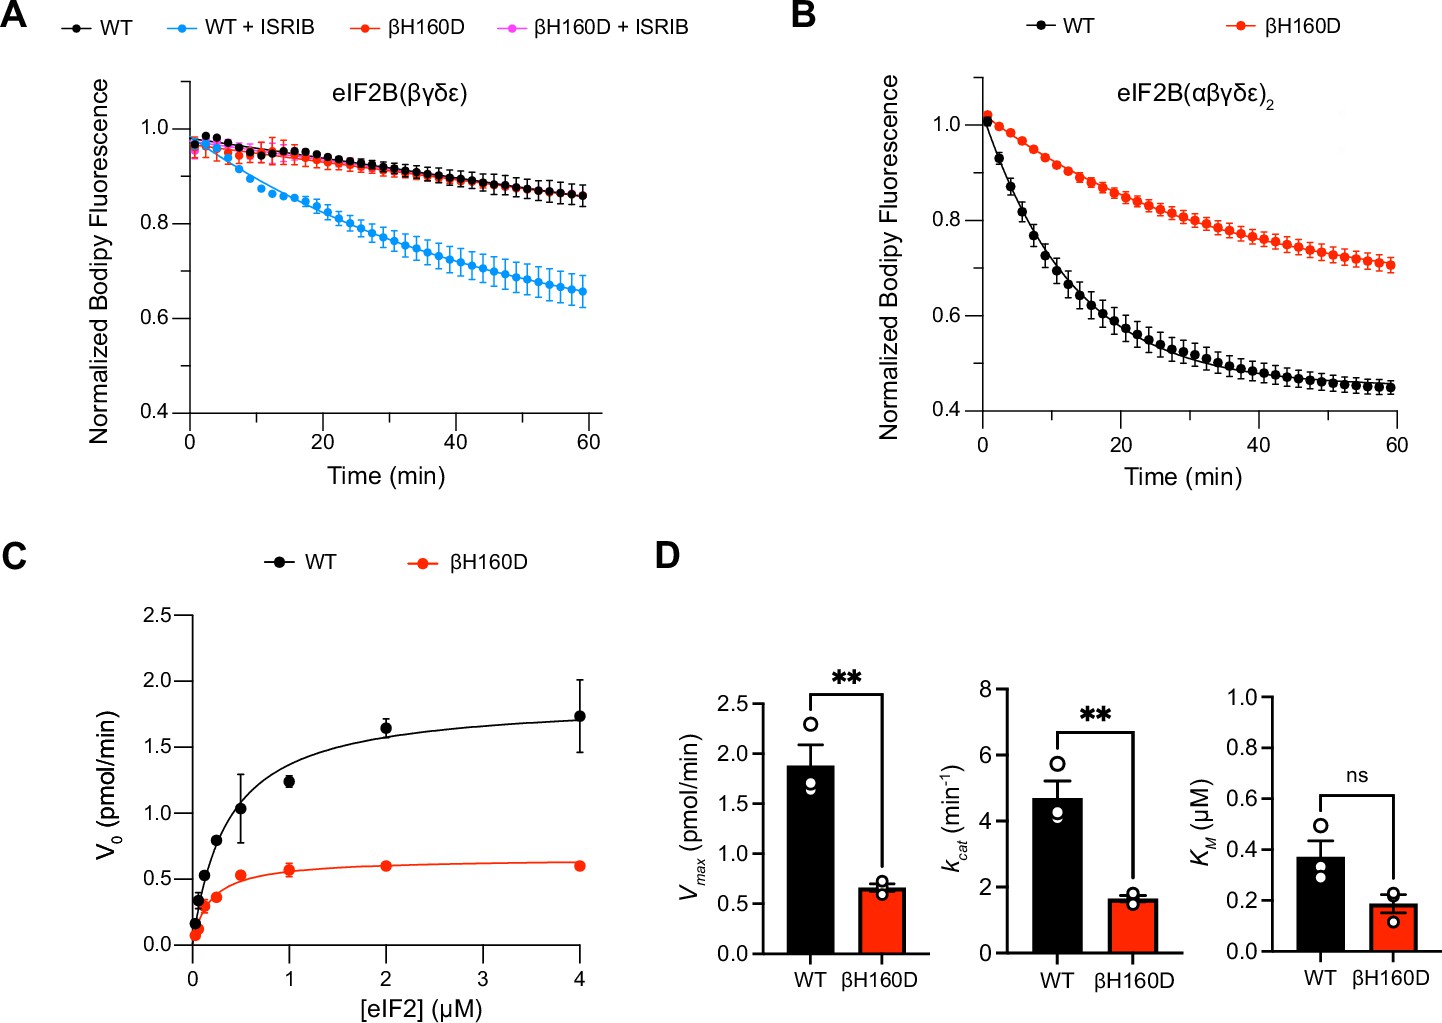
The βH160D mutation impairs nucleotide exchange by the eIF2B holoenzyme.
(A,B) GEF activity of eIF2B as assessed by BODIPY-FL-GDP exchange on eIF2 using (A) eIF2B tetramer (100 nM) and (B) eIF2B decamer (10 nM). For (A), ISRIB only stimulates eIF2B guanine nucleotide exchange (GEF) activity for the WT tetramer (t1/2 = 31.1±1.47 min). In (B), the βH160D decamer has lower GEF activity (t1/2 = 23.57 ± 0.82 min) than WT decamer (t1/2 = 9.28 ± 0.96 min). (C) Michaelis–Menten fit of the initial velocity of eIF2B-catalyzed nucleotide exchange as a function of eIF2 concentration (10 nM eIF2B decamer throughout). (D) Kinetic parameters of the Michaelis–Menten fit. βH160D decamers have ~threefold reduced intrinsic enzymatic activity (WT Vmax = 1.86 ± 0.13 pmol min–1; βH160D Vmax = 0.66 ± 0.03 pmol min–1; two-sided t-test p=0.0045) and turnover number (WT kcat = 4.70 ± 0.52 min–1; βH160D kcat = 1.65 ± 0.10 min–1; two-sided t-test p=0.0045). The KM is not significantly different (WT KM = 0.36 µM ± 0.09 µM; βH160D KM = 0.18 ± 0.03 µM; two-sided t-test p=0.07). Biological replicates: n = 2 for (A), and n = 3 for (B–D). All error bars and ‘±’ designations are s.e.m.
-
Figure 2—source data 1
Raw data for nucleotide exchange assays.
- https://cdn.elifesciences.org/articles/76171/elife-76171-fig2-data1-v2.xlsx
Figure 2—figure supplement 1
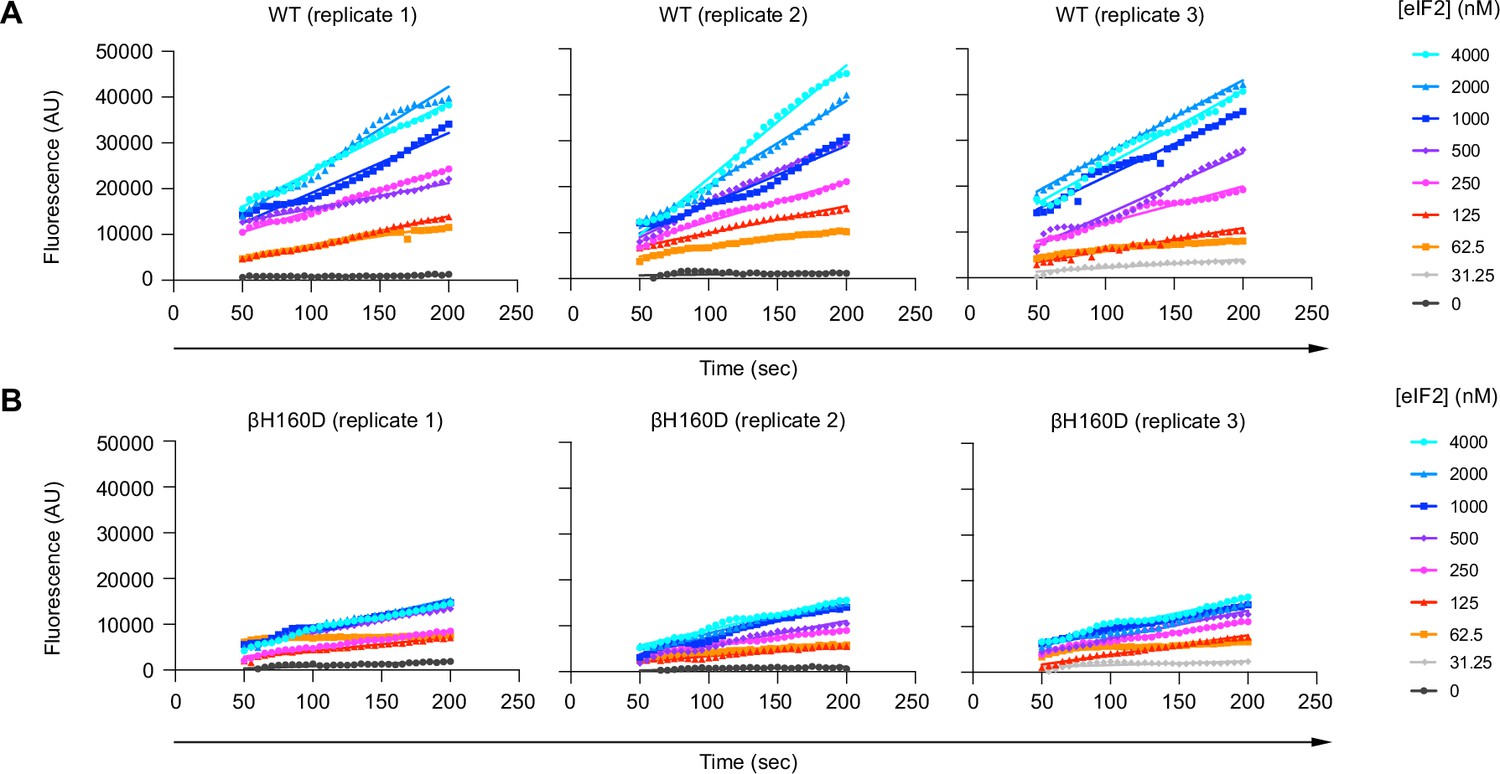
The βH160D mutation decreases the initial velocity of eIF2B’s guanine nucleotide exchange factor (GEF) activity.
BODIPY-FL-GDP loading onto the eIF2 substrate by (A) WT and (B) βH160D eIF2B decamer at varying eIF2 concentrations. Initial velocity was determined by a linear fit to time points acquired from 50 to 200 s after addition of eIF2B. Individual replicates are shown. AU: arbitrary units.
-
Figure 2—figure supplement 1—source data 1
Raw data for Michaelis–Menten analysis of nucleotide exchange at various eIF2 concentrations.
Rep: replicate.
- https://cdn.elifesciences.org/articles/76171/elife-76171-fig2-figsupp1-data1-v2.xlsx
Figure 3 with 1 supplement
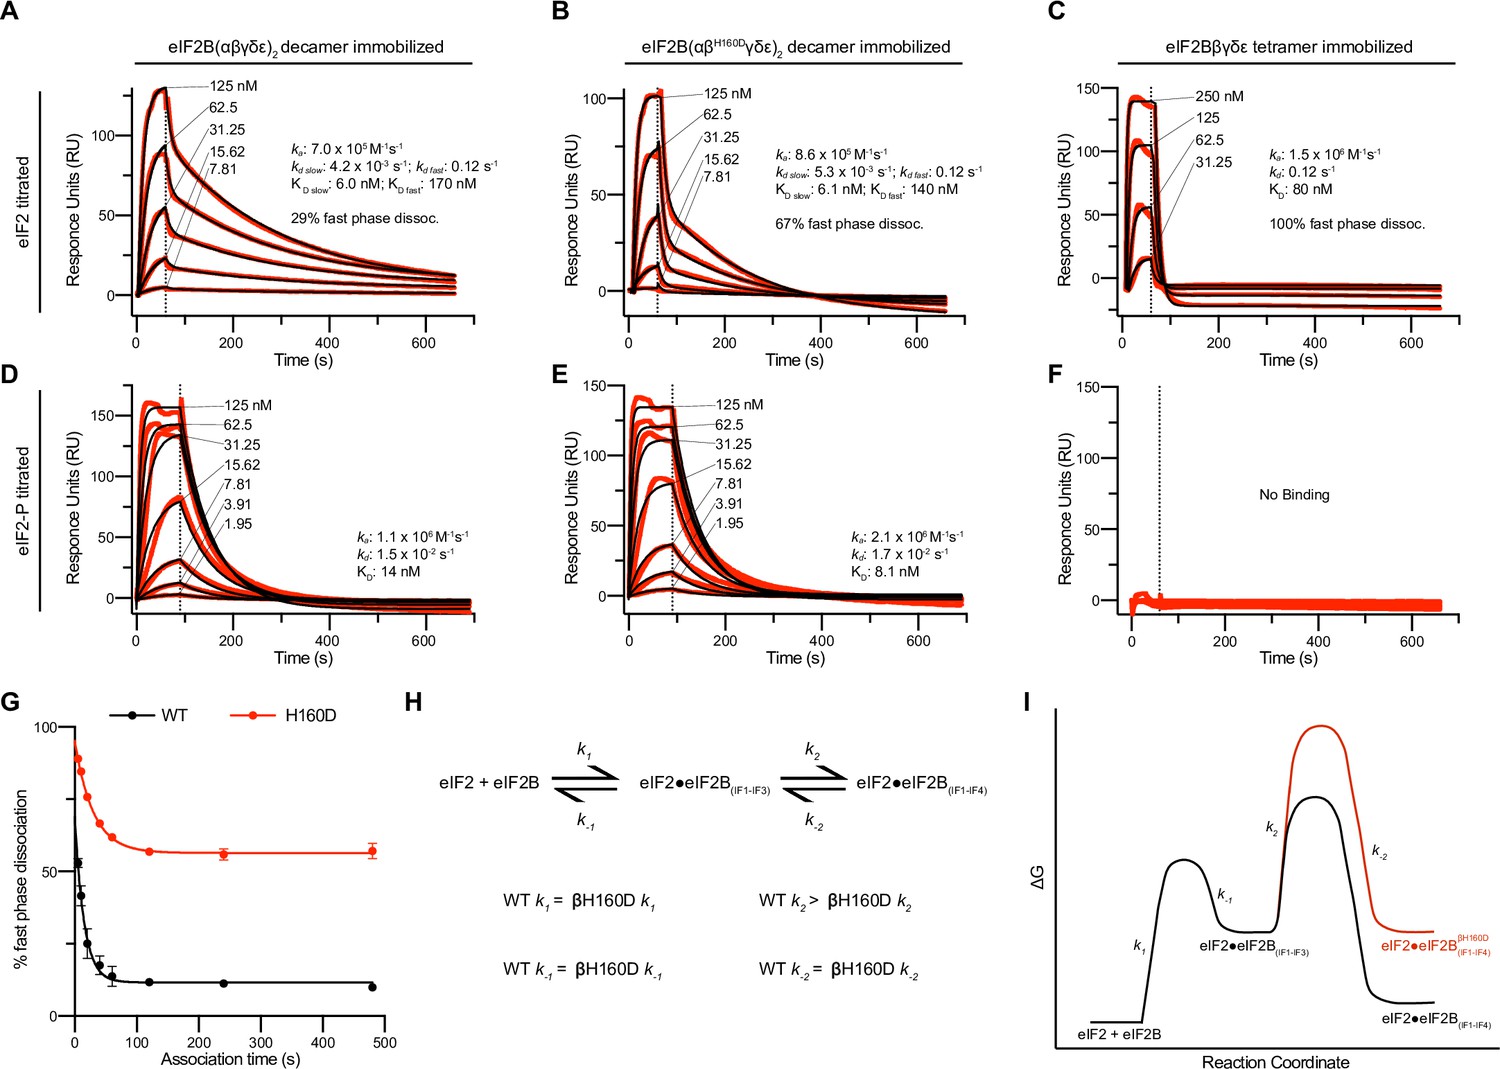
Substrate (eIF2) binding to eIF2B is compromised by the βH160D mutation.
(A–F) Surface plasmon resonance (SPR) of immobilized (A and D) WT eIF2B decamer, (B and E) βH160D eIF2B decamer, and (C and F) WT eIF2B tetramer binding to 2-fold titrations of (A–C) eIF2 or (D–F) eIF2-P. For WT eIF2B decamer and βH160D eIF2B decamer, eIF2Bα was Avi-tagged and biotinylated. For WT eIF2B tetramer, eIF2Bβ was Avi-tagged and biotinylated. Binding was modeled as one-phase association for (A–E), two-phase dissociation for (A–B), and one-phase dissociation for (C–E). (G) SPR of immobilized WT eIF2B decamer and βH160D eIF2B decamer was performed with eIF2 at 62.5 nM throughout and varied association time from 5 to 480 s. The dissociation kinetics were then modeled (individual traces shown in Figure 3—figure supplement 1) and from this data percent fast phase dissociation was plotted as a function of association time with a single exponential fit. WT t1/2 = 10.4 s; βH160D t1/2 = 20.7 s. Percent fast phase dissociation is always higher for βH160D decamers vs. WT decamers and reaches an equilibrium at ~55% fast phase dissociation for βH160D decamers and ~11% fast phase dissociation for WT decamers. (H) Model reaction scheme of eIF2 engagement with eIF2B. k1, k-1, and k-2 each are comparable for WT and βH160D decamers but WT k2 > βH160D k2. Based on the SPR data in Figure 3A–C, k1 ~ 7.0 x 10⁵ M–1s–1 and k-1 ~0.12 s–1. k-2 is calculated under the assumption that slow phase dissociation represents the combination of k-1 and k-2 dissociation. k-1 is fast phase dissociation, so k-1 = kdd fast. Hence from k-1 * k-2 = kdd slow we get that 0.12 s–1 * k-2 = 5.3 x 10⁻³ s–1. Therefore k-2 ~0.044 s–1. (I) Free energy profile of eIF2 engagement with eIF2B either in the WT (black) or βH160D (black then red) context. Initial 3 interface engagement is energetically the same for either WT or βH160D, but engagement with the 4th interface is disfavored in the βH160D mutant. The free energy profile is drawn at sub saturating conditions. Given the percent fast phase vs slow phase dissociation at equilibrium in Figure 1G we know that for WT, [eIF2•eIF2B(IF1-IF4)]/[eIF2•eIF2B(IF1-IF3)] ~ 8 while for βH160D [eIF2•eIF2B(IF1-IF4)]/[eIF2•eIF2B(IF1-IF3)] ~ 1. For (G), n = 3 biological replicates. All error bars and ‘±’ designations are s.e.m.
-
Figure 3—source data 1
Raw data for SPR assays.
- https://cdn.elifesciences.org/articles/76171/elife-76171-fig3-data1-v2.xlsx
Figure 3—figure supplement 1

The βH160D mutation increases the fraction of eIF2 molecules that bind and then dissociate with fast phase kinetics.
(A and B) Representative dissociation phase SPR traces for eIF2 binding to (A) WT eIF2B decamer or (B) βH160D eIF2B decamer after variable association times ranging from 5 to 480 s. Curves were normalized to maximal signal at the beginning of the dissociation phase. For (A–B), n = 3 biological replicates. All error bars and ‘±’ designations are s.e.m.
-
Figure 3—figure supplement 1—source data 1
Raw data for eIF2 binding assessed by SPR using varying association times.
Dissoc = dissociation.
- https://cdn.elifesciences.org/articles/76171/elife-76171-fig3-figsupp1-data1-v2.xlsx
Figure 4 with 5 supplements

Overall architecture of eIF2BβH160D.
(A) Atomic model of eIF2BβH160D decamer (yellow) superimposed into the cryo-EM map (gry), showing the overall structure of the molecule. (B) Overlay of the eIF2BβH160D structure to the eIF2B-eIF2 structure (PDB ID: 6O81) shows a 3.5° hinge movement between the two eIF2B halves. eIF2BβH160D is shown in gold; eIF2B in the eIF2B-eIF2 structure in blue; eIF2 in red.
Figure 4—figure supplement 1

Cryo-EM data analysis of the eIF2BβH160D structure.
(A) Representative micrograph showing the quality of data used for the final reconstruction of the eIF2BβH160D structure. (B) Data processing scheme of the eIF2BβH160D structure. (C) Fourier shell correlation (FSC) plots of the 3D reconstructions of eIF2BβH160D unmasked (dark blue), masked (orange). (D) Orientation angle distribution of the eIF2BβH160D reconstruction. (E) Local resolution map of the eIF2BβH160D structure. (F) Electron microscopy maps of different regions of the eIF2BβH160D structure showing the quality of the data and the fit of the model.
Figure 4—figure supplement 2
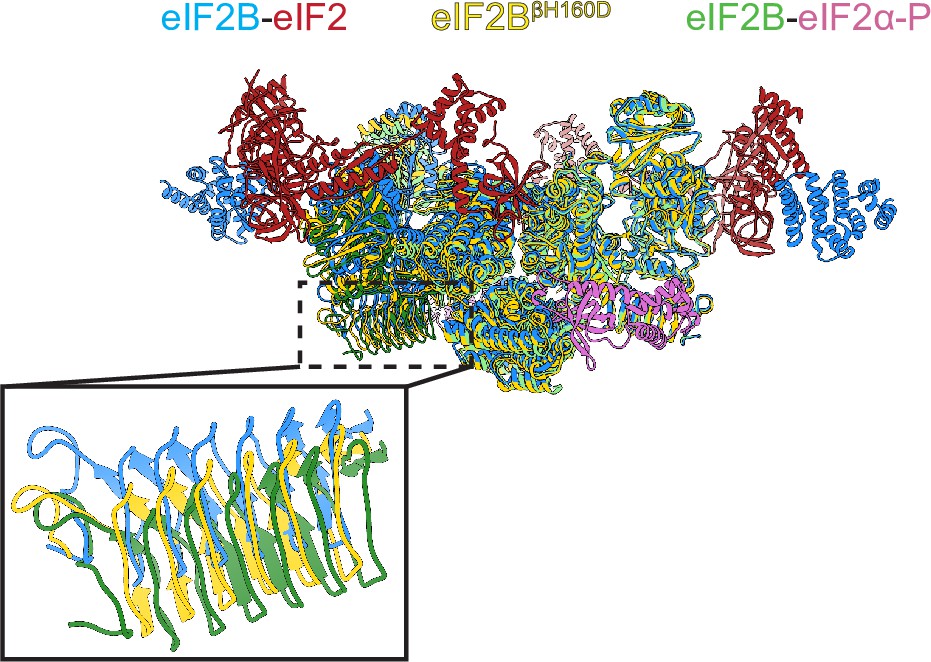
Structure overlay of the A and I state models.
Overlay of the A-state model (eIF2-eIF2B complex, PDB ID: 6O81) (blue), the I-State model (eIF2α-P-eIF2B complex, PDB ID: 6O9Z) (green) and the I-State like model (eIF2BβH160D) (yellow) showing the rocking motion between the two tetrameric halves. The inset shows a zoom-in view of the β-solenoid domain (residues 342–466) of eIF2Bε. Compared to the βH160D mutation, eIF2α-P binding causes a greater rocking motion in eIF2B.
Figure 4—figure supplement 3
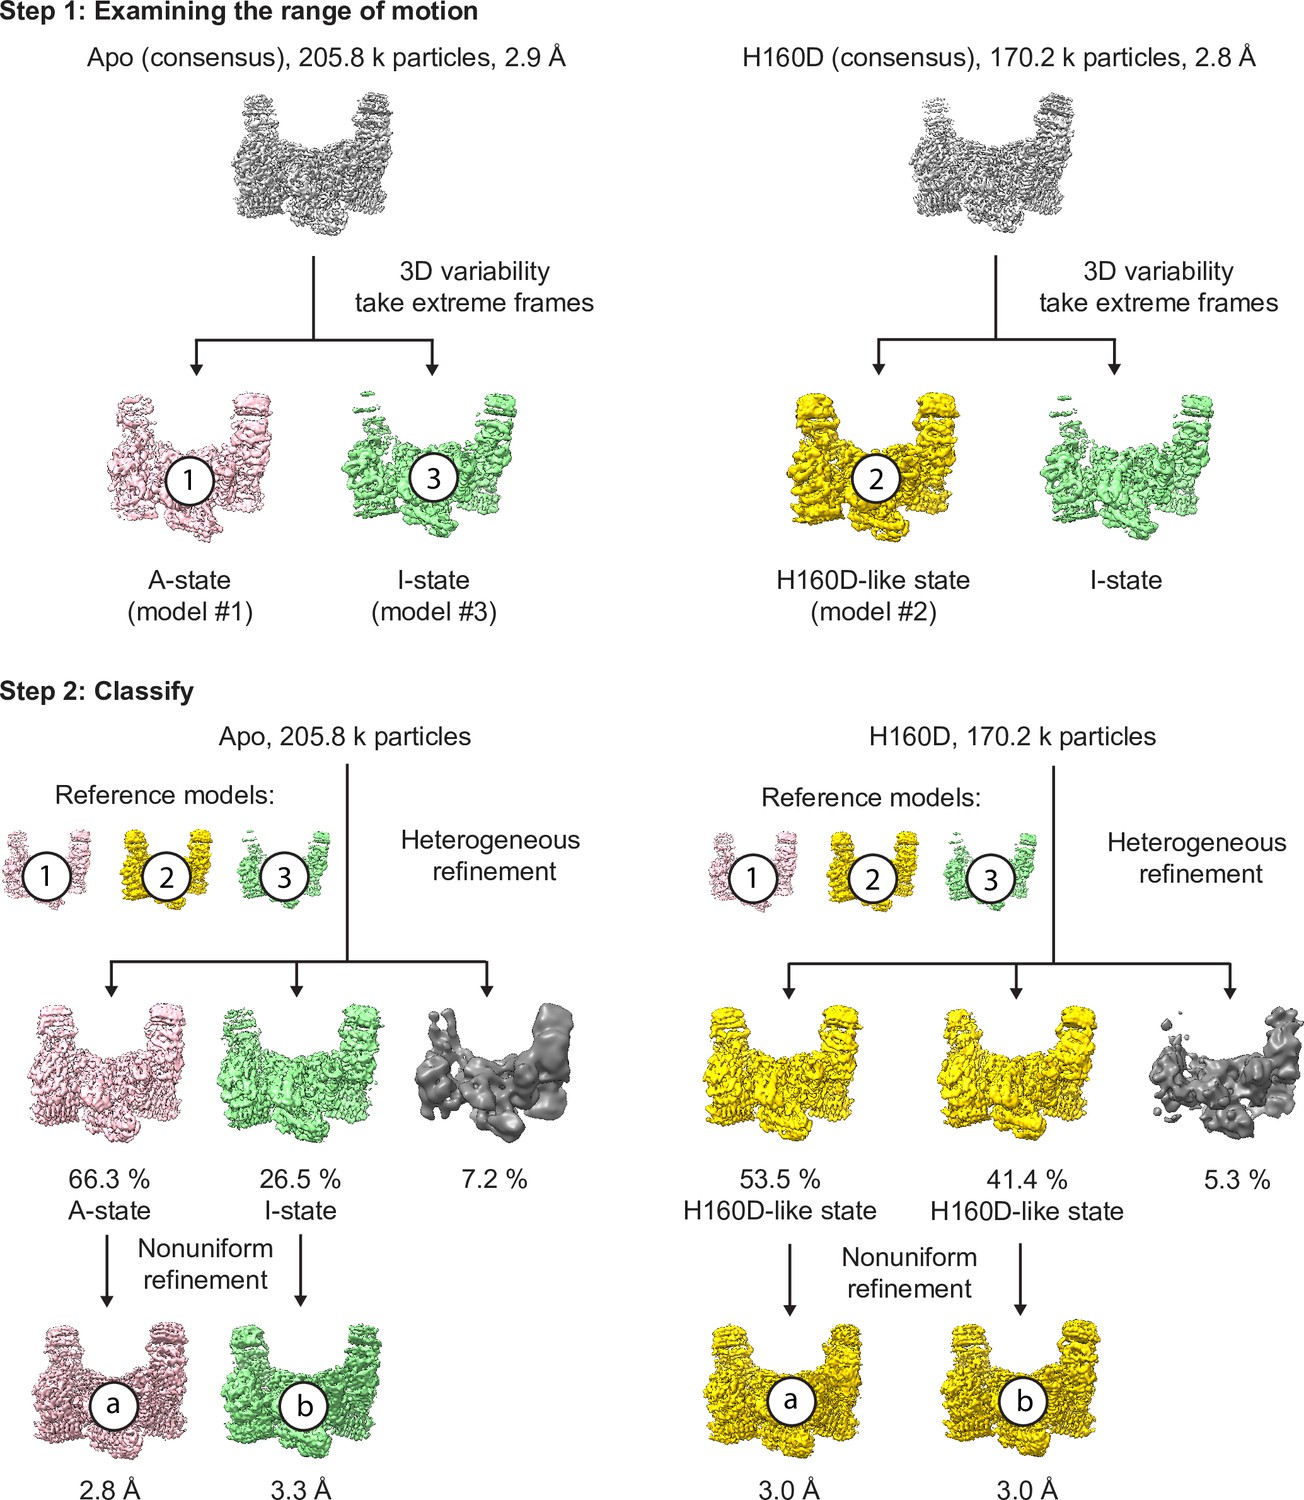
Cryo-EM analysis of the conformation and dynamics of the WT decamer and the βH160D decamer – part 1.
To understand how the βH160D mutation affects the conformation and dynamics of the eIF2B decamer, a multi-step analysis of the cryo-EM data was performed to compare the WT apo eIF2B decamer (abbreviated as ‘apo’; particles are from the consensus apo eIF2B structure Schoof et al., 2021a) to the βH160D decamer (abbreviated as ‘H160D’; particles are from the consensus H160D structure in the current study). In step 1, we performed 3D variability analysis in cryoSPARC for the apo vs the H160D to examine the range of rocking motion between the two tetrameric halves. Twenty frames were generated for each structure to represent snapshots of the motion. The first and the last frames represent the two extreme positions of this rocking motion. In the apo structure, the molecule rocks between a state that is very close to the classic A-state (number 1 in the figure) and a classic I-state (number 3 in the figure). In the H160D structure, the molecule rocks between a state that is similar to the consensus H160D state (number 2 in the figure) and a state that is similar to the classic I-state (also similar to the I-state in the apo data). Therefore, H160D and apo both reach similar conformations on the side of the I-state, but apo has a wider range of motion compared to H160D. Having established the range (by the 3D variability analysis) and the mean position of this motion (the consensus structure) in both apo and H160D, we next determined the particle distribution across these three states (1, 2, or 3) in the apo vs the H160D dataset. In step 2, we performed heterogeneous refinement of the two datasets separately, using the three models (indicated by numbers 1, 2, and 3 throughout this figure; all maps are low pass filtered to 20 Å) obtained from step 1 as reference models. The apo dataset separated into three classes: 66.3% of all particles went into a class that is similar to the classic A-State (class a), and 26.5% of all particles went into a class, that is, similar to the classic I-State (class b), and a small percentage went into a third class that did not result in a high resolution structure. In the H160D dataset, the majority of all particles went into two classes (class a and class b), both of which are similar to the consensus H160D structure.
Figure 4—figure supplement 4
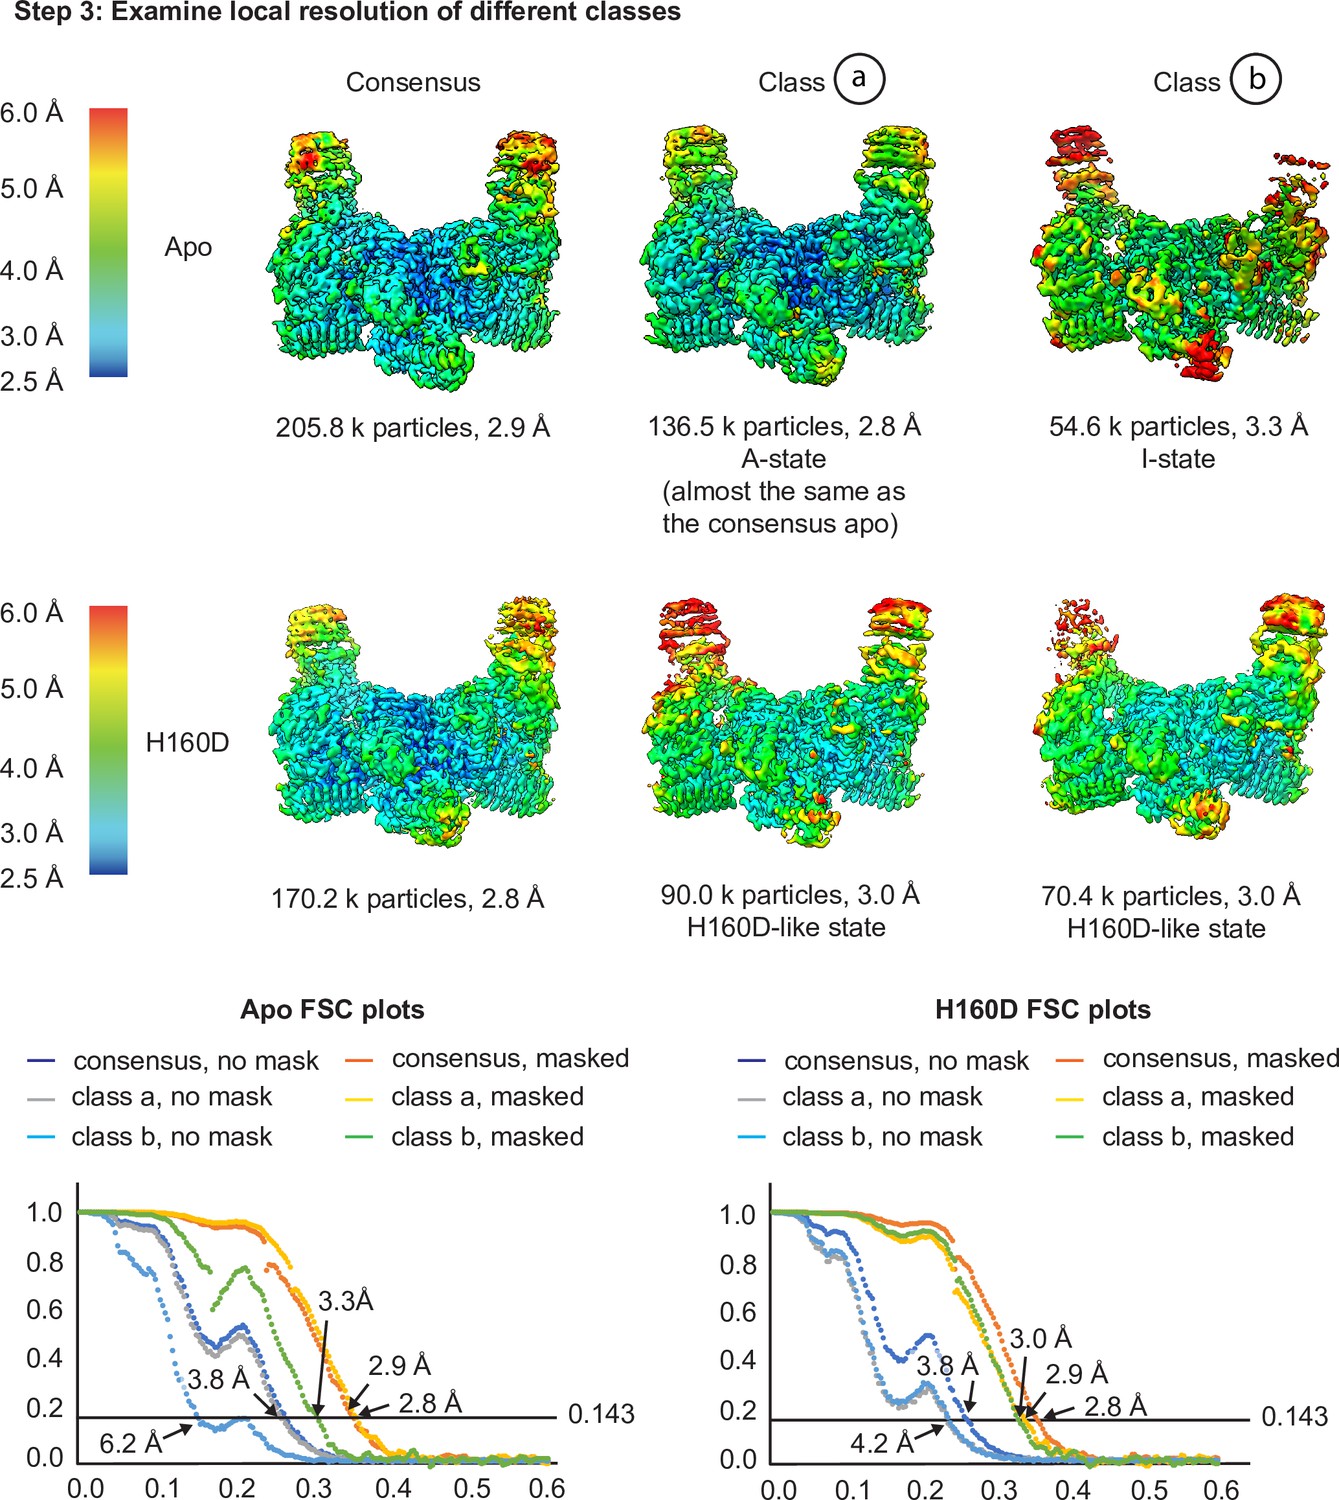
Cryo-EM analysis of the conformation and dynamics of the WT decamer and the βH160D decamer – part 2.
Having finished the 3D classification, we then performed local resolution analysis to examine the quality of the density maps in step 3 to investigate the potential for different subpopulations of particles within each dataset. As shown in step 3, in the apo structure, class a showed a slight improvement in overall resolution (2.8 Å for the class and 2.9 Å for the consensus), as well as improvements in local map quality in the flexible regions of the molecule (see the top of the ‘wings’ in both these maps). Class b has a reduced global resolution, local resolution around the flexible regions, as well as a worse FSC profile (see the FSC plots). Class b could therefore either represent particles that are more I-State like that got separated from the consensus structure, or particles that are more damaged (as suggested by the worse FSC profile and the worse map quality in the flexible regions). For the H160D dataset, classification resulted in two classes that are both similar to the consensus structure (classes a and b) and both classes resulted in worse overall resolution than the consensus (3.0 Å for both classes and 2.8 Å for the consensus). The local resolution of the classes is also worse than the consensus structure in flexible regions. This would suggest that the particles making up the H160D dataset represent a continuous distribution of different conformations, as simply separating them into multiple bins each with fewer particles worsened the map quality of both classes. Integrating the results from steps 1–3, it is likely that the apo dataset mainly consists of A-State particles, and that the H160D mutation shifts the mean conformation of eIF2B towards a state that is I-like. Also, there is no evidence suggesting that the H160D dataset is a mixture of A- and I-State particles, but rather, particles within this dataset most likely follow a continuous distribution.
Figure 4—figure supplement 5
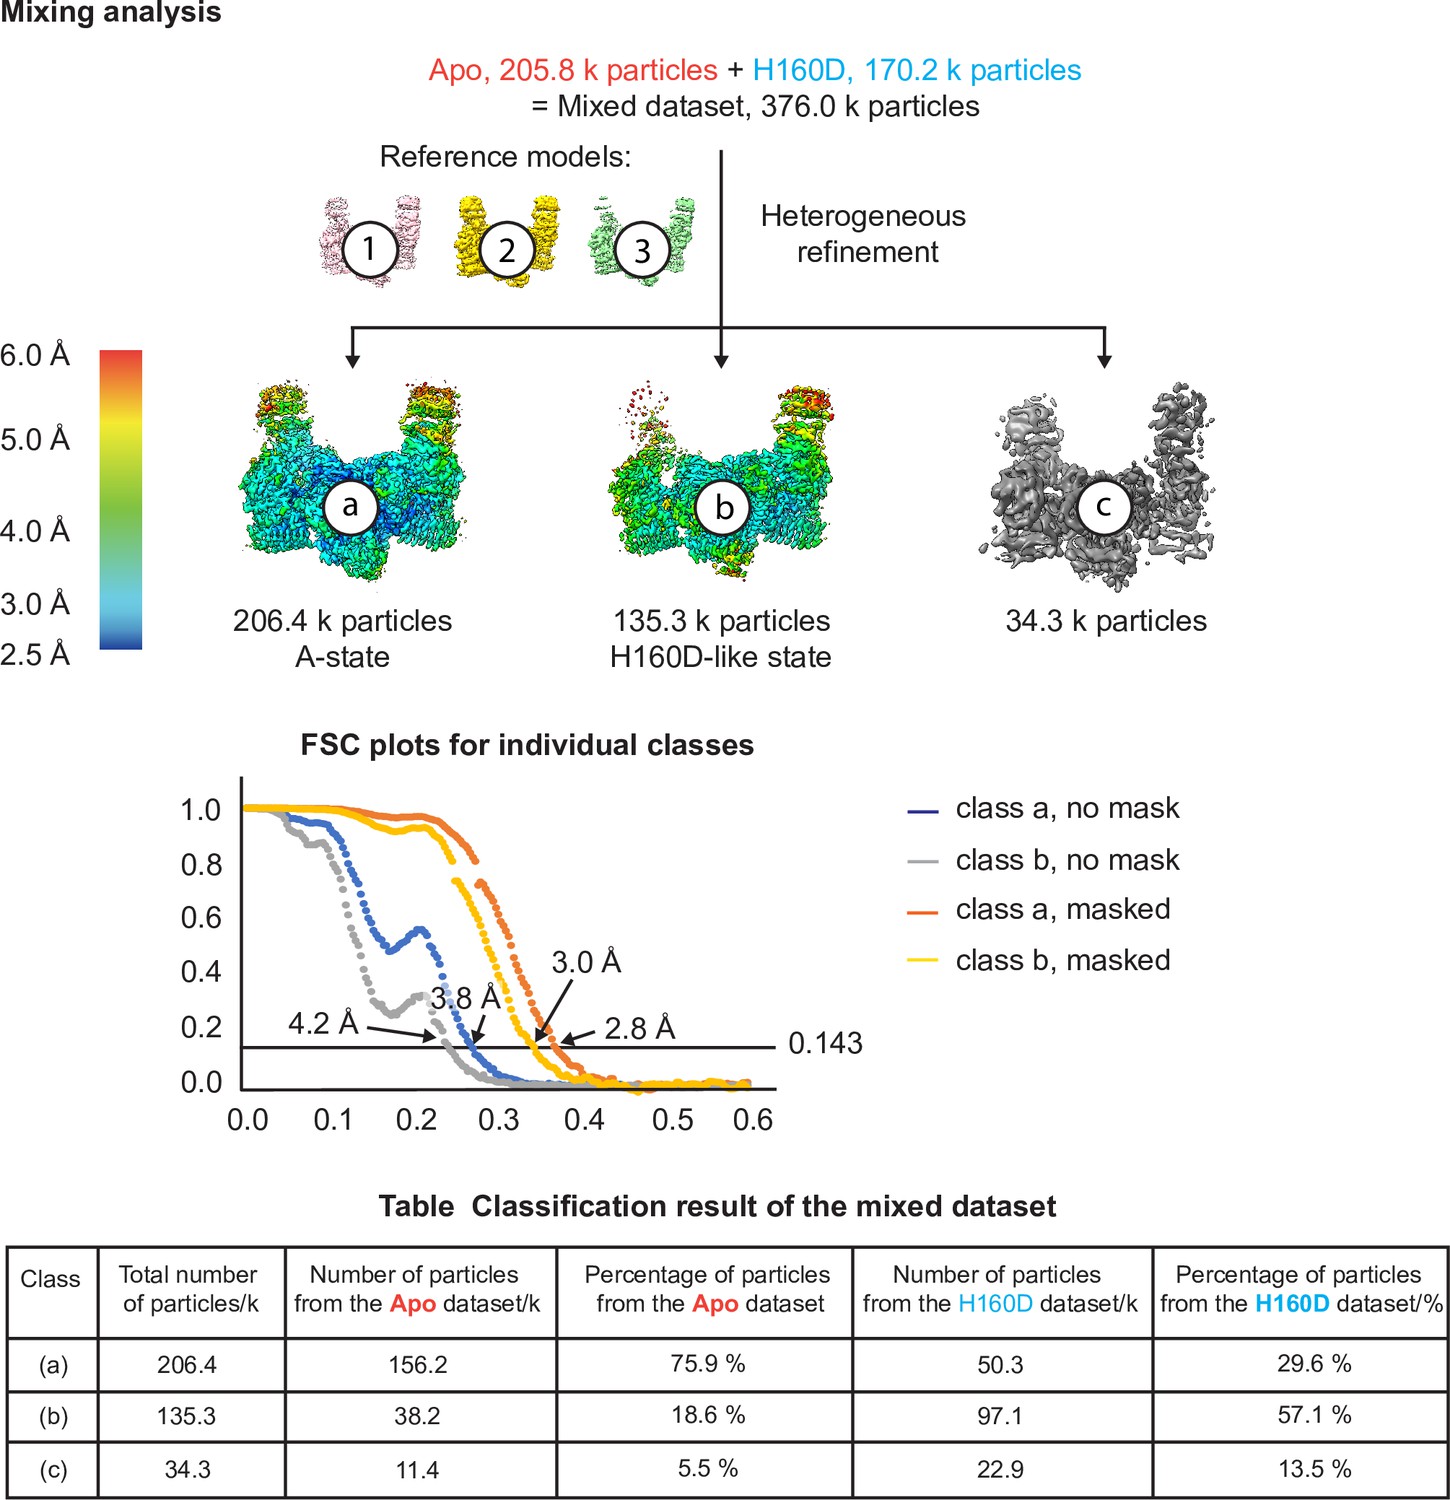
Cryo-EM analysis of the conformation and dynamics of the WT decamer and the βH160D decamer – part 3.
Finally, we performed an extra test to make sure that if a dataset is made up of similar conformations, our cryo-EM analysis is indeed able to separate them into two classes. In this test, we combined particle images from the apo dataset and the H160D dataset and performed heterogeneous refinement using models 1, 2, and 3 from step 1. The results show that most of the particles in the mixed dataset went into one of the two following classes: a class that resembles the classic A-State (class a) and another class that resembles the H160D State (class b). As shown in the table, consistent with the heterogeneous classification results described above, 3D classification of the mixed dataset separated the A- from the I-State, with the majority of A-State particles originating from the apo dataset and the majority of the I-State particles originating from the H160D dataset.
Figure 5 with 1 supplement
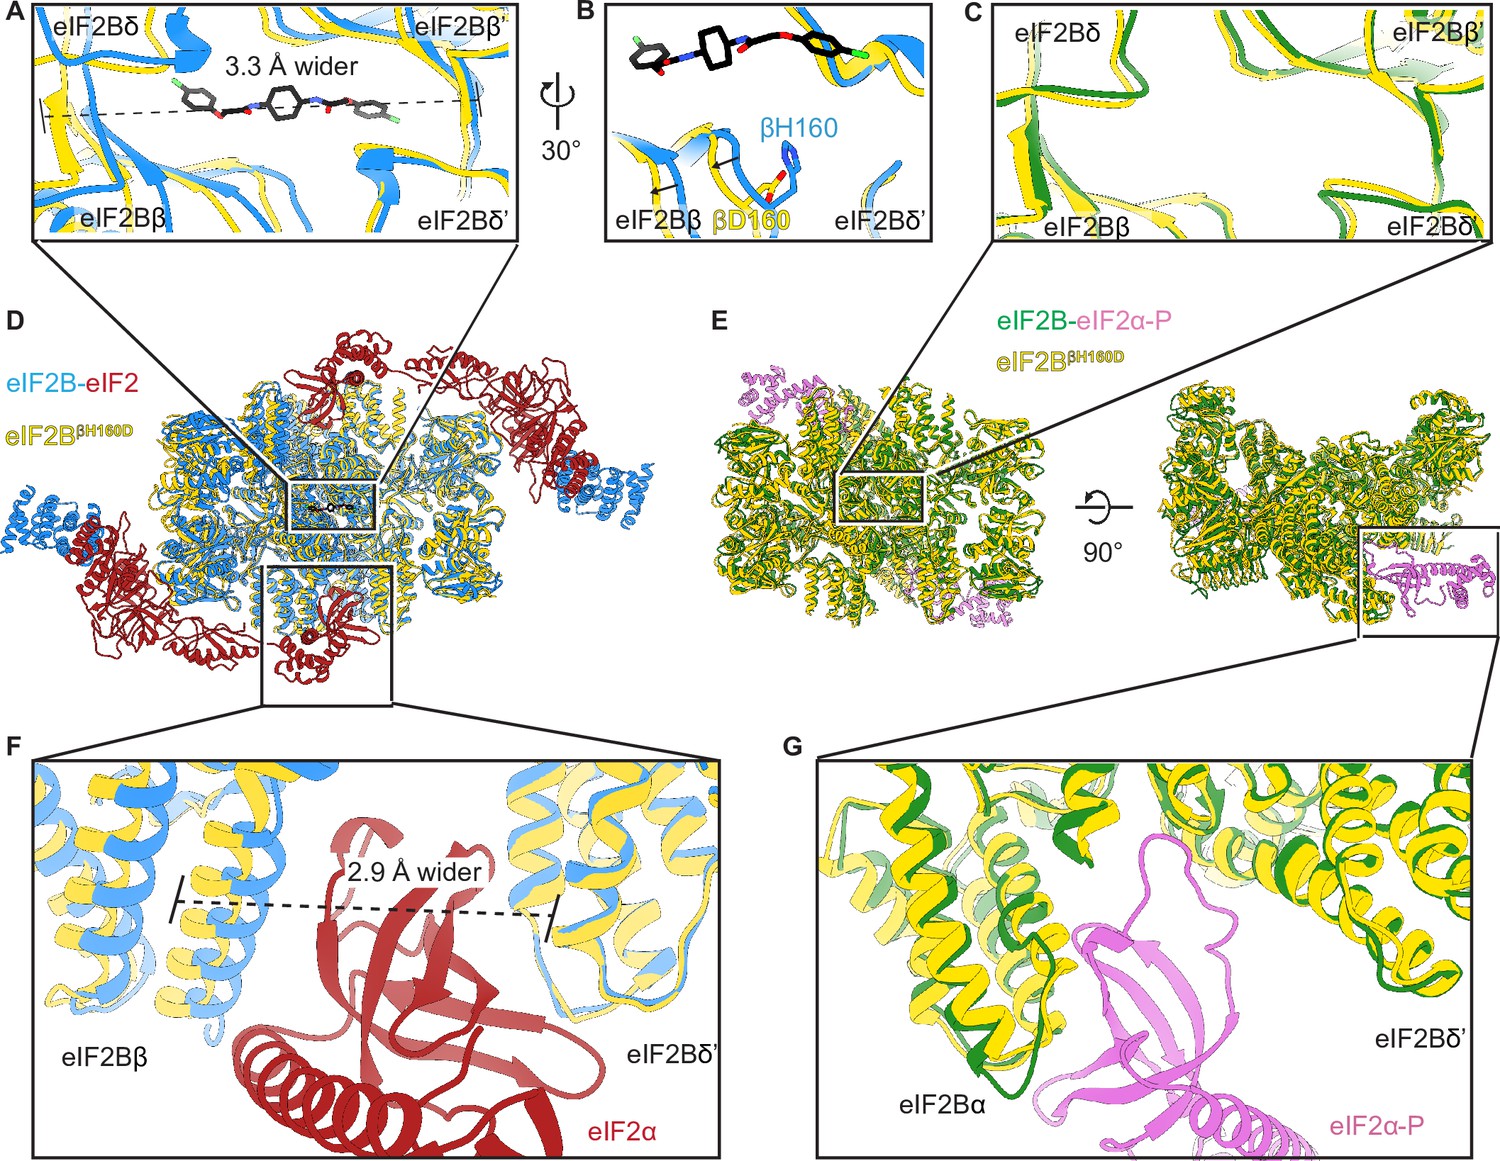
The βH160D mutation conformationally diminishes eIF2B activity.
(A) Overlay of the eIF2BβH160D structure to the eIF2B-eIF2 structure showing a ~ 3 Å lengthening of the ISRIB-binding pocket in the eIF2BβH160D structure. The pocket lengthening is measured between eIF2Bδ and eIF2Bδ’ L482; the ‘prime’ indicates the subunit of the opposing tetramer. ISRIB is shown in stick representation. (B) A rotated view of panel (A) showing that in the eIF2BβH160D structure the loop bearing βD160 retracts from the opposite tetramer due loss of some attractive interactions (for details, see Figure 5—figure supplement 1). (C) Overlay of the eIF2BβH160D structure to the eIF2B-eIF2α-P structure showing the similar dimensions of the ISRIB binding pockets. (D) Zoom out of the overlay in panels (A), (B), and (F). (E) Zoom out of the overlay in panel (C) and (G). (F) Overlay of the eIF2-bound eIF2B to eIF2BβH160D showing the 2.9 Å widening of the eIF2α binding pocket induced by the βH160D mutation. The pocket widening is measured between eIF2Bβ E139 and eIF2Bδ’ R250. (G) Overlay of the eIF2α-P-bound eIF2B to eIF2BβH160D showing the similar dimensions of the eIF2α-P binding pockets. Protein molecules are colored as in Figure 4. ISRIB is colored in CPK.
Figure 5—figure supplement 1
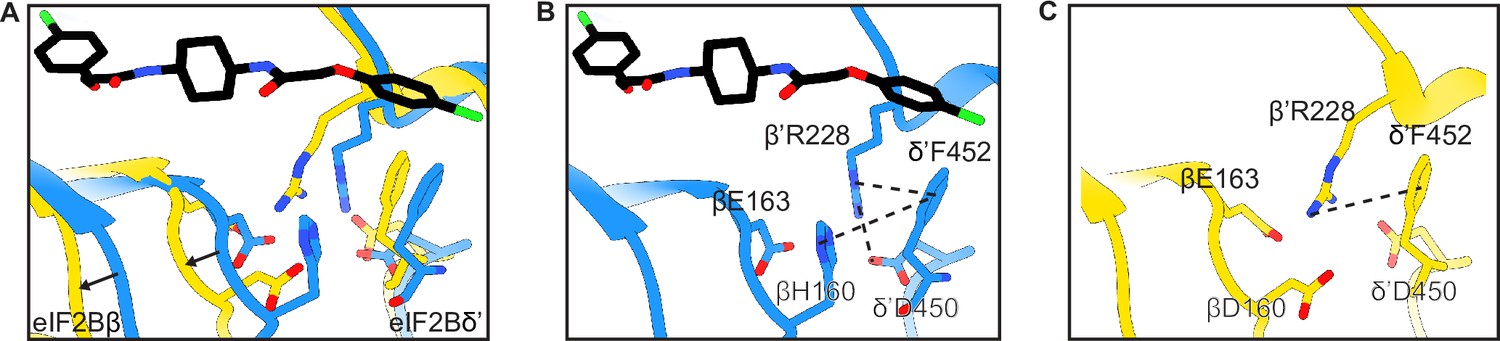
Structural details of the symmetry interface of the WT vs βH160D decamer.
(A) Zoomed-in view of the overlay of the eIF2BβH160D structure with the eIF2B-eIF2 structure at the symmetry interface. The βH160D mutation causes the loop bearing βD160 to move away from the opposite tetramer. Black arrows indicate the direction of the movement. (B) Symmetry interface of the eIF2B-eIF2 complex showing the network of interactions. (C) Symmetry interface of the eIF2BβH160D structure showing the local structural rearrangements. Each interaction is denoted with a dashed line. eIF2B in the eIF2B-eIF2 complex is colored blue; eIF2BβH160D is colored in yellow, and ISRIB in CPK.
Figure 6 with 3 supplements
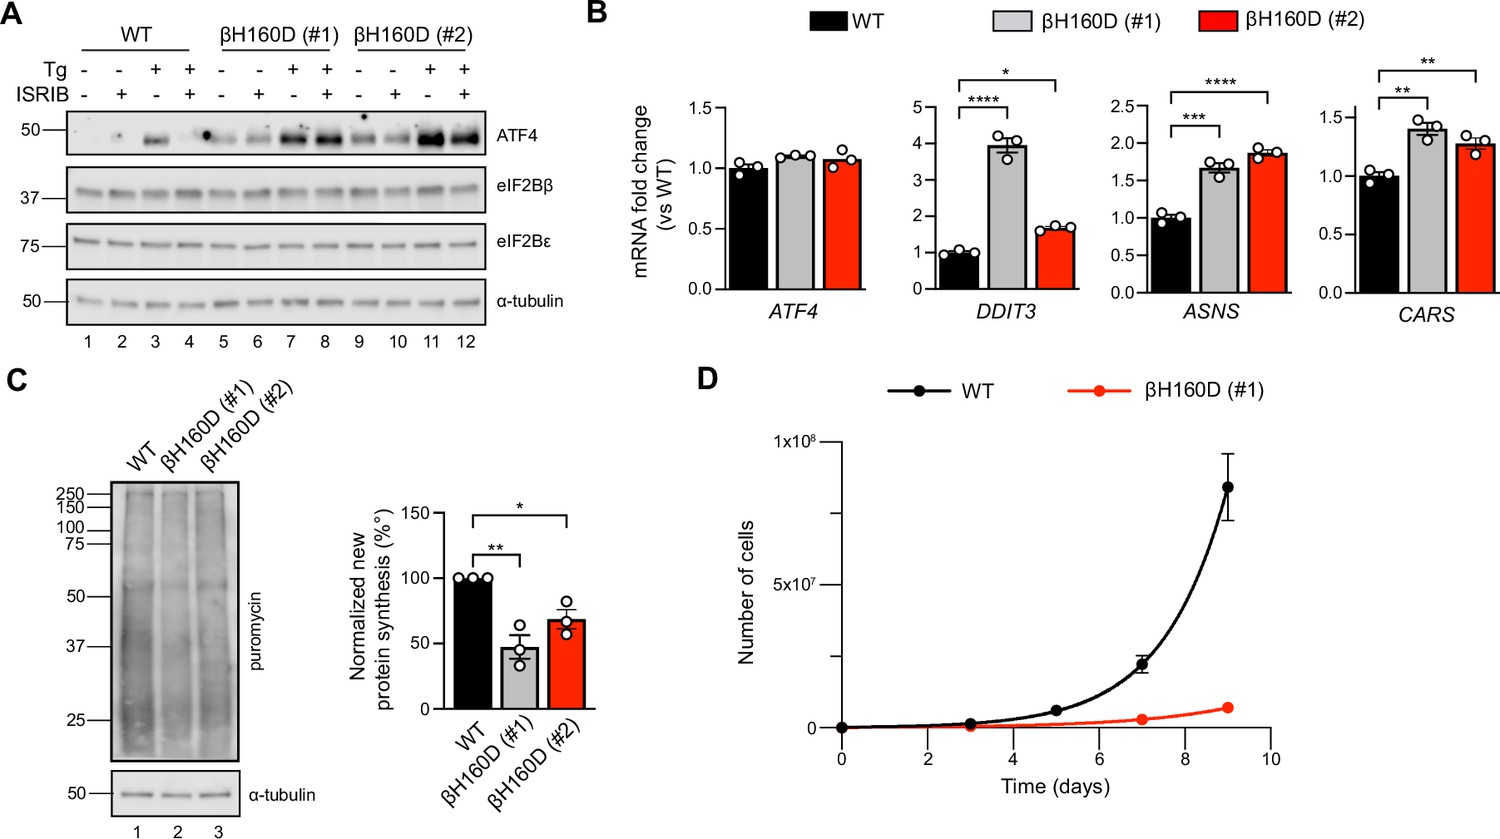
The βH160D mutation spontaneously activates the integrated stress response (ISR) in cells.
(A) Western blot of WT vs EIF2B2H160D HEK293FTR cell lines [βH160D (#1) and βH160D (#2)] treated with and without stress [10 nM thapsigargin (Tg)] or ISRIB (200 nM) for 1 hr. eIF2B subunit levels do not differ between cell lines. ATF4 is constitutively produced in the βH160D cell lines (lanes 5 and 9, compare to lane 1), and its induction is ISRIB-insensitive (lanes 6, 8, 10, 12, compare with lane 4). α-tubulin serves as a loading control. (B) RT-qPCR for ATF4 and ATF4 transcriptional targets in untreated WT vs βH160D cell lines. Transcript levels were normalized to GAPDH signal and fold changes were calculated with WT level set to 1. While there is no difference in ATF4 transcript level, the ATF4 target genes DDIT3 (CHOP), ASNS, and CARS are significantly transcriptionally upregulated in the βH160D lines (one-way ANOVA with Dunnett post-hoc tests). (C) Puromycin incorporation assay for new protein synthesis. Left panel: representative blot of cell lysates treated with a 10 min puromycin pulse and blotted for puromycin (new protein synthesis) or tubulin (loading control). Right panel: quantification of puromycin incorporation. The puromycin signal is normalized to tubulin levels and set at 100% for WT. Both βH160D cells show a reduction of basal protein translation [one-way ANOVA with Dunnett post-hoc test, p=0.0026 for WT vs βH160D (#1) and p=0.0288 for WT vs βH160D (#2)]. (D) Growth curves showing that βH160D cells grow slower than WT cells WT doubling time = 25.7 hr, s.e.m. = 3.6 hr; βH160D doubling time = 38.4 hr, s.e.m. = 3.5 hr. All error bars and ‘±’ designations are s.e.m. For (B, D) n = 3 biological replicates. For (C), n = 3 biological replicates, each of which was the average of three technical replicate transfers.*p<0.05, **p<0.01, ***p<0.001, ****p<0.0001.
-
Figure 6—source data 1
Raw data for the western blots, qPCR, puromycin-incorporation assay, and cell growth.
Tg: thapsigargin; 7H9: homozygous βH160D clone (βH160D #1); H11: hemizygous βH160D clone (βH160D #2); Rep: biological replicate.
- https://cdn.elifesciences.org/articles/76171/elife-76171-fig6-data1-v2.xlsx
-
Figure 6—source data 2
Original image files for western blots.
Tg: thapsigargin; 7H9: homozygous βH160D clone (βH160D #1); H11: hemizygous βH160D clone (βH160D #2).
- https://cdn.elifesciences.org/articles/76171/elife-76171-fig6-data2-v2.zip
Figure 6—figure supplement 1
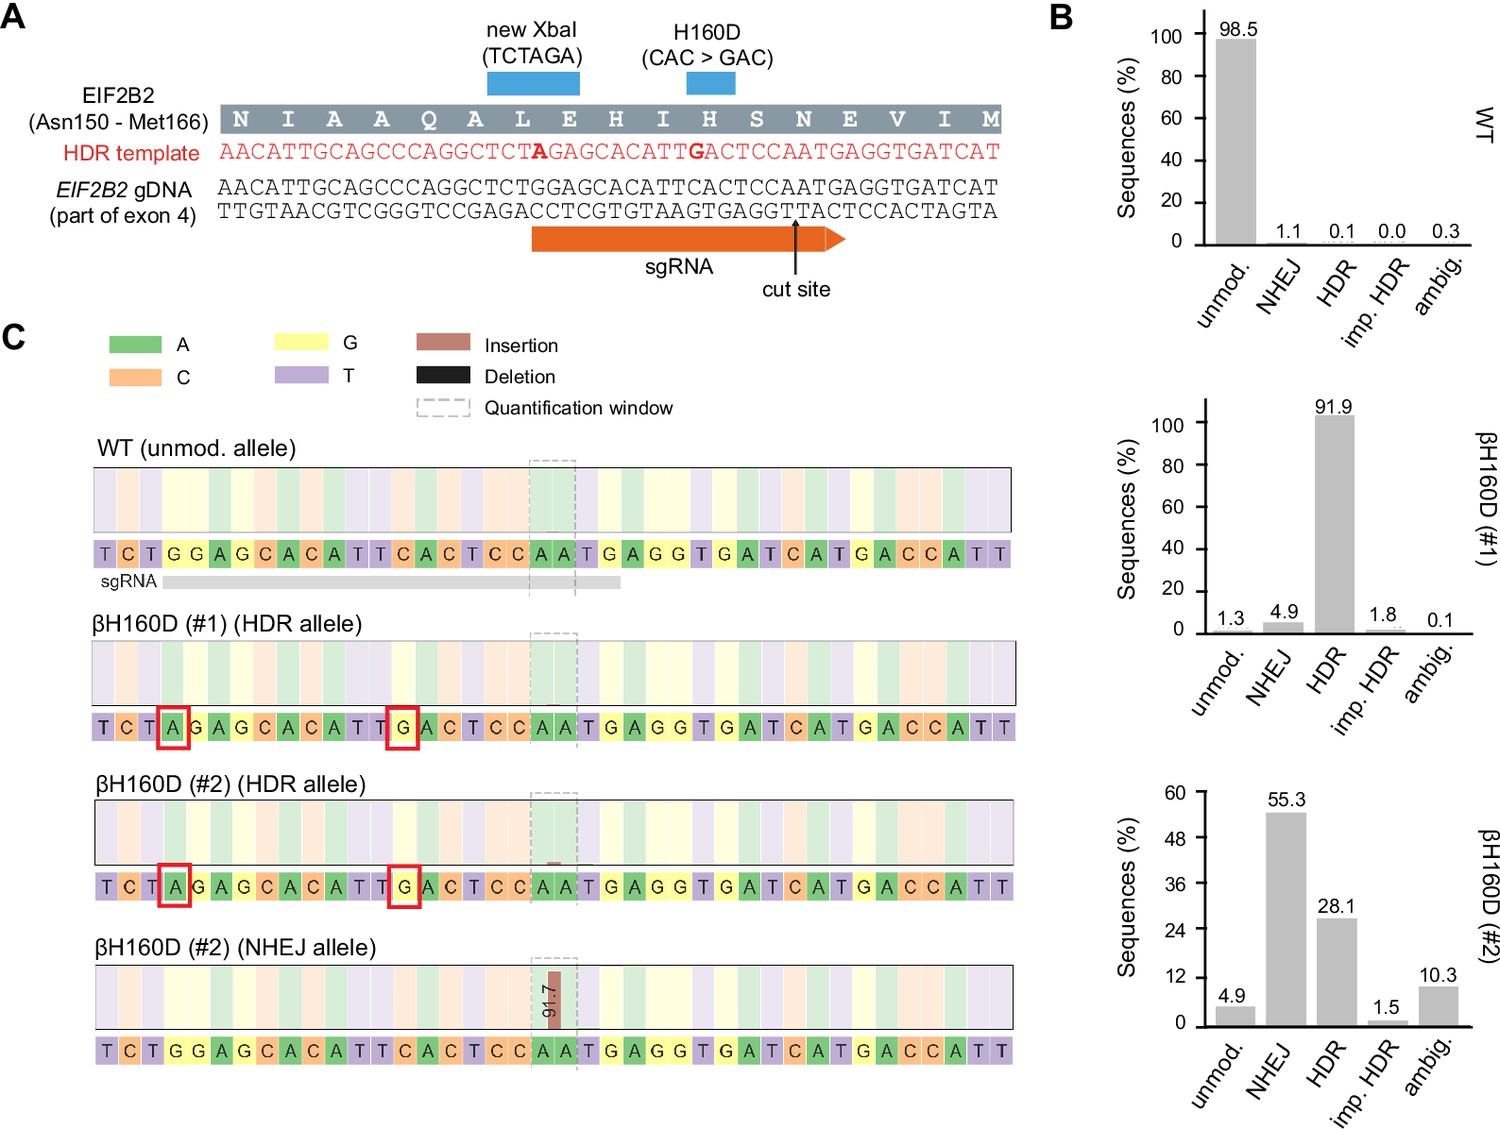
CRISPR-Cas9 editing of the endogenous EIF2B2 gene with the βH160D mutation in HEK293FTR cells.
(A) Editing strategy at target locus of exon 4 in EIF2B2. The guide RNA (sgRNA) directs Cas9 for cleavage at a site close to the codon coding for H160. The provided homology-directed repair (HDR) template introduces two basepair substitutions: one for the H160D point mutation (CAC>GAC), and one silent mutation for restriction enzyme mediated clone screening (new XbaI site). gDNA: genomic DNA. (B, C) Allele frequencies (B) and sequences (C) at the EIF2B2 target locus in WT cells and two βH160D clones as determined by deep sequencing. For each cell line, 500,000 randomly-selected sequenced reads were analyzed using the CRISPResso2 pipeline. For one clone, βH160D (#1), >90% of reads matched the HDR template, indicating homozygous editing. For the other clone, βH160D (#2), about 1/3 of reads matched the HDR template, and about 2/3 of reads indicated non-homologous end-joining (NHEJ) with a single A-base insertion, leading to a frameshift mutation and premature translation stop. This suggests this clone is triploidic at the target locus, with a single correctly edited allele and two knock-out alleles. Unmod.: unmodified; imp.: imperfect; ambig.: ambiguous.
Figure 6—figure supplement 2
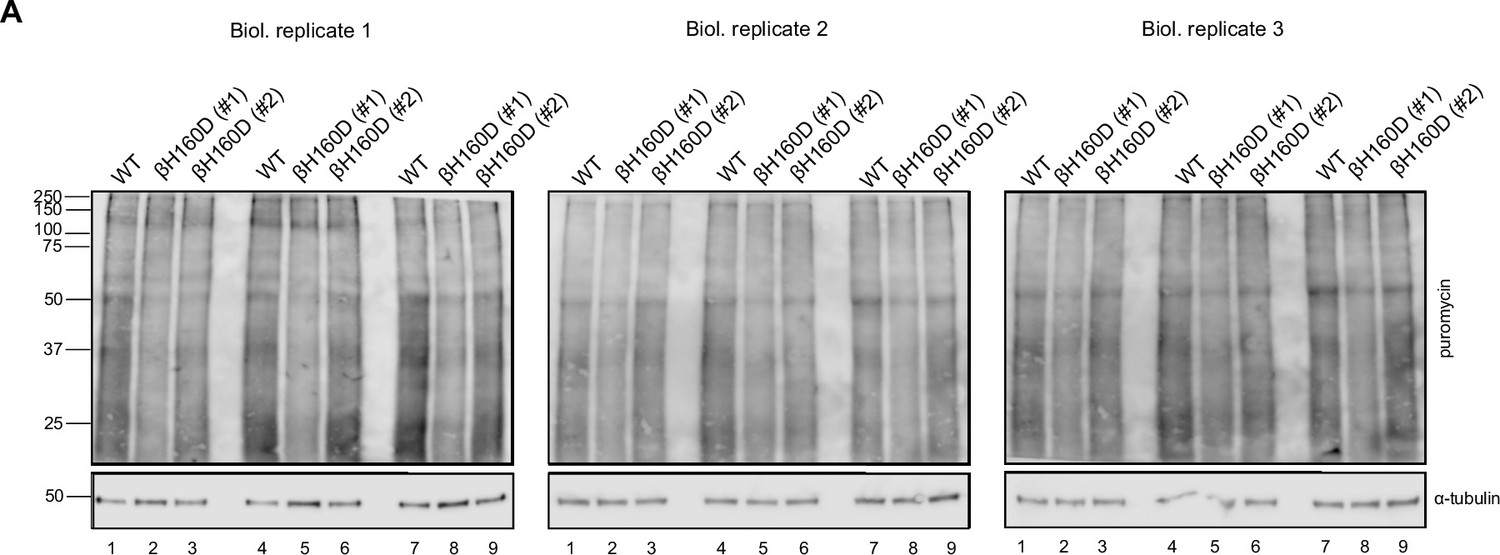
Cells with the βH160D mutation in the endogenous EIF2B2 gene show reduced protein translation.
Cells were treated for 10 min with puromycin and cell extracts analyzed by polyacrylamide electrophoresis followed by blotting and probing with anti-puromycin (new protein synthesis) or anti-tubulin (loading control) antibodies. Each puromycin incorporation blot represents an independent biological replicate loaded in triplicate to correct for efficiency variations during protein transfer. Equal total protein amounts were loaded in each lane.
-
Figure 6—figure supplement 2—source data 1
Western blots of puromycin incorporation assays.
7H9: homozygous βH160D clone (βH160D #1); H11, hemizygous βH160D clone (βH160D #2); Rep: replicate; Tub: anti-tubulin antibody; Puro: anti-puromycin antibody.
- https://cdn.elifesciences.org/articles/76171/elife-76171-fig6-figsupp2-data1-v2.xlsx
-
Figure 6—figure supplement 2—source data 2
Original image files for western blots of puromycin incorporation assays.
7H9 = homozygous βH160D clone (βH160D #1), H11 = hemizygous βH160D clone (βH160D #2).
- https://cdn.elifesciences.org/articles/76171/elife-76171-fig6-figsupp2-data2-v2.zip
Figure 6—figure supplement 3
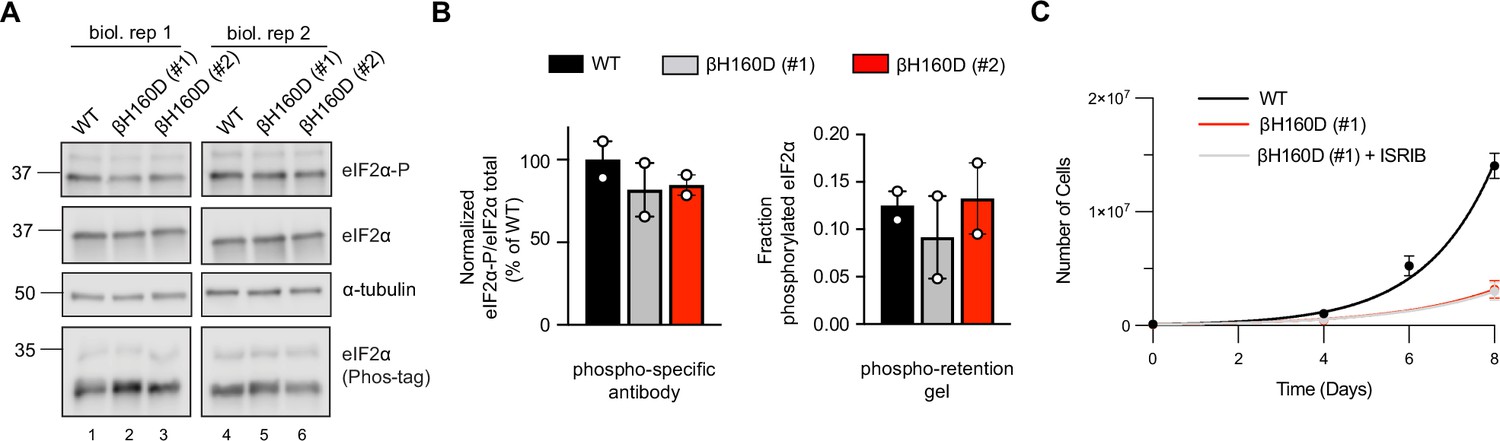
The EIF2B2-H160D mutation does not alter phosphorylated eIF2α levels and is ISRIB resistant.
(A) Western blot of untreated WT vs EIF2B2H160D HEK293FTR cell lines [βH160D (#1) and βH160D (#2)], probing for phospho-eIF2α (S51) (upper row), total eIF2α (middle row), and eIF2α on Phos-tag phospho-retention gel (lower row). Both methods (phospho-specific antibody and phospho-retention on Phostag gels) reveal no major difference in basal phosphorylated eIF2 levels between cell lines. (B) Quantification of phosphorylated eIF2α on western blots in (A) using a phospho-specific antibody (left) or on a Phostag gel probed with anti-eIF2α antibody (right). Bars of the left graph represent the mean ratio of eIF2α-P/total eIF2α normalized to WT (n = 2), and differences are not significant [one-way ANOVA with Dunnett post-hoc test, P = 0.53 for WT vs βH160D (#1) and P = 0.61 for WT vs βH160D (#2)]. Bars on the right graph represent the mean fraction of eIF2α that migrates slower in the Phostag gel [upper band/(upper band +lower band)] (n = 2). Also here, differences are not significant [one-way ANOVA with Dunnett post-hoc test, P = 0.76 for WT vs βH160D (#1) and P = 0.98 for WT vs βH160D (#2)]. (C) Growth curves showing that the slow growth of βH160D cells cannot be rescued by ISRIB treatment (n = 3 biological replicates); WT doubling time = 26.8 ± 0.4 hr; βH160D (#1) doubling time = 39.6 ± 2.7 hr; βH160D (#1) + ISRIB doubling time = 40.2 ± 2.7 hr. All error bars and ‘±’ designations are s.e.m.
-
Figure 6—figure supplement 3—source data 1
Raw data for the western blots and Phostag blots, and cell growth assay.
7H9: homozygous βH160D clone (βH160D #1); H11: hemizygous βH160D clone (βH160D #2); Rep: biological replicate.
- https://cdn.elifesciences.org/articles/76171/elife-76171-fig6-figsupp3-data1-v2.xlsx
-
Figure 6—figure supplement 3—source data 2
Original image files for western blots of eIF2 phosphorylation status.
7H9: homozygous βH160D clone (βH160D #1); H11: hemizygous βH160D clone (βH160D #2).
- https://cdn.elifesciences.org/articles/76171/elife-76171-fig6-figsupp3-data2-v2.zip
Tables
Table 1
SPR measurements of affinity.
| eIF2 binding | eIF2-P binding | |||||
|---|---|---|---|---|---|---|
| WT decamer | βH160D decamer | WT tetramer | WT decamer | βH160D decamer | WT tetramer | |
| ka (M–1s–1) | 7.0 × 10⁵ | 8.6 × 10⁵ | 1.5 × 10⁶ | 1.1 × 10⁶ | 2.1 × 10⁶ | No binding |
| kd (s–1) | Slow: 4.2 × 10⁻³ Fast: 0.12 | Slow: 5.3 × 10⁻³ Fast: 0.12 | 0.12 | 1.5 × 10⁻² | 1.7 × 10⁻² | No binding |
| KD (nM) | Slow: 6.0 Fast: 170 | Slow: 6.1 fast: 140 | 80 | 14 | 8.1 | No binding |
| % Slow dissociation | 71 | 33 | 0 | NA | NA | No binding |
| % Fast dissociation | 29 | 67 | 100 | NA | NA | No binding |
Table 2
Cryo-electron microscopy dataset for eIF2BβH160D decamer.
| Structure | eIF2BβH160D (PDB ID: 7TRJ) |
|---|---|
| Data collection | |
| Microscope | Titan Krios |
| Voltage (keV) | 300 |
| Nominal magnification | 105,000x |
| Exposure navigation | Image shift |
| Electron dose (e-Å–2) | 67 |
| Dose rate (e-/pixel/sec) | 8 |
| Detector | K3 summit |
| Pixel size (Å) | 0.835 |
| Defocus range (μm) | 0.6–2.0 |
| Micrographs | 2,269 |
| Reconstruction | |
| Total extracted particles (no.) | 1,419,483 |
| Final particles (no.) | 170,244 |
| Symmetry imposed | C1 |
| FSC average resolution, masked (Å) | 2.8 |
| FSC average resolution, unmasked (Å) | 3.8 |
| Applied B-factor (Å) | 81.7 |
| Reconstruction package | Cryosparc 2.15 |
| Refinement | |
| Protein residues | 3,234 |
| Ligands | 0 |
| RMSD Bond lengths (Å) | 0.003 |
| RMSD Bond angles (o) | 0.838 |
| Ramachandran outliers (%) | 0.13 |
| Ramachandran allowed (%) | 3.62 |
| Ramachandran favored (%) | 96.25 |
| Poor rotamers (%) | 6.92 |
| CaBLAM outliers (%) | 2.50 |
| Molprobity score | 2.40 |
| Clash score (all atoms) | 9.59 |
| B-factors (protein) | 100.54 |
| B-factors (ligands) | N/A |
| EMRinger Score | 2.52 |
| Refinement package | Phenix 1.17.1-3660-000 |
Table 3
Western blot antibodies and conditions.
| Antibody target | Host | Dilution | Manufacturer | Cat. number | Blocking conditions |
|---|---|---|---|---|---|
| eIF2Bβ | Rabbit | 1/1000 | ProteinTech | 11034–1-AP | PBS-T + 3% milk |
| eIF2Bε | Mouse | 1/1000 | Santa Cruz Biotechnology | sc-55558 | PBS-T + 3% milk |
| ATF4 | Rabbit | 1/1000 | Cell Signaling | 11,815 S | PBS-T + 3% milk |
| α-tubulin | Mouse | 1/1000 | Cell Signaling | 3873T | PBS-T + 3% milk |
| Puromycin | Mouse | 1/10,000 | Millipore | MABE343 | PBS-T + 3% milk |
| eIF2α | rabbit | 1/1000 | Cell Signaling | 5324 S | PBS-T + 3% milk |
| eIF2α-P (S51) | rabbit | 1/1000 | Cell Signaling | 9721 S | PBS-T + 1% BSA |
Table 4
Primers and oligos.
| Oligo | Sequence | Target gene |
|---|---|---|
| B002_F | TGCACCACCAACTGCTTAGC | GAPDH |
| B002_R | GGCATGGACTGTGGTCATGAG | GAPDH |
| D006_F | ATGACCGAAATGAGCTTCCTG | ATF4 |
| D006_R | GCTGGAGAACCCATGAGGT | ATF4 |
| D007_F | GGAAACAGAGTGGTCATTCCC | DDIT3 (CHOP) |
| D007_R | CTGCTTGAGCCGTTCATTCTC | DDIT3 (CHOP) |
| D070_F | GGAAGACAGCCCCGATTTACT | ASNS |
| D070_R | AGCACGAACTGTTGTAATGTCA | ASNS |
| D073_F | CCATGCAGACTCCACCTTTAC | CARS |
| D073_R | GCAATACCACGTCACCTTTTTC | CARS |
| C001_F | ACTTTAAGCACATTAACCCTG | EIF2B2 |
| C001_R | ACTTGATCTTCTCAGTGTCTC | EIF2B2 |
| C015 | t*G*CAAAACCGTTCTTACAGAAG GGACAATGGAGAACATTGCAGCCCA GGCTCTAGAGCACATTGACTCCAATGA GGTGATCATGACCATTGGCTTCTCCCGAACAGT | NA (ssODN) |
| C034_F | CGCGTAATGTGTGTTTGTGA | |
| C034_R | GCCTCTACTGTTCGGGAGAA | |
| C036_F_bcx | CAAGCAGAAGACGGCATACGAGATxxxxxx GTGACTGGAGTTCAGACGTGTGCTCTTCCG ATCTCGCGTAATGTGTGTTTGTGA | |
| C036_R | AATGATACGGCGACCACCGAGATCTAC ACTCTTTCCCTACACGA | |
| C005_F | acaccgGGAGCACATTCACTCCAATGg | |
| C005_R | aaaacCATTGGAGTGAATGTGCTCCcg |
-
*
phosphorothioate bond.
-
x = barcode nucleotide, different for each clone.
Additional files
Download links
A two-part list of links to download the article, or parts of the article, in various formats.
Downloads (link to download the article as PDF)
Open citations (links to open the citations from this article in various online reference manager services)
Cite this article (links to download the citations from this article in formats compatible with various reference manager tools)
A point mutation in the nucleotide exchange factor eIF2B constitutively activates the integrated stress response by allosteric modulation
eLife 11:e76171.
https://doi.org/10.7554/eLife.76171


