COVID-19 cluster size and transmission rates in schools from crowdsourced case reports
- Department of Mathematics, Simon Fraser University, Canada
- The Donnelly Centre, University of Toronto, Canada
- Ontario Institute for Cancer Research, Canada
Figures
Figure 1
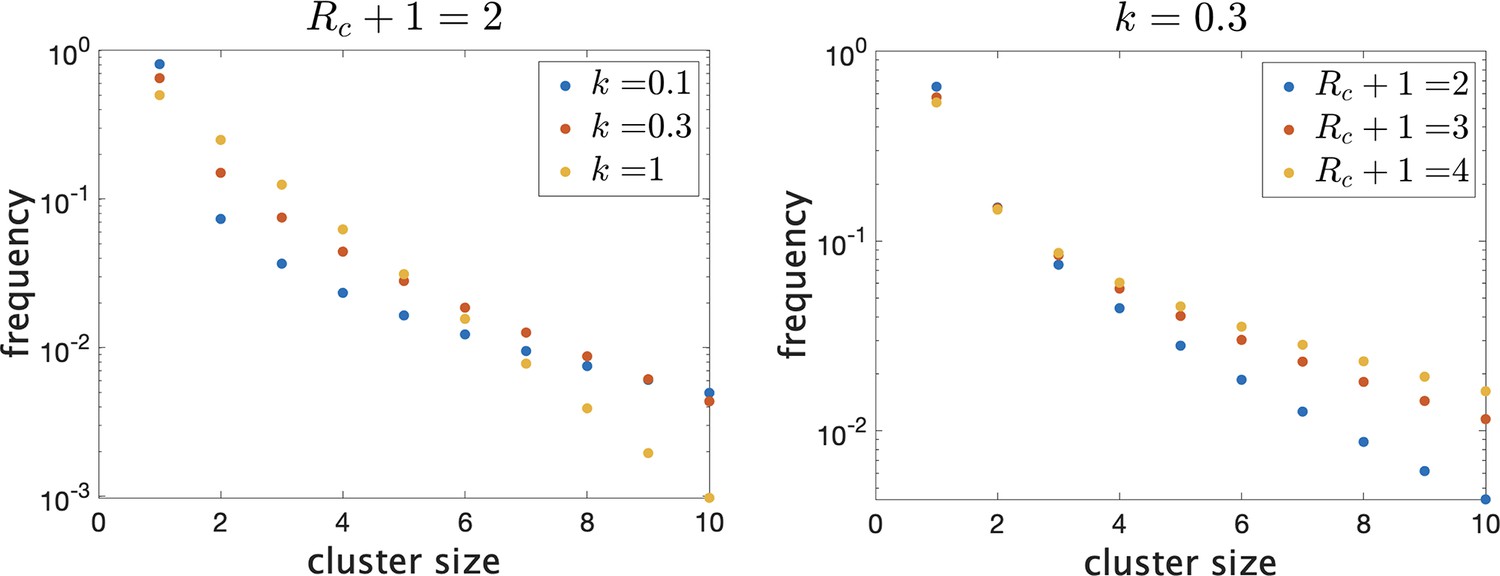
Frequency of clusters of different sizes on a log scale.
Trends continue as shown for larger clusters. (Left) Fixing mean cluster size and varying dispersion . (Right) Fixing and varying .
Figure 2
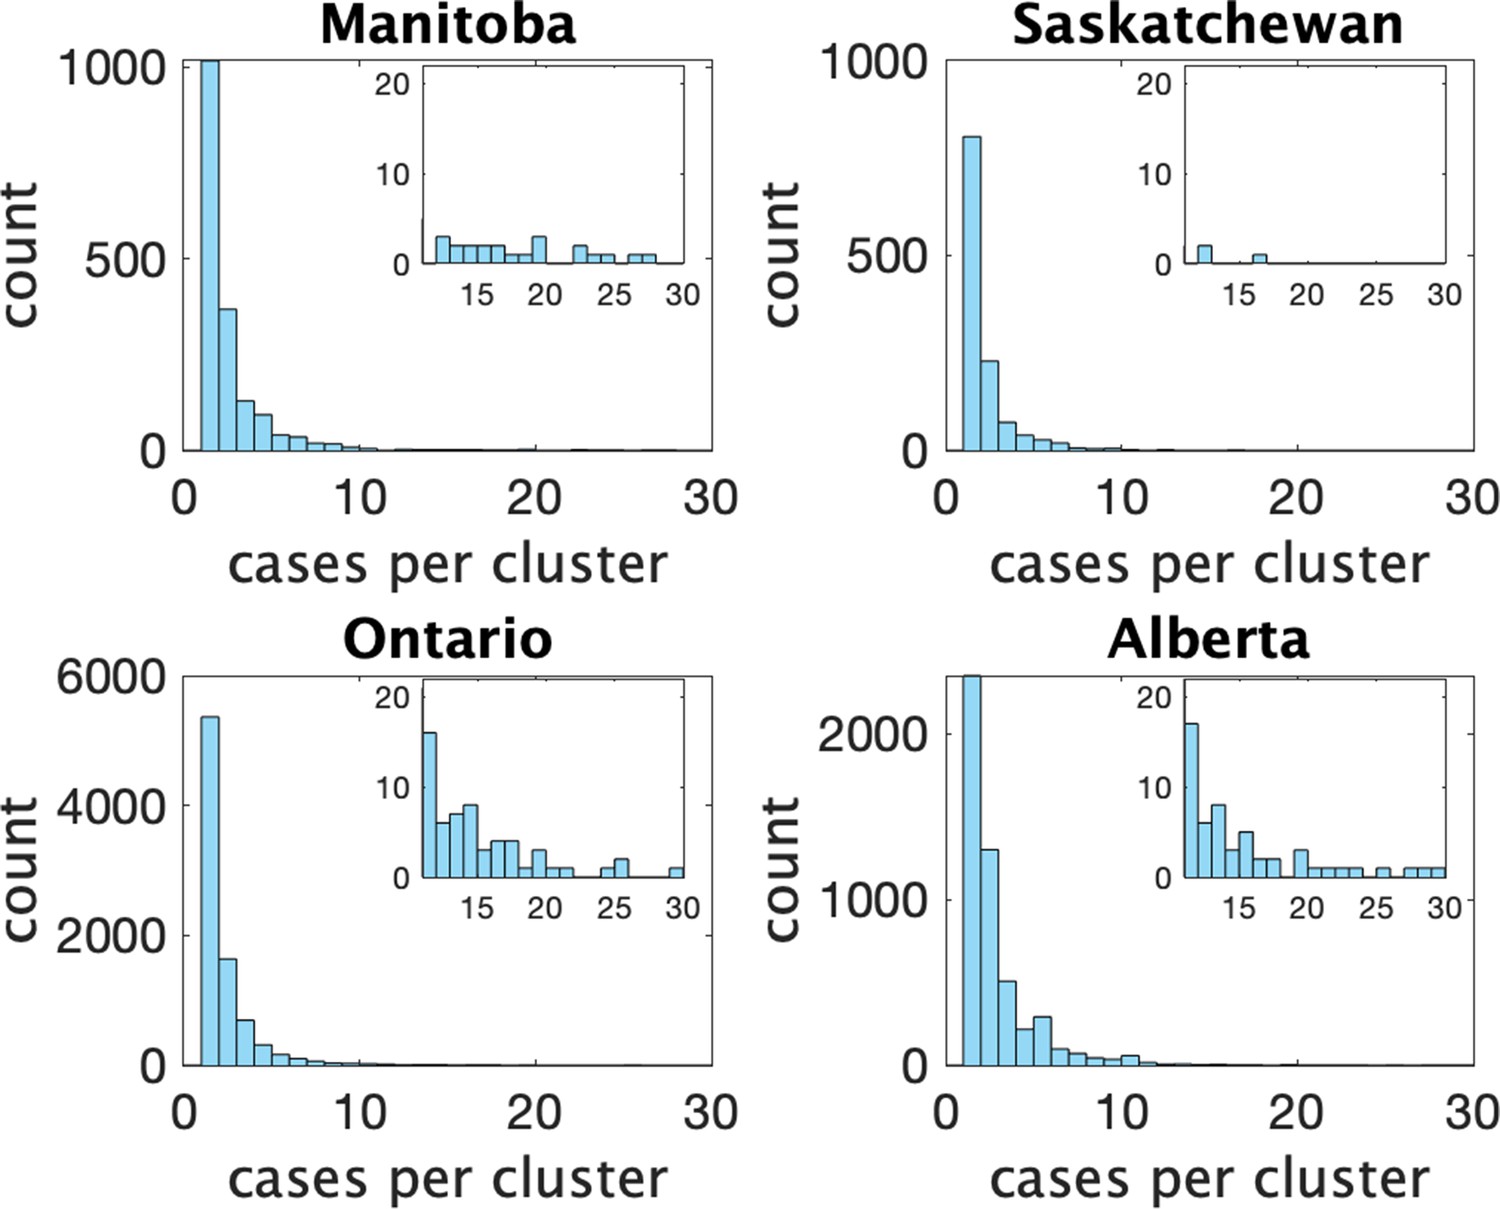
Histograms of observed cluster sizes in four Canadian provinces.
Inset histograms only show clusters of size 11 or more on a different scale.Each dot represents a single cluster of size 11 or larger, and indicates the presence of (more rare) larger clusters.
Figure 3
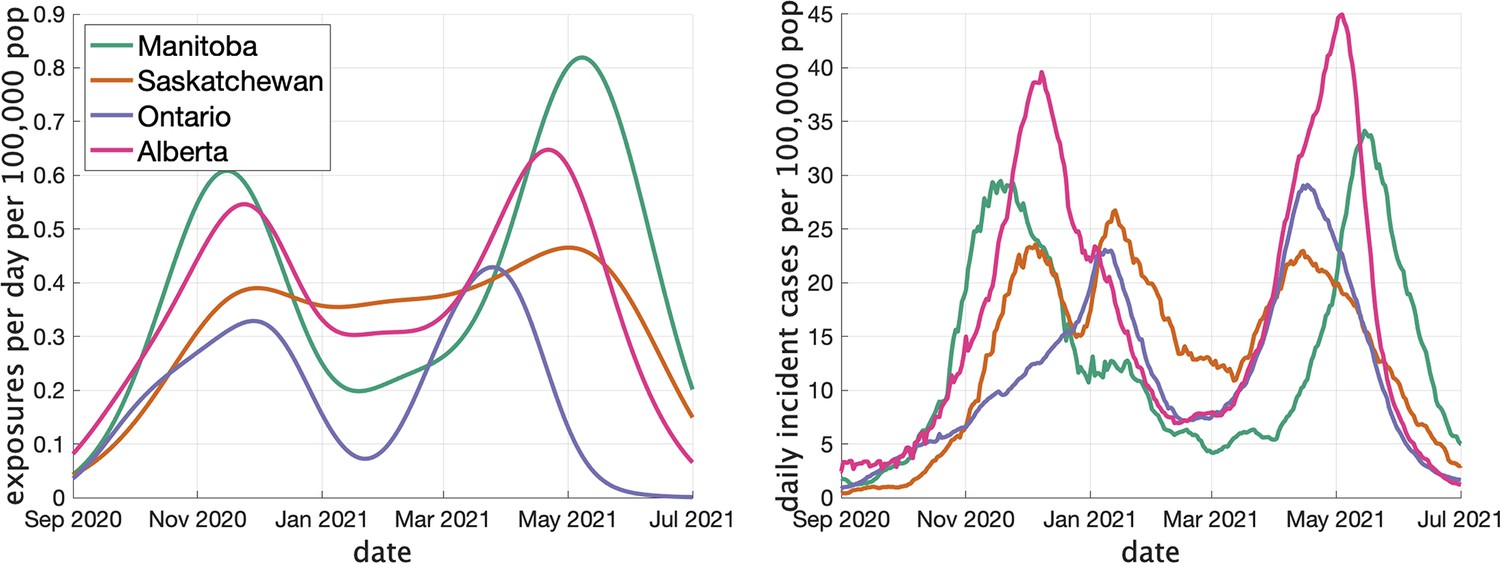
Two indicators of COVID prevalence over time in the four Canadian provinces.
(Left) Estimates of the rate of new clusters (per 100,000 population) as a function of time in each province. (Right) Incident cases per day (per 100,000 population) in the same province over the corresponding time interval. Case counts are averaged over a 2-week window.
Figure 4
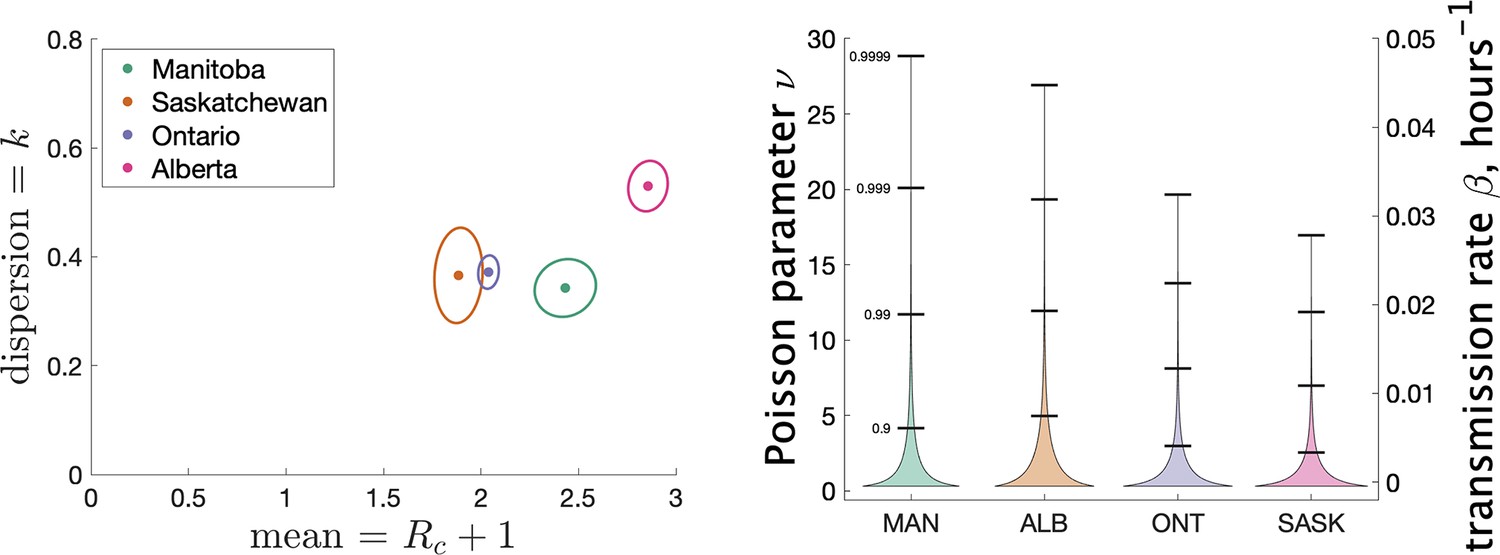
Results of our analysis for the four Canadian provinces.
(Left) Estimates of mean and dispersion of cluster size for four Canadian provinces using the individual ascertainment model with ascertainment rate 0.75. Estimate of mean includes index case. The sample size for estimates for each province is the Number of Clusters as shown in Table 1. 95% confidence ellipses are shown, computed using the inverse Hessian method. (Right) Estimated distribution of (left axis) and instantaneous transmission rate (right axis) for different provinces.
Figure 5
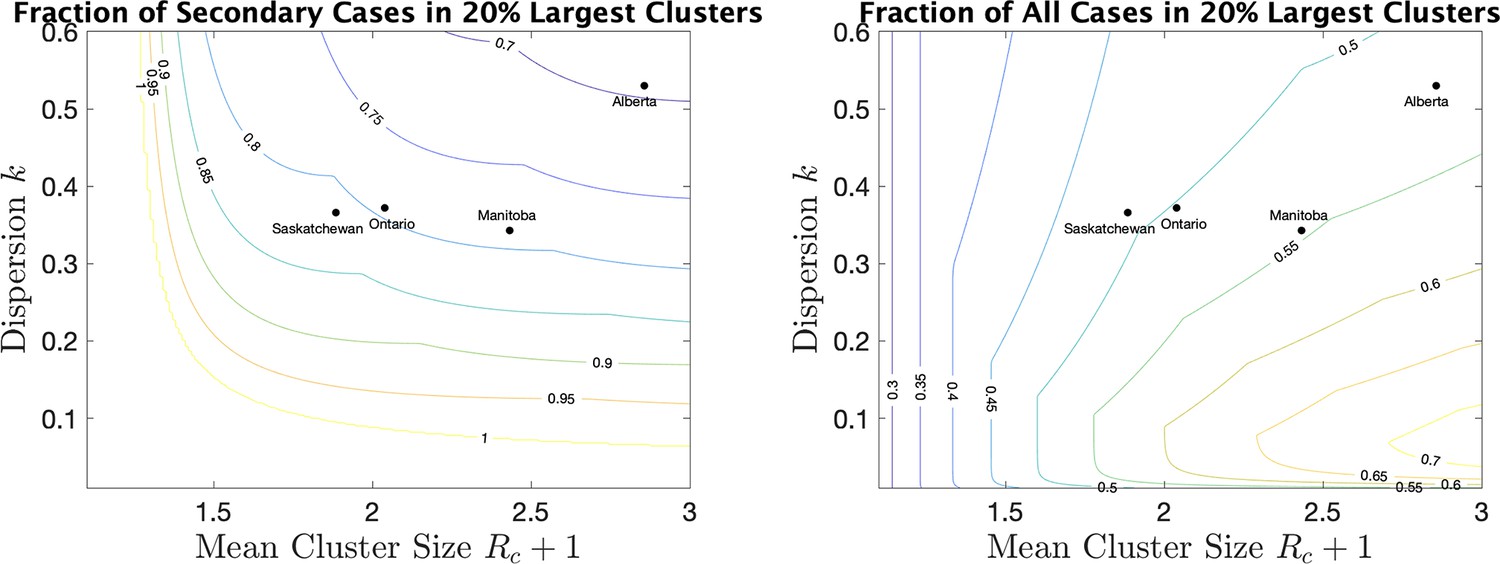
For a range of mean cluster size and dispersion , the fraction of cases in the 20% largest clusters, counting only secondary cases (left), or all cases, index and secondary (right).
Dots indicate the location of the four provinces in the plots.
Figure 6

Estimated distribution of for different provinces.
Figure 7
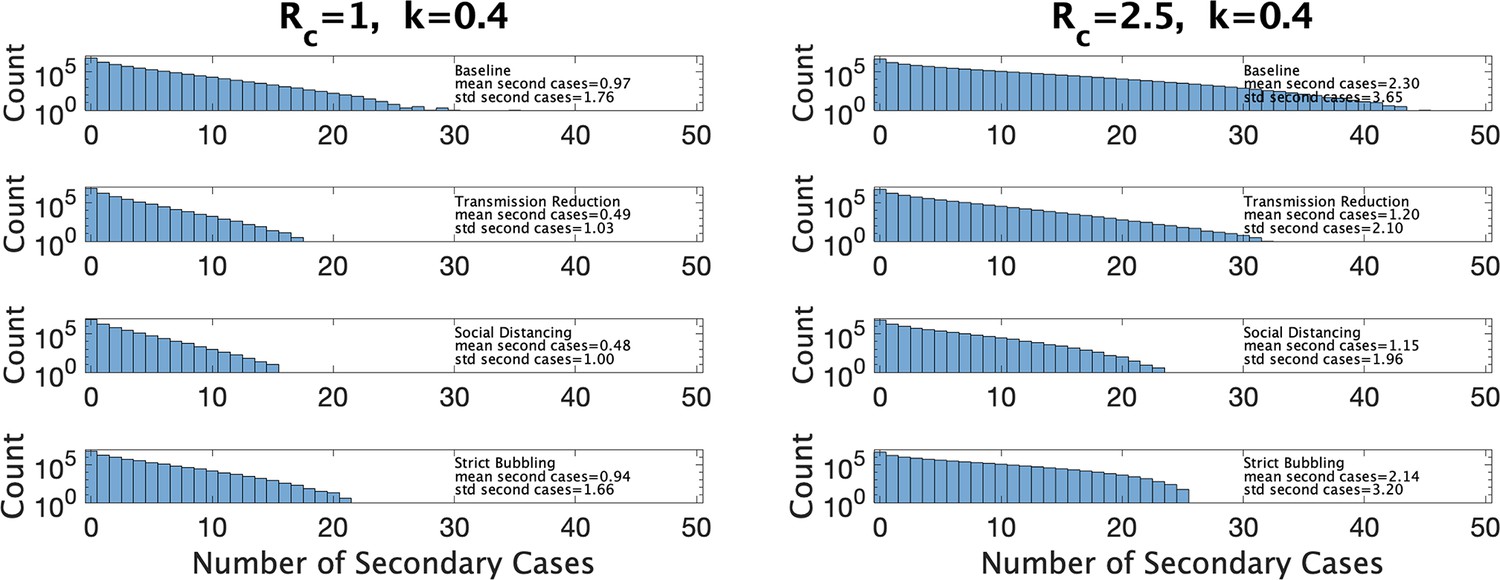
Distribution of the number of secondary infections under baseline conditions and under three interventions.
Left: under parameter choice and . Right: with .
Appendix 1—figure 1
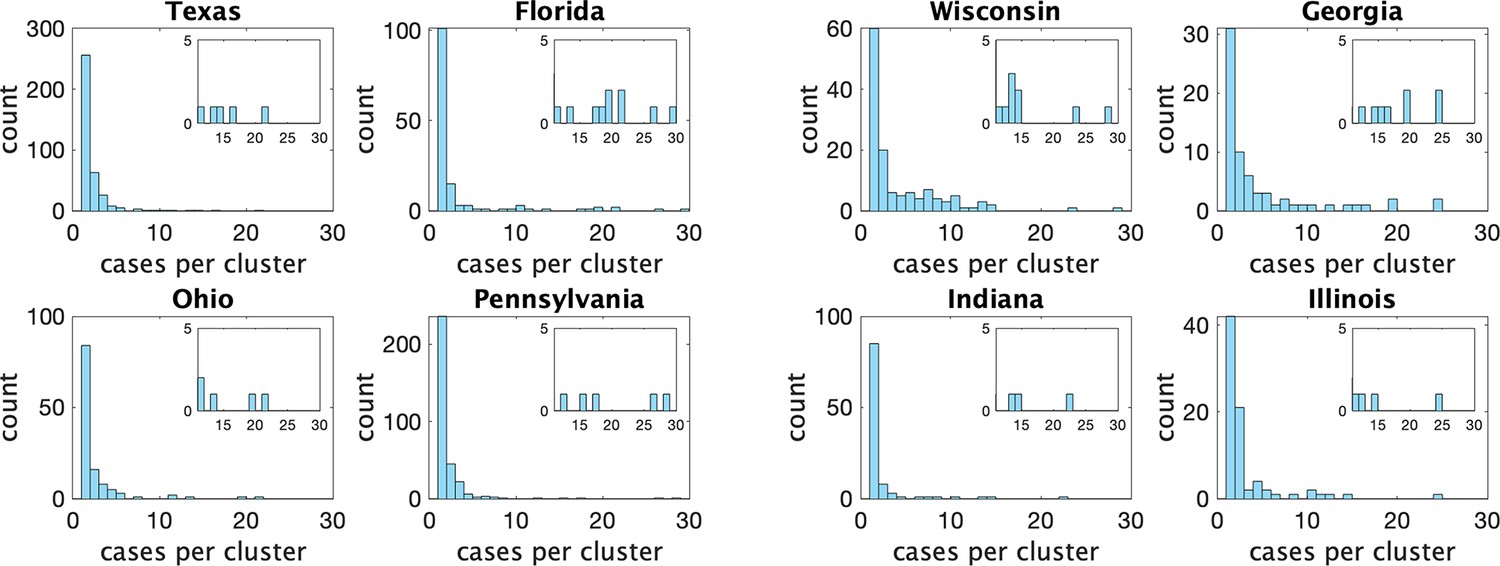
Histograms of observed cluster sizes in eight US states.
We only show clusters of size 30 or fewer. Each dot represents a single cluster of size 8 or larger, and indicates the presence of (more rare) larger clusters.
Appendix 1—figure 2
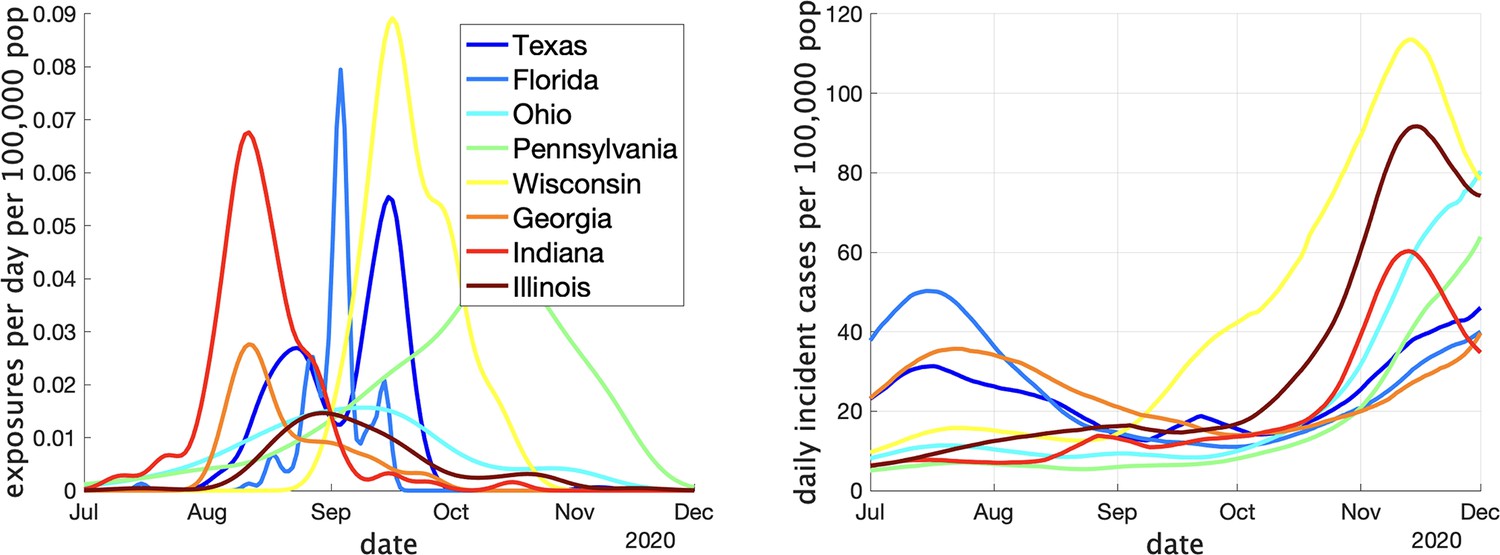
Two indicators of COVID prevalence over time in the eight US states.
(Left) Estimates of the rate of new clusters being reported (per 100,000 population) as a function of time in each province. (Right) Incident cases per day (per 100,000 population) in the same province over the corresponding time interval. Case counts are averaged over a 2-week window.
Appendix 1—figure 3

Estimates of mean and dispersion of cluster size for eight American states using the individual ascertainment model with ascertainment rate 0.75.
Estimate of mean includes index case. The sample size for estimates for each state is the Number of Clusters as shown in Appendix 1—table 1. 95% confidence ellipses are shown, computed using the inverse Hessian method.
Appendix 1—figure 4
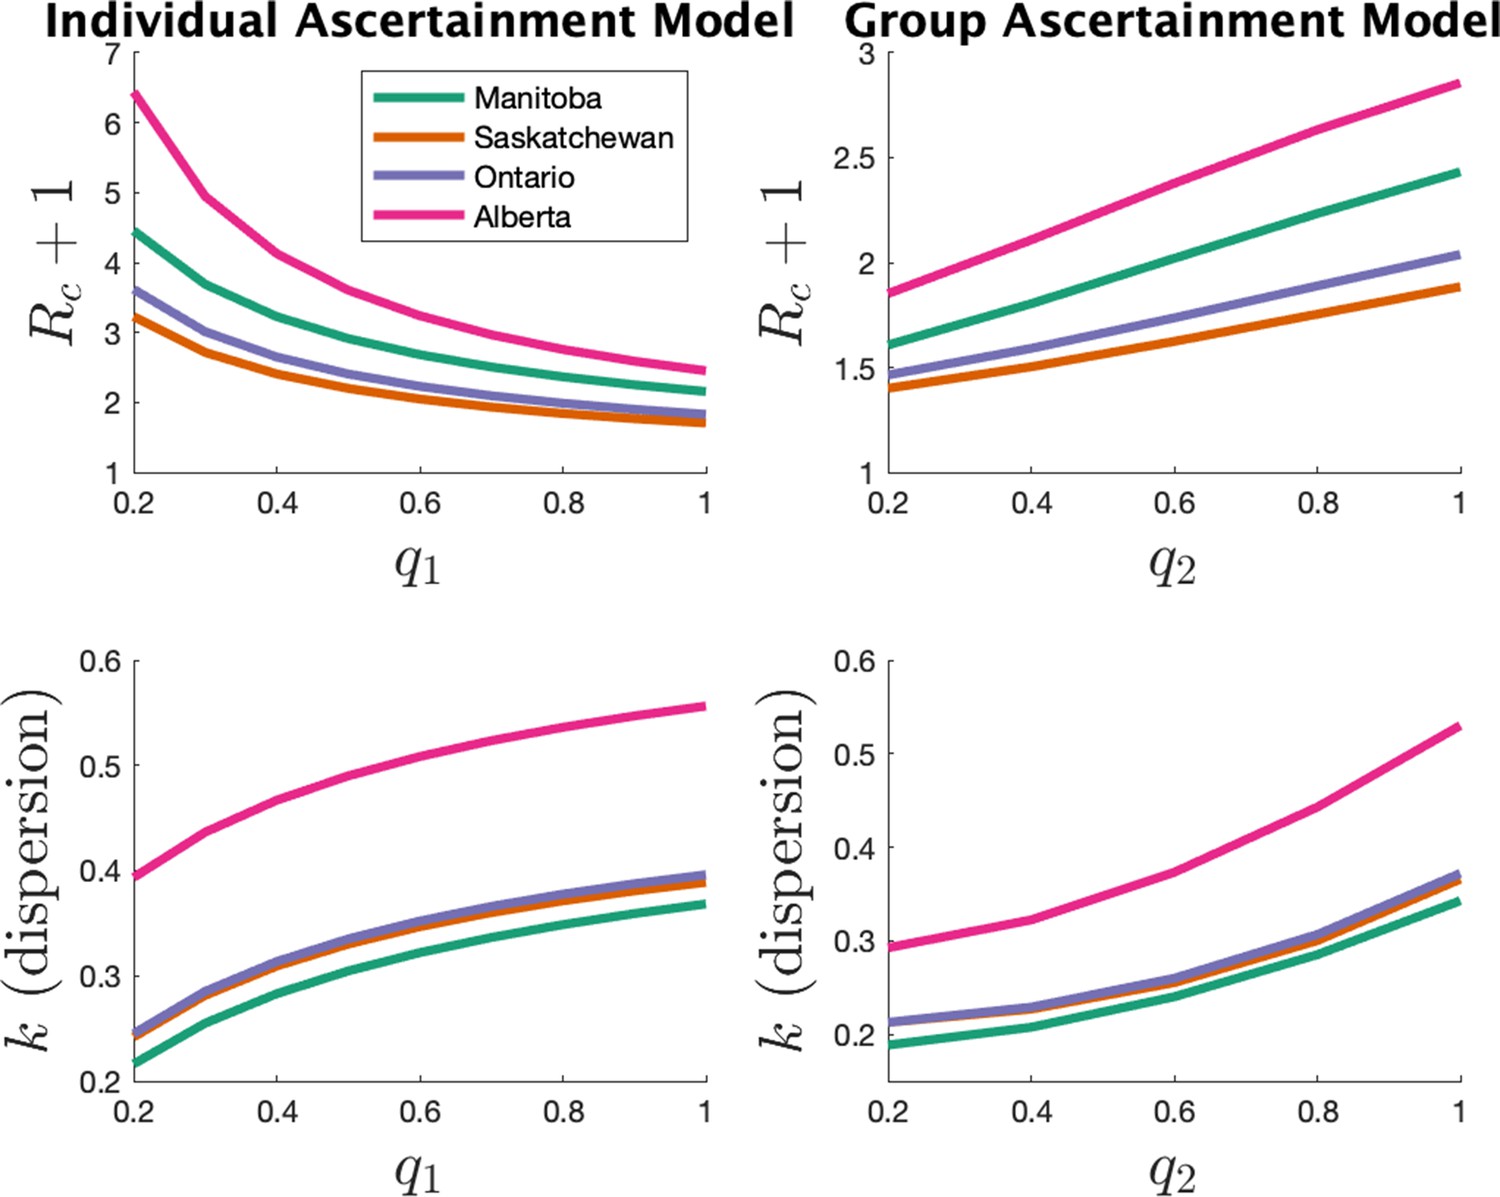
Estimates of mean and dispersion of cluster size for eight US states (left) and four Canadians provinces (right) using the individual ascertainment model (left) and the group ascertainment model (right) with varying ascertainment rate.
Estimates of mean includes index case.
Appendix 1—figure 5
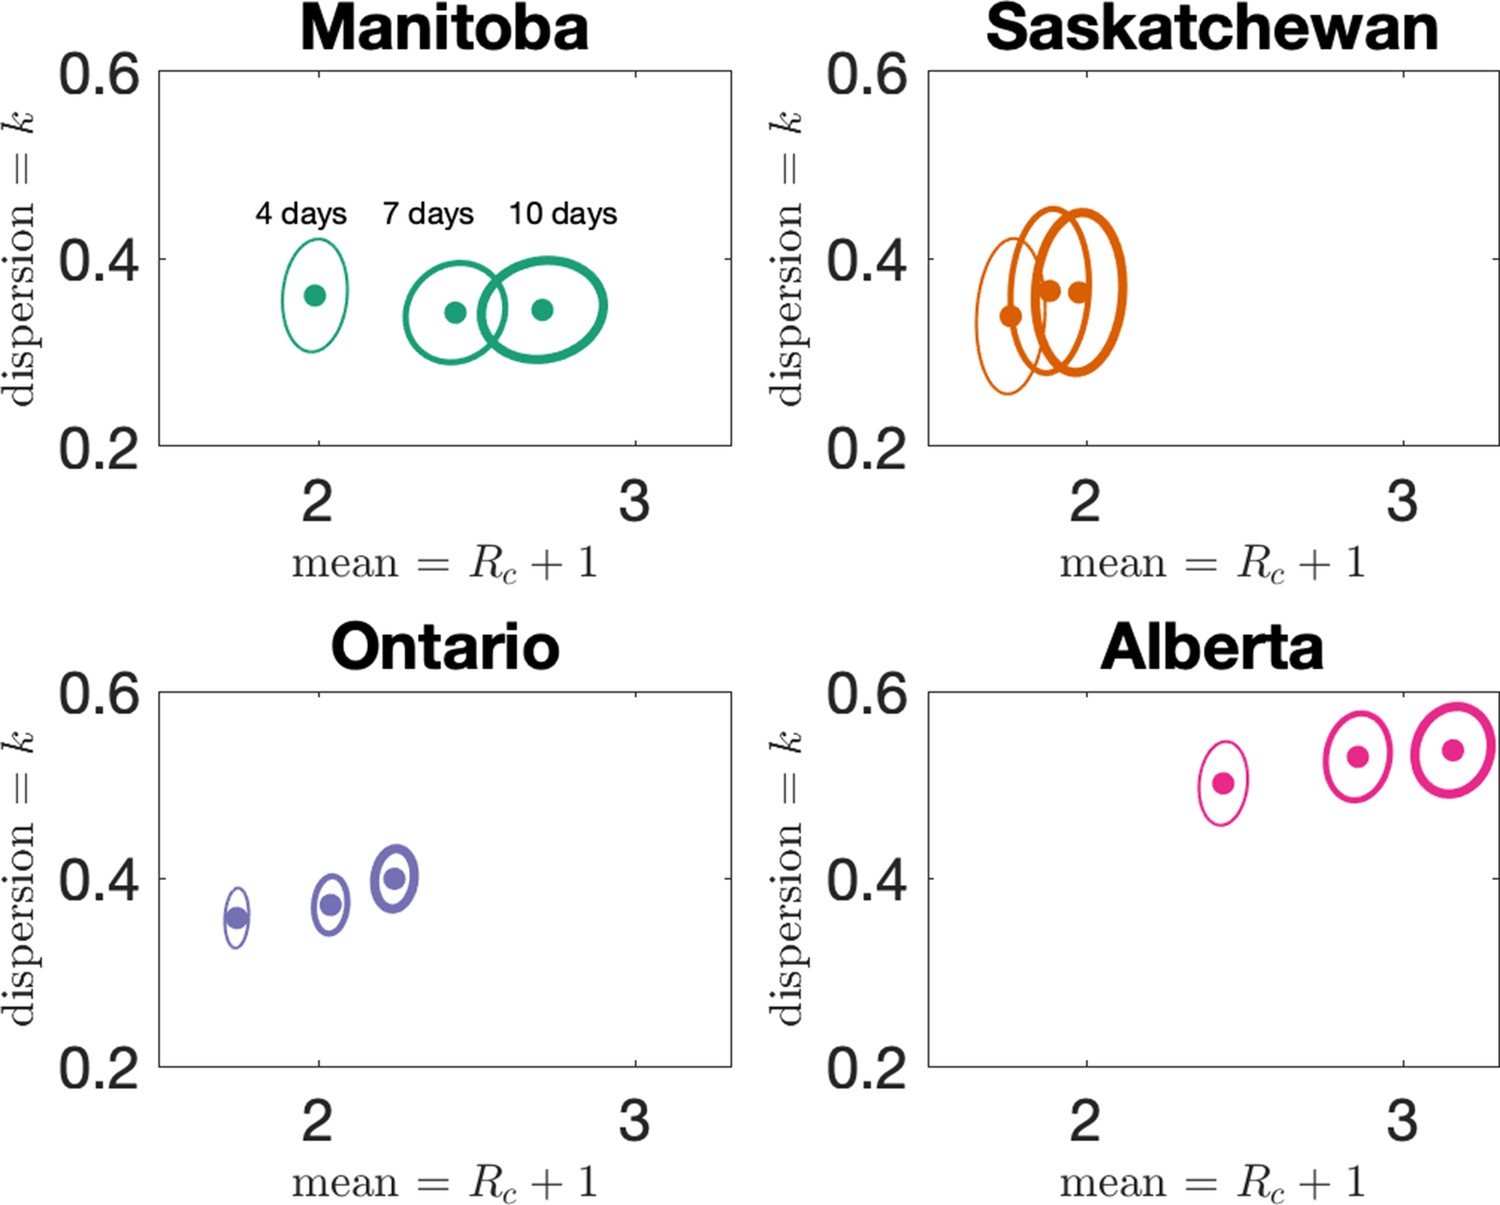
Estimates of mean and dispersion of cluster size for the four provinces with four different choices of the window for defining clusters.
Choices are 4, 7, and 10 days, with thicker lines on the error ellipse indicating more days.
The sample size for estimates for each province is the Number of Clusters as shown in Table 1 of the main text. 95% confidence ellipses are shown, computed using the inverse Hessian method.
Author response image 1

Tables
Table 1
Cluster statistics for each province.
(Top) For each of the four Canadian provinces: number of clusters in the data, number of schools reported, number of schools with multiple clusters, fraction of schools with multiple clusters. (Bottom) Fraction of clusters with one case, mean observed cluster size, maximum observed cluster size, and index of dispersion (variance of number of cases divided by mean number of cases) with and without subtracting one for the index case.
| Province | Number of Clusters | Number of Schools | Schools with Multiple clusters | Fraction of schools Multiple clusters | |
|---|---|---|---|---|---|
| Manitoba | 1754 | 542 | 396 | 0.73 | |
| Saskatchewan | 1211 | 466 | 295 | 0.63 | |
| Ontario | 8482 | 3337 | 2147 | 0.64 | |
| Alberta | 5032 | 1537 | 1158 | 0.75 | |
| Province | Fraction with | Mean observed | Max observed | Index of | IoD without |
| One case | Cluster size | Cluster size | Dispersion (IoD) | Index case | |
| Manitoba | 0.58 | 2.16 | 44 | 3.44 | 6.43 |
| Saskatchewan | 0.66 | 1.70 | 16 | 1.23 | 2.98 |
| Ontario | 0.63 | 1.83 | 50 | 1.87 | 4.13 |
| Alberta | 0.47 | 2.45 | 108 | 4.94 | 8.35 |
Table 2
Properties of the estimated distribution for the Poisson parameter , the index case-specific expected number of further cases in a cluster.
The expected value of is and its distribution gives important information about overdispersion of clusters. In units of hours-1.
| Province | Mean | Standard deviation | Median | 90th percentile | 99th percentile |
|---|---|---|---|---|---|
| Alberta | 1.86 | 2.55 | 8.9e-01 | 5.0 | 11.9 |
| Manitoba | 1.43 | 2.45 | 4.3e-01 | 4.1 | 11.7 |
| Saskatchewan | 0.88 | 1.46 | 2.9e-01 | 2.5 | 7.0 |
| Ontario | 1.04 | 1.70 | 3.5e-01 | 3.0 | 8.1 |
Table 3
Properties of the estimated distribution for the instantaneous transmission rate β.
In units of hours-1.
| Jurisdiction | Mean | Standard deviation | Median | 90th percentile | 99th percentile |
|---|---|---|---|---|---|
| Alberta | 4.8e-03 | 6.7e-03 | 2.2e-03 | 1.3e-02 | 3.2e-02 |
| Manitoba | 3.3e-03 | 5.5e-03 | 1.1e-03 | 9.5e-03 | 2.6e-02 |
| Saskatchewan | 2.5e-03 | 4.4e-03 | 7.4e-04 | 7.4e-03 | 2.1e-02 |
| Ontario | 2.5e-03 | 4.1e-03 | 7.8e-04 | 7.1e-03 | 2.0e-02 |
Appendix 1—table 1
Cluster statistics for each state in the US data.
(Top) For each of the eight US states: number of clusters in the data, number of schools reported, number of schools with multiple clusters, fraction of schools with multiple clusters. (Bottom) Fraction of clusters with one case, mean observed cluster size, maximum observed cluster size, and index of dispersion (variance of number of cases divided by mean number of cases) with and without subtracting one for the index case.
| State | Number of Clusters | Number of Schools | Schools with Multiple clusters | Fraction of Multiple schools clusters | |
|---|---|---|---|---|---|
| Texas | 369 | 326 | 30 | 0.09 | |
| Florida | 147 | 134 | 10 | 0.07 | |
| Ohio | 122 | 95 | 12 | 0.13 | |
| Pennsylvania | 322 | 247 | 46 | 0.19 | |
| Wisconsin | 130 | 118 | 11 | 0.09 | |
| Georgia | 68 | 53 | 10 | 0.19 | |
| Indiana | 105 | 84 | 13 | 0.15 | |
| Illinois | 81 | 76 | 5 | 0.07 | |
| State | Fraction with One case | Mean observed Cluster size | Max observed Cluster size | Index of Dispersion (IoD) | IoD without Index case |
| Texas | 0.69 | 1.73 | 21 | 2.29 | 5.40 |
| Florida | 0.69 | 5.31 | 90 | 27.28 | 33.62 |
| Ohio | 0.69 | 2.11 | 21 | 4.30 | 8.18 |
| Pennsylvania | 0.73 | 1.75 | 28 | 3.84 | 8.95 |
| Wisconsin | 0.46 | 4.02 | 31 | 6.28 | 8.36 |
| Georgia | 0.46 | 4.76 | 38 | 10.09 | 12.77 |
| Indiana | 0.81 | 2.19 | 36 | 9.00 | 16.56 |
| Illinois | 0.52 | 3.47 | 36 | 11.07 | 15.55 |
Appendix 1—table 2
Estimates of dispersion and mean cluster size for the four provinces for three choices of the cluster definition window: 4 days, 7 days (the choice in the main text), and 10 days.
| Province | Dispersion | Mean cluster size | ||||
|---|---|---|---|---|---|---|
| 4 days | 7 days | 10 days | 4 days | 7 days | 10 days | |
| Manitoba | 0.36 | 0.34 | 0.35 | 1.99 | 2.43 | 2.71 |
| Saskatchewan | 0.34 | 0.37 | 0.36 | 1.76 | 1.88 | 1.98 |
| Ontario | 0.36 | 0.37 | 0.40 | 1.74 | 2.04 | 2.24 |
| Alberta | 0.50 | 0.53 | 0.54 | 2.43 | 2.86 | 3.16 |
Additional files
Download links
A two-part list of links to download the article, or parts of the article, in various formats.
Downloads (link to download the article as PDF)
Open citations (links to open the citations from this article in various online reference manager services)
Cite this article (links to download the citations from this article in formats compatible with various reference manager tools)
COVID-19 cluster size and transmission rates in schools from crowdsourced case reports
eLife 11:e76174.
https://doi.org/10.7554/eLife.76174


