Distinct impact of IgG subclass on autoantibody pathogenicity in different IgG4-mediated diseases
- Center for Immune-Related Diseases at Shanghai Institute of Immunology, Ruijin Hospital, Shanghai Jiao Tong University School of Medicine, China
- Shanghai Institute of Immunology, Faculty of Basic Medicine; Key Laboratory of Cell Differentiation and Apoptosis of Chinese Ministry of Education, Shanghai Jiao Tong University School of Medicine, China
- Jiangsu Institute of Hematology, The First Affiliated Hospital of Soochow University, China
- Collaborative Innovation Center of Hematology, Soochow University, China
- Department of Dermatology, Rui Jin Hospital, Shanghai Jiao Tong University School of Medicine, China
Figures
Figure 1 with 2 supplements
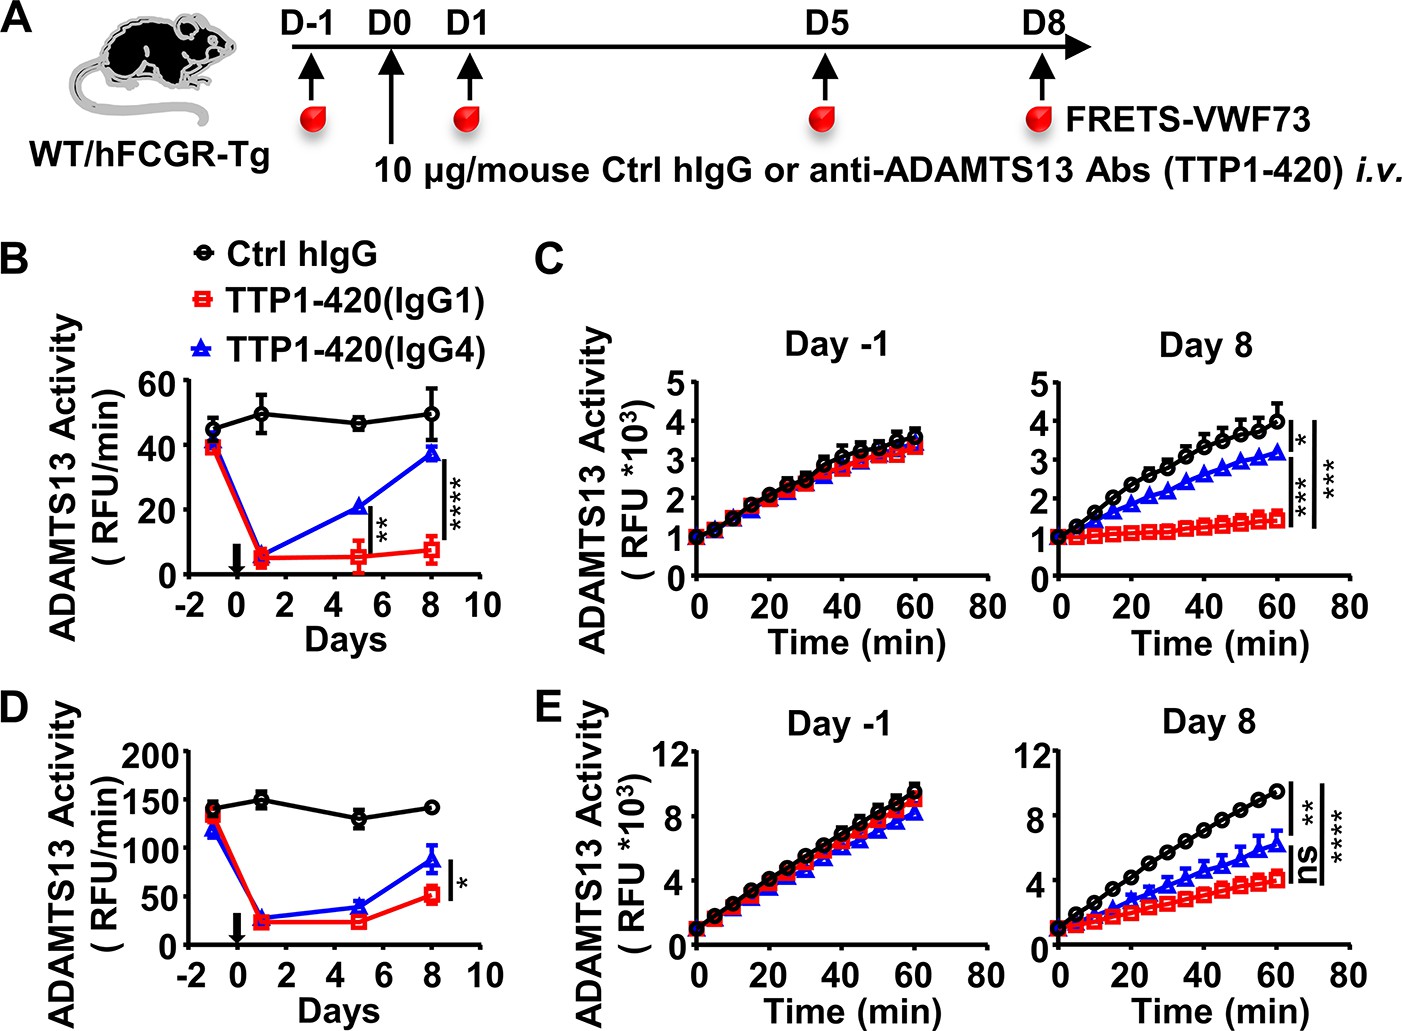
IgG4 is less pathogenic than IgG1 in anti-ADAMTS13 autoantibodies.
(A) Schematic diagram of the experimental design. In brief, wild-type (WT) C57BL/6 or hFCGR-Tg mice were treated with 10 μg of control human IgG (Ctrl hIgG, n≥3), or anti-ADAMTS13 TTP1-420(IgG1) or TTP1-420(IgG4) (n≥4) on day 0 through tail vein injection, blood was collected on day –1, day 1, day 5, and day 8 and analyzed for ADAMTS13 activity. (B–E) Plots showing ADAMTS13 activity in the plasma of WT (B, C) or hFCGR-Tg (D, E) mice treated with the indicated antibodies at the indicated time points and analyzed by the FRETS-VWF73 assay, presented as relative fluorescence units (RFU) changing rates over time (RFU/min) (B, D), and the RFU change within 1 hr on day –1 and day 8 (C, E). Mean ± SEM values are plotted. Two-way ANOVA with Tukey’s (B, D) or Sidak’s (C, E) multiple comparisons tests. *p<0.05, **p<0.01, ***p<0.001, ****p<0.0001. A representative of two independent experiments is shown.
-
Figure 1—source data 1
Related to Figure 1B.
- https://cdn.elifesciences.org/articles/76223/elife-76223-fig1-data1-v2.xlsx
-
Figure 1—source data 2
Related to Figure 1C.
- https://cdn.elifesciences.org/articles/76223/elife-76223-fig1-data2-v2.xlsx
-
Figure 1—source data 3
Related to Figure 1C.
- https://cdn.elifesciences.org/articles/76223/elife-76223-fig1-data3-v2.xlsx
-
Figure 1—source data 4
Related to Figure 1D.
- https://cdn.elifesciences.org/articles/76223/elife-76223-fig1-data4-v2.xlsx
-
Figure 1—source data 5
Related to Figure 1E.
- https://cdn.elifesciences.org/articles/76223/elife-76223-fig1-data5-v2.xlsx
-
Figure 1—source data 6
Related to Figure 1E.
- https://cdn.elifesciences.org/articles/76223/elife-76223-fig1-data6-v2.xlsx
Figure 1—figure supplement 1
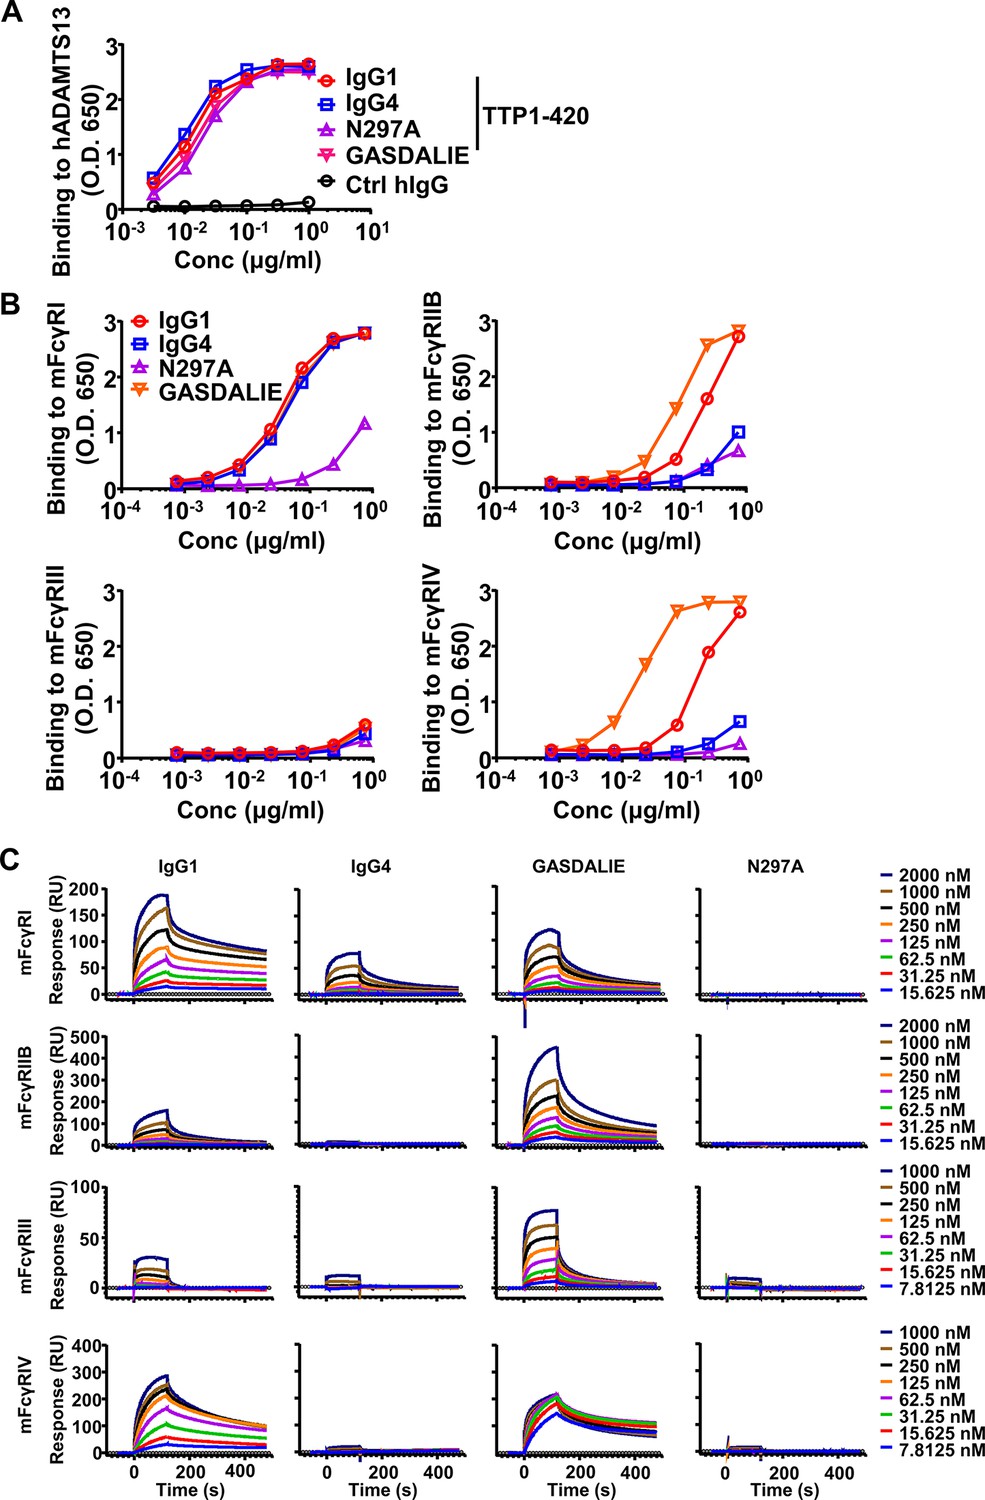
Binding kinetics of anti-ADAMTS13 IgG antibodies to ADAMTS13 and mouse FcγRs.
(A) The binding kinetics of indicated TTP1-420 anti-ADAMTS13 autoantibodies to human ADAMTS13 analyzed by ELISA with biotinylated anti-human Igλ chain as detecting antibodies. (B) The binding kinetics of TTP1-420 anti-human ADAMTS13 autoantibodies of indicated constant domains to indicated mouse FcγRs analyzed by ELISA. (C) SPR (surface plasmon resonance) analysis of the binding of human IgG autoantibodies to mouse FcγRs. Presented are real-time sensorgrams with different antibody concentrations.
Figure 1—figure supplement 2
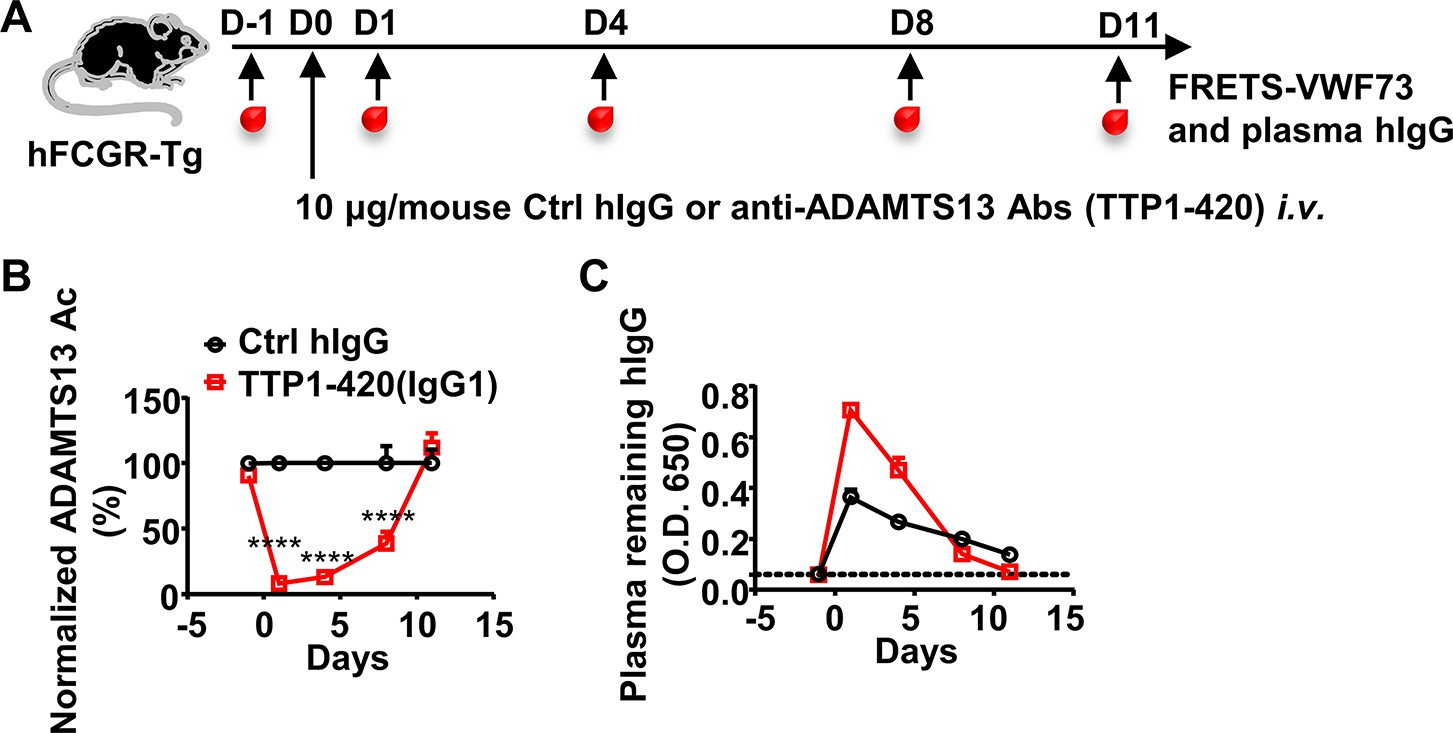
The decrease and recovery of plasma ADAMTS13 activity in TTP1-420(IgG1)-treated hFCGR-Tg mice.
(A) Schematic diagram of the experimental design. In brief, hFCGR-Tg mice were treated with 10 μg of control human IgG (Ctrl hIgG, n = 4), or anti-ADAMTS13 TTP1-420(IgG1) (n = 5) on day 0 through tail vein injection, and blood was collected on day –1, day 1, day 4, day 8, and day 11 and analyzed for ADAMTS13 activity and plasma remaining hIgG levels. (B) Plots showing ADAMTS13 activity in the plasma of hFCGR-Tg mice treated with TTP1-420(IgG1) antibodies at the indicated time points and analyzed by the FRETS-VWF73 assay, presented as (RFU/min) normalized to corresponding Ctrl hIgG group. (C) Plots showing the levels of the remaining human IgG in the plasma of mice in (A). Mean ± SEM values are plotted. Two-way ANOVA with Sidak’s multiple comparisons tests. ****p<0.0001.
Figure 2
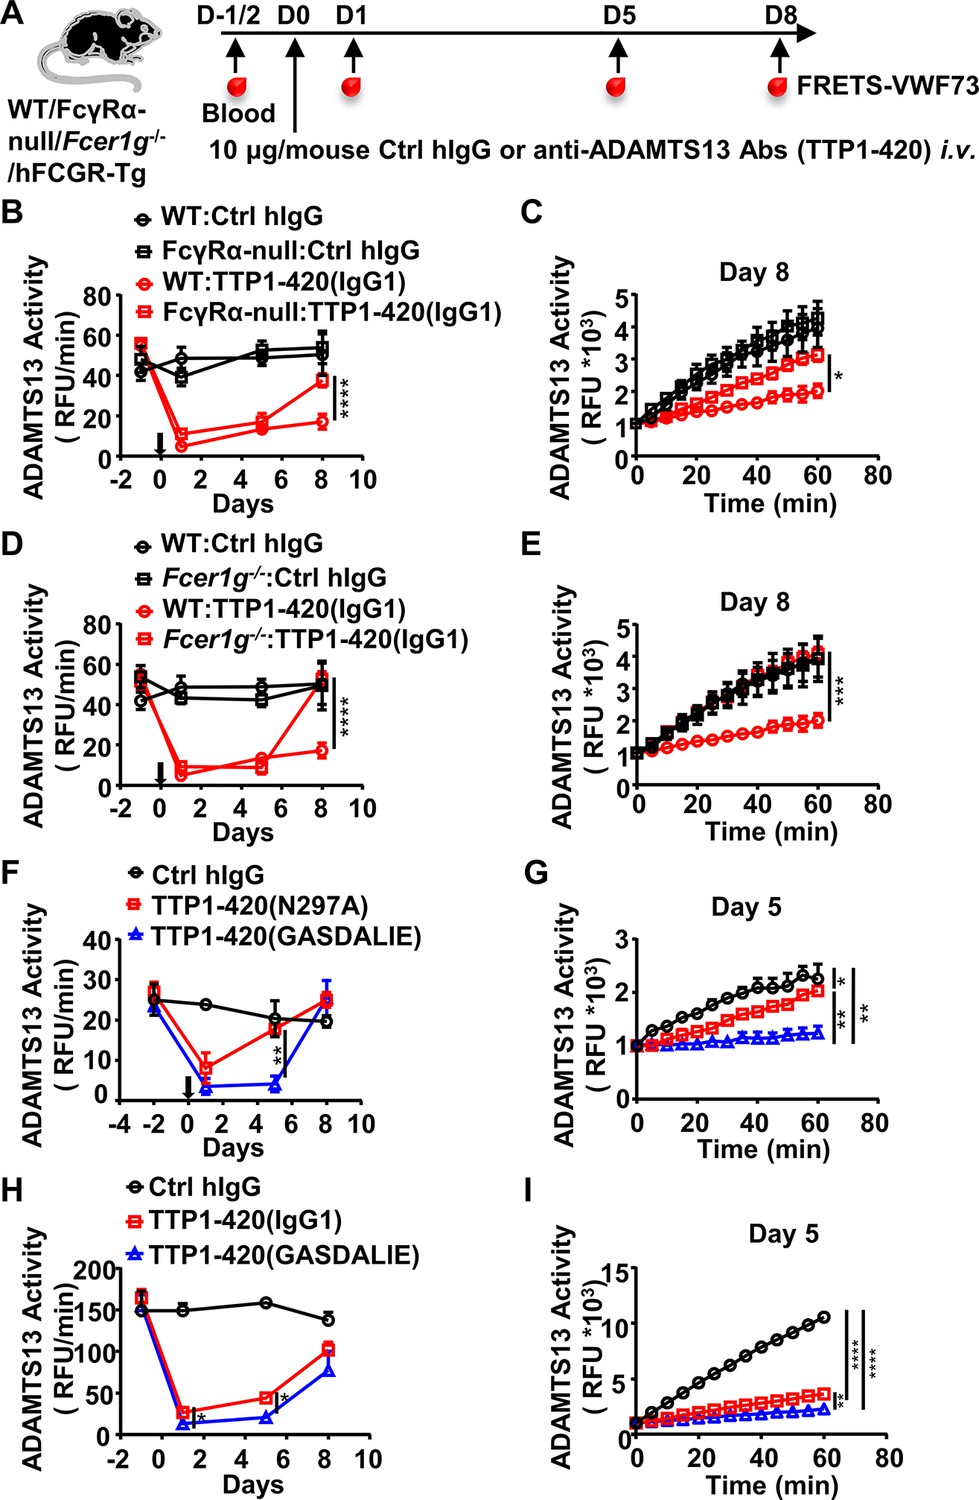
The protective effect of the IgG4 subclass in anti-ADAMTS13 autoantibodies is due to reduced FcγR-mediated antibody effector function.
(A) Schematic diagram of the experimental design. In brief, WT, FcγRα-null, Fcer1g-/-, or hFCGR-Tg mice (Ctrl hIgG, n=3~5; anti-ADAMTS13, n=4~5) were treated and analyzed as in Figure 1A. (B–E) Plots showing ADAMTS13 activity in the plasma of WT and FcγRα-null mice (B, C), WT and Fcer1g-/- mice (D, E), WT mice (F, G) or hFCGR-Tg mice (H, I) treated with the indicated antibodies and analyzed at indicated time points as in Figure 1B and C, presented as relative fluorescence units (RFU) changing rates over time (RFU/min) (B, D, F, H), and the RFU change within 1 hr on the indicated days (C, E, G, I). Mean ± SEM values are plotted. Two-way ANOVA with Sidak’s (B–E, G, and I) or Tukey’s (F and H) multiple comparisons tests. *p<0.05, **p<0.01, ***p<0.001, ****p<0.0001. A representative of two independent experiments is shown.
-
Figure 2—source data 1
Related to Figure 2B.
- https://cdn.elifesciences.org/articles/76223/elife-76223-fig2-data1-v2.xlsx
-
Figure 2—source data 2
Related to Figure 2C.
- https://cdn.elifesciences.org/articles/76223/elife-76223-fig2-data2-v2.xlsx
-
Figure 2—source data 3
Related to Figure 2D.
- https://cdn.elifesciences.org/articles/76223/elife-76223-fig2-data3-v2.xlsx
-
Figure 2—source data 4
Related to Figure 2E.
- https://cdn.elifesciences.org/articles/76223/elife-76223-fig2-data4-v2.xlsx
-
Figure 2—source data 5
Related to Figure 2F.
- https://cdn.elifesciences.org/articles/76223/elife-76223-fig2-data5-v2.xlsx
-
Figure 2—source data 6
Related to Figure 2G.
- https://cdn.elifesciences.org/articles/76223/elife-76223-fig2-data6-v2.xlsx
-
Figure 2—source data 7
Related to Figure 2H.
- https://cdn.elifesciences.org/articles/76223/elife-76223-fig2-data7-v2.xlsx
-
Figure 2—source data 8
Related to Figure 2I.
- https://cdn.elifesciences.org/articles/76223/elife-76223-fig2-data8-v2.xlsx
Figure 3
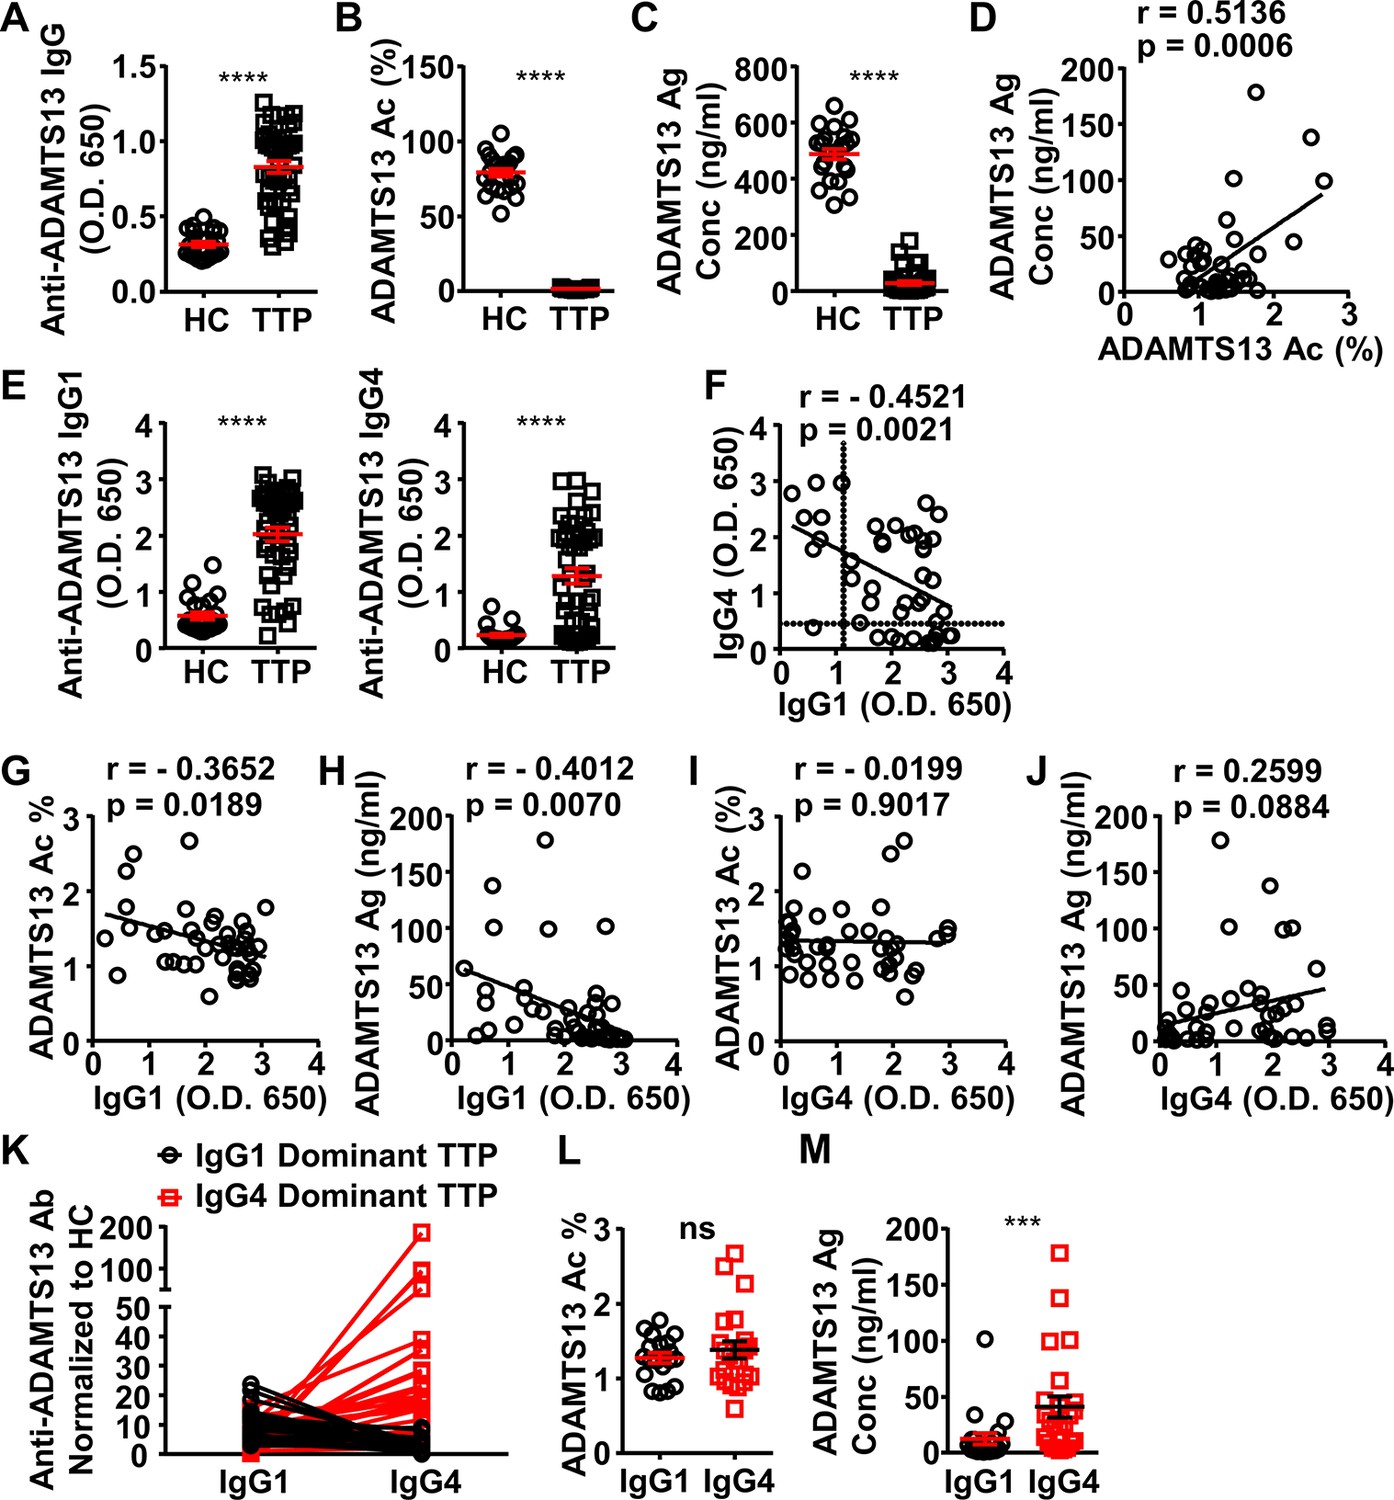
ADAMTS13-specific IgG1 levels in the plasma of acquired thrombotic thrombocytopenic purpura (TTP) patients inversely correlate to the ADAMTS13 Ag levels and activity.
(A–C) Plots showing ADAMTS13-specific IgG (A), ADAMTS13 activity (B), and ADAMTS13 antigen (C) levels in the plasma of healthy control (HC) (n=23) and acquired TTP patients during the acute phase (n=44). (D) Plot showing correlation analysis of ADAMTS13 activity with ADAMTS13 Ag concentration in TTP patients. (E) ADAMTS13-specific IgG1 (left panel) and IgG4 (right panel) levels in the plasma of TTP patients and HC. (F) Plot showing correlation analysis of ADAMTS13-specific IgG1 with IgG4 levels in TTP patients, with the threshold for IgG1 and IgG4 autoantibodies (two times of HC average values) annotated. (G–J) Plots showing correlation analysis between the anti-ADAMTS13 IgG1 (G, H) and IgG4 (I, J) levels with ADAMTS13 activity (G, I) and ADAMTS13 Ag (H, J) levels in TTP patients, respectively. (K) Plots showing IgG1 and IgG4 anti-ADAMTS13 levels in TTP plasma samples normalized to HC, with IgG1-dominant TTP and IgG4-dominant TTP samples annotated. (L, M) Plot showing ADAMTS13 activity (L) and antigen (M) levels in TTP plasma samples as annotated in (K). Each symbol is derived from an individual plasma sample. Mean ± SEM values are plotted. Unpaired nonparametric Mann-Whitney test (A, B, C, E, L, M) or linear regression analysis (D, F–J). ***p<0.001, ****p<0.0001, ns, non-significant.
-
Figure 3—source data 1
Related to Figure 3A.
- https://cdn.elifesciences.org/articles/76223/elife-76223-fig3-data1-v2.xlsx
-
Figure 3—source data 2
Related to Figure 3B.
- https://cdn.elifesciences.org/articles/76223/elife-76223-fig3-data2-v2.xlsx
-
Figure 3—source data 3
Related to Figure 3C.
- https://cdn.elifesciences.org/articles/76223/elife-76223-fig3-data3-v2.xlsx
-
Figure 3—source data 4
Related to Figure 3D.
- https://cdn.elifesciences.org/articles/76223/elife-76223-fig3-data4-v2.xlsx
-
Figure 3—source data 5
Related to Figure 3E.
- https://cdn.elifesciences.org/articles/76223/elife-76223-fig3-data5-v2.xlsx
-
Figure 3—source data 6
Related to Figure 3E.
- https://cdn.elifesciences.org/articles/76223/elife-76223-fig3-data6-v2.xlsx
-
Figure 3—source data 7
Related to Figure 3F.
- https://cdn.elifesciences.org/articles/76223/elife-76223-fig3-data7-v2.xlsx
-
Figure 3—source data 8
Related to Figure 3G.
- https://cdn.elifesciences.org/articles/76223/elife-76223-fig3-data8-v2.xlsx
-
Figure 3—source data 9
Related to Figure 3H.
- https://cdn.elifesciences.org/articles/76223/elife-76223-fig3-data9-v2.xlsx
-
Figure 3—source data 10
Related to Figure 3I.
- https://cdn.elifesciences.org/articles/76223/elife-76223-fig3-data10-v2.xlsx
-
Figure 3—source data 11
Related to Figure 3J.
- https://cdn.elifesciences.org/articles/76223/elife-76223-fig3-data11-v2.xlsx
-
Figure 3—source data 12
Related to Figure 3K.
- https://cdn.elifesciences.org/articles/76223/elife-76223-fig3-data12-v2.xlsx
-
Figure 3—source data 13
Related to Figure 3L.
- https://cdn.elifesciences.org/articles/76223/elife-76223-fig3-data13-v2.xlsx
-
Figure 3—source data 14
Related to Figure 3M.
- https://cdn.elifesciences.org/articles/76223/elife-76223-fig3-data14-v2.xlsx
Figure 4 with 5 supplements
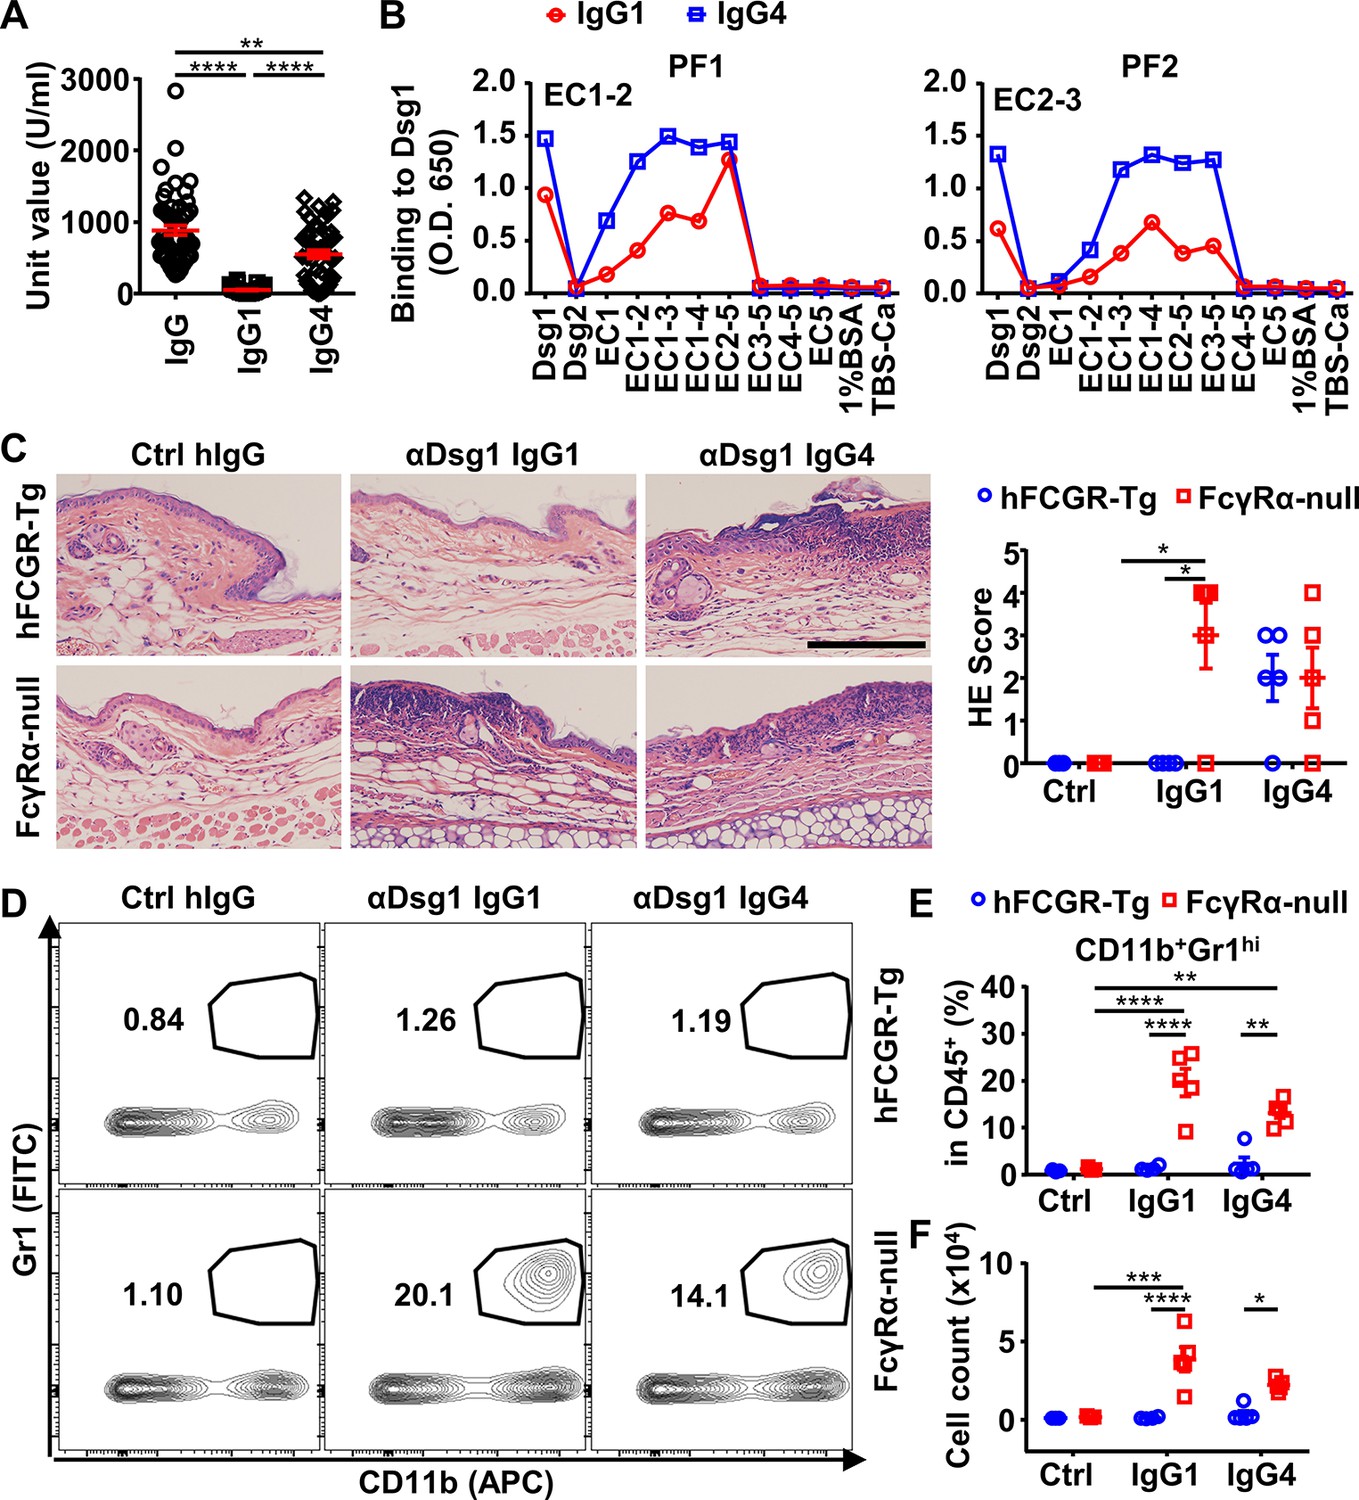
IgG4 is not less, if not more, pathogenic than IgG1 in Dsg1 autoantibodies, and both could be exacerbated by FcγRs deficiency.
(A) Plots showing the unit values of indicated Dsg1-specific antibodies in the serum of pemphigus foliaceus (PF) patients (n=53). (B) Plots showing the levels of IgG1 and IgG4 antibodies in two PF patients that bind to Dsg1, Dsg2, or Dsg1/Dsg2 chimeric molecules containing the indicated Dsg1 EC domains. (C) Representative photos and scores showing the hematoxylin-eosin (HE) staining results of ears of hFCGR-Tg and FcγRα-null mice 3 days after being treated with 0.4 mg of Ctrl hIgG (n=3), or PF24-9(IgG1) or PF24-9(IgG4) (n≥4) through tail vein injection. Scale bars: 200 μm. (D–F) Representative flow cytometry profiles (D) and plots showing the percentage (E) and cell number (F) of infiltrating neutrophils (CD11b+Gr1hi) among leukocytes (CD45+) in the ears of mice in (C). Each symbol is derived from an individual PF patient (A) or an individual mouse (C, E, F). Mean ± SEM values are plotted (A, C, E, F). One-way ANOVA (A) and two-way ANOVA (C, E, F) with Tukey’s multiple comparisons test. *p<0.05, **p<0.01, ***p<0.001, ****p<0.0001. A representative of two independent experiments is shown.
-
Figure 4—source data 1
Related to Figure 4A.
- https://cdn.elifesciences.org/articles/76223/elife-76223-fig4-data1-v2.xlsx
-
Figure 4—source data 2
Related to Figure 4B.
- https://cdn.elifesciences.org/articles/76223/elife-76223-fig4-data2-v2.xlsx
-
Figure 4—source data 3
Related to Figure 4B.
- https://cdn.elifesciences.org/articles/76223/elife-76223-fig4-data3-v2.xlsx
-
Figure 4—source data 4
Related to Figure 4C.
- https://cdn.elifesciences.org/articles/76223/elife-76223-fig4-data4-v2.xlsx
-
Figure 4—source data 5
Related to Figure 4E.
- https://cdn.elifesciences.org/articles/76223/elife-76223-fig4-data5-v2.xlsx
-
Figure 4—source data 6
Related to Figure 4F.
- https://cdn.elifesciences.org/articles/76223/elife-76223-fig4-data6-v2.xlsx
Figure 4—figure supplement 1
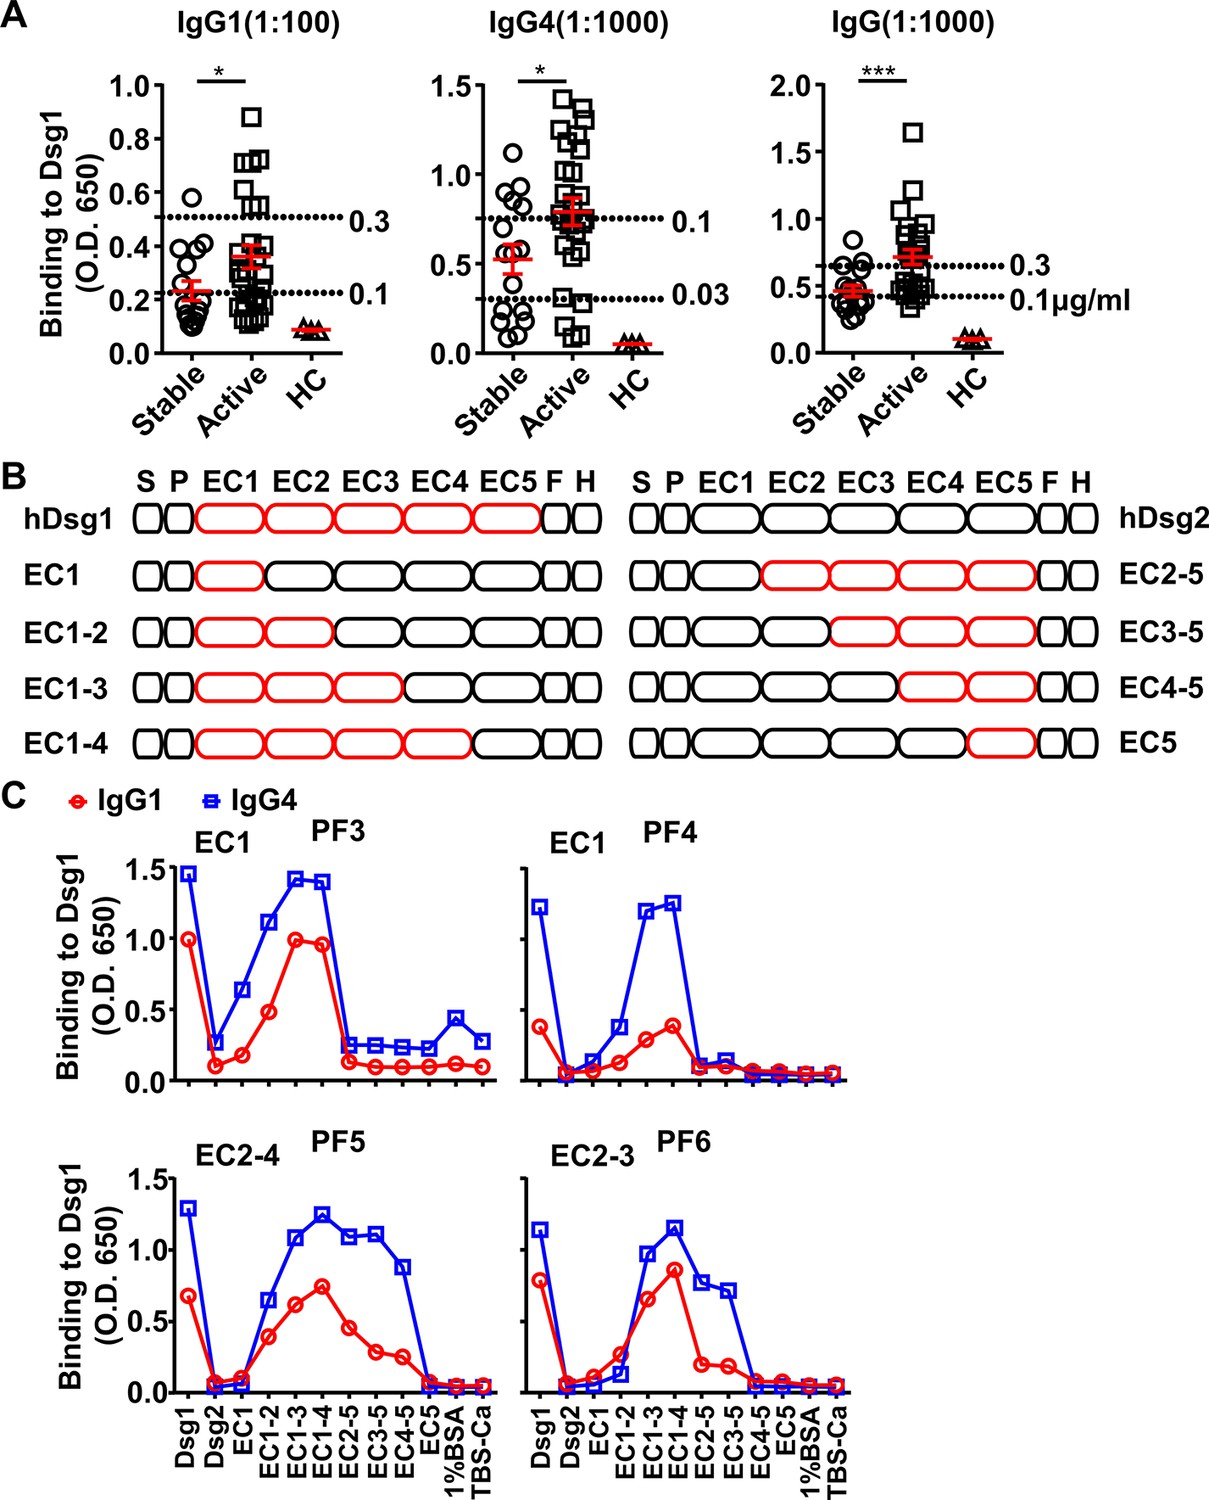
IgG4 and IgG1 anti-Dsg1 autoantibodies have shared binding epitopes and different abundance in pemphigus foliaceus (PF) patients.
(A) Plots showing the levels of indicated Dsg1-specific antibodies in stable (n=21) and active (n=32) PF patients and healthy controls (n=3), presented as ELISA OD650 values, with serum dilutions and signals of reference antibodies (clone PF24-9) with indicated concentrations (dashed lines) annotated. (B) Schematic diagram showing the structure of Dsg1, Dsg2, and Dsg1/Dsg2 chimeric molecules. S, signal peptide; P, propeptide; EC1-5, extracellular domain 1–5; F, H, FlagHis tag. (C) Plots showing the levels of IgG1 and IgG4 antibodies in another four PF patients that bind to Dsg1, Dsg2, or Dsg1/Dsg2 chimeric molecules containing the indicated Dsg1 EC domains, with binding epitopes annotated. Each symbol is derived from an individual PF patient or healthy people (A). Mean ± SEM values are plotted (A). Unpaired nonparametric Mann-Whitney test (A). *p<0.05, ***p<0.001.
Figure 4—figure supplement 2
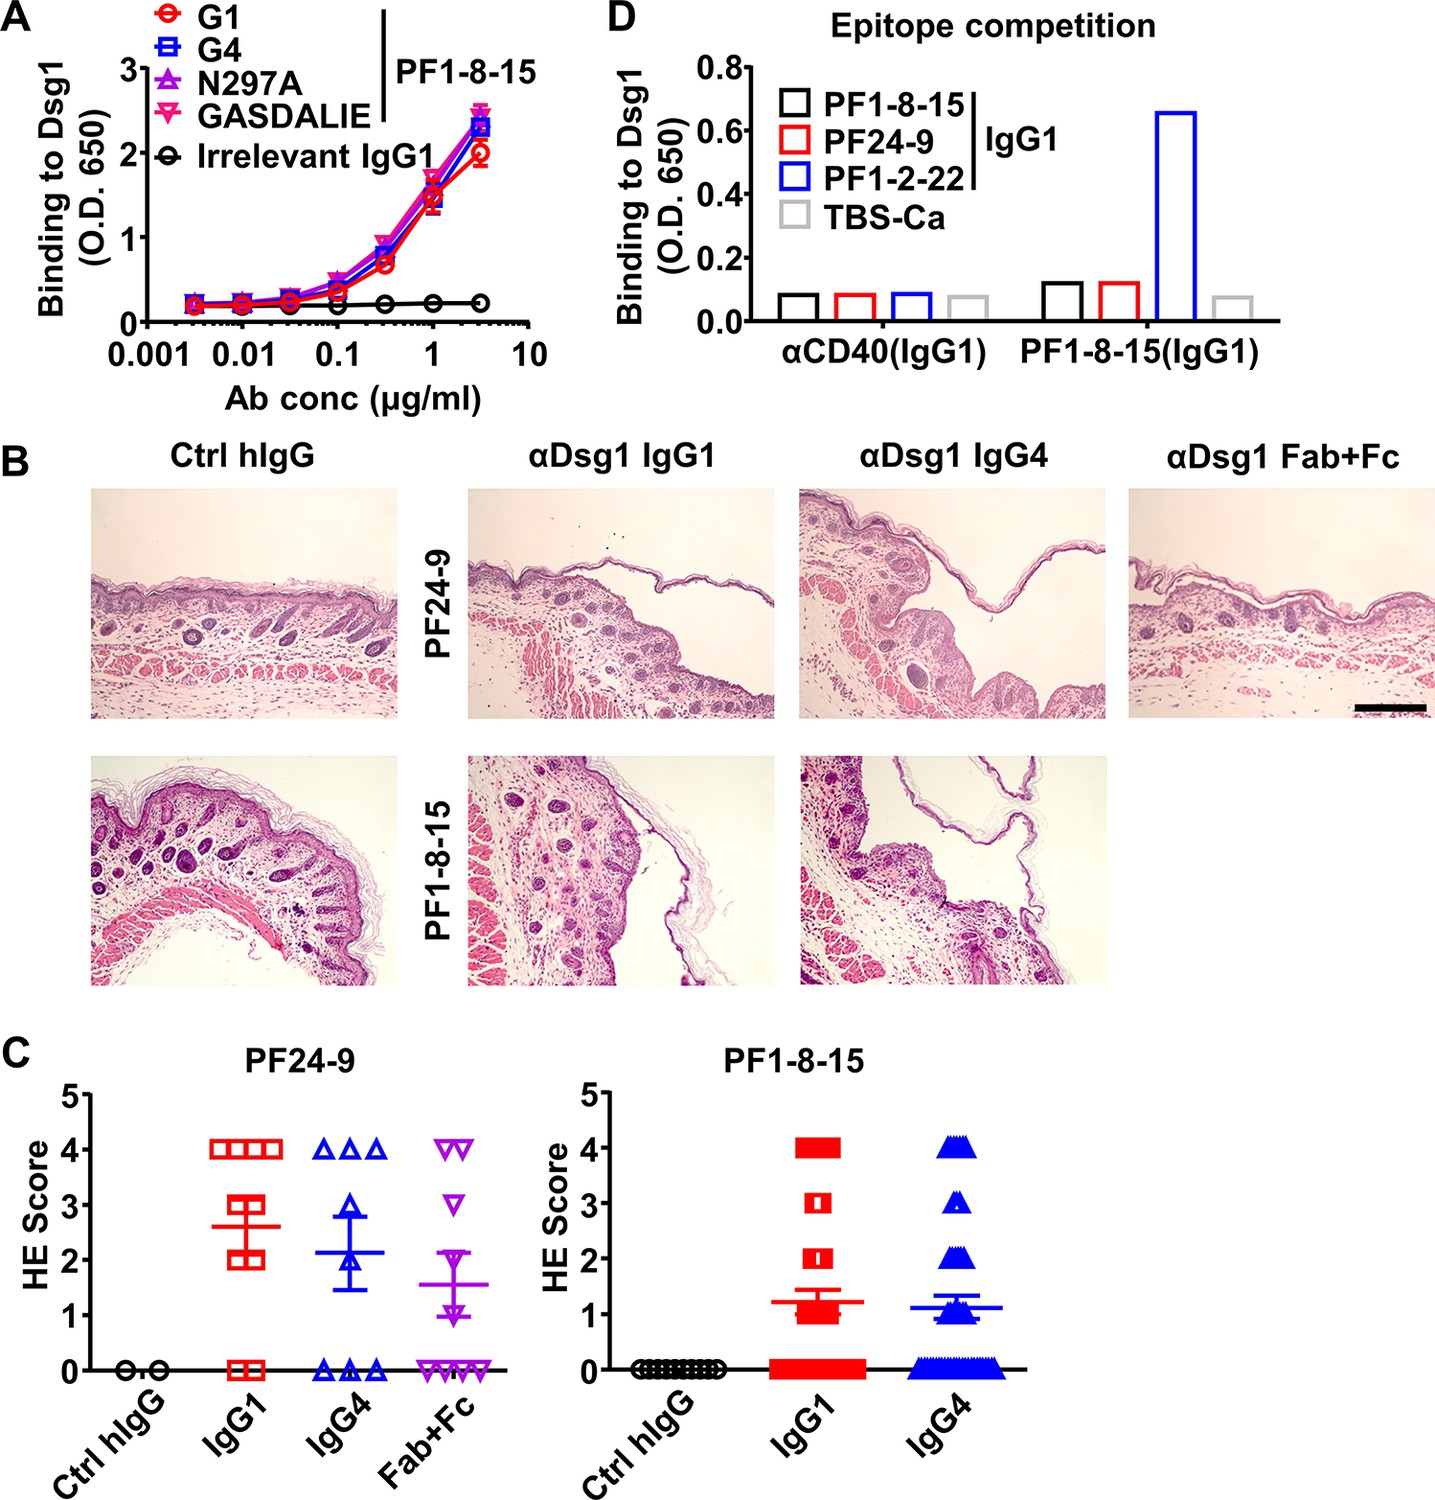
Properties of anti-Dsg1 antibodies.
(A) The binding kinetics of different PF1-8-15 anti-Dsg1 IgG antibodies to Dsg1 analyzed by ELISA with biotinylated anti-human Igλ chain as detecting antibodies. Irrelevant TTP1-420(IgG1) was included as a negative control. (B) Representative hematoxylin-eosin (HE) results showing the epidermal blistering in neonatal mice 7 hr after being treated with Ctrl hIgG or indicated anti-Dsg1 IgG1, IgG4, or digested Fab + Fc. Scale bars: 200 μm. (C) HE scores of neonatal mice (PF24-9: n = 2/10/8/9; PF1-8-15: n = 10/50/50) treated with control human IgG or anti-Dsg1 antibodies in (B). (D) Plot showing the binding of antibodies indicated on the X-axis (αCD40(IgG1) or PF1-8-15(IgG1)) to Dsg1 captured by indicated anti-Dsg1 antibodies or TBS-Ca. Each symbol is derived from an individual mouse (C). Mean ± SEM values are plotted (A, C). One-way ANOVA with Tukey’s multiple comparisons test (C).
Figure 4—figure supplement 3
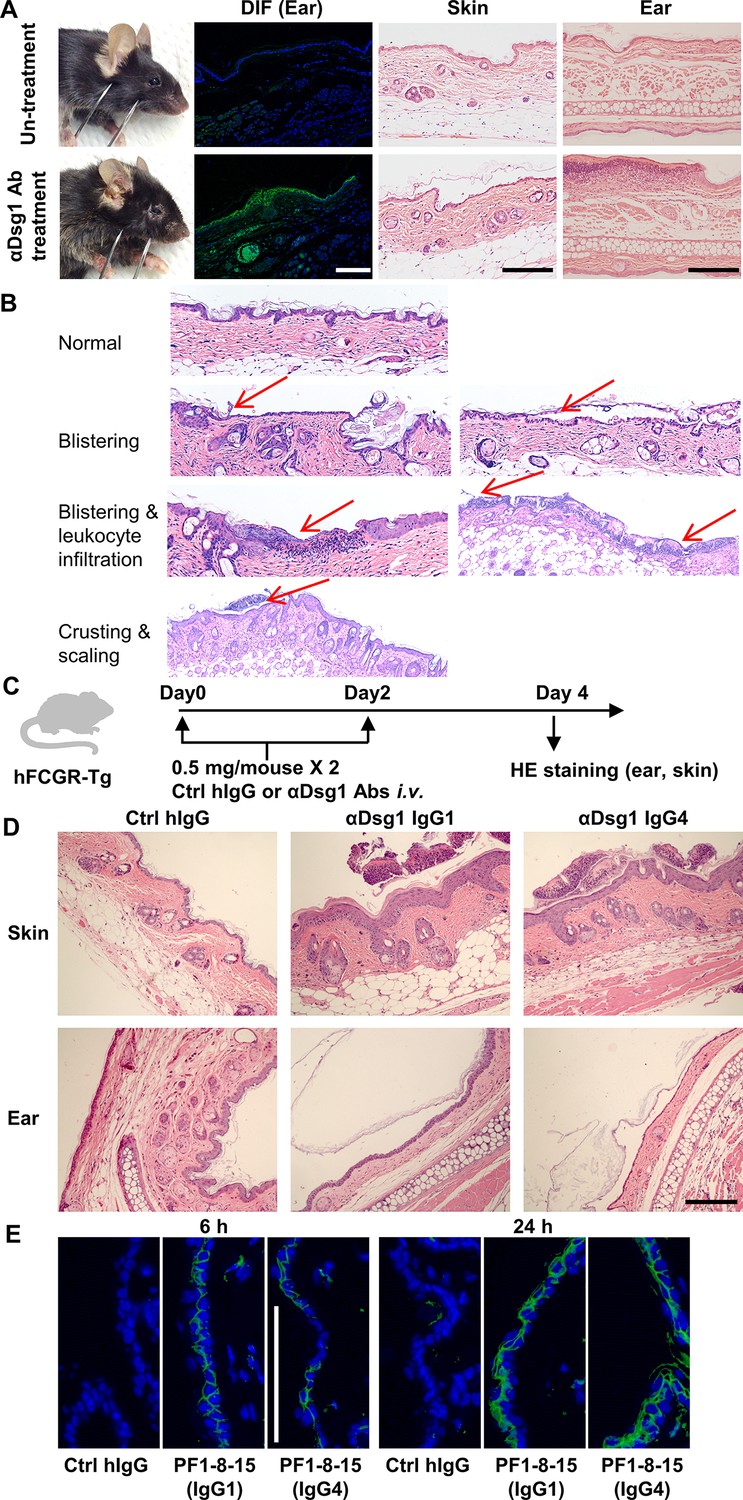
An adult mouse model of pemphigus foliaceus.
(A) Representative photos of hFCGR-Tg mouse untreated or treated with 3 mg of PF24-9(IgG1) anti-Dsg1 autoantibodies, showing skin lesions, human IgG deposition in the ear (direct immunofluorescence [DIF]), hematoxylin-eosin (HE) results of skin and ear tissues. (B) Histological features of skin before and after blister onset. (C) Schematic diagram showing the experimental design for evaluating the pathogenicity of anti-Dsg1 autoantibodies in hFCGR-Tg mice. hFCGR-Tg mice were treated with two doses of 0.5 mg of Ctrl hIgG or PF24-9 anti-Dsg1 antibodies on day 0 and day 2, respectively. On day 4, skin and ear tissues were subjected to HE staining. (D) Representative photos showing the HE results of the indicated tissues in hFCGR-Tg mice treated as in (C). (E) DIF results showing the IgG deposition in the skin of hFCGR-Tg mice 6 or 24 hr after being treated with 0.5 mg of Ctrl hIgG or PF1-8-15 anti-Dsg1 IgG1 or IgG4. Scale bars: 200 μm (HE), 100 μm (DIF).
Figure 4—figure supplement 4
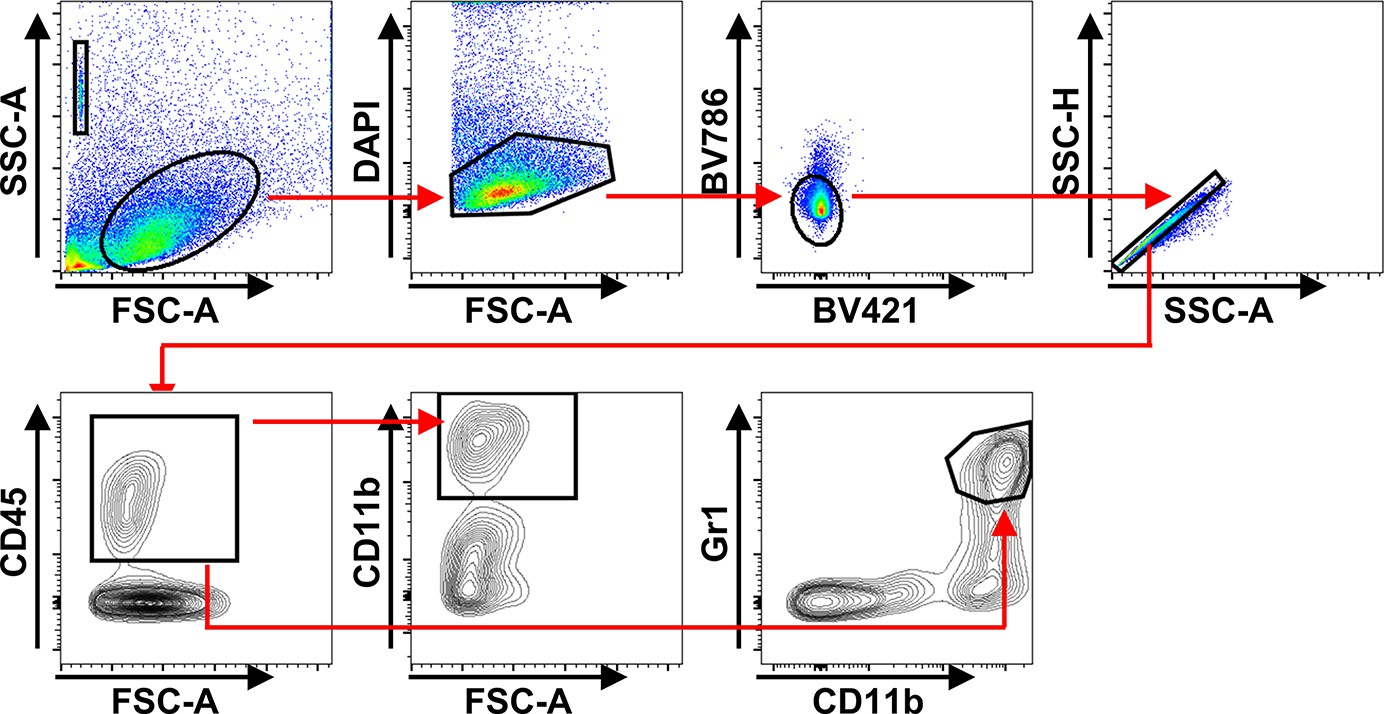
Gating strategy used for CD11b+ myeloid cells and CD11b+Gr1hi neutrophils.
Figure 4—figure supplement 5
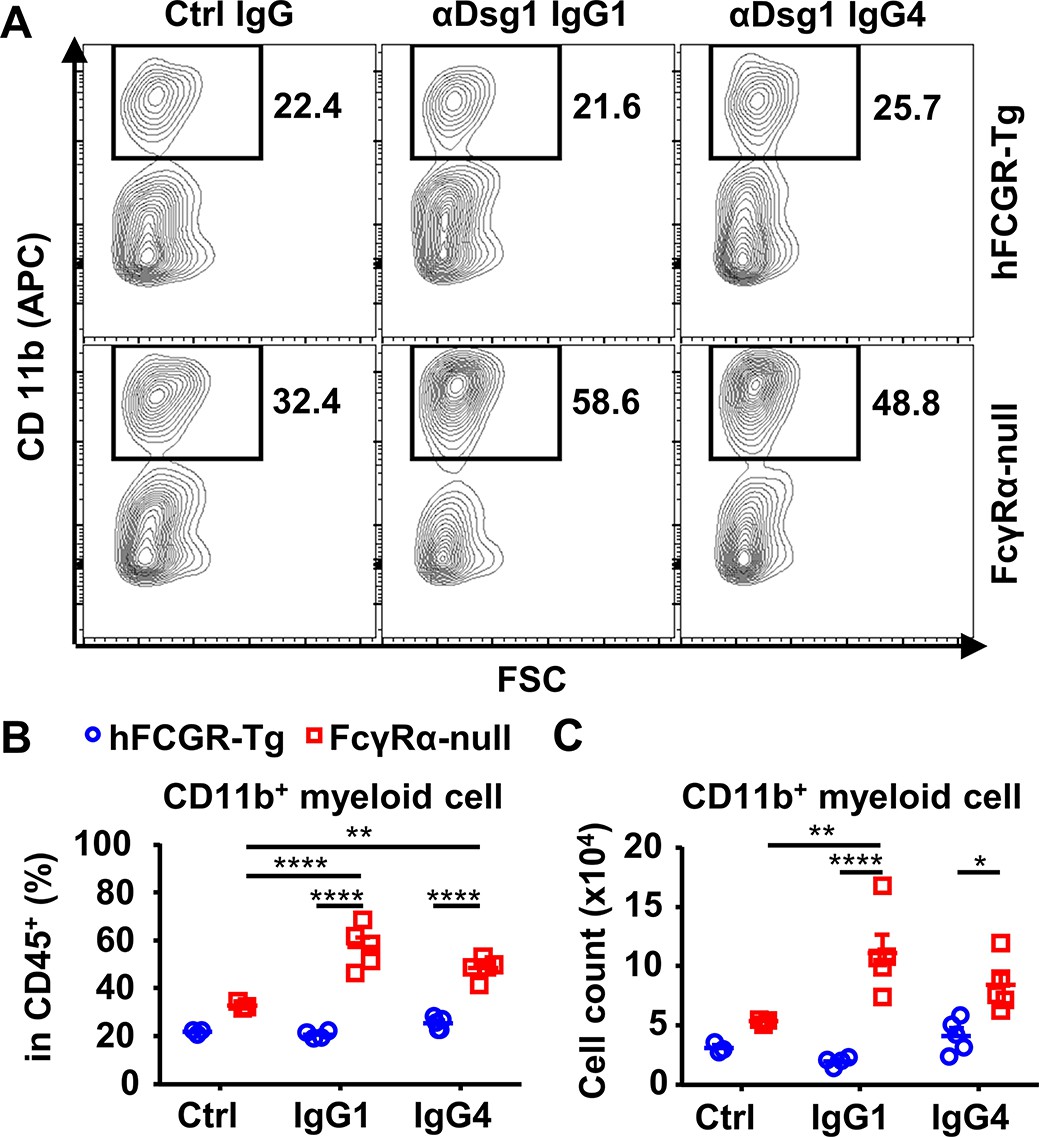
IgG1 and IgG4 anti-Dsg1 antibodies induce more myeloid cell infiltration in the absence of FcγRs.
Representative flow cytometry profile (A) and plots showing the percentage (B) and cell number (C) of infiltrating CD11b+ myeloid cells among leukocytes (CD45+) in the ear tissues of mice in Figure 4C. Each photo or symbol is derived from an individual mouse. Mean ± SEM values are plotted. Two-way ANOVA with Tukey’s multiple comparisons test (B, C). *p<0.05, **p<0.01, ****p<0.0001. A representative of two independent experiments is shown.
Figure 5 with 3 supplements
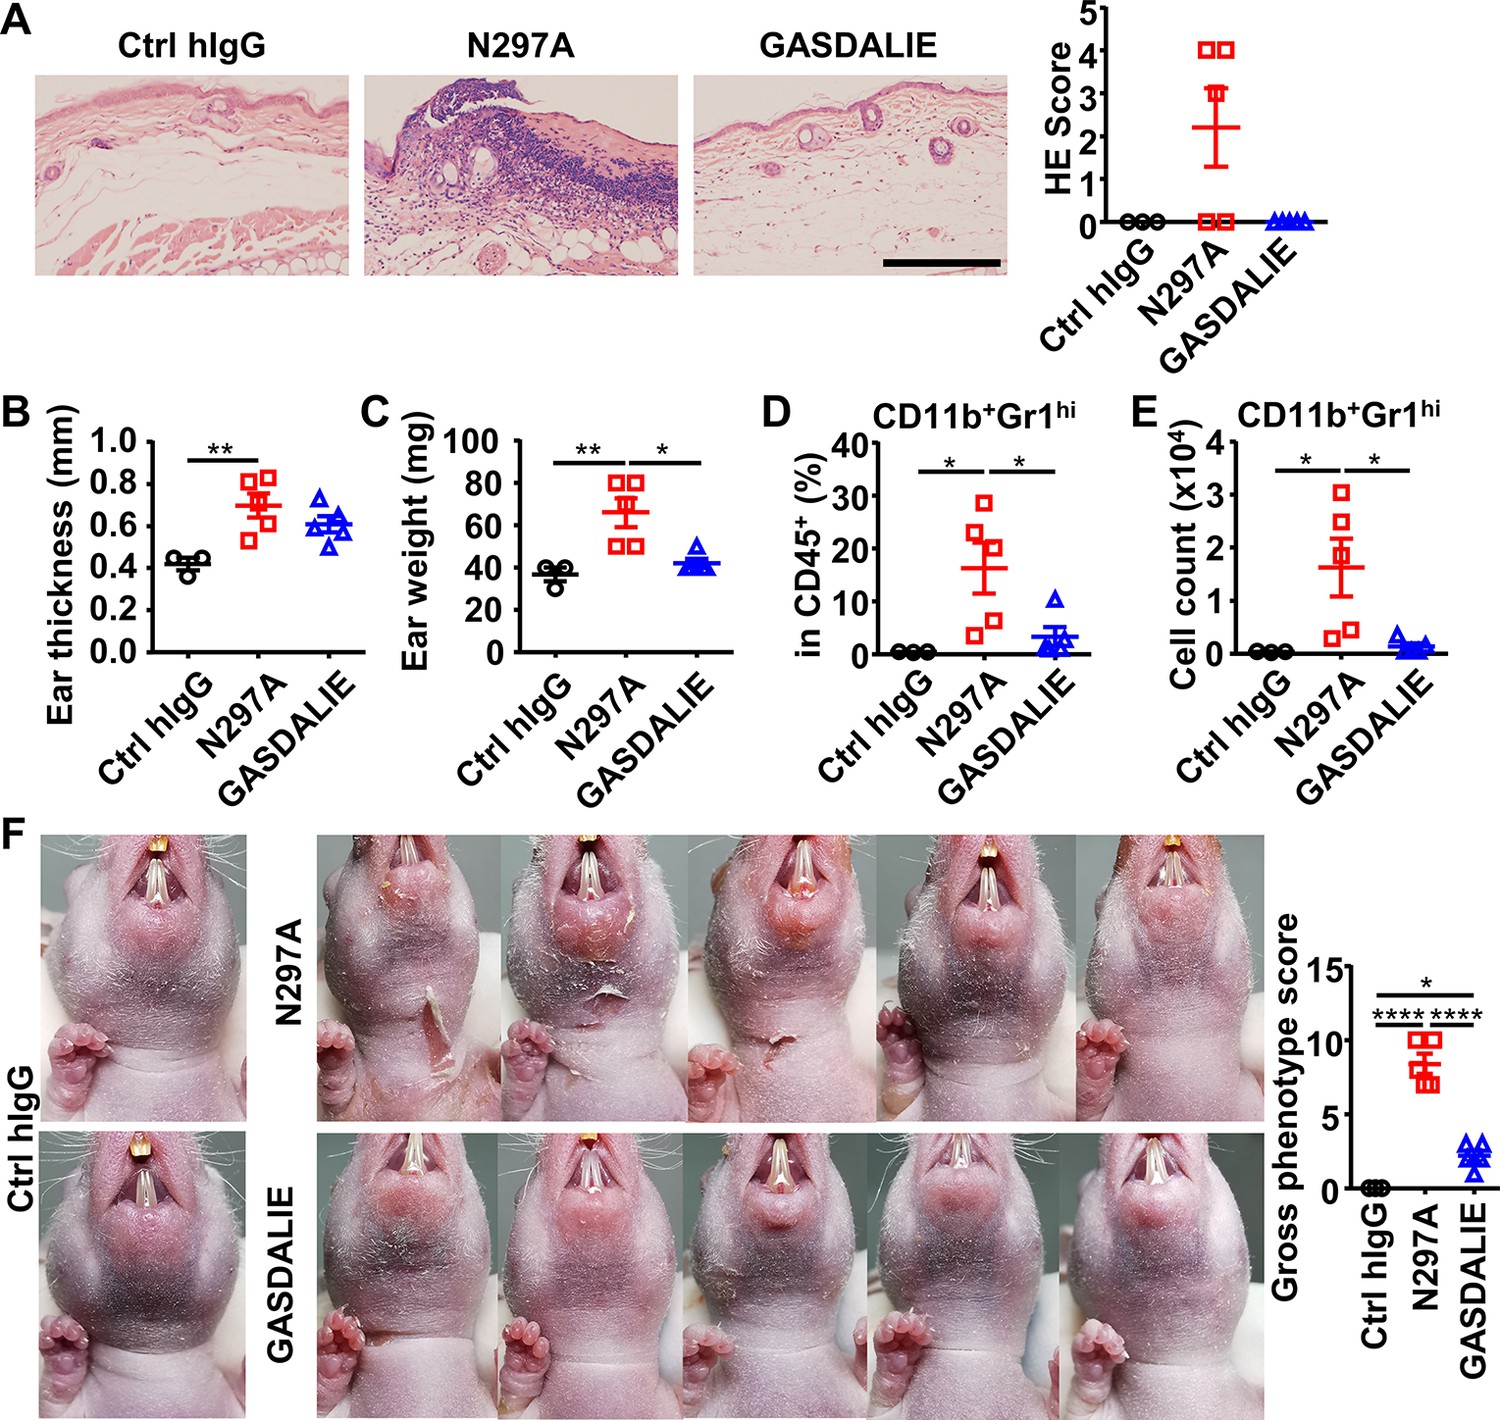
Anti-Dsg1 autoantibodies with reduced FcγR-binding are more pathogenic.
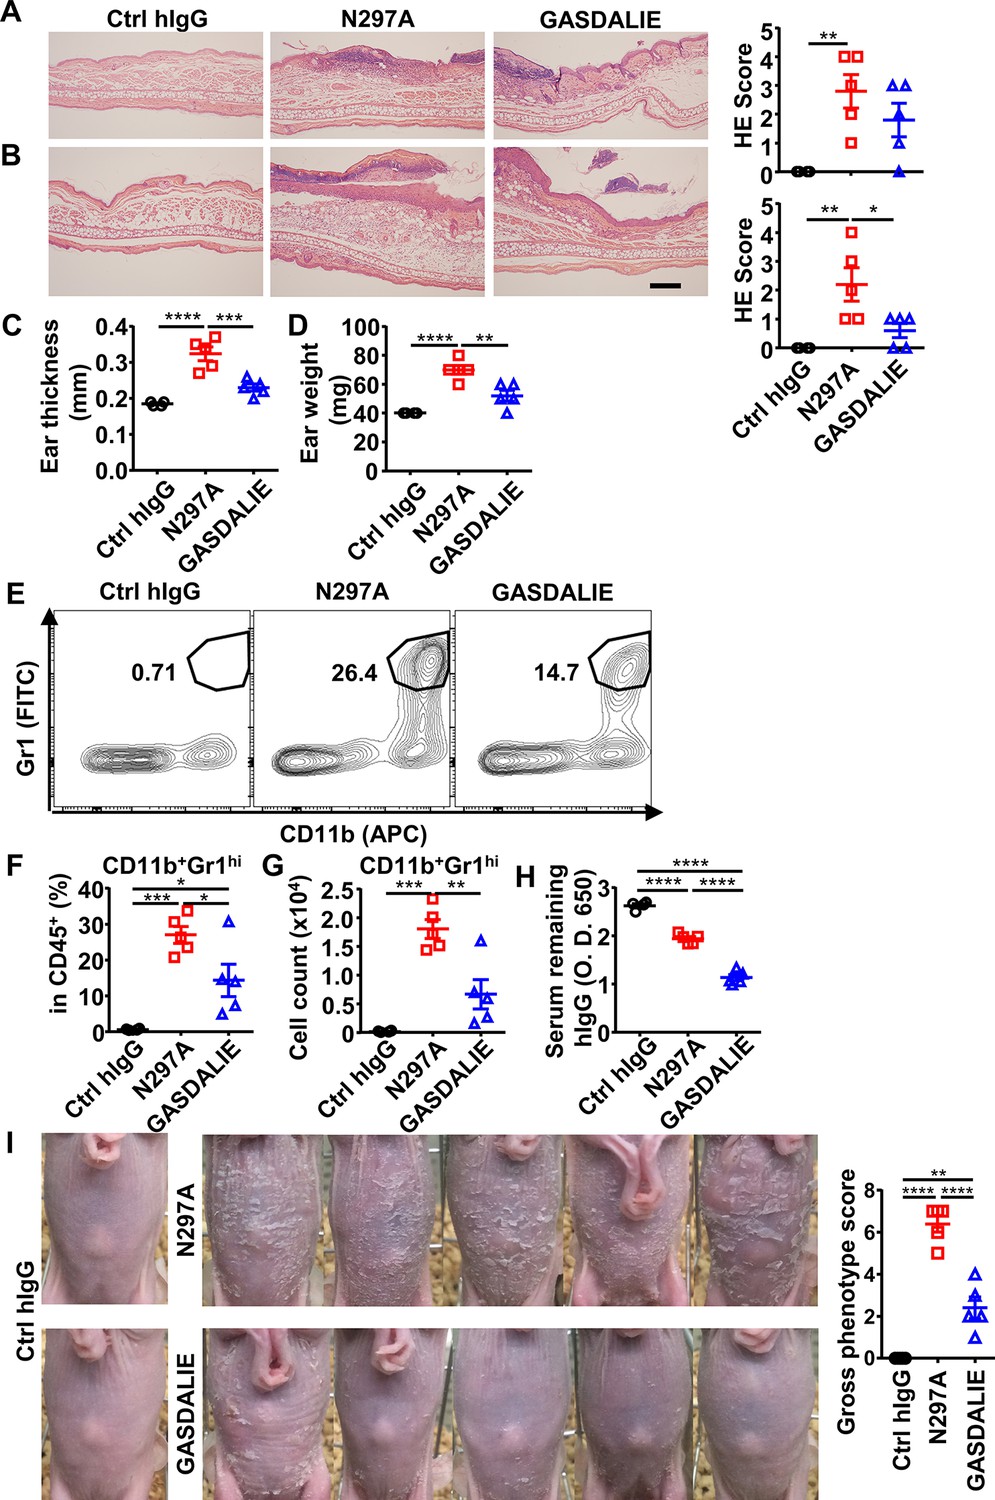
(A) Representative photos and scores showing the hematoxylin-eosin (HE) staining results of ears of hFCGR-Tg mice 3 days after being treated with 0.5 mg of Ctrl hIgG (n=3), or PF24-9(N297A) or PF24-9(GASDALIE) autoantibodies (n=5). Scale bars: 200 μm. (B, C) Ear thickness (B) and weight (C) of hFCGR-Tg mice in (A) when sacrificed at day 3. (D, E) Plots showing the percentage (D) and cell number (E) of infiltrating neutrophils (CD11b+Gr1hi) among leukocytes (CD45+) in the ears of mice in (A). (F) Photos and gross phenotype scores of nude mice 2 days after being treated with 0.4 mg of Ctrl hIgG or PF1-8-15(N297A) or PF1-8-15(GASDALIE) antibodies (n=5). Each symbol is derived from an individual mouse. Mean ± SEM values are plotted. One-way ANOVA with Tukey’s multiple comparisons test (A–F). *p<0.05, **p<0.01, ****p<0.0001.
-
Figure 5—source data 1
Related to Figure 5A.
- https://cdn.elifesciences.org/articles/76223/elife-76223-fig5-data1-v2.xlsx
-
Figure 5—source data 2
Related to Figure 5B.
- https://cdn.elifesciences.org/articles/76223/elife-76223-fig5-data2-v2.xlsx
-
Figure 5—source data 3
Related to Figure 5C.
- https://cdn.elifesciences.org/articles/76223/elife-76223-fig5-data3-v2.xlsx
-
Figure 5—source data 4
Related to Figure 5D.
- https://cdn.elifesciences.org/articles/76223/elife-76223-fig5-data4-v2.xlsx
-
Figure 5—source data 5
Related to Figure 5E.
- https://cdn.elifesciences.org/articles/76223/elife-76223-fig5-data5-v2.xlsx
-
Figure 5—source data 6
Related to Figure 5F.
- https://cdn.elifesciences.org/articles/76223/elife-76223-fig5-data6-v2.xlsx
Figure 5—figure supplement 1
Anti-Dsg1 autoantibodies with low affinity to FcγRs are more pathogenic.
(A, B) Representative hematoxylin-eosin (HE) results and scores of the ear tissues of hFCGR-Tg mice 3 days (A) or 6 (B) days after being treated with 0.5 mg of Ctrl hIgG (n=4), PF1-8-15(GASDALIE), or PF1-8-15(N297A) (n=5). Scale bars: 200 μm. (C, D) Ear thickness (C) and weight (D) of mice in (B). (E–G) Representative flow cytometry profiles (E) and plots showing the percentage (F) and cell number (G) of infiltrating neutrophils (CD11b+Gr1hi) among leukocytes (CD45+) in the ears of mice in (B). (H) Plots showing the levels of the remaining human IgG in the serum of mice in (A). (I) Photos and gross phenotype scores of nude mice 4 days after being treated with 0.5 mg of Ctrl hIgG, PF1-8-15(N297A), or PF1-8-15(GASDALIE) (n=5). Each symbol is derived from an individual mouse. Mean ± SEM values are plotted. One-way ANOVA with Tukey’s multiple comparisons test (A–D, F–I). *p<0.05, **p<0.01, ***p<0.001, ****p<0.0001. A representative of three independent experiments is shown.
Figure 5—figure supplement 2
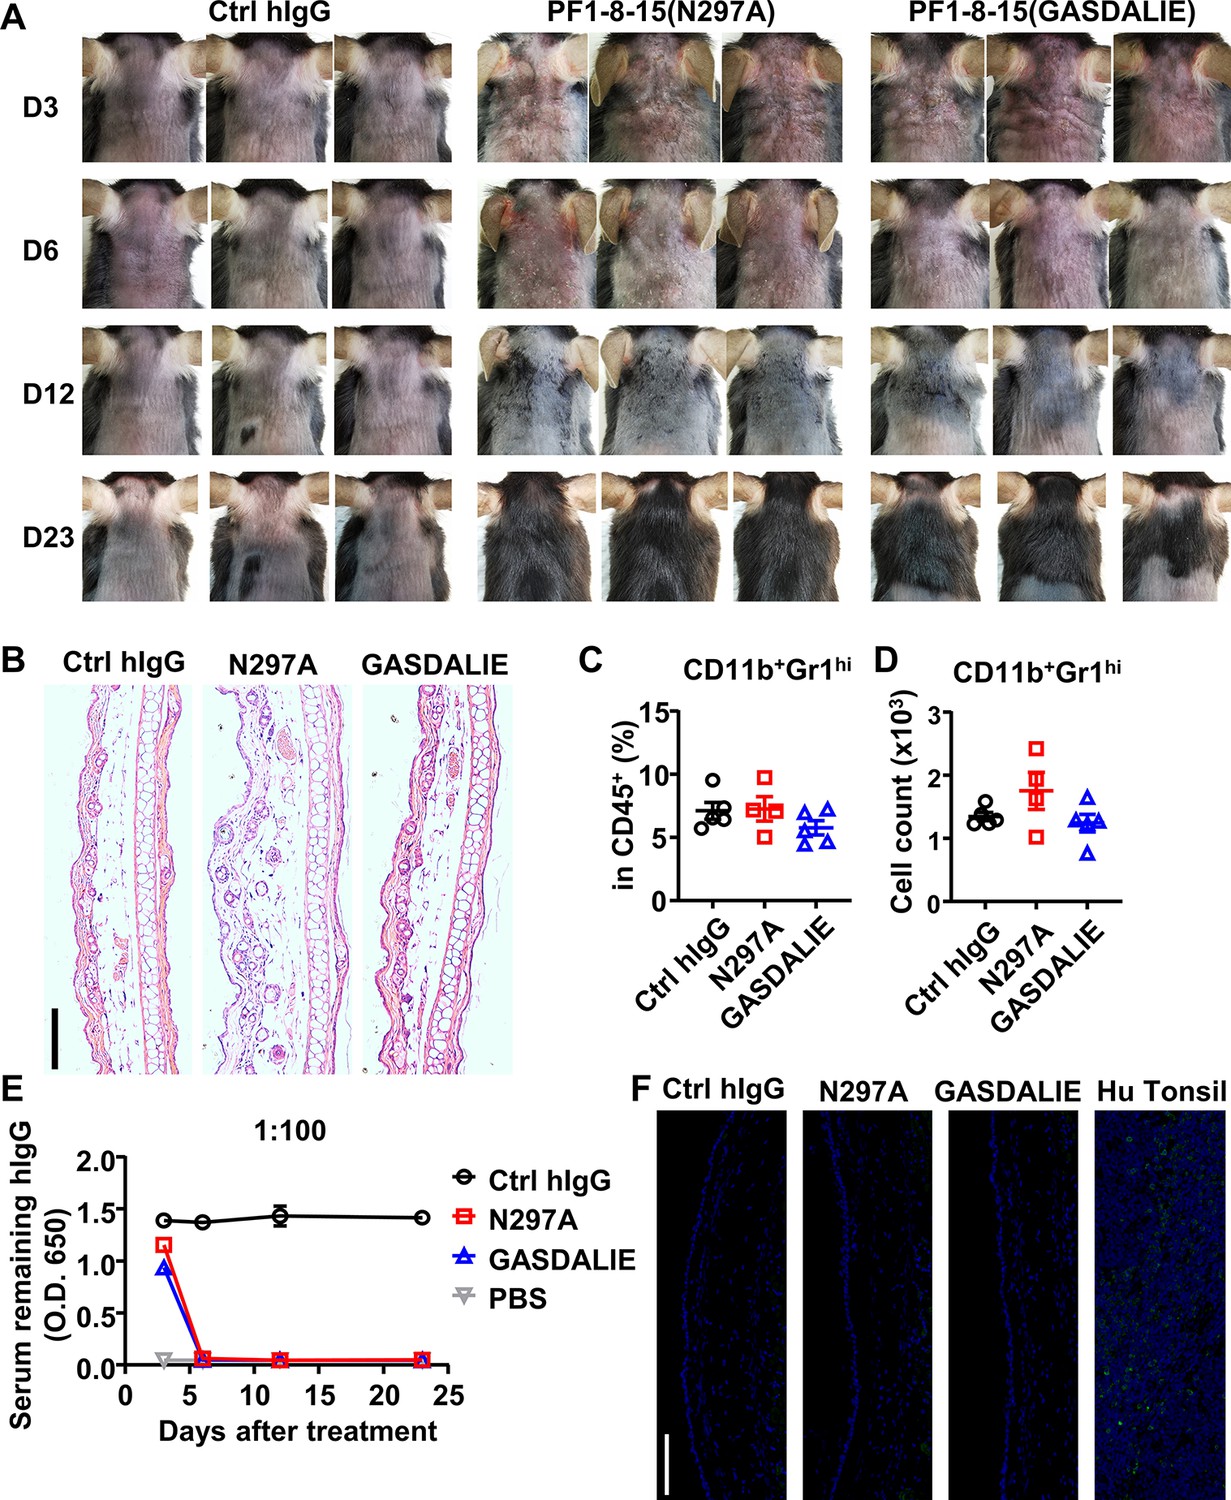
The onset and recovery of anti-Dsg1 antibody-induced skin lesions in WT mice.
(A) Pictures of the back skin of mice treated with 0.5 mg of Ctrl hIgG or anti-Dsg1 antibody variants, photos of 3 representative mice/group (n=4 or 5) at indicated time points (day 3, day 6, day 12, and day 23) were shown. (B) Hematoxylin-eosin (HE) results showing the recovery of skin lesions and inflammation on day 23. Scale bars: 200 μm. (C–D) Plots showing the percentage (C) and cell number (D) of infiltrating neutrophils (CD11b+Gr1hi) among leukocytes (CD45+) in the ears of mice 23 days after antibodies treatment. (E) Plots showing the levels of the remaining human IgG in the serum of mice at the indicated time points. (F) Direct immunofluorescence results showing the clearance of human IgG binding to Dsg1 in skin tissue. Hu Tonsi is used as the positive control. Scale bars: 100 μm. Each photo or symbol is derived from an individual mouse. Mean ± SEM values are plotted. One-way ANOVA with Tukey’s multiple comparisons (C, D).
Figure 5—figure supplement 3
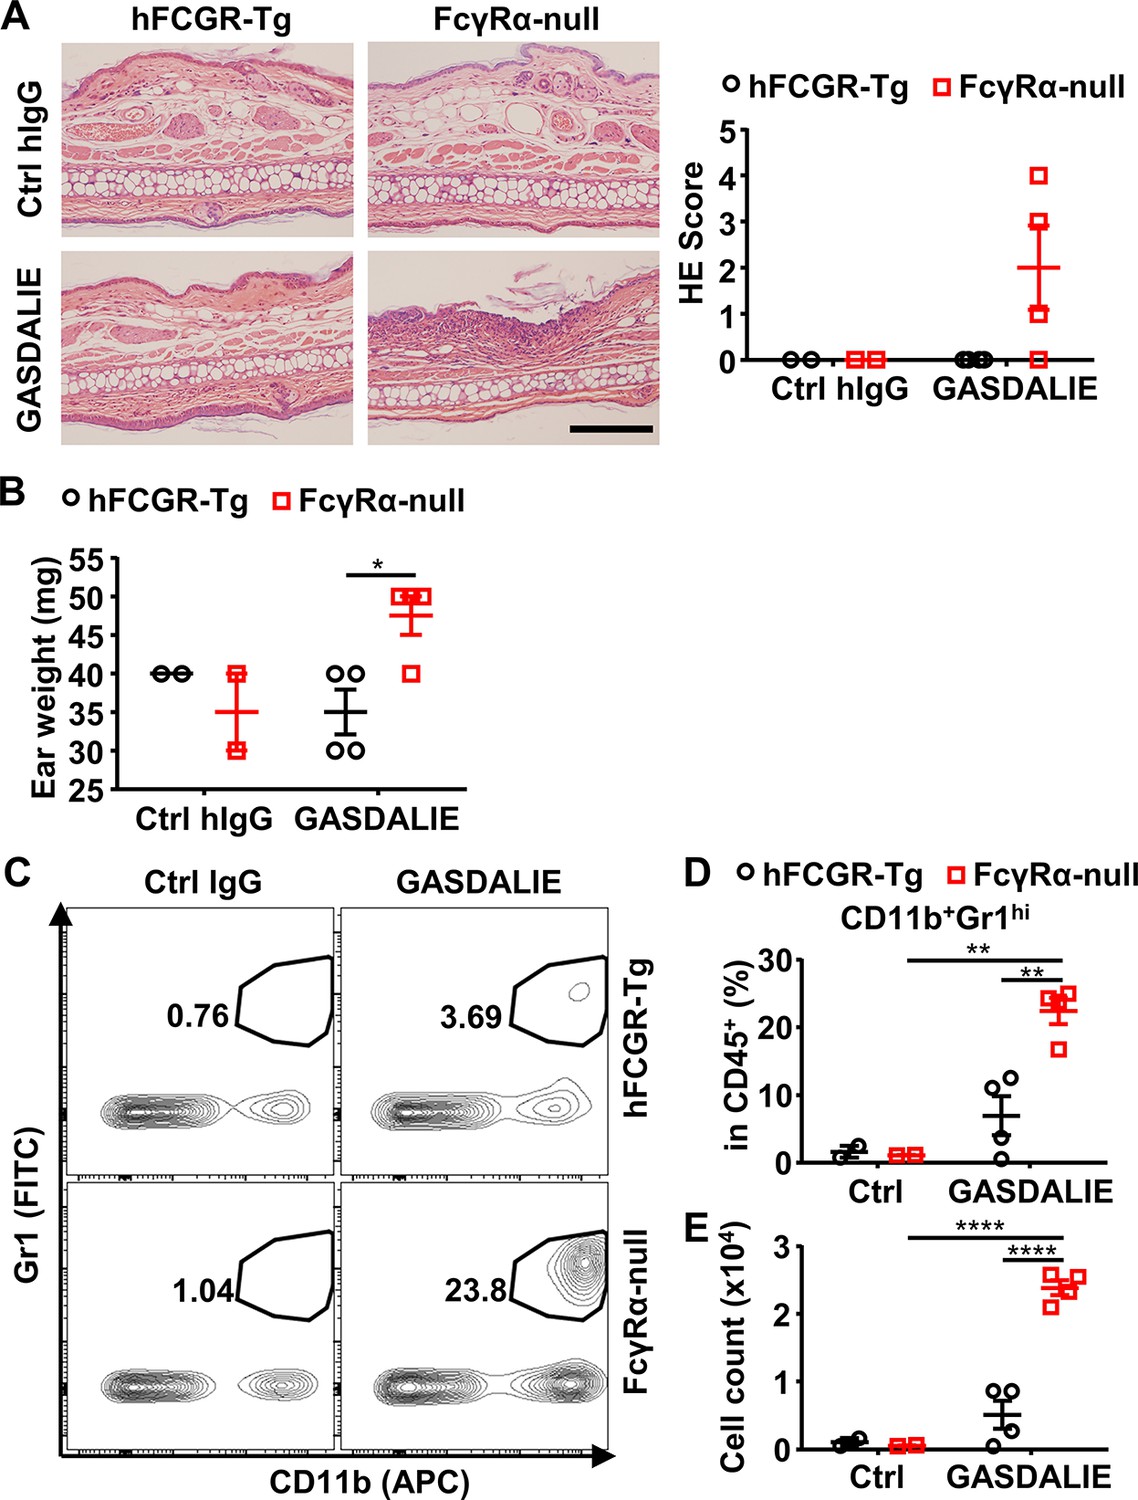
Fc-FcγR interaction is protective for anti-Dsg1 autoantibodies from pathogenicity.
(A) Representative hematoxylin-eosin (HE) results and scores of the ear tissues of hFCGR-Tg and FcγRα-null mice 3 days after being treated with 0.5 mg of Ctrl hIgG (n=2) or PF1-8-15(GASDALIE) (n=4). Scale bars: 200 μm. (B) Plot showing ear weight of mice in (A). (C–E) Representative flow cytometry profiles (C) and plots showing the percentage (D) and cell number (E) of infiltrating neutrophils (CD11b+Gr1hi) among leukocytes (CD45+) in the ears of mice in (A). Each symbol is derived from an individual mouse. Mean ± SEM values are plotted. Two-way ANOVA with Tukey’s multiple comparisons test. *p<0.05, **p<0.01, ****p<0.0001. A representative of two independent experiments is shown.
Figure 6 with 1 supplement
FcγR-mediated effector function promotes the clearance of immune complexes and dead keratinocytes induced by anti-Dsg1 autoantibodies.
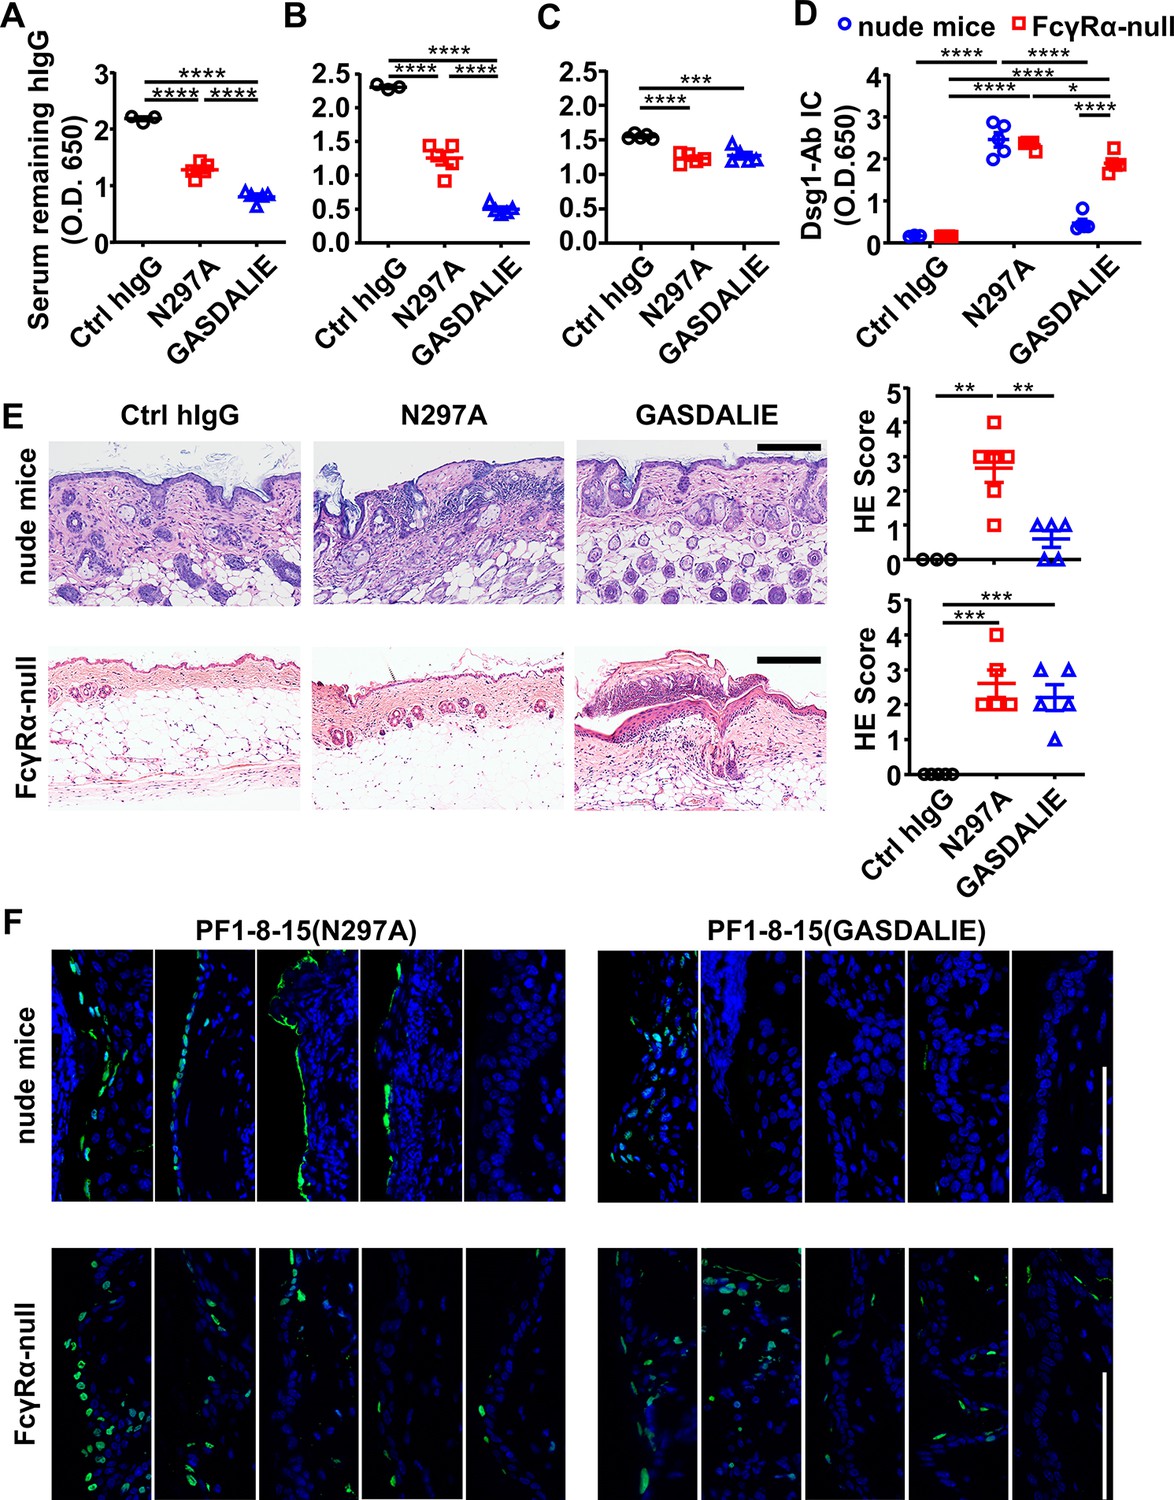
(A–D) Plots showing the levels of serum remaining free hIgG (A, B, C) and Dsg1-Ab immune complex (D) in mice (n=5) as treated in Figure 5A (A), or in nude mice (B, D) and FcγRα-null mice (C, D) 2 days after being treated with 0.4 or 0.5 mg of anti-Dsg1 IgG1 variants PF1-8-15(N297A) or PF1-8-15(GASDALIE), respectively. (E) Photos and scores showing the hematoxylin-eosin (HE) staining results of the skin of nude mice and FcγRα-null mice as treated in (B and C) (n=5). Scale bars: 200 μm. (F) Photos showing the TUNEL staining results of skin tissues collected from mice (n=5) in (B and C), with positive cells (green) corresponding to the epidermis. Scale bars: 100 μm. Each photo or symbol is derived from an individual mouse. Mean ± SEM values are plotted. One-way ANOVA with Tukey’s multiple comparisons (A, B, C, E) and two-way ANOVA (D) with Tukey’s multiple comparisons. *p<0.05, **p<0.01, ***p<0.001, ****p<0.0001.
-
Figure 6—source data 1
Related to Figure 6A.
- https://cdn.elifesciences.org/articles/76223/elife-76223-fig6-data1-v2.xlsx
-
Figure 6—source data 2
Related to Figure 6B.
- https://cdn.elifesciences.org/articles/76223/elife-76223-fig6-data2-v2.xlsx
-
Figure 6—source data 3
Related to Figure 6C.
- https://cdn.elifesciences.org/articles/76223/elife-76223-fig6-data3-v2.xlsx
-
Figure 6—source data 4
Related to Figure 6D.
- https://cdn.elifesciences.org/articles/76223/elife-76223-fig6-data4-v2.xlsx
-
Figure 6—source data 5
Related to Figure 6E.
- https://cdn.elifesciences.org/articles/76223/elife-76223-fig6-data5-v2.xlsx
-
Figure 6—source data 6
Related to Figure 6E.
- https://cdn.elifesciences.org/articles/76223/elife-76223-fig6-data6-v2.xlsx
Figure 6—figure supplement 1
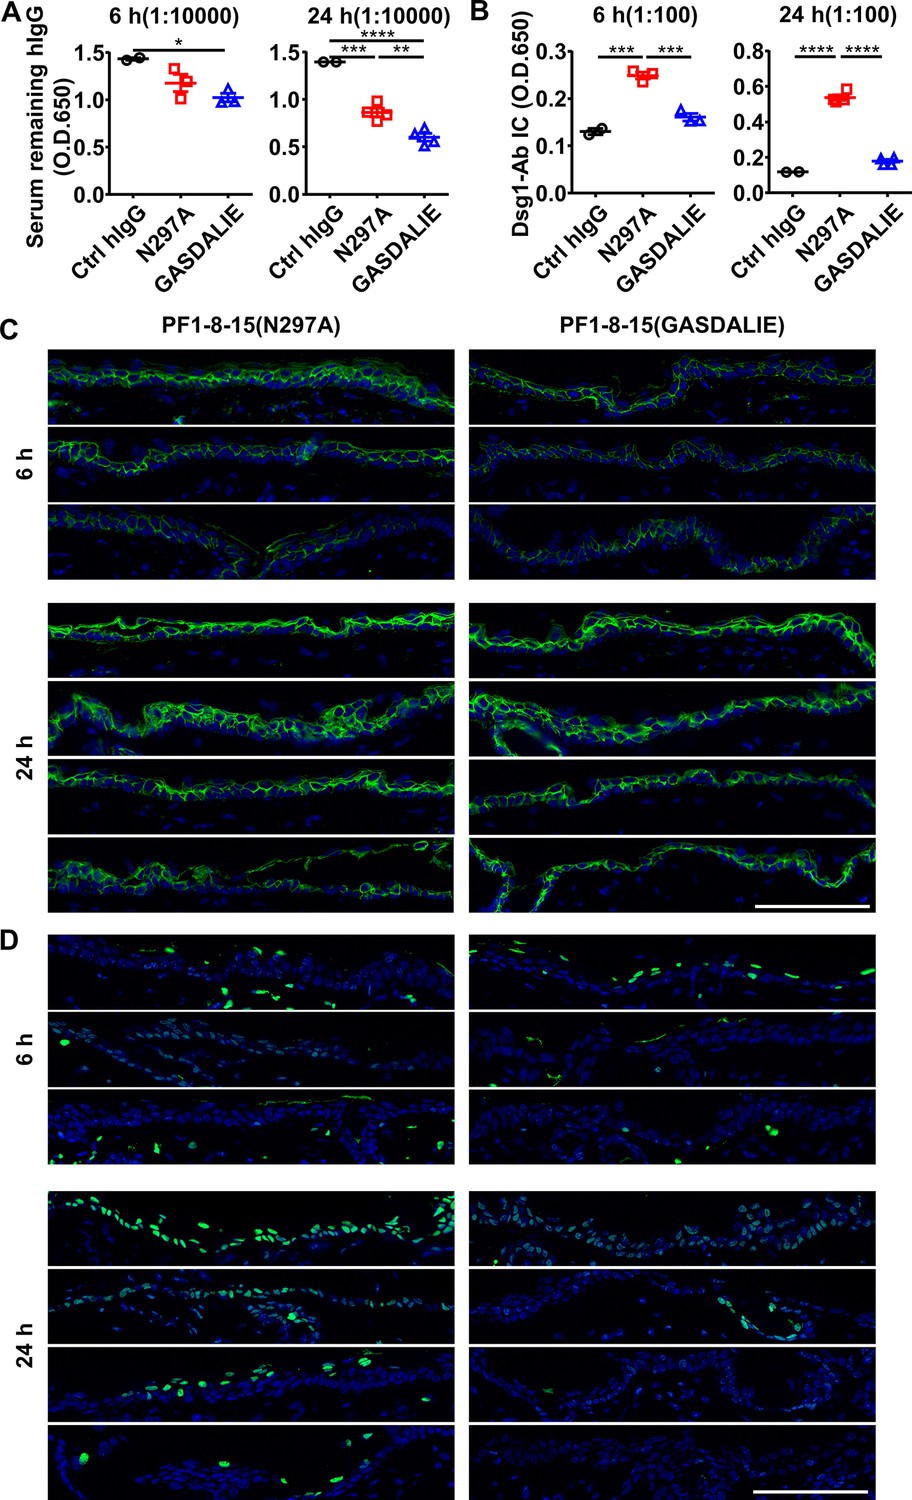
FcγR-mediated effector function promotes the clearance of immune complexes and dead keratinocytes induced by anti-Dsg1 autoantibodies.
(A, B) Plots showing the levels of serum remaining free hIgG (A) and Dsg1-Ab immune complex (B) in nude mice (n=5) 6 and 24 hr after being treated with 0.5 mg of Ctrl hIgG or anti-Dsg1 IgG1 variants PF1-8-15(N297A) or PF1-8-15(GASDALIE). (C) Direct immunofluorescence (DIF) results showing the IgG deposition in the skin of nude mice as treated in (A, B). (D) Photos showing the TUNEL staining results of skin tissues collected from nude mice in (A, B), with positive cells (green) corresponding to the epidermis. Scale bars: 100 μm. Each photo or symbol is derived from an individual mouse. Mean ± SEM values are plotted. One-way ANOVA with Tukey’s multiple comparisons (A, B). *p<0.05, **p<0.01, ***p<0.001, ****p<0.0001.
Figure 7

FcγR-enhanced non-pathogenic anti-Dsg1 autoantibodies attenuate skin lesions induced by pathogenic anti-Dsg1 antibodies.
(A) Schematic diagram of the experimental design for evaluating the impact of non-pathogenic anti-Dsg1 IgG1 with GASDALIE mutations (PF1-2-22(GASDALIE)) on the pathogenicity of pathogenic anti-Dsg1 IgG1 with N297A mutation (PF1-8-15(N297A)) in nude mice. (B–D) Photos and gross phenotype scores showing skin lesions around the mouth (B), Hematoxylin-eosin (HE) staining results and scores of skin tissues (C), TUNEL staining results of skin (D) in nude mice (n=5) 2 days after being treated with 0.5 (B) or 0.4 mg (C, D) of pathogenic PF1-8-15(N297A) together with (+) or without (-) an equal amount of non-pathogenic (PF1-2-22(GASDALIE)) antibodies, with TUNEL positive cells (green) correspond to the epidermis in (D). Scale bars: 200 μm (C) or 100 μm (D). Each photo is derived from an individual mouse. Unpaired t test (B, C). *p<0.05, ***p<0.001.
-
Figure 7—source data 1
Related to Figure 7B.
- https://cdn.elifesciences.org/articles/76223/elife-76223-fig7-data1-v2.xlsx
-
Figure 7—source data 2
Related to Figure 7C.
- https://cdn.elifesciences.org/articles/76223/elife-76223-fig7-data2-v2.xlsx
Author response image 1
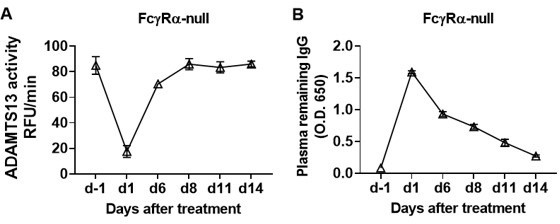
The recovery of ADAMTS13 activity remains consistent for at least 1 week.
We treated the FcγRα-null mice (n = 5) with 10 μg TTP1-420(IgG1) antibodies on day 0 through tail vein injection, blood was collected on day -1, day 1, day 6, day 8, day 11 and day 14 and analyzed for ADAMTS13 activity (A) and plasma remaining hIgG levels (B).
Tables
Key resources table
| Reagent type (species) or resource | Designation | Source or reference | Identifiers | Additional information |
|---|---|---|---|---|
| Cell line (Homo sapiens) | HEK293S | Expression Systems, courtesy of Dr Ai-Wu Zhou (Shanghai Jiao Tong University School of Medicine) | RRID:CVCL_A784 | |
| Cell line (Spodoptera frugiperda) | Sf9 | Expression Systems, courtesy of Dr Ai-Wu Zhou (Shanghai Jiao Tong University School of Medicine) | RRID:CVCL_0549 | |
| Antibody | Anti-mouse CD45.2 Alexa Fluor 700 (Mouse monoclonal) | BD | Cat# 560693 RRID:AB_1727491 | FACS (1:200) |
| Antibody | Anti-mouse CD11b APC (Rat monoclonal) | eBioscience | Cat# 17-0112-82 RRID:AB_469343 | FACS (1:500) |
| Antibody | Recombinant Anti-Human IgG antibody (Rabbit monoclona) | Abcam | Cat# ab109489, RRID:AB_10863040 | IF (1:150) |
| Antibody | Anti-Rabbit IgG (H+L) Antibody, Alexa Fluor 488 (Donkey polyclonal secondary) | Thermo Fisher Scientific | Cat# A-21206, RRID:AB_2535792 | IF (1:400) |
| Antibody | Anti-Lambda Light Chain Monoclonal Antibody, Biotin (Mouse monoclonal) | BD Biosciences | Cat# 555794, RRID:AB_396129 | ELISA (1:2000) |
| Antibody | Anti-Dsg1 TTP1-8-15(IgG1) Biotin (human monoclonal) | This paper | ELISA (1 μg/ml) | |
| Antibody | Anti-Human IgG-Fc Fragment Antibody HRP (Goat polyclonal) | Bethyl | Cat# A80-104P, RRID:AB_67064 | ELISA (1:10,000) |
| Antibody | Anti-Human IgG1 Hinge-HRP (Mouse monoclonal) | SouthernBiotech | Cat# 9052–05, RRID:AB_2796619 | ELISA (1:3160) |
| Antibody | Anti-Human IgG4 Fc-HRP (Mouse monoclonal) | SouthernBiotech | Cat# 9200–05, RRID:AB_2796691 | ELISA (1:3160) |
| Antibody | Anti-Human IgG1 Fc Secondary Antibody, HRP (Mouse monoclonal) | Thermo Fisher Scientific | Cat# MH1715, RRID:AB_10374315 | ELISA (1:2000) |
| Antibody | Anti-Human IgG4 Fc Secondary Antibody, HRP (Mouse monoclonal) | Thermo Fisher Scientific | Cat# MH1742, RRID:AB_2539714 | ELISA (1:2000) |
| Antibody | Anti-Human IgG (H+L) (Goat polyclonal) | Jackson ImmunoResearch Labs | Cat# 109-005-088, RRID:AB_2337539 | ELISA (2 μg/ml) |
| Antibody | Anti-Human IgG-heavy and light chain Antibody HRP (Goat polyclonal) | Bethyl | Cat# A80-219P, RRID:AB_67076 | ELISA (1:10,000) |
| Peptide, recombinant protein | Streptavidin-HRP | BD Biosciences | Cat# 554066, RRID:AB_2868972 | ELISA (1:1000) |
| Peptide, recombinant protein | Recombinant Human ADAMTS13 (Full Length) Protein, CF | R&D Systems | Cat# 6156-AD | ELISA (2 μg/ml) |
| Commercial assay or kit | Human ADAMTS13 Quantikine ELISA Kitg | R&D Systems | Cat# DADT130 | |
| Chemical compound, drug | FRETS-VWF73 | Anaspec | Cat# 63728–01 | |
| Chemical compound, drug | Dispase II | Roche | Cat# 4942078001 | |
| Chemical compound, drug | DNase I | Sigma | Cat# D5025 | |
| Chemical compound, drug | Collagenase IV | Sigma/biosharp | Cat# C5138 | |
| Software, algorithm | GraphPad Prism | GraphPad Prism | RRID:SCR_002798 | |
| Other | DAPI stain | Invitrogen | DD3571 | (0.5 µg/ml) |
Additional files
-
Supplementary file 1
Additional information on relevant antibodies and patient samples.
(a) Affinities of mouse FcγRs for human IgG4, IgG1, and its variants.
(b) FcγR-binding properties of human IgG1 and its variants.
(c) Demographic characteristics and laboratory findings of thrombotic thrombocytopenic purpura (TTP) patients.
(d) Demographic characteristics and laboratory findings of pemphigus foliaceus (PF) patients.
(e) Characteristics of anti-Dsg1 mAbs.
(f) Polymerase chain reaction (PCR) primers used for cloning Dsg1, Dsg2, and Dsg1/Dsg2 chimeric molecules.
- https://cdn.elifesciences.org/articles/76223/elife-76223-supp1-v2.docx
-
Transparent reporting form
- https://cdn.elifesciences.org/articles/76223/elife-76223-transrepform1-v2.docx
Download links
A two-part list of links to download the article, or parts of the article, in various formats.
Downloads (link to download the article as PDF)
Open citations (links to open the citations from this article in various online reference manager services)
Cite this article (links to download the citations from this article in formats compatible with various reference manager tools)
Distinct impact of IgG subclass on autoantibody pathogenicity in different IgG4-mediated diseases
eLife 11:e76223.
https://doi.org/10.7554/eLife.76223


