Modeling osteoporosis to design and optimize pharmacological therapies comprising multiple drug types
- Biomedical Modeling and Simulation Group, Global Research and Development, Fresenius Medical Care Germany, Germany
- Renal Research Institute, United States
- Department of Medicine, University of Rochester School of Medicine and Dentistry, United States
- Icahn School of Medicine at Mount Sinai, United States
Figures
Figure 1
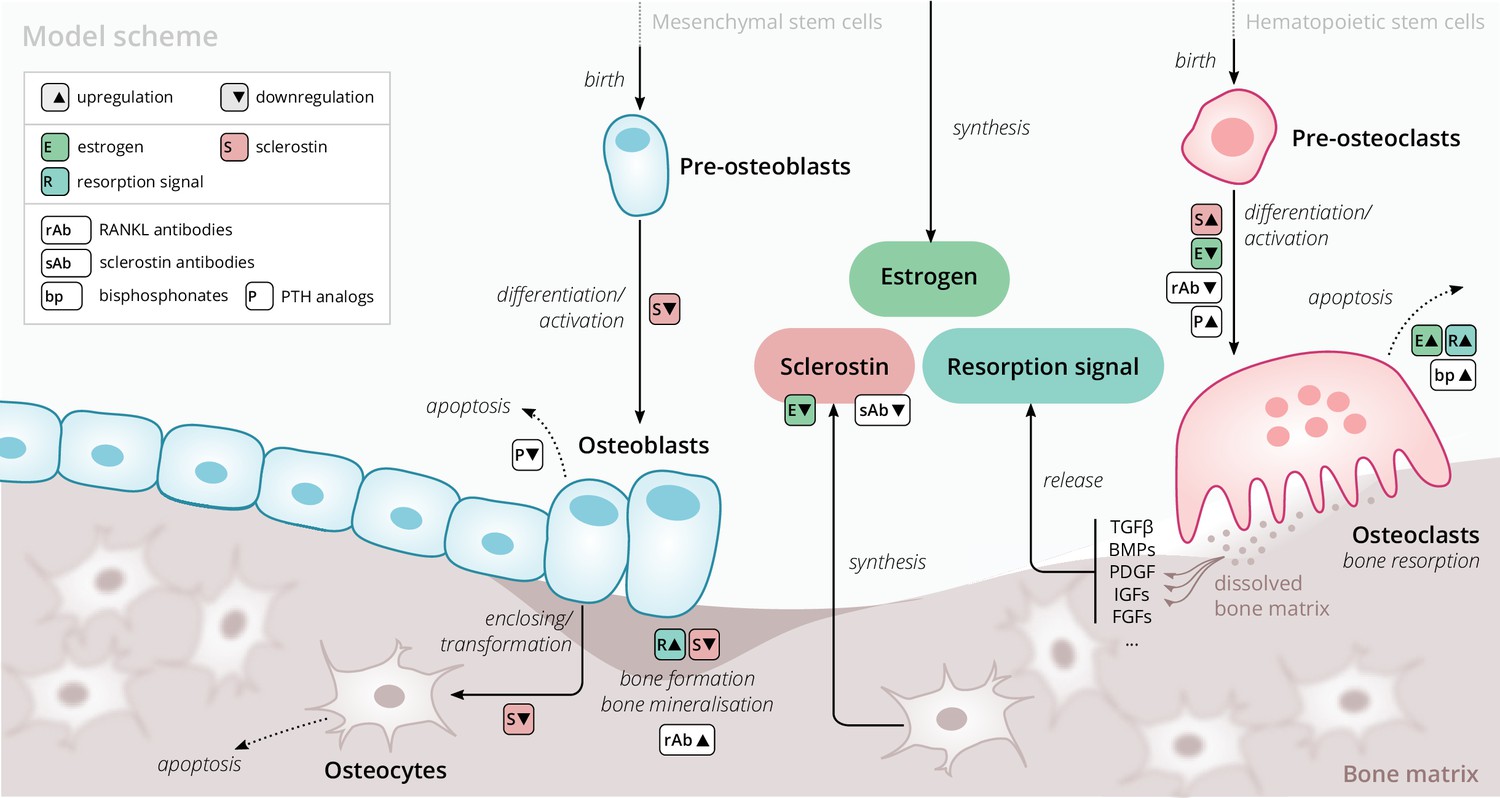
Schematic of the osteoporosis model describing the cell dynamics and signaling pathways within a ‘representative bone remodeling unit (BRU)’.
Regulatory interactions between different model components are indicated by colored boxes (see legend). TGFβ, transforming growth factor beta; BMP, bone morphogenetic protein; PDGF, platelet-derived growth factor; IGF, insulin-like growth factor; FGF, fibroblast growth factor.
Figure 2 with 1 supplement
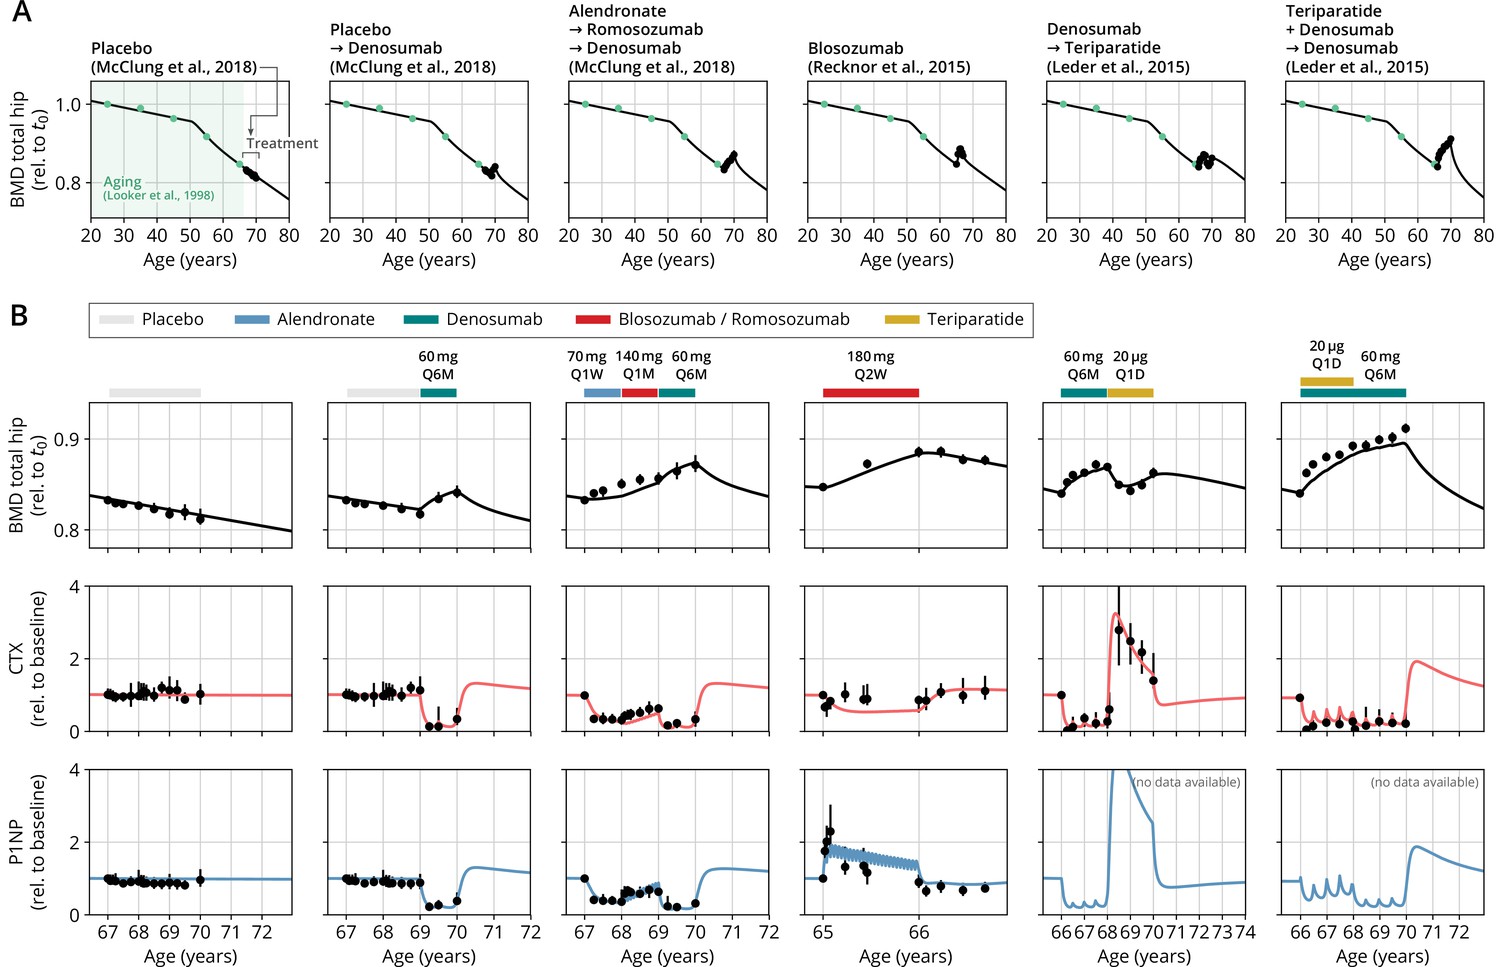
With a single set of parameters, the calibrated model can quantitatively predict the effects of various drugs in different dosing regimens, alone and in combination.
(A) Comparison of simulated total hip bone mineral density (BMD, black curves) and clinical data (dots), including aging behavior (green dots) and treatment behavior (black dots) of various sequential drug treatments, including denosumab, romosozumab, alendronate, and teriparatide. Hybrid aging/treatment datasets were created combining data from Looker et al., 1998 (aging dataset, green dots in panel A; in total subjects 20 years and older), as well as Recknor et al., 2015 (blosozumab 180 mg Q2W: ), McClung et al., 2018 (placebo/deno.: , alendro./romo./deno.: ), and Leder et al., 2015 (deno./teri.: , teri. + deno./deno.: ) (treatment datasets, black dots in panels A and B) as indicated, see ‘Methods.’ (B) Zoom into the treatment regions shown in panel (A) including BMD (black) and baseline changes of the bone resorption marker C-terminal telopeptide (CTX, red) and the bone formation marker procollagen type 1 amino-terminal propeptide (P1NP, blue). Colored bars above the plots indicate the medication scheme (see legend). Data points show population averages; average types and error bar types as reported in the respective original publication. In both panels, BMD is displayed as a fraction of its value at years.
Figure 2—figure supplement 1
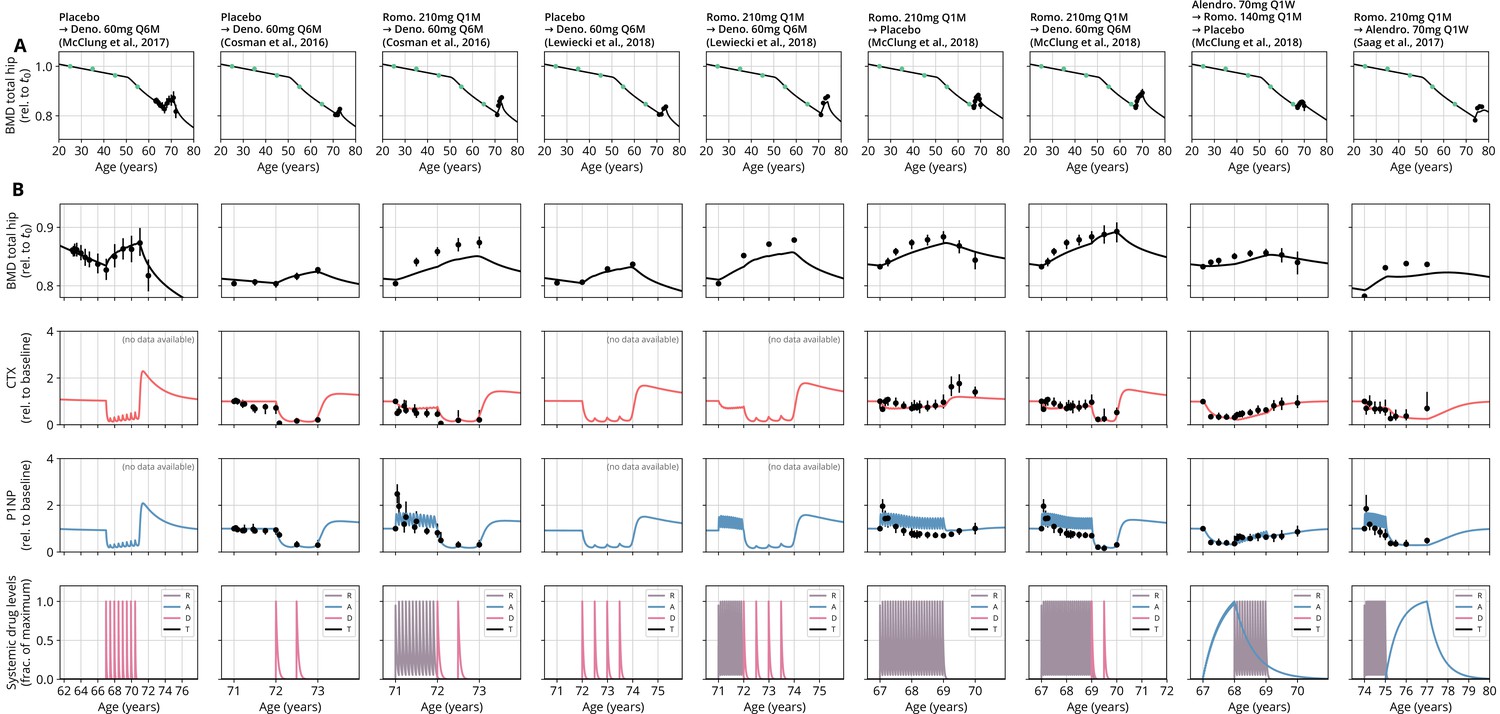
Continuation of Figure 2 comparing model predictions and clinical data from various studies, all conventions identical.
See Appendix 3—table 2 for a list of data sources and Appendix 3—table 3 for goodness-of-fit measures. Dosing: mg, milligrams; mcg, micrograms; Q M, dose administered every months; Q W, every weeks; Q D, every days; R, romosozumab; A, alendronate; D, denosumab; T, teriparatide.
Figure 3
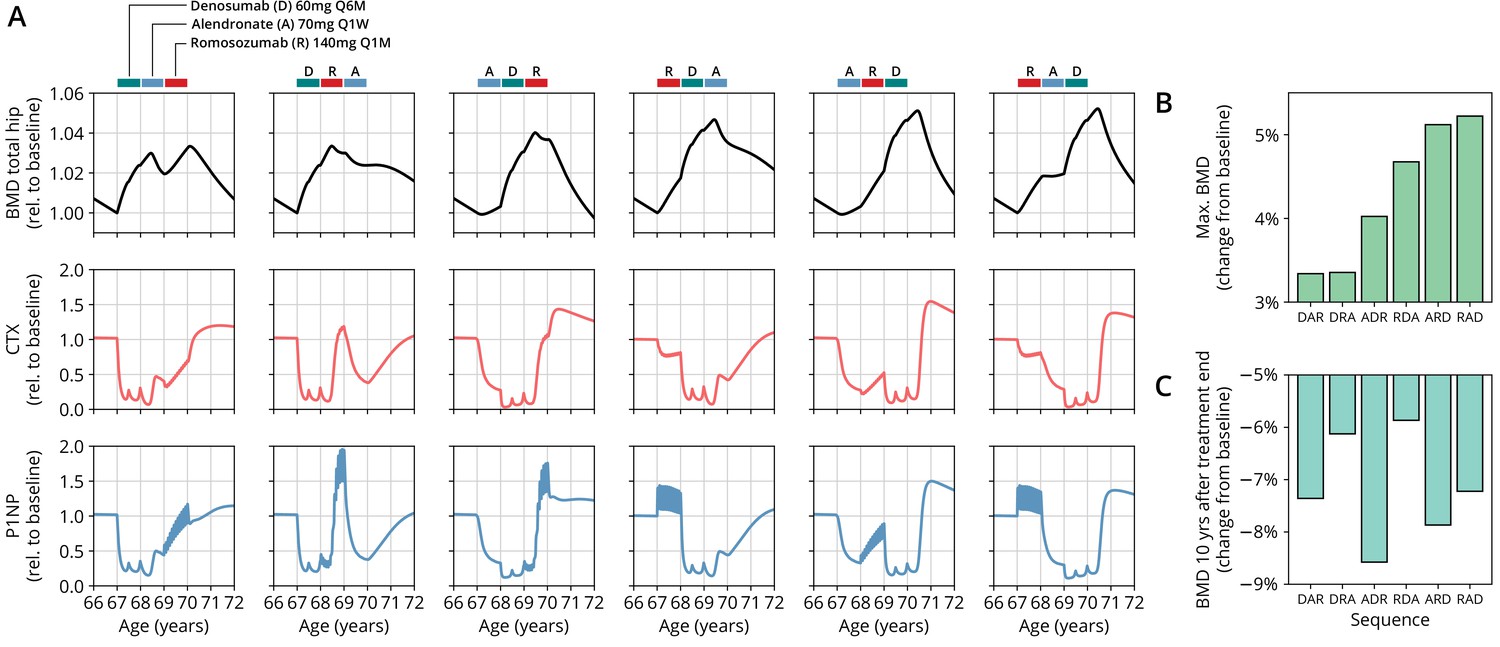
The model predicts differential outcomes for different sequences of the same drugs at constant total medication load.
(A) Simulated progression of bone mineral density (BMD) and C-terminal telopeptide (CTX) and procollagen type 1 amino-terminal propeptide (P1NP) concentrations for different sequences (columns) of the three drugs denosumab (D), alendronate (A), and romosozumab (R) as indicated. Simulated treatment starts at age 67. The total amount of drug administered is identical among columns. Clinical results on the sequence ARD (column 5) were reported in McClung et al., 2018, see also Figure 2. (B) Maximum simulated BMD (relative to baseline at treatment start) achieved during the course of treatment for different drug sequences. (C) Simulated BMD 10 years after treatment end (relative to baseline at treatment start) for different drug sequences.
Appendix 1—figure 1
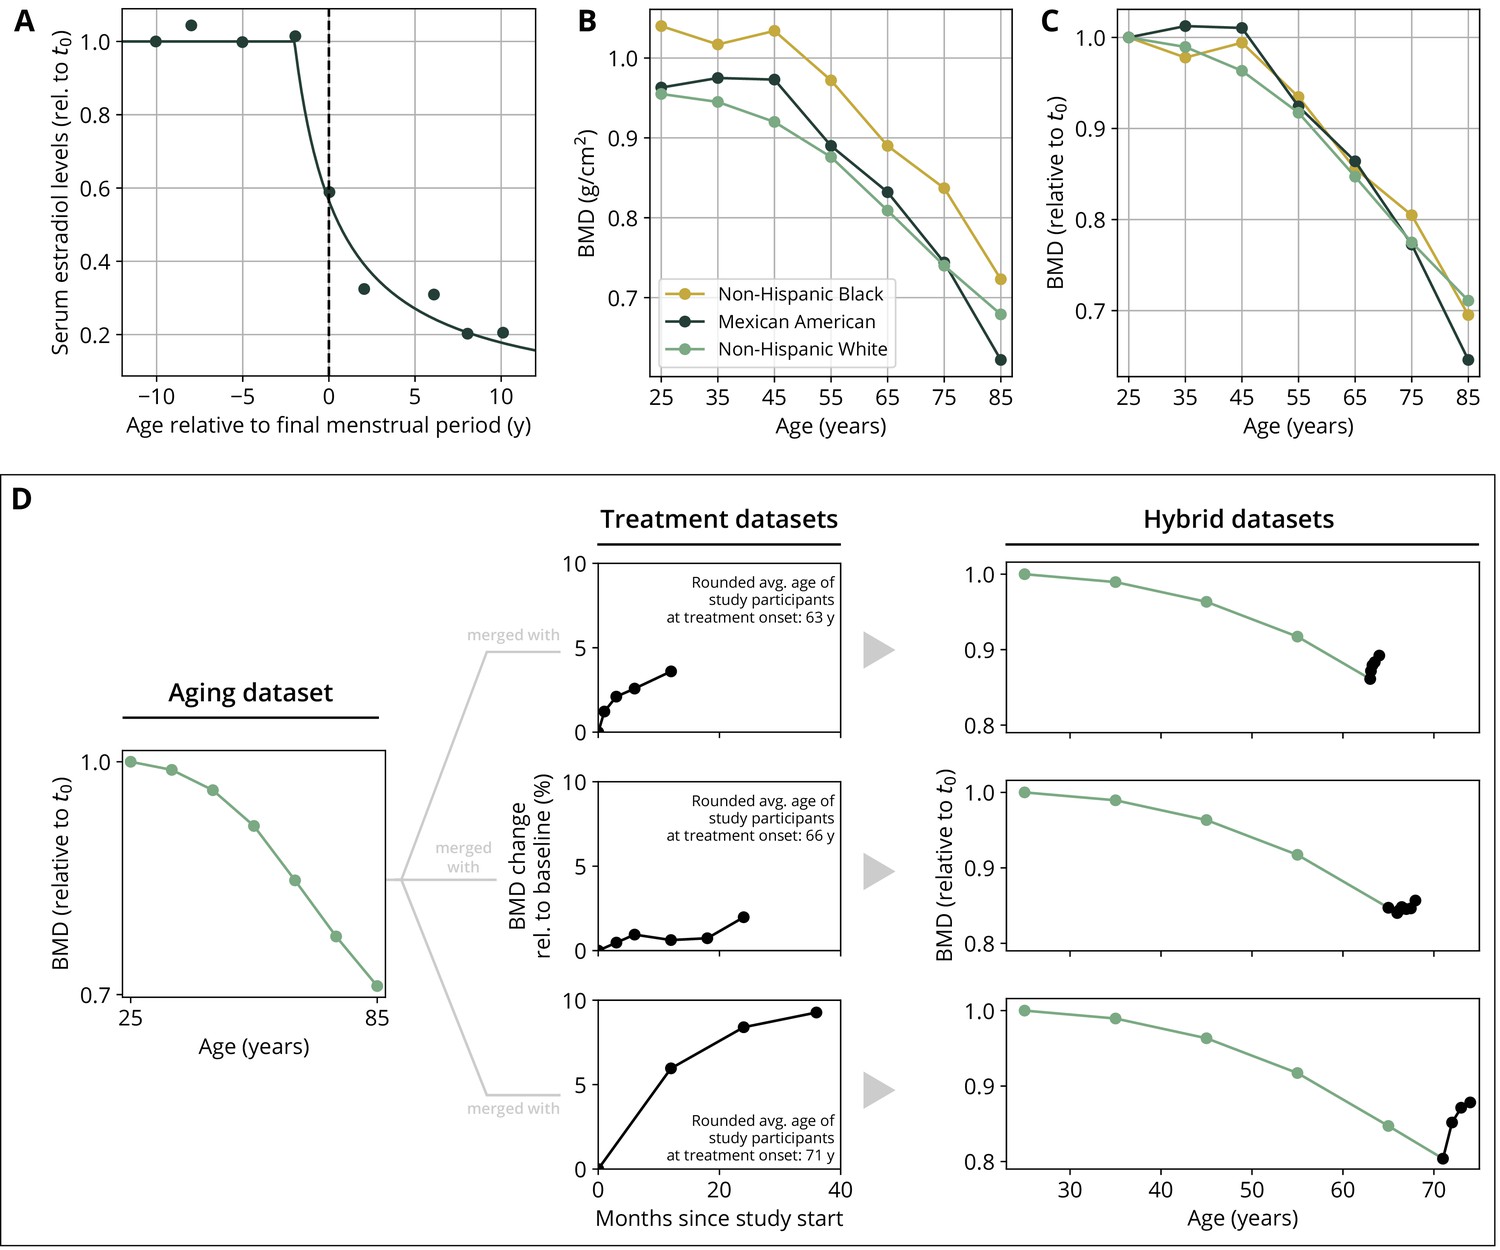
Parameterization of the aging behavior and creation of hybrid aging/treatment datasets for model calibration and validation.
(A) Age dependence of estradiol serum levels. Clinical data (dots) modified from Sowers et al., 2008. The curve shows a fit of the function given by Equation 18 to determine the parameter τe (Appendix 3—table 4). (B) Bone mineral density (BMD) age dependence for different ethnic groups as indicated. Data modified from Looker et al., 1998; reported age bin averages have been used to represent the center of the age bin. (C) BMD age dependence shown in panel (B), where all curves have been normalized to their earliest value (t0 = 25y). (D) Schematic of how hybrid aging/treatment datasets were generated by merging the same aging dataset with different treatment datasets; for details, see ‘Methods.’
Appendix 3—figure 1
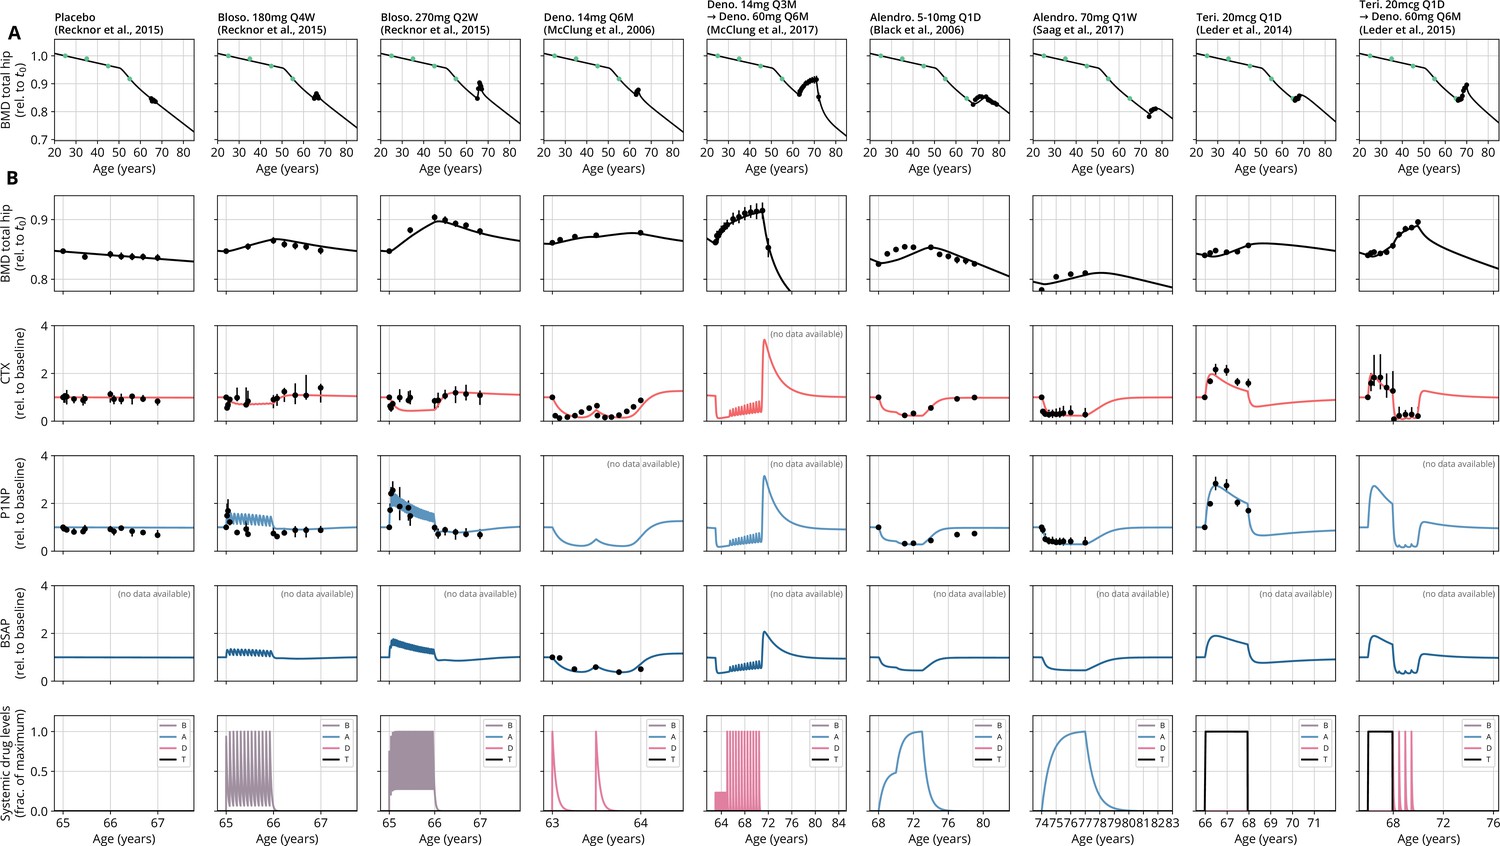
Calibration datasets comparing model predictions and clinical data from various studies.
All conventions identical to Figure 2. Drug administrations are provided in the bottom row. See Appendix 3—table 2 for a list of data sources and Appendix 3—table 3 for goodness-of-fit measures. Dosing: mg, milligrams; mcg, micrograms; Q M, dose administered every months; Q W, every weeks; Q D, every days; B, blosozumab; A, alendronate; D, denosumab; T, teriparatide.
Tables
Appendix 3—table 1
Values of fit weights used in Equation 29.
| Weight | Value |
|---|---|
| 300 | |
| 1 | |
| 1 | |
| 1 |
-
BMD, bone mineral density; CTX, C-terminal telopeptide; P1NP, procollagen type 1 amino-terminal propeptide; BSAP, bone-specific alkaline phosphatase
Appendix 3—table 2
Data sources used to calibrate and validate the model.
Columns titled ‘Figure(s)’ indicate the plot panels in the respective publication that were digitized. BMD always refers to total hip bone mineral density.
| Publication | Medication(s) | Dosings | Figure(s) | Table(s) | |||
|---|---|---|---|---|---|---|---|
| BMD | CTX | P1NP | BSAP | BMD | |||
| Black et al., 2006 | Alendronate | 5–10 mg Q1D | 2 | 3 | 3 | — | — |
| Bone et al., 2011 | Denosumab | 60 mg Q6M | 3b | 4b | 4a | — | — |
| Cosman et al., 2016 | Romosozumab | 210 mg Q1M | 3b | 3e | 3d | — | — |
| Denosumab | 60 mg Q6M | 3b | 3e | 3d | — | — | |
| Leder et al., 2014 | Teriparatide | 20 mcg Q1D | 2d | 4c,f | 4b,e | — | — |
| Leder et al., 2015 | Teriparatide | 20 mcg Q1D | 3 | 4 | — | — | — |
| Denosumab | 60 mg Q6M | 3 | 4 | — | — | — | |
| Lewiecki et al., 2019 | Romosozumab | 210 mg Q1M | 3b | — | — | — | — |
| Denosumab | 60 mg Q6M | 3b | — | — | — | — | |
| Looker et al., 1998 | [Age-dependent BMD] | — | — | — | — | — | 7 |
| McClung et al., 2006 | Denosumab | 6 mg Q3M, 14 mg Q6M, 210 mg Q6M | 2b | 2e | — | 2f | — |
| McClung et al., 2017 | Denosumab | 6–14 mg Q3M, 14–210 mg Q6M | 2b | — | — | — | — |
| McClung et al., 2018 | Romosozumab | 140 mg Q1M, 210 mg Q1M | 3c | 4b | 4a | — | — |
| Denosumab | 60 mg Q6M | 3c,d | 4b,d | 4a,c | — | — | |
| Alendronate | 70 mg Q1W | 3d | 4d | 4c | — | — | |
| Recknor et al., 2015 | Blosozumab | 180 mg Q4W, 180 mg Q2W, 270 mg Q2W | 3b | 4d | 4a | — | — |
| Saag et al., 2017 | Alendronate | 70 mg Q1W | 3b | 3d | 3c | — | — |
-
Q, every; M, month; D, day; W, week; CTX, C-terminal telopeptide; P1NP, procollagen type 1 amino-terminal propeptide; BSAP, bone-specific alkaline phosphatase.
Appendix 3—table 3
Goodness-of-fit measures for calibration and validation datasets.
Mean absolute percentage error (MAPE) and windowed minimal absolute percentage error (WMAPE) as defined in Equation 30 and Equation 31, respectively. The column ‘Shown in’ indicates the figure in this article that shows the respective simulation and data plot.
| Medication(s) | MAPE | WMAPE | Shown in | |||||||
|---|---|---|---|---|---|---|---|---|---|---|
| Data ref. | BMD (%) | CTX (%) | P1NP (%) | BSAP (%) | BMD (%) | CTX (%) | P1NP (%) | BSAP (%) | ||
| Calibration datasets | ||||||||||
| Alendronate 5–10 mg Q1D | Black et al., 2006 | 0.9 | 7.0 | 21.1 | — | 0.6 | 4.7 | 13.5 | — | Appendix 3—figure 1 |
| Alendronate 70 mg Q1W | Saag et al., 2017 | 0.5 | 34.4 | 13.7 | — | 0.2 | 20.3 | 10.2 | — | Appendix 3—figure 1 |
| Blosozumab 180 mg Q4W | Recknor et al., 2015 | 0.7 | 16.5 | 23.8 | — | 0.4 | 10.8 | 18.7 | — | Appendix 3—figure 1 |
| Blosozumab 270 mg Q2W | Recknor et al., 2015 | 0.3 | 26.8 | 13.2 | — | 0.2 | 15.8 | 4.8 | — | Appendix 3—figure 1 |
| Denosumab 14 mg Q3M → denosumab 60 mg Q6M | McClung et al., 2017 | 0.3 | — | — | — | 0.1 | — | — | — | Appendix 3—figure 1 |
| Denosumab 14 mg Q6M | McClung et al., 2006 | 0.2 | 73.9 | — | 17.0 | 0.0 | 46.3 | — | 0.2 | Appendix 3—figure 1 |
| Placebo | Recknor et al., 2015 | 0.4 | 7.3 | 15.4 | — | 0.3 | 7.2 | 15.3 | — | Appendix 3—figure 1 |
| Teriparatide 20 mcg Q1D | Leder et al., 2014 | 0.4 | 17.1 | 8.5 | — | 0.2 | 9.1 | 1.6 | — | Appendix 3—figure 1 |
| Teriparatide 20 mcg Q1D→ denosumab 60 mg Q6M | Leder et al., 2015 | 0.4 | 65.5 | — | — | 0.2 | 8.6 | — | — | Appendix 3—figure 1 |
| Validation datasets | ||||||||||
| Alendronate 70 mg Q1W → romosozumab 140 mg Q1M → denosumab 60 mg Q6M | McClung et al., 2018 | 0.5 | 25.4 | 20.0 | — | 0.3 | 17.1 | 3.6 | — | Figure 2 |
| Blosozumab 180 mg Q2W | Recknor et al., 2015 | 0.3 | 21.3 | 20.3 | — | 0.1 | 13.2 | 12.6 | — | Figure 2 |
| Denosumab 60 mg Q6M → teriparatide 20 mcg Q1D | Leder et al., 2015 | 0.4 | 103.1 | — | — | 0.3 | 44.6 | — | — | Figure 2 |
| Placebo | McClung et al., 2018 | 0.6 | 6.2 | 10.5 | — | 0.5 | 6.2 | 10.5 | — | Figure 2 |
| Placebo→ denosumab 60 mg Q6M | McClung et al., 2018 | 0.6 | 13.2 | 10.1 | — | 0.4 | 5.1 | 7.4 | — | Figure 2 |
| Teriparatide 20 mcg Q1D + denosumab 60 mg Q6M → denosumab 60 mg Q6M | Leder et al., 2015 | 0.7 | 183.7 | — | — | 0.4 | 66.4 | — | — | Figure 2 |
| Alendronate 70 mg Q1W → romosozumab 140 mg Q1M → placebo | McClung et al., 2018 | 0.5 | 22.9 | 16.8 | — | 0.4 | 15.1 | 4.2 | — | Figure 2—figure supplement 1 |
| Placebo→ denosumab 60 mg Q6M | Cosman et al., 2016 | 0.5 | 81.9 | 9.6 | — | 0.0 | 44.4 | 4.0 | — | Figure 2—figure supplement 1 |
| Placebo→ denosumab 60 mg Q6M | Lewiecki et al., 2019 | 0.4 | — | — | — | 0.1 | — | — | — | Figure 2—figure supplement 1 |
| Placebo→ denosumab 60 mg Q6M | McClung et al., 2017 | 0.6 | — | — | — | 0.3 | — | — | — | Figure 2—figure supplement 1 |
| Romosozumab 210 mg Q1M → alendronate 70 mg Q1W | Saag et al., 2017 | 1.0 | 30.0 | 37.1 | — | 0.5 | 19.4 | 11.7 | — | Figure 2—figure supplement 1 |
| Romosozumab 210 mg Q1M → denosumab 60 mg Q6M | Cosman et al., 2016 | 1.2 | 92.5 | 22.4 | — | 0.6 | 50.7 | 6.9 | — | Figure 2—figure supplement 1 |
| Romosozumab 210 mg Q1M → denosumab 60 mg Q6M | Lewiecki et al., 2019 | 1.0 | — | — | — | 0.5 | — | — | — | Figure 2—figure supplement 1 |
| Romosozumab 210 mg Q1M → denosumab 60 mg Q6M | McClung et al., 2018 | 0.6 | 14.2 | 57.8 | — | 0.3 | 6.5 | 15.9 | — | Figure 2—figure supplement 1 |
| Romosozumab 210 mg Q1M → placebo | McClung et al., 2018 | 0.7 | 15.0 | 53.3 | — | 0.5 | 10.2 | 18.5 | — | Figure 2—figure supplement 1 |
-
Q, every; M, month; D, day; W, week; BMD, bone mineral density; CTX, C-terminal telopeptide; P1NP, procollagen type 1 amino-terminal propeptide; BSAP, bone-specific alkaline phosphatase.
Appendix 3—table 4
Full list of parameters of the core model and the medication extensions.
| Parameter | Description | Value | Unit | Origin | Model equation |
|---|---|---|---|---|---|
| Core model | |||||
| Reference pre-osteoclast to osteoclast differentiation rate | 0.93 | Calibration | Equation 10 | ||
| Estrogen threshold for downregulation of pre-osteoclast to osteoclast differentiation | 0.94 | 1 | Calibration | Equation 10 | |
| Sclerostin threshold for upregulation of pre-osteoclast to osteoclast differentiation | 1 | Calibration | Equation 10 | ||
| Reference osteoclast apoptosis rate | 0.02 | Calibration | Equation 13 | ||
| Estrogen threshold for upregulation of osteoclast apoptosis | 0.99 | 1 | Calibration | Equation 13 | |
| Resorption signal threshold for upregulation of osteoclast apoptosis | 10.10 | 1 | Calibration | Equation 13 | |
| Max. rel. effect of regulatory factors on osteoclast apoptosis | 1 | Calibration | Equation 13 | ||
| Reference pre-osteoblast to osteoblast differentiation rate | 0.32 | Calibration | Equation 10 | ||
| Sclerostin threshold for downregulation of pre-osteoblast to osteoblast differentiation | 1 | Calibration | Equation 10 | ||
| Reference osteoblast apoptosis rate | Calibration | Equation 13 | |||
| Reference osteoblast to osteocyte conversion rate | Calibration | Equation 11 | |||
| osteocyte apoptosis rate | Estimate | Equation 14 | |||
| Sclerostin degradation rate | 0.05 | Estimate; see Suen et al., 2015; Ominsky et al., 2015. | Equation 15 | ||
| Estrogen threshold for downregulation of sclerostin secretion | 9.60 | 1 | Calibration | Equation 15 | |
| Reference bone resorption rate per unit density osteoclast | Calibration | Equation 16 | |||
| Reference bone formation rate per unit density osteoblast | Calibration | Equation 16 | |||
| Sclerostin threshold for downregulation of bone formation | 1 | Calibration | Equation 16 | ||
| Resorption signal threshold for upregulation of bone formation | 1 | Calibration | Equation 16 | ||
| Max. rel. effect of the resorption signal on bone formation | 1 | Calibration | Equation 16 | ||
| Equilibration rate of the bone mineral content | Calibration | Equation 17 | |||
| Reference bone mineral content | 0.80 | 1 | Estimate | Equation 17 | |
| Onset of estrogen decline | 50.00 | Estimate | Equation 18 | ||
| Time scale of estrogen decline | 2.60 | Indep. fit (Appendix 1—figure 1A) | Equation 18 | ||
| Bone turnover markers | |||||
| Exponent relating the bone resorption rate to CTX levels | 1.16 | 1 | Calibration | Equation 15 | |
| Exponent relating the bone formation rate to P1NP levels | 1.45 | 1 | Calibration | Equation 15 | |
| Exponent relating the bone formation rate to BSAP levels | 0.92 | 1 | Calibration | Equation 15 | |
| Medication extension: sclerostin antibodies | |||||
| Efficacy: blosozumab | 0.01 | 1 | Calibration | Equation 21 | |
| Effective half-life: blosozumab | 7.00 | Equation 21 | |||
| Efficacy: romosozumab | 0.01 | 1 | Equation 21 | ||
| Effective half-life: romosozumab | 7.00 | Solling et al., 2018 | Equation 21 | ||
| Sclerostin/antibody unbinding rate | 0.05 | Equation 25 | |||
| Medication extension: RANKL antibodies | |||||
| Efficacy: denosumab | 1 | Calibration | Equation 21 | ||
| Effective half-life: denosumab | 10.00 | Bekker et al., 2004 | Equation 21 | ||
| Max. rel. effect of RANKL antibodies on pre-osteoclast to osteoclast differentiation | 0.87 | 1 | Calibration | Equation 24 | |
| Max. rel. effect of RANKL antibodies on mineralization | 0.02 | 1 | Calibration | Equation 24 | |
| Medication extension: bisphosphonates | |||||
| Efficacy: alendronate | 1 | Calibration | Equation 22 | ||
| Effective half-life: alendronate | Calibration | Equation 22 | |||
| Max. contribution of bisphosphonates to osteoclast apoptosis rate | 1.00 | Calibration | Equation 26 | ||
| Medication extension: PTH analogs | |||||
| Efficacy: teriparatide | 0.27 | 1 | Calibration | Equation 22 | |
| Effective half-life: teriparatide | 0.04 | Satterwhite et al., 2010 | Equation 22 | ||
| Max. rel. effect of PTH analogs on osteoblast apoptosis | 1.31 | 1 | Calibration | Equation 27 | |
| Max. rel. effect of PTH analogs on pre-osteoclast to osteoclast differentiation | 4.28 | 1 | Calibration | Equation 27 | |
-
CTX, C-terminal telopeptide; P1NP, procollagen type 1 amino-terminal propeptide; BSAP, bone-specific alkaline phosphatase; PTH, parathyroid hormone.
Additional files
-
Transparent reporting form
- https://cdn.elifesciences.org/articles/76228/elife-76228-transrepform1-v1.docx
-
Source code 1
Simulation codes needed to reproduce the results in the paper.
- https://cdn.elifesciences.org/articles/76228/elife-76228-code1-v1.zip
Download links
A two-part list of links to download the article, or parts of the article, in various formats.
Downloads (link to download the article as PDF)
Open citations (links to open the citations from this article in various online reference manager services)
Cite this article (links to download the citations from this article in formats compatible with various reference manager tools)
Modeling osteoporosis to design and optimize pharmacological therapies comprising multiple drug types
eLife 11:e76228.
https://doi.org/10.7554/eLife.76228


