A single full-length VAR2CSA ectodomain variant purifies broadly neutralizing antibodies against placental malaria isolates
- Laboratory of Malaria Immunology and Vaccinology, National Institute of Allergy and Infectious Diseases, National Institutes of Health, United States
- Malaria Research and Training Center, University of Sciences, Techniques, and Technologies of Bamako, Mali
Figures
Figure 1
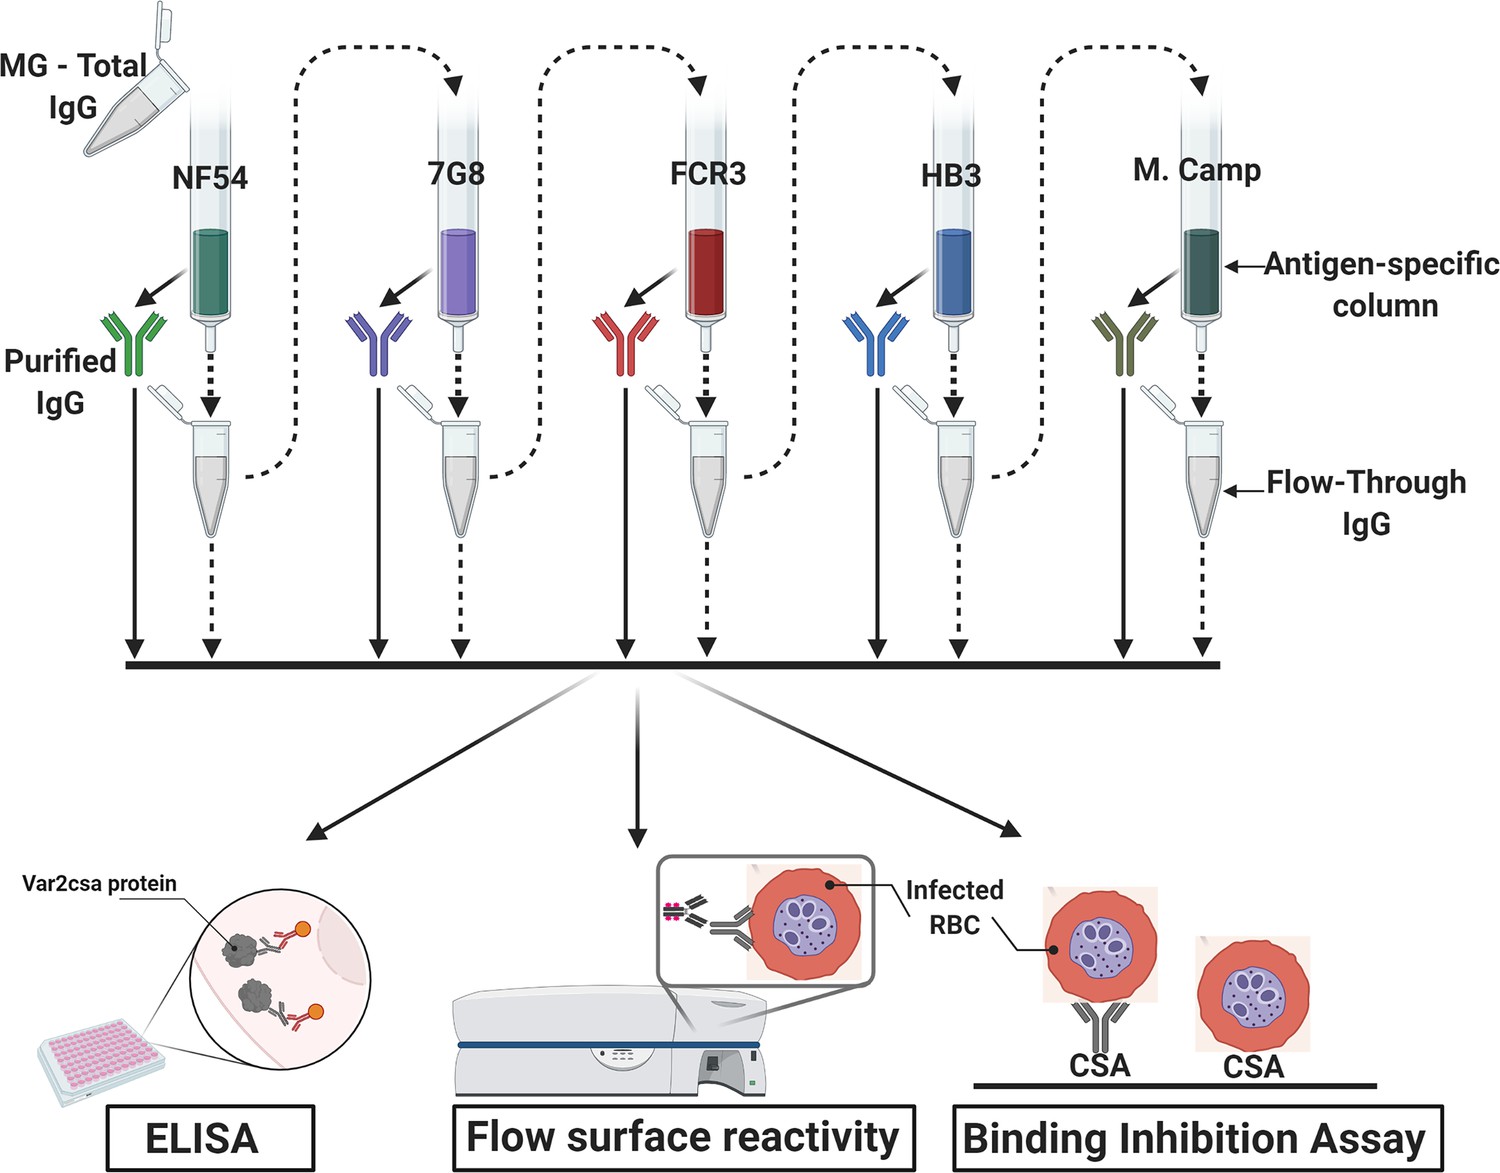
Flow chart of the experimental design.
VAR2CSA-specific IgG was sequentially purified from total IgG isolated in multigravidae (MG) using antigen-specific columns made with NF54, 7G8, FCR3, HB3, Malayan Camp (M. Camp) alleles of full-length VAR2CSA ectodomain. The flow-through IgG as well as eluted IgG after each VAR2CSA column were assessed by ELISA, in Flow cytometry for surface reactivity and binding inhibition assay using CSA-binding Plasmodium falciparum-infected red blood cells (RBC). Image was created with https://BioRender.com.
Figure 2 with 4 supplements
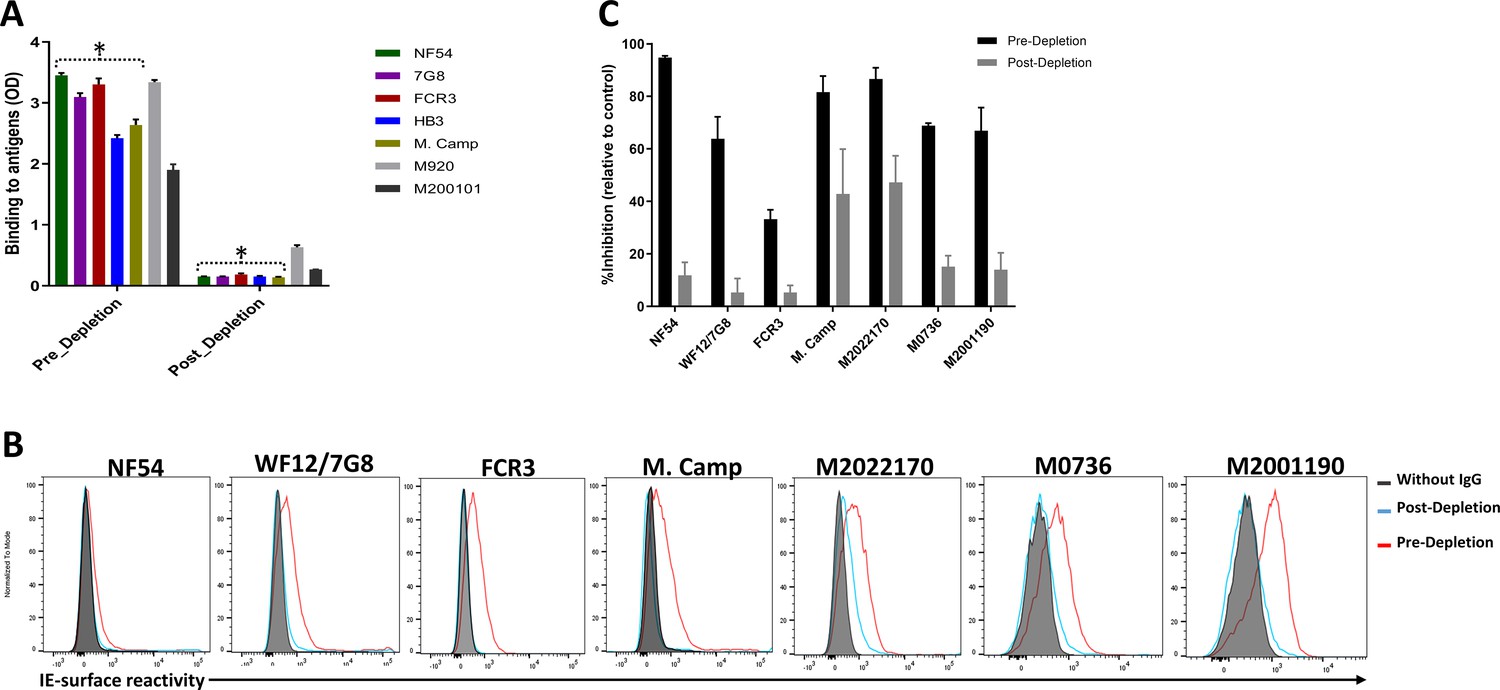
Depletion of VAR2CSA-specific IgG and activity of Total IgG purified from Malian multigravidae.
Activity of the total IgG before (Pre-depletion) and after (Post-depletion) purification of VAR2CSA-specific IgG was assessed by (A) ELISA on different recombinant full-length VAR2CSA ectodomain, (B) by Flow cytometry, and (C) CSA-binding inhibition assay using six isolates including three recently adapted maternal isolates (M0736, M2022170, and M2001190). In panel B, histogram without IgG represents assay well with no testing IgG and similarly stained with conjugated anti-human secondary IgG. In panel C, percent inhibition activity of purified IgG was determined relative to activity obtained with control wells without any testing IgG. Data in C represent at least two independent experiments. Asterisk (*) indicates antigens used in the sequential VAR2CSA-specific IgG depletion assay.
-
Figure 2—source data 1
ELISA activity of total IgG before and after purification of VAR2CSA-specific IgG.
- https://cdn.elifesciences.org/articles/76264/elife-76264-fig2-data1-v2.xlsx
-
Figure 2—source data 2
CSA-binding inhibition activities before and after purification of VAR2CSA-specific IgG.
- https://cdn.elifesciences.org/articles/76264/elife-76264-fig2-data2-v2.xlsx
Figure 2—figure supplement 1
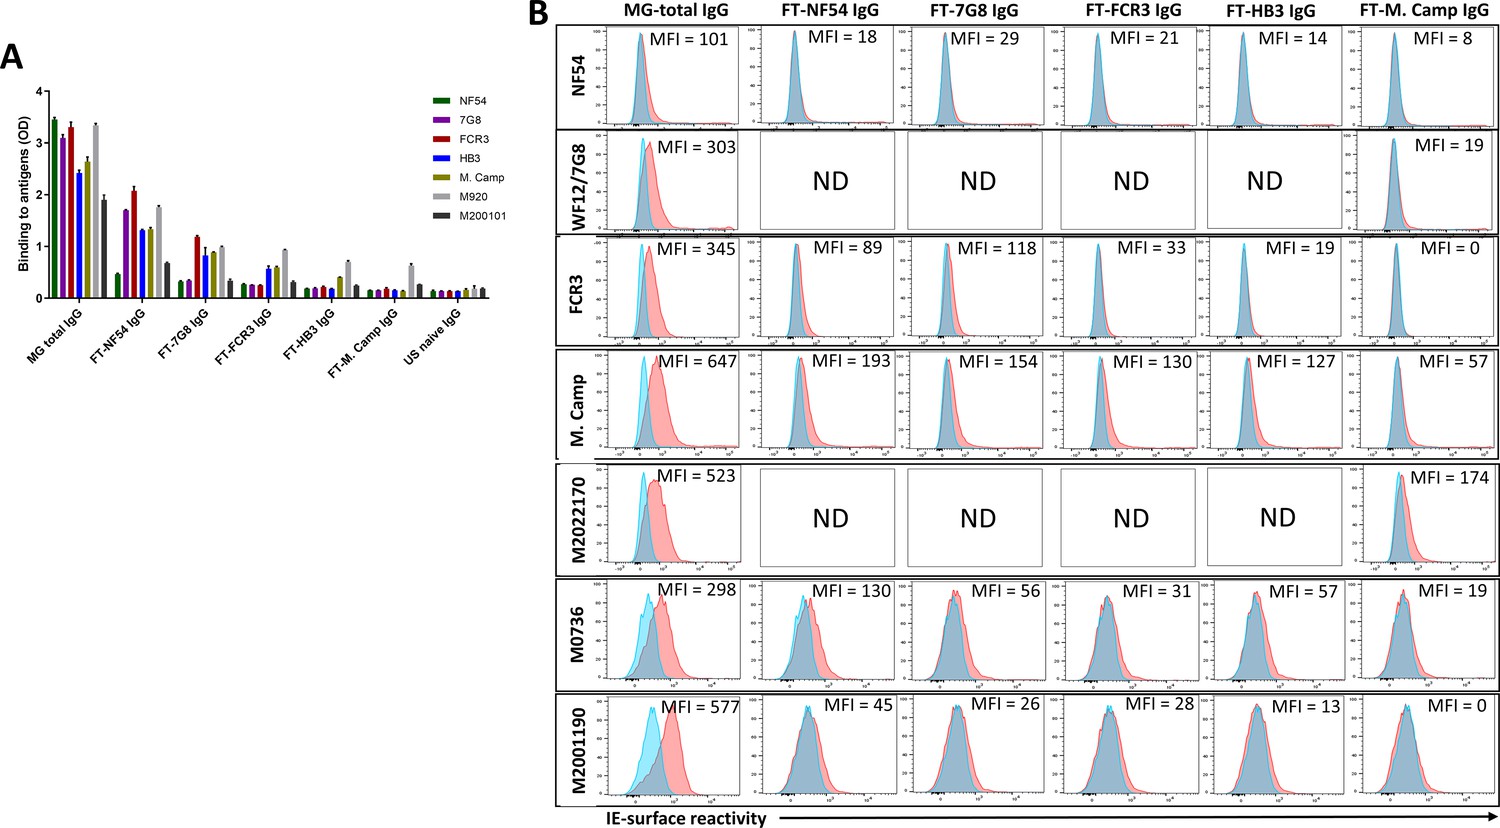
Reactivity of the post depletion samples to VAR2CSA recombinants and CSA-binding isolates.
Reactivity of initial total IgG (MG total IgG) as well as flow through (FT) IgG samples collected after each VAR2CSA-specific column were assessed by ELISA (A) on seven recombinant full-length VAR2CSA ectodomain proteins. IgG were tested at 10 µg/mL concentration (IgG conc.). (B) Ability of MG total IgG and FT IgG to bind native VAR2CSA on CSA-binding isolates was evaluated by Flow cytometry. Testing IgG is indicated in red while histogram in blue represents assay well with no testing IgG and similarly stained with conjugated anti-human secondary IgG. Median fluorescence intensity (MFI) values are indicated. For maternal isolate M2022170, no data (ND) are available for FT samples collected after NF54, 7G8, FCR3, and HB3 due to limited material.
Figure 2—figure supplement 2
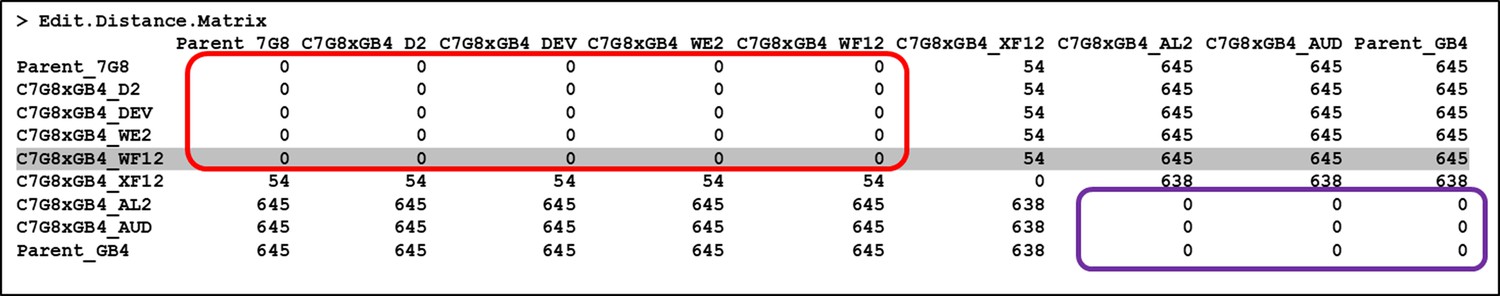
VAR2CSA sequences shared by progeny of 7G8 and GB4 crossing.
VAR2CSA sequences of seven progenies of 7G8 x GB4 crossing were analyzed using the Consensus Protein Pileup (CPP) tool in R package ‘DuffyNGS’ as previously described (Doritchamou et al., 2019; Renn et al., 2021). Sequence similarity among the seven variants was measured as edit distance which was determined as the number of mismatched residues of amino acid, using R function ‘adist()’. Progenies including WF12 (gray row) sharing the same VAR2CSA sequence as 7G8 are highlighted in the red box, while those with GB4 sequence are in the purple box.
Figure 2—figure supplement 3
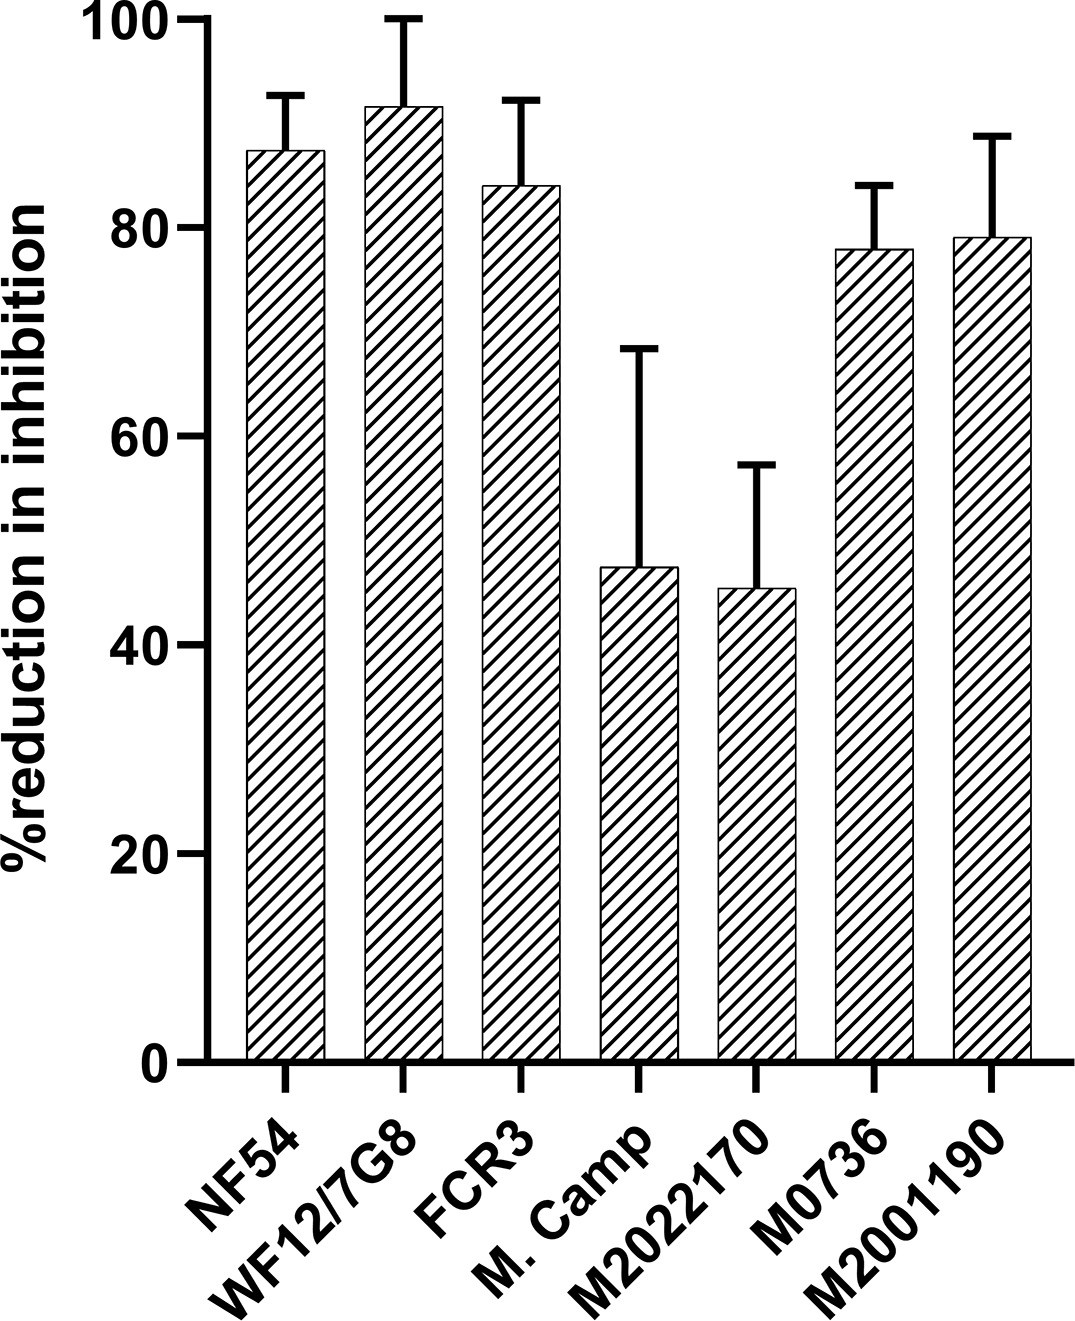
Percent reduction in CSA-binding inhibition activity of the MG-Pool after VAR2CSA IgG purification/depletion.
Percent reduction in inhibition activity after depletion of reactivities to five variants of full-length VAR2CSA ectodomain is shown.
-
Figure 2—figure supplement 3—source data 1
Percent reduction in CSA-binding inhibition activity of the MG-Pool after VAR2CSA IgG purification/depletion.
- https://cdn.elifesciences.org/articles/76264/elife-76264-fig2-figsupp3-data1-v2.xlsx
Figure 2—figure supplement 4
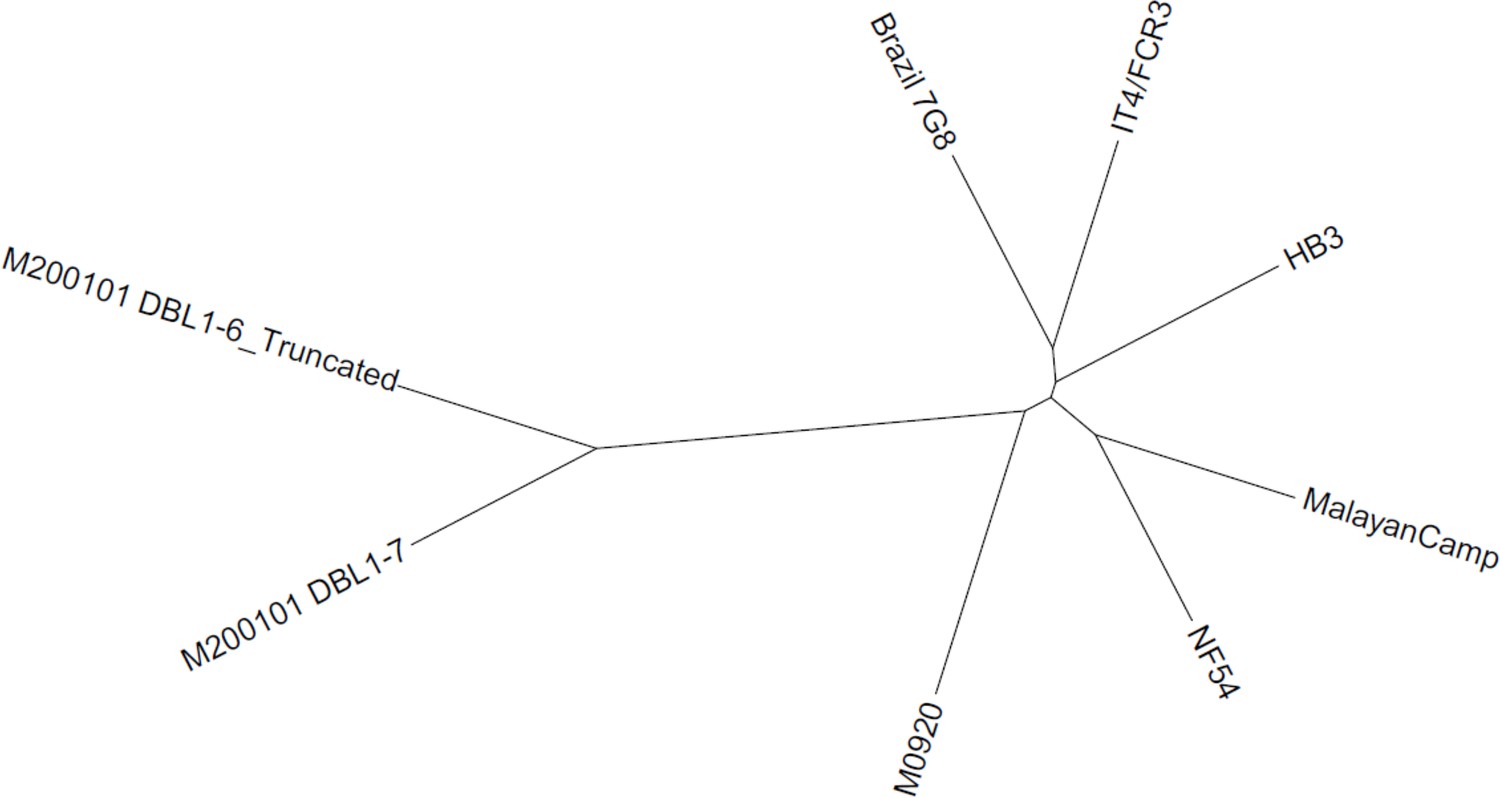
Phylogenetic analysis of variants of full-length VAR2CSA sequences.
Phylogenetic trees were generated using function ‘plot.phylo()’ from the R package ‘ape’. The NTS-DBL6 truncated sequence of the M200101 variant (NTS-DBL7) was also included in the analysis.
Figure 3
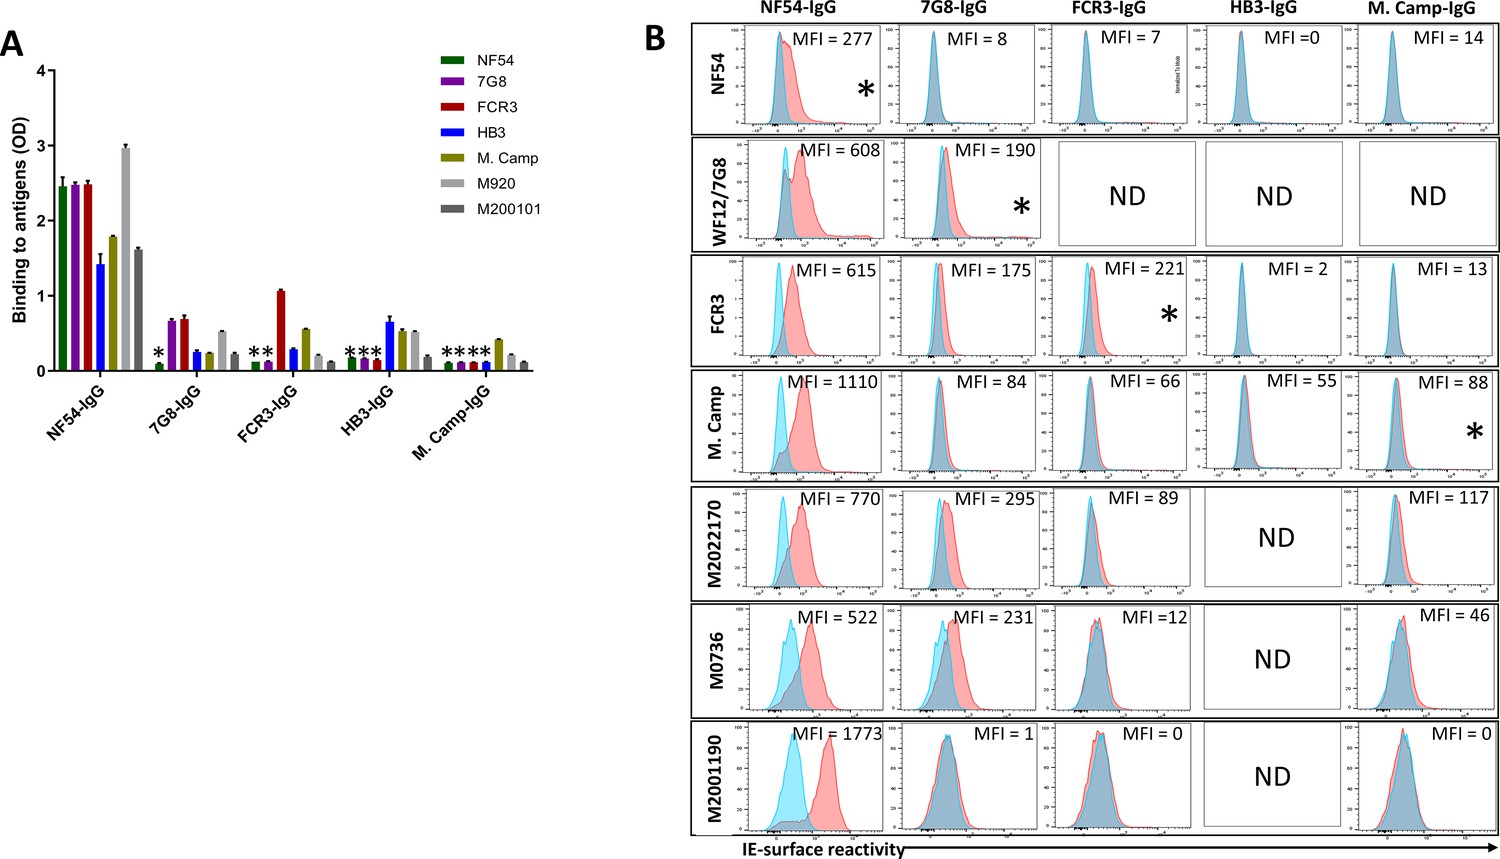
Reactivity of the purified VAR2CSA-specific IgG to different full-length VAR2CSA antigens and P. falciparum isolates.
Reactivity of VAR2CSA-specific purified IgG was assessed by ELISA (A) on seven recombinant full-length VAR2CSA ectodomain proteins including two proteins (M920 and M200101) that were not used in the purification assay. IgG were tested at 0.1 µg/mL concentration (IgG conc.); asterisk (*) indicates depleted reactivity. (B) Ability of purified VAR2CSA IgG to bind native VAR2CSA on six CSA-binding isolates was evaluated by Flow cytometry. Testing IgG is indicated in red while histogram in blue represents assay well with no testing IgG and similarly stained with conjugated anti-human secondary IgG. Median fluorescence intensity (MFI) values are indicated. Due to limited material of purified IgG on HB3 VAR2CSA (HB3-IgG), no data (ND) are available for maternal isolates (M0736, M2022170 and M2001190). Asterisk (*) indicates surface reactivity to the homologous parasite.
-
Figure 3—source data 1
ELISA reactivity of VAR2CSA-specific purified IgG on 7 recombinant full-length VAR2CSA ectodomain proteins.
- https://cdn.elifesciences.org/articles/76264/elife-76264-fig3-data1-v2.xlsx
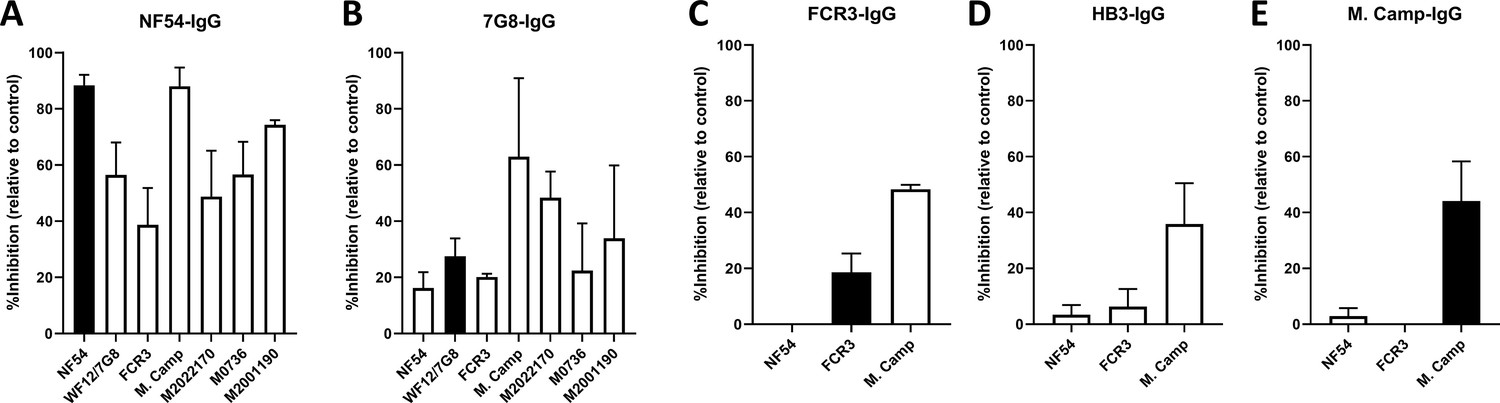
Figure 4 with 2 supplements
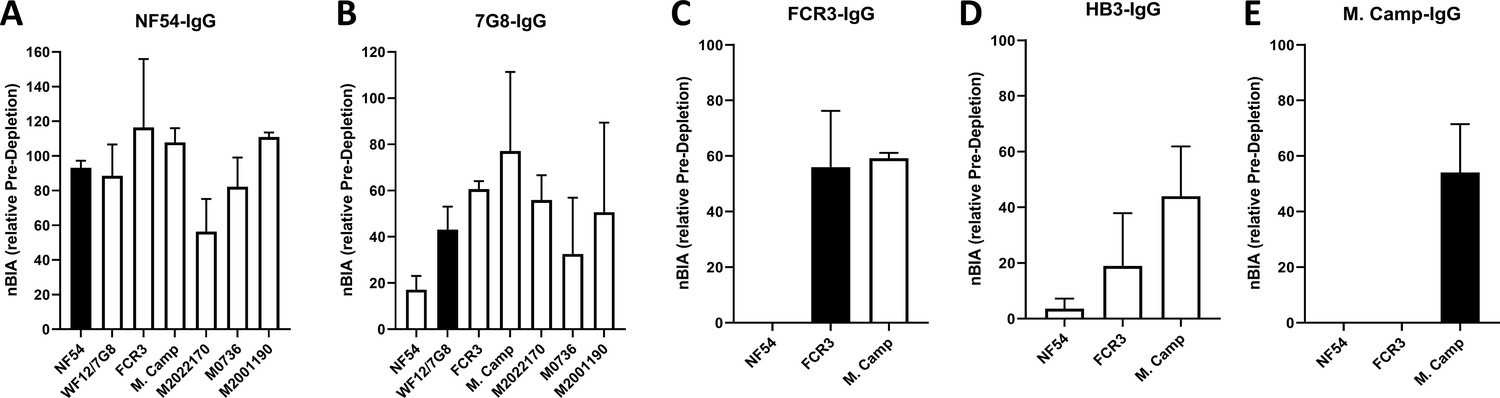
CSA-binding inhibitory activity of VAR2CSA-specific purified IgG from multigravidae.
The inhibition capacity of VAR2CSA-specific purified IgG was assessed on CSA-binding isolates (A – E). Blocking activity (nBIA) of purified IgG was normalized by activity obtained with total IgG before any VAR2CSA IgG purification (Pre-depletion). Due to limited material, purified IgG on FCR3, HB3, and M. Camp was not tested on maternal isolates (M0736, M2022170, and M2001190). Black box indicates inhibition activity against homologous parasite and empty box represents activity against heterologous parasites. Data represent at least two independent experiments.
-
Figure 4—source data 1
Inhibition capacity of VAR2CSA-specific purified IgG against NF54.
- https://cdn.elifesciences.org/articles/76264/elife-76264-fig4-data1-v2.xlsx
-
Figure 4—source data 2
Inhibition capacity of VAR2CSA-specific purified IgG against 7G8.
- https://cdn.elifesciences.org/articles/76264/elife-76264-fig4-data2-v2.xlsx
-
Figure 4—source data 3
Inhibition capacity of VAR2CSA-specific purified IgG against FCR3.
- https://cdn.elifesciences.org/articles/76264/elife-76264-fig4-data3-v2.xlsx
-
Figure 4—source data 4
Inhibition capacity of VAR2CSA-specific purified IgG against HB3.
- https://cdn.elifesciences.org/articles/76264/elife-76264-fig4-data4-v2.xlsx
-
Figure 4—source data 5
Inhibition capacity of VAR2CSA-specific purified IgG against M. Camp.
- https://cdn.elifesciences.org/articles/76264/elife-76264-fig4-data5-v2.xlsx
Figure 4—figure supplement 1
CSA-binding inhibitory activity of VAR2CSA-specific IgG purified from multigravidae.
The inhibition capacity of VAR2CSA-specific purified IgG was assessed on CSA-binding isolates (A – E). Percent inhibition activity of purified IgG was determined relative to activity obtained with control wells without any testing IgG. Due to limited material, purified IgG on FCR3, HB3, and M. Camp was not tested on maternal isolates (M0736, M2022170, and M2001190). Black box indicates inhibition activity to the homologous parasite and empty box represents activities against heterologous parasites. Data represent at least two independent experiments.
Figure 4—figure supplement 2
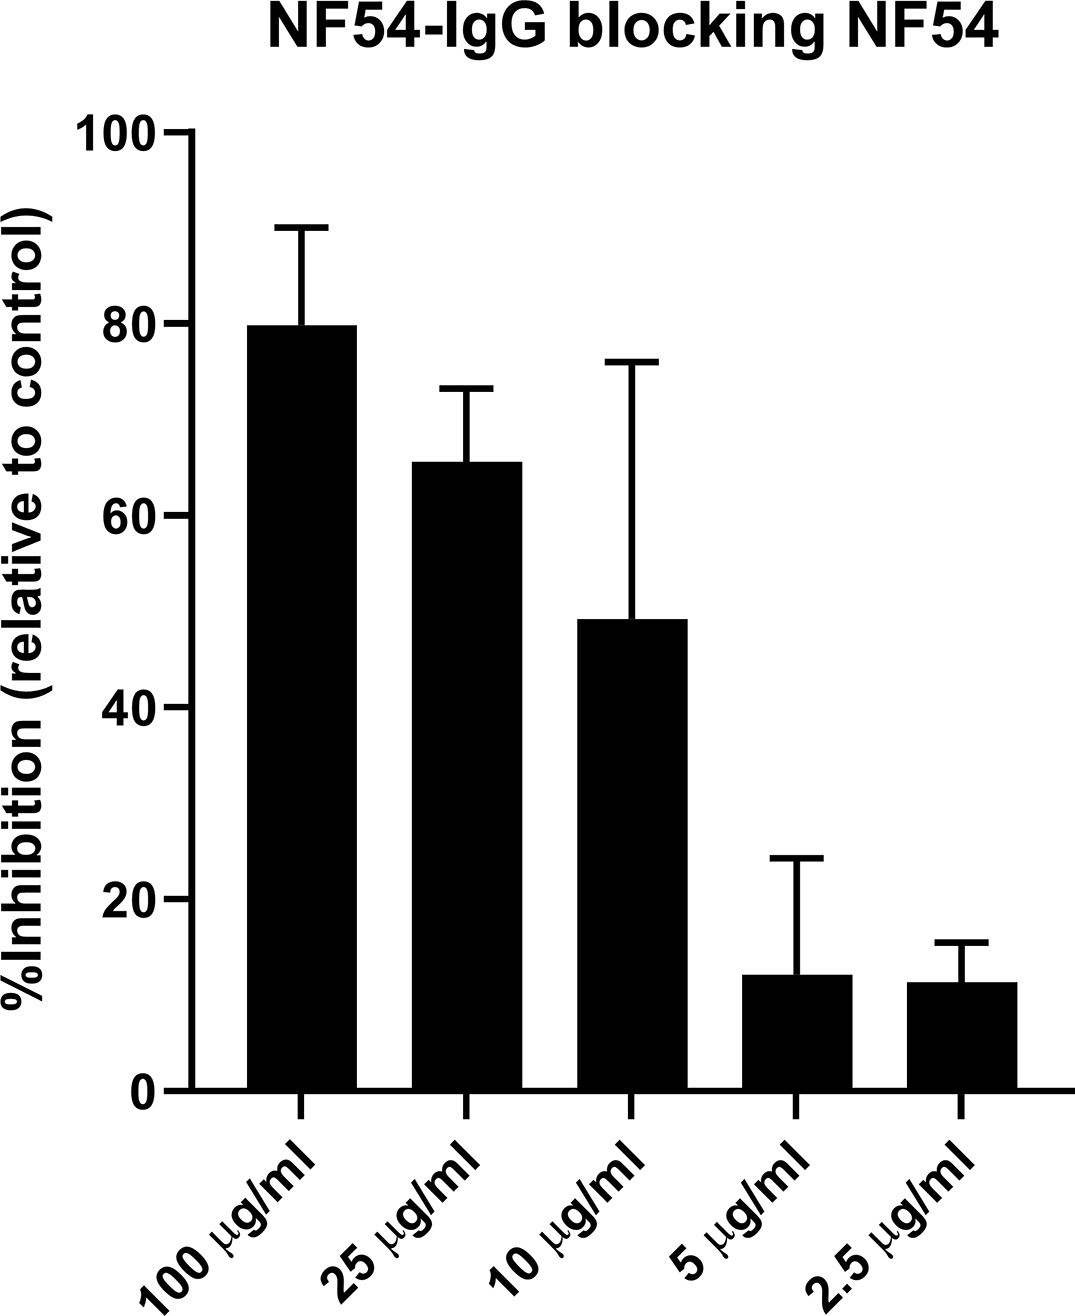
Titration of homologous inhibition activity by purified VAR2CSANF54 specific IgG.
Homologous inhibition activity of naturally acquired IgG specific to VAR2CSANF54 ectodomain was assessed by testing variable concentrations (100, 25, 10, 5, and 2.5 µg/mL). Data represent at least two independent experiments.
Figure 5 with 1 supplement
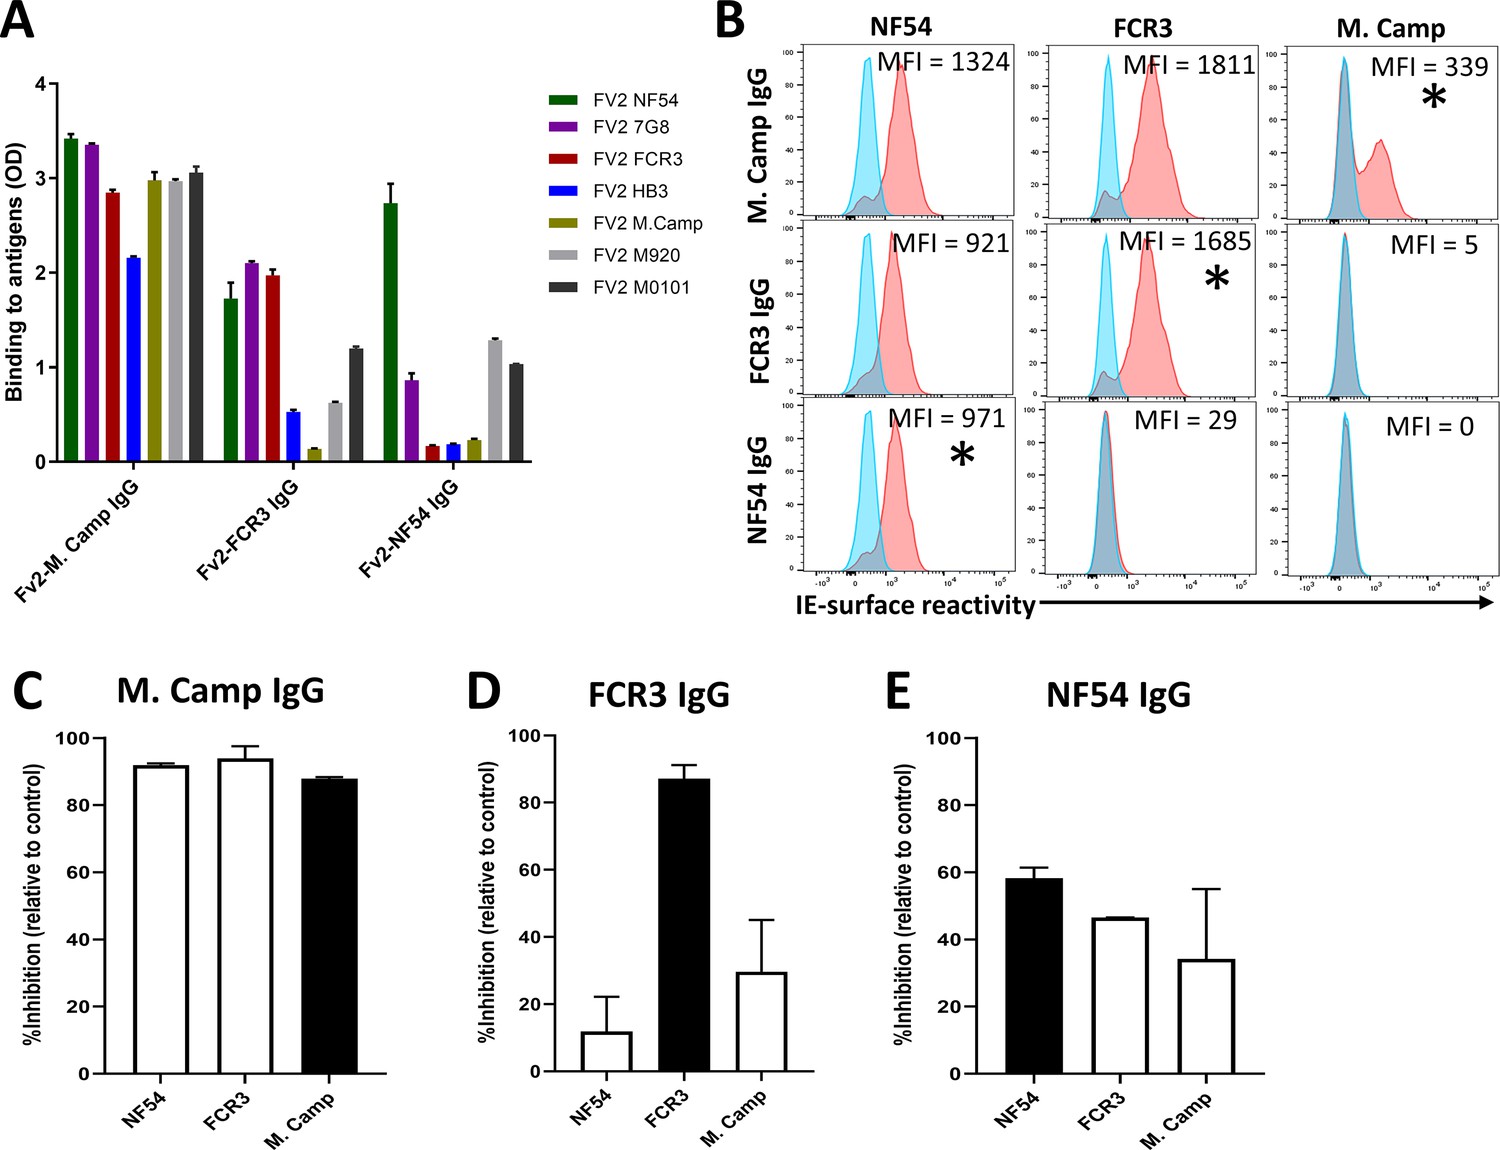
Reactivity of the purified VAR2CSA-specific IgG to different full-length VAR2CSA antigens and P.
falciparum isolates in a second independent purification/depletion experiment. Reactivity of VAR2CSA-specific purified IgG was assessed by ELISA (A) on seven recombinant full-length VAR2CSA ectodomain proteins including four proteins (7G8, HB3, M920, and M200101) that were not used in this purification/depletion assay. IgG were tested at 0.1 µg/mL concentration. (B) Ability of purified VAR2CSA IgG to bind native VAR2CSA on six CSA-binding isolates was evaluated by Flow cytometry. Testing IgG is indicated in red while histogram in blue represents assay well with no testing IgG and similarly stained with conjugated anti-human secondary IgG. Median fluorescence intensity (MFI) values are indicated. Asterisk (*) indicates surface reactivity to homologous parasite. (C– E) Inhibition capacity of the VAR2CSA-specific purified IgG was assessed on three CSA-binding isolates. Black box indicates inhibition activity to the homologous parasite and empty box represent activities against heterologous parasites.
-
Figure 5—source data 1
ELISA reactivity of VAR2CSA-specific purified IgG.
- https://cdn.elifesciences.org/articles/76264/elife-76264-fig5-data1-v2.xlsx
-
Figure 5—source data 2
Inhibition capacity of VAR2CSA-specific purified IgG against M. Camp.
- https://cdn.elifesciences.org/articles/76264/elife-76264-fig5-data2-v2.xlsx
-
Figure 5—source data 3
Inhibition capacity of VAR2CSA-specific purified IgG against FCR3.
- https://cdn.elifesciences.org/articles/76264/elife-76264-fig5-data3-v2.xlsx
-
Figure 5—source data 4
Inhibition capacity of VAR2CSA-specific purified IgG against NF54.
- https://cdn.elifesciences.org/articles/76264/elife-76264-fig5-data4-v2.xlsx
Figure 5—figure supplement 1
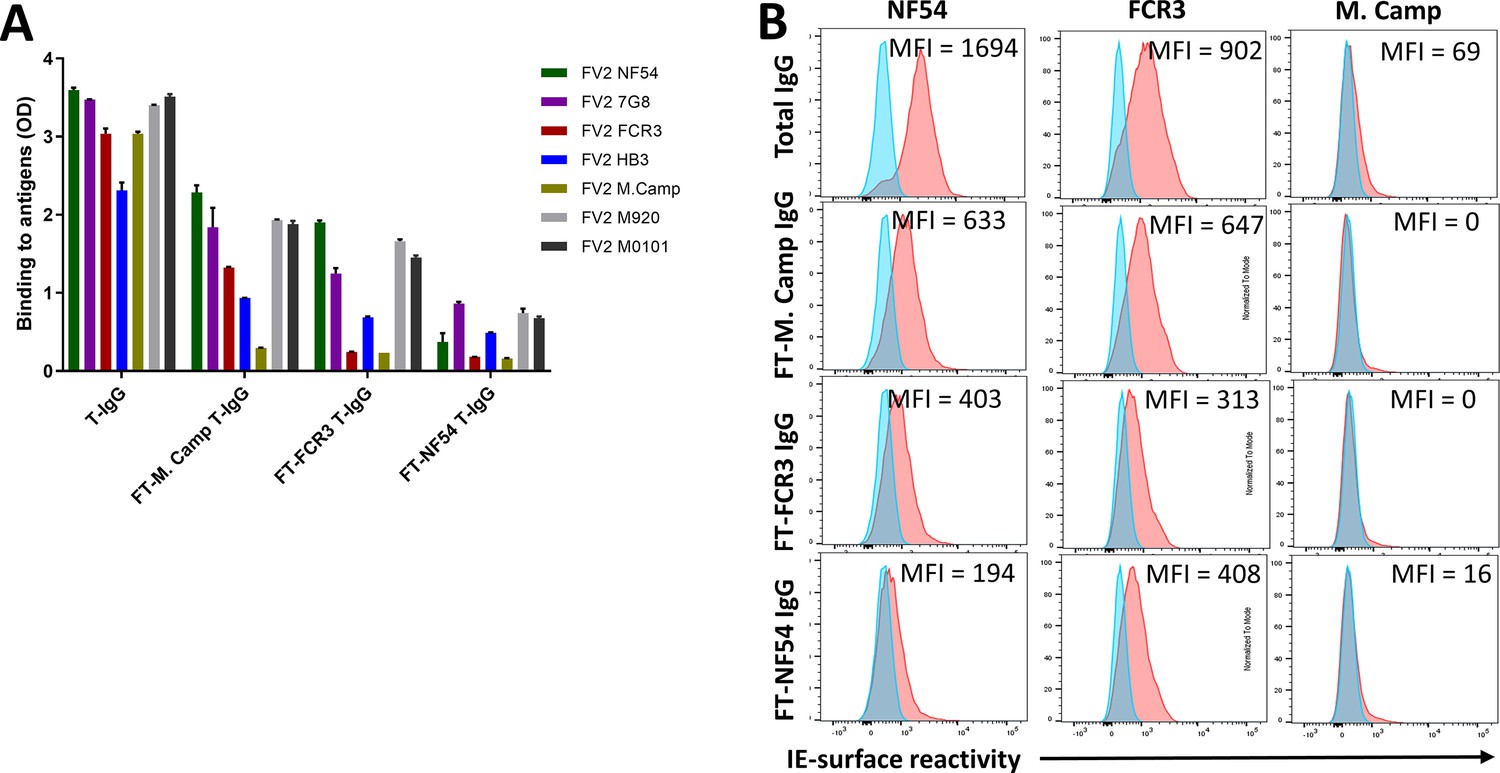
Reactivity of the post depletion samples to VAR2CSA recombinants and CSA-binding isolates.
Reactivity of pre-depletion total IgG (T-IgG) as well as flow through (FT) IgG samples collected after each VAR2CSA-specific column was assessed by ELISA (A) on seven recombinant full-length VAR2CSA ectodomain proteins. IgG were tested at 10 µg/mL concentration. IE-surface reactivity of IgG evaluated by Flow cytometry is shown in panel (B). Testing IgG is indicated in red while histogram in blue represents assay well with no testing IgG and similarly stained with conjugated anti-human secondary IgG. Median fluorescence intensity (MFI) values are provided.
Tables
Table 1
Purification yields of purified IgG.
| Order of depletion | IgG | Yield |
|---|---|---|
| - | Total IgG | 58,000 μg |
| 1 | Fv2-NF54 IgG | 145.6 μg |
| 2 | Fv2-7G8 IgG | 148.9 μg |
| 3 | Fv2-FCR3 IgG | 53.4 μg |
| 4 | Fv2-HB3 IgG | 14.5 μg |
| 5 | Fv2-M. Camp IgG | 23.7 μg |
Key resources table
| Reagent type (species) or resource | Designation | Source or reference | Identifiers | Additional information |
|---|---|---|---|---|
| Antibody | Goat anti-Human IgG Fc - Affinity Pure, HRP Conjugate (goat polyclonal) | ImmunoReagents, Inc | GtxHu-004-DHRPX | 1:3000 dilution |
| Antibody | Goat anti-Human IgG Fc Secondary Antibody, PE, eBioscience (goat polyclonal) | Invitrogen, Carlsbad, CA | 12-4998-82 | 1:800 dilution |
| Biological samples (Human) | Plasma | Malaria Research and Training Centre, Bamako, Mali, Fried et al., 2018 | ||
| Protein, recombinant protein | Full-length VAR2CSA ectodomain, variant NF54 | Patrick E Duffy, Renn et al., 2021 | ||
| Protein, recombinant protein | Full-length VAR2CSA ectodomain, variant 7G8 | Patrick E Duffy, Renn et al., 2021 | ||
| Protein, recombinant protein | Full-length VAR2CSA ectodomain, variant FCR3 | Patrick E Duffy, Renn et al., 2021 | ||
| Protein, recombinant protein | Full-length VAR2CSA ectodomain, variant HB3 | Patrick E Duffy, Renn et al., 2021 | ||
| Protein, recombinant protein | Full-length VAR2CSA ectodomain, variant M920 | Patrick E Duffy, Renn et al., 2021 | ||
| Protein, recombinant protein | Full-length VAR2CSA ectodomain, variant M. Camp | Patrick E Duffy, Renn et al., 2021 | ||
| Protein, recombinant protein | Full-length VAR2CSA ectodomain, variant M200101 | Patrick E Duffy, Renn et al., 2021 | ||
| Strain, strain background (Plasmodium falciparum) | NF54 | Patrick E Duffy, Doritchamou et al., 2019 | ||
| Strain, strain background (Plasmodium falciparum) | FCR3 | Patrick E Duffy, Doritchamou et al., 2016 | ||
| Strain, strain background (Plasmodium falciparum) | M.Camp | Patrick E Duffy | ||
| Strain, strain background (Plasmodium falciparum) | M0736 | Patrick E Duffy, Doritchamou et al., 2016 | ||
| Strain, strain background (Plasmodium falciparum) | M2022170 | Patrick E Duffy | ||
| Strain, strain background (Plasmodium falciparum) | M2001190 | Patrick E Duffy | ||
| Strain, strain background (Plasmodium falciparum) | WF12 | Thomas E Wellems, NIH, Hayton et al., 2008 | ||
| Commercial assay or kit | NHS-Activated Sepharose 4 Fast Flow | GE Healthcare Life Sciences | 17090601 | |
| Chemical compound, drug | SYBR Green I Nucleic Acid Gel Stain - 10,000 X | LifeTechnologies | S7563 | Used at 0.1 X |
| Software, algorithm | Graphpad PRISM 9.0 | GraphPad Software, Inc. | ||
| Software, algorithm | FlowJo 10 | Tree Star, Inc. | ||
| Software, algorithm | R package ‘ape’ | http://ape-package.ird.fr/ |
Additional files
-
Supplementary file 1
CSA-binding level of the isolates.
- https://cdn.elifesciences.org/articles/76264/elife-76264-supp1-v2.docx
-
Transparent reporting form
- https://cdn.elifesciences.org/articles/76264/elife-76264-transrepform1-v2.docx
Download links
A two-part list of links to download the article, or parts of the article, in various formats.
Downloads (link to download the article as PDF)
Open citations (links to open the citations from this article in various online reference manager services)
Cite this article (links to download the citations from this article in formats compatible with various reference manager tools)
A single full-length VAR2CSA ectodomain variant purifies broadly neutralizing antibodies against placental malaria isolates
eLife 11:e76264.
https://doi.org/10.7554/eLife.76264


