Integrated analyses of growth differentiation factor-15 concentration and cardiometabolic diseases in humans
- Institute for Molecular Medicine Finland, University of Helsinki, Finland
- Centre for Genomics Research, AstraZeneca, United Kingdom
- Finnish Institute for Health and Welfare, Finland
- British Heart Foundation Cardiovascular Epidemiology Unit, Department of Public Health and Primary Care, University of Cambridge, United Kingdom
- Department of Cardiology and Angiology, Hannover Medical School, Germany
- Clinic of Cardiology, University Heart and Vascular Center, University Medical Center Hamburg-Eppendorf, Germany
- Population Health Research Department, University Heart and Vascular Center, University Medical Center Hamburg-Eppendorf, Germany
- German Center for Cardiovascular Research (DZHK), partner site Hamburg/Kiel/Luebeck, Germany
- University Center of Cardiovascular Science, University Medical Center Hamburg-Eppendorf, Germany
- Department of Immunology and Inflammation, Imperial College London, United Kingdom
- Health Data Research UK Cambridge, Wellcome Genome Campus and University of Cambridge, United Kingdom
- Bioscience Renal, Research and Early Development Cardiovascular, Renal and Metabolism (CVRM), BioPharmaceuticals R&D, AstraZeneca, Sweden
- Precision Medicine, Oncology R&D, AstraZeneca, United Kingdom
- Analytic and Translational Genetics Unit, Department of Medicine, Massachusetts General Hospital, United States
- Program in Medical and Population Genetics, Broad Institute of MIT and Harvard, United States
- British Heart Foundation Centre of Research Excellence, University of Cambridge, United Kingdom
- National Institute for Health Research Blood and Transplant Research Unit in Donor Health and Genomics, University of Cambridge, United Kingdom
Figures
Figure 1 with 1 supplement
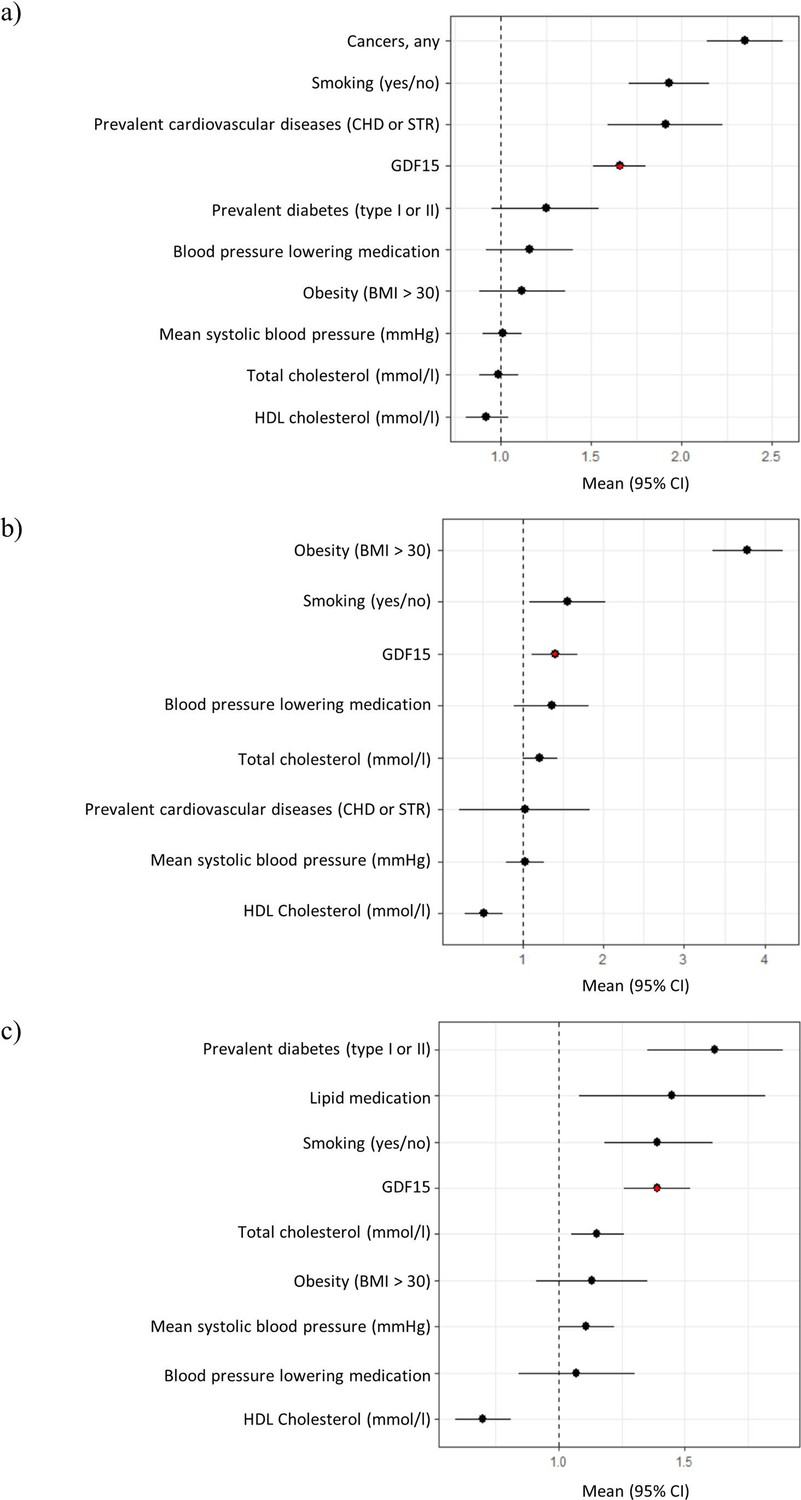
Forest plots of Cox proportional hazard models for independent predictors of (a) all-cause mortality, (b) diabetes, and (c) cardiovascular disease.
The plot reports hazard ratios and 95% condidence intervals (error bars) with the dashed line representing the null effect. GDF15 is highlighted in red and variables are ordered by highest hazards ratio. Sample sizes are as follows; (a) n=393, (b) n=97 and (c) n=438. Abbreviations: BMI, body mass index; GDF15, growth differentiation factor-15; CHD, coronary heart disease; STR, stroke; HDL, high-density lipoprotein.
Figure 1—figure supplement 1
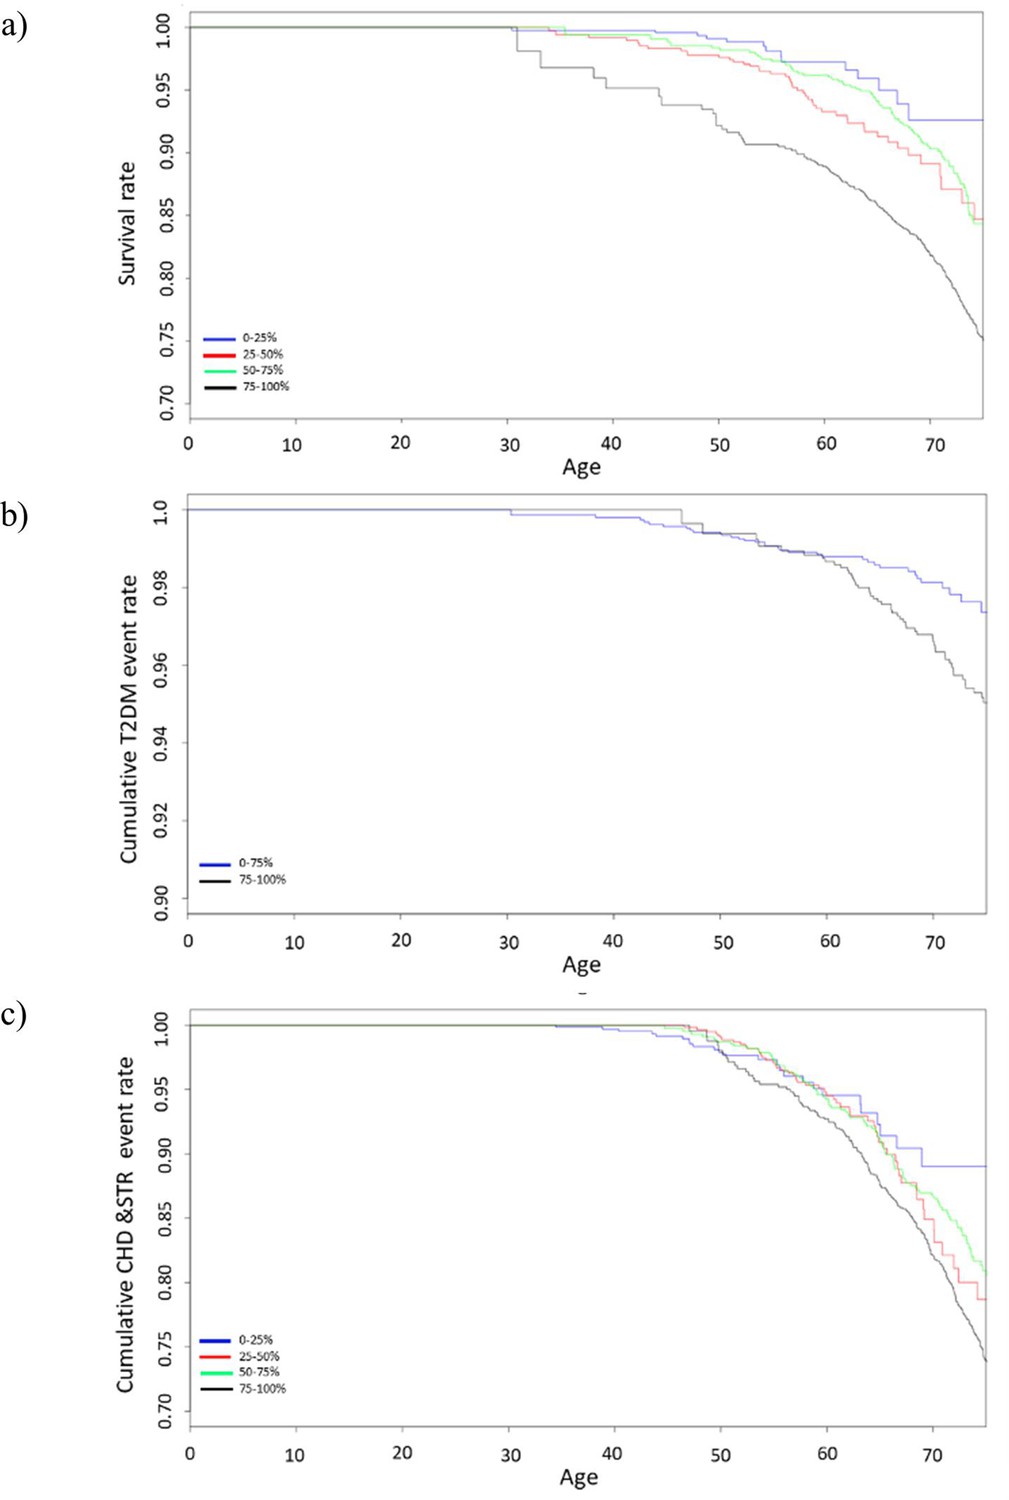
Survival curves of Cox proportional hazards model for (a) all-cause mortality (b) diabetes, and (c) cardiovascular disease stratified by GDF15 quartiles.
Survival curves include data from 10-year follow-up and GDF15 levels are divided into quartiles. Type 2 diabetes shows only a comparison of the last quartile (75–100%) with the rest (0–75%) due to insufficient power when treating the other quartiles separately. Abbreviations: T2DM, type 2 diabetes mellitus; CHD, coronary heart disease; STR, stroke; GDF15, growth differentiation factor-15.
Figure 2

Manhattan and Quantile-Quantile (QQ) plots for genome-wide association study (GWAS) meta-analysis of conditioned growth differentiation factor-15 (GDF15) plasma levels in 14,099 individuals for (a) the GDF15 region and (b) all chromosomes.
The dotted line (a) and red line (b) represent genome-wide significance (p-value < 5 × 10⁻⁸).
Tables
Table 1
Disease endpoints associated (pFDR < 1 × 10⁻⁵) with GDF15 plasma levels in FINRISK.
| Disease endpoint | Cases/controls | OR (95% CI) | pFDR |
|---|---|---|---|
| All-cause mortality | 1057/5481 | 1.79 (1.68–1.90) | 7.5×10⁻²⁴ |
| Death due to cardiac causes | 471/6067 | 1.76 (1.61–1.90) | 3.0×10⁻¹¹ |
| Atherosclerosis, excluding cerebral, coronary, and PAD | 379/6159 | 1.67 (1.51–1.82) | 3.2×10⁻⁸ |
| Diabetes mellitus type 2 | 567/5971 | 1.48 (1.36–1.60) | 3.2×10⁻⁸ |
| Diabetes mellitus | 592/5946 | 1.44 (1.33–1.56) | 9.8×10⁻⁸ |
| Diseases of arteries, arterioles, and capillaries | 505/6033 | 1.48 (1.35–1.61) | 3.6×10⁻⁷ |
| Other COPD | 221/6317 | 1.84 (1.63–2.04) | 5.7×10⁻⁷ |
| COPD | 235/6303 | 1.77 (1.57–1.97) | 9.6×10⁻⁷ |
| Pneumonia (excl. viral and due to other infectious organisms not elsewhere classified) | 779/5759 | 1.34 (1.24–1.44) | 9.6×10⁻⁷ |
| Type 2 diabetes without complications | 485/6053 | 1.44 (1.31–1.57) | 1.2×10⁻⁶ |
| All pneumonia | 789/5749 | 1.33 (1.23–1.43) | 1.9×10⁻⁶ |
| Chronic kidney disease | 66/6472 | 2.46 (2.14–2.79) | 4.4×10⁻⁶ |
| Influenza and pneumonia | 833/5795 | 1.30 (1.21–1.40) | 4.4×10⁻⁶ |
| Type 2 diabetes with renal complications | 35/6503 | 2.97 (2.57–3.38) | 8.1×10⁻⁶ |
| Sequelae of cerebrovascular disease | 209/6329 | 1.67 (1.47–1.86) | 9.2×10⁻⁶ |
| Alcoholic liver disease | 56/6482 | 2.26 (1.95–2.57) | 9.2×10⁻⁶ |
-
Results are adjusted for age, gender, smoking, and BMI. Abbreviations: OR, odds ratio; CI, confidence interval; COPD, chronic obstructive pulmonary disease; PAD, peripheral artery disease; SAH, subarachnoid haemorrhage; GDF15, growth differentiation factor-15. ICD codes for these disease endpoints have been published (Tuomo et al., 2020).
Table 2
Meta-analysis of GDF15 GWAS conditioned on rs1058587 in FINRISK and INTERVAL.
| FINRISK | INTERVAL-SomaScan | INTERVAL-Olink | Meta-analysis | |||||||||
|---|---|---|---|---|---|---|---|---|---|---|---|---|
| SNPs | LD block | EA/OA | beta | p-value | beta | p-value | beta | p-value | beta | p-value | Heterogeneity I2 | Heterogeneity p-value |
| rs16982345 | 1 | A/G | –0.28 | 0.55 | 0.30 | 0.18 | 0.01 | 0.72 | 0.01 | 0.64 | 4.2 | 0.35 |
| rs1058587 | 1 | G/C | – | – | – | – | 0.01 | 0.77 | – | – | – | – |
| rs3787023 | 1 | A/G | 0.06 | 0.0011 | –0.011 | 0.72 | 0.04 | 0.072 | 0.04 | 0.0017 | 51.4 | 0.13 |
| rs1055150 | 1 | G/C | 0.06 | 0.0012 | –0.017 | 0.56 | 0.04 | 0.080 | 0.04 | 0.0025 | 58.5 | 0.090 |
| rs1059369 | 1 | A/T | 0.06 | 0.0010 | –0.018 | 0.54 | 0.04 | 0.078 | 0.04 | 0.0024 | 60.2 | 0.081 |
| rs1054221 | 2 | C/T | 0.38 | 3.4×10–37 | 0.62 | 7.8×10–83 | 0.52 | 9.4×10–74 | 0.50 | 2.4×10–186 | 93.4 | 2.9×10⁻⁷ |
| rs1227734 | 2 | T/C | 0.38 | 3.9×10–37 | 0.62 | 1.8×10–83 | 0.51 | 7.1×10–74 | 0.50 | 2.5×10–187 | 93.1 | 5.4×10⁻⁷ |
| rs189593084 | 3 | A/C | –0.33 | 8.4×10⁻¹⁴ | –0.61 | 0.011 | –0.47 | 0.0053 | –0.35 | 1.3×10⁻¹⁶ | 0.0 | 0.40 |
-
For comparison identical variants to those listed in Supplementary file 3d are shown here (these variants were identified by fine mapping unconditioned GWAS results from FINRISK and INTERVAL). LD blocks were defined as SNPs that had LD > 0.1 with the lead variant (most significantly associated variant). Abbreviations: GDF15, growth differentiation factor-15; GWAS, genome-wide association study.
Table 3
Mendelian randomisation results for genetically determined GDF15 plasma levels as the exposure with cardiometabolic outcomes.
| IVW (random) | MR-Egger | MR-PRESSO | ||||||||||
|---|---|---|---|---|---|---|---|---|---|---|---|---|
| SNPs | Estimate (SE) | pFDR (raw p-value) | Estimate (SE) | p-value | Intercept p-value | Estimate (SE) | pFDR (raw p-value) | Outlier estimate | Outlier p-value | Global p-value | Distortion p-value | |
| BMI | 5 | –0.0025 (0.012) | 0.90 (0.84) | –0.14 (0.023) | 0.53 | 0.53 | –0.0025 (0.012) | 0.89 (0.85) | – | – | 0.31 | – |
| WHR | 5 | 0.017 (0.0053) | 0.0013 (0.0039) | 0.0058 (0.0093) | 0.53 | 0.14 | 0.017 (0.0049) | 0.078 (0.026) | – | – | 0.50 | – |
| Diabetes | 5 | 0.014 (0.018) | 0.43 (0.86) | –0.20 (0.031) | 0.53 | 0.19 | 0.014 (0.018) | 0.89 (0.48) | – | – | 0.58 | – |
| Glucose | 5 | –0.00096 (0.0080) | 0.90 (0.90) | –0.0067 (0.014) | 0.63 | 0.62 | –0.00096 (0.0068) | 0.89 (0.89) | – | – | 0.83 | – |
| HDL | 5 | –0.0085 (0.0023) | 0.0024 (0.0014) | –0.0069 (0.0041) | 0.092 | 0.62 | –0.0085 (0.0013) | 0.019 (0.0031) | – | – | 0.79 | – |
| eBMD | 5 | 0.0047 (0.012) | 0.69 (0.90) | –0.0072 (0.022) | 0.75 | 0.51 | 0.0047 (0.012) | 0.89 (0.71) | – | – | 0.28 | – |
-
A significant finding of pleiotropy is indicated by the intercept p-value in MR-Egger and the Global p-value in MR-PRESSO. For MR-PRESSO the outlier test is only run if an outlier is detected. The distortion p-value represents whether the outlier removal significantly reduces the horizontal pleiotropy. Significant findings p-value < 0.05 are marked in bold text. Abbreviations: GDF15, growth differentiation factor-15; IVW, inverse variance weighted; BMI, body mass index; WHR, waist-hip ratio; HDL, high-density lipoprotein; eBMD, estimated bone mineral density.
Table 4
Reverse Mendelian randomisation with GDF15 plasma levels as outcome.
| IVW (random) | MR-Egger | MR-PRESSO | ||||||||||
|---|---|---|---|---|---|---|---|---|---|---|---|---|
| SNPs | Estimate (SE) | pFDR (raw p-value) | Estimate (SE) | p-value | Intercept p-value | Raw estimate (SE) | pFDR (raw p-value) | Outlier estimate | Outlier p-value | Global p-value | Distortion p-value | |
| BMI | 1011 | 0.097 (0.028) | 0.0040 (0.00066) | 0.14 (0.082) | 0.087 | 0.58 | 0.097 (0.028) | 0.0041 (0.00069) | – | – | 0.11 | – |
| WHR | 588 | 0.040 (0.039) | 0.45 (0.30) | –0.089 (0.11) | 0.41 | 0.21 | –0.040 (0.039) | 0.45 (0.30) | – | – | 0.00125 | – |
| Diabetes | 278 | 0.00082 (0.015) | 0.96 (0.96) | –0.055 (0.031) | 0.071 | 0.038 | –0.00082 (0.015) | 0.95 (0.95) | – | – | 0.00088 | – |
| Glucose | 77 | –0.065 (0.056) | 0.45 (0.25) | –0.24 (0.13) | 0.065 | 0.14 | 0.065 (0.056) | 0.45 (0.26) | – | – | 0.18 | – |
| HDL | 483 | –0.044 (0.061) | 0.56 (0.47) | –0.057 (0.096) | 0.56 | 0.87 | 0.044 (0.061) | 0.55 (0.46) | 0.054 (0.060) | 0.37 | 0.0147 | 0.89 |
| eBMD | 1113 | 0.030 (0.019) | 0.36 (0.12) | 0.032 (0.036) | 0.37 | 0.94 | –0.030 (0.019) | 0.36 (0.12) | –0.027 (0.018) | 0.14 | <0.000125 | – |
-
A significant finding of pleiotropy is indicated by the intercept p-value in MR-Egger and the Global p-value in MR-PRESSO. For MR-PRESSO the outlier test is only run if an outlier is detected. The distortion p-value represents whether the outlier removal significantly reduces the horizontal pleiotropy. Significant findings p-value < 0.05 are marked in bold text. Abbreviations: GDF15, growth differentiation factor-15; IVW, inverse variance weighted; BMI, body mass index; WHR, waist-hip ratio; HDL, high-density lipoprotein; eBMD, estimated bone mineral density.
Additional files
-
Supplementary file 1
Characteristics of the FINRISK cohort.
(a) FINRISK cohort characteristics. (b) Baseline characteristics in FINRISK associated with growth differentiation factor-15 (GDF15) plasma levels.
- https://cdn.elifesciences.org/articles/76272/elife-76272-supp1-v2.docx
-
Supplementary file 2
GDF15 plasma level associations and prognostic assessment.
(a) Growth differentiation factor-15 (GDF15) level disease associations corrected for age and sex only. Abbreviations: SAH, aneurysmal subarachnoid haemorrhage; ANGIO, coronary angioplasty; CABG, coronary artery bypass grafting; DVT, deep vein thrombosis. (b) GDF15 level quantitative biomarker associations corrected for age and sex only. All quantitative biomarkers were rank-based inverse transformed. (c) GDF15 level disease associations corrected for age, sex, smoking, and BMI. Abbreviations: SAH, aneurysmal subarachnoid haemorrhage; ANGIO, coronary angioplasty; CABG, coronary artery bypass grafting; DVT, deep vein thrombosis. (d) GDF15 level associations with prevalent and incident disease. Abbreviations: CNTRL, control. (e) Independent predictors of all-cause mortality, type 2 diabetes and cardiovascular disease (CHD or STR) event. Cox proportional hazard model was used to estimate the associations between risk factors and outcomes. (f) GDF15 level biomarker associations corrected for age, sex, smoking, and BMI. All quantitative biomarkers were rank-based inverse transformed. (g) GDF15 level disease associations corrected for rs1058587 as well as age, sex, smoking, and BMI. Abbreviations: SAH, aneurysmal subarachnoid haemorrhage; ANGIO, coronary angioplasty; CABG, coronary artery bypass grafting; DVT, deep vein thrombosis. (h) GDF15 level biomarker associations corrected for rs1058587 as well as age, sex, smoking, and BMI. All quantitative biomarkers were rank-based inverse transformed.
- https://cdn.elifesciences.org/articles/76272/elife-76272-supp2-v2.xlsx
-
Supplementary file 3
Genome-wide association and meta-analysis of the FINRISK and INTERVAL studies.
(a) Significant (p-value < 5 × 10⁻⁸) variants from genome-wide association study for FINRISK. (b) Significant (p-value < 5 × 10⁻⁸) variants from genome-wide association study for INTERVAL-SomaScan. (c) Significant (p-value < 5 × 10⁻⁸) variants from genome-wide association study for INTERVAL-Olink. (d) Meta-analysis of fine mapped GDF15 genome-wide association study variants in FINRISK and INTERVAL. Variants listed in table were identified by fine mapping genome-wide association study (GWAS) results from FINRISK and INTERVAL. LD blocks were defined as SNPs that had LD > 0.1 with the lead variant (most significantly associated variant). (e) Linkage disequilibrium (R2) between fine mapped variants in FINRISK, INTERVAL-SomaScan, and INTERVAL-Olink. (f) Significant (p-value < 5 × 10⁻⁸) variants from genome-wide association study for FINRISK conditioned on rs1058587. (g) Significant (p-value < 5 × 10⁻⁸) variants from genome-wide association study for INTERVAL-SomaScan conditioned on rs1058587. (h) Significant (p-value < 5 × 10⁻⁸) variants from meta-analysis of genome-wide association study for FINRISK, INTERVAL-SomaScan, and INTERVAL-Olink. (i) Functional annotation of GDF15 meta-analysis fine mapped variants. Canonical transcripts only are shown. Results were obtained from Ensembl variant effect predictor. Frequencies were obtained from 1000 genomes.
- https://cdn.elifesciences.org/articles/76272/elife-76272-supp3-v2.xlsx
-
Supplementary file 4
Results from Mendelian randomisation assessment.
(a) Estimates and F-statistics for instrumental variables used in Mendelian randomisation (MR) assessment with growth differentiation factor-15 (GDF15) as the exposure (forward MR). (b) Weighted median Mendelian randomisation results for forward MR of GDF15 with cardiometabolic traits. (c) Estimates and F-statistics for instrumental variables used in Mendelian randomisation of body mass index (BMI) with GDF15 as the outcome (reverse MR). (d) Estimates and F-statistics for instrumental variables used in Mendelian randomisation of waist-hip ratio (WHR) with GDF15 as the outcome (reverse MR). (e) Estimates and F-statistics for instrumental variables used in Mendelian randomisation of diabetes with GDF15 as the outcome (reverse MR). (f) Estimates and F-statistics for instrumental variables used in Mendelian randomisation of glucose with GDF15 as the outcome (reverse MR). (g) Estimates and F-statistics for instrumental variables used in Mendelian randomisation of high-density lipoprotein (HDL) with GDF15 as the outcome (reverse MR). (h) Estimates and F-statistics for instrumental variables used in Mendelian randomisation of estimated bone mineral density (eBMD) with GDF15 as the outcome (reverse MR). (i) Weighted median Mendelian randomisation results for reverse MR of GDF15 with cardiometabolic traits. (j) GDF15 protein-truncating variant carrier frequency in UKB.
- https://cdn.elifesciences.org/articles/76272/elife-76272-supp4-v2.xlsx
-
Transparent reporting form
- https://cdn.elifesciences.org/articles/76272/elife-76272-transrepform1-v2.docx
Download links
A two-part list of links to download the article, or parts of the article, in various formats.
Downloads (link to download the article as PDF)
Open citations (links to open the citations from this article in various online reference manager services)
Cite this article (links to download the citations from this article in formats compatible with various reference manager tools)
Integrated analyses of growth differentiation factor-15 concentration and cardiometabolic diseases in humans
eLife 11:e76272.
https://doi.org/10.7554/eLife.76272


