Tracking receptor motions at the plasma membrane reveals distinct effects of ligands on CCR5 dynamics depending on its dimerization status
- Institut Pasteur, Université Paris Cité, CNRS UMR3569, Virus and Immunity Unit, France
- Institut Pasteur, Université Paris Cité, CNRS UMR3691, BioImage Analysis Unit, France
- Infinity, Université de Toulouse, CNRS, INSERM, France
- Institut Pasteur, Université Paris Cité, Dynamics of Host-Pathogen Interactions Unit, France
- Institut Pasteur, Université Paris Cité, INSERM U1108, Viral Pathogenesis Unit, France
- Institut Pasteur, Université Paris Cité, Group Intracellular Trafficking and Tissue Homeostasis, France
Figures
Figure 1 with 1 supplement
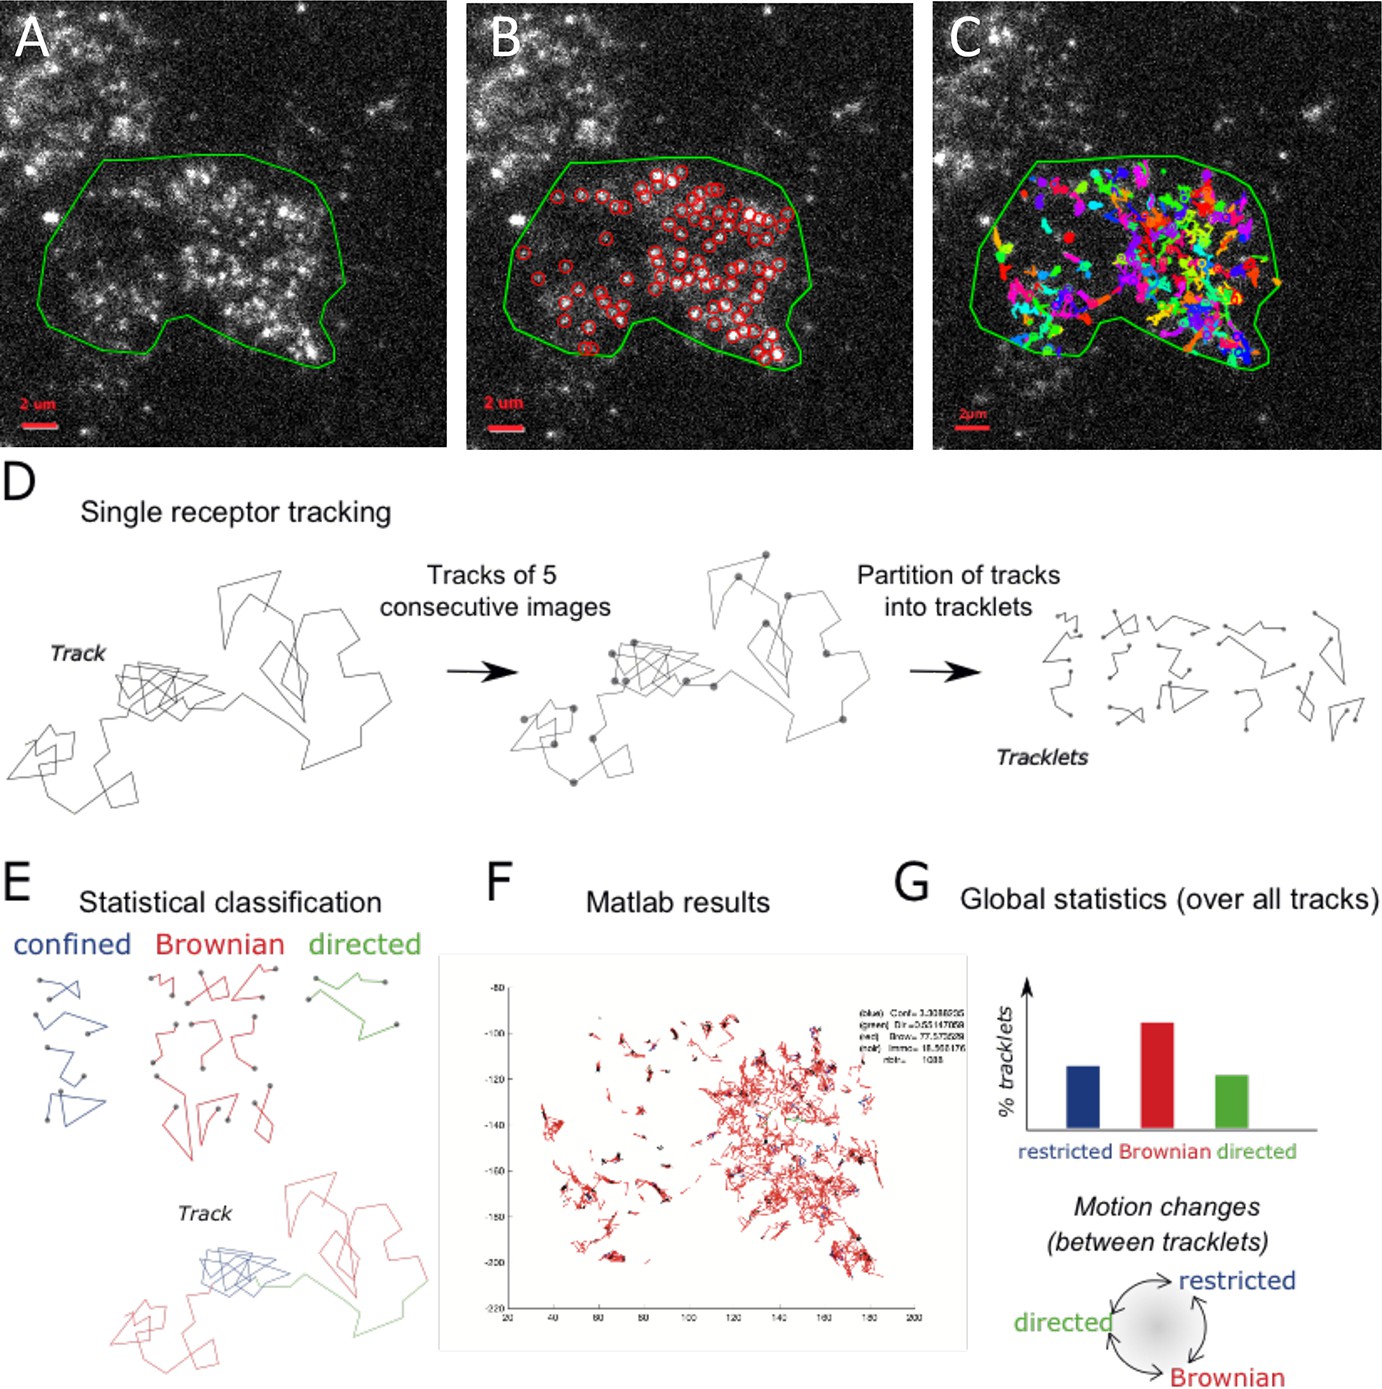
Single particle detection of eGFP-CCR5 using TIRF microscopy and analysis with the statistical method.
(A) Distribution of eGFP-CCR5 stably expressed in HEK 293 cells. Imaging was acquired at 30 Hz. The region of interest defined by the green line is used for A-C and F. Analysis of movies was performed using the ICY software and (B) the Spot detection and (C) the Spot tracking plugins. Scale bar 2 μm. (D) Single receptor tracks were partitioned into tracklets of five images each. (E) Analysis of tracks with the statistical method: tracklets were classified into confined, Brownian, and directed motion. (F) Results obtained from Matlab. (G) Pooled tracklets classification provided a global estimate of receptor dynamics and the number of motion changes along the track (transition rates). (Restricted motions: immobile and confined motions).
-
Figure 1—source code 1
Matlab code used for simulations.
- https://cdn.elifesciences.org/articles/76281/elife-76281-fig1-code1-v2.zip
Figure 1—figure supplement 1
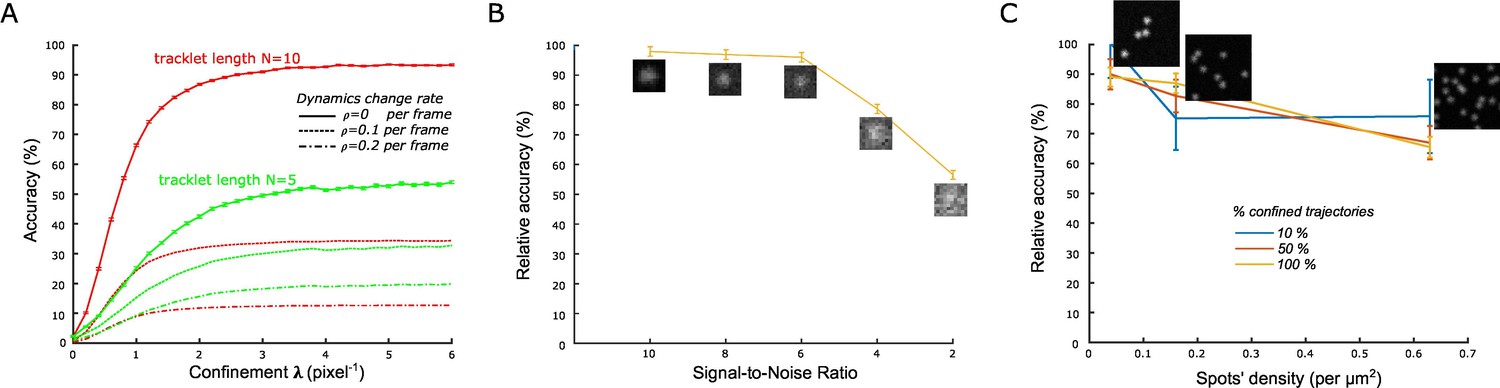
Validation of the statistical classification method using simulated trajectories and synthetic time-lapse sequences.
(A) Accuracy of confined tracklets’ classification for an increasing confinement parameter λ (Materials and methods), for N=10 frames (red) and N=5 frames (green). Accuracies corrected for the probability of mistracking/change in particle dynamics are plotted with dashed ( per frame) and dashed-and-dotted ( per frame) lines. simulations with 100 moving particles were generated for each condition . Length of simulated tracklets was equal to N+1. (B) Relative accuracy of statistical classification for decreasing signal-to-noise ratio (SNR) in synthetic time-lapse sequences (Materials and methods). The accuracy is computed relatively to the accuracy obtained with simulated trajectories (positions) without the additional steps of generating synthetic sequences (with noise), detecting and tracking spots. For each SNR, we run simulations with 1000 moving spots in a 1600 × 1600 pixels sequence. (C) Relative accuracy of statistical classification for increasing spots’ density. The proportion of confined trajectories was set to 10% (90% Brownian, blue), 50% (50% Brownian, red), and 100% (0% Brownian, green). Confinement parameter was fixed to . For each condition (density and proportion of confined trajectories), we run simulations with 1000 moving spots in a 1600 × 1600 pixels (density = 0.039 spots/μm2), 800 × 800 pixels (density = 0.16 spots/μm2), and 400 × 400 pixels (density = 0.63 spots/μm2).
-
Figure 1—figure supplement 1—source data 1
Source data for Figure 1—figure supplement 1.
- https://cdn.elifesciences.org/articles/76281/elife-76281-fig1-figsupp1-data1-v2.xlsx
Figure 2 with 1 supplement

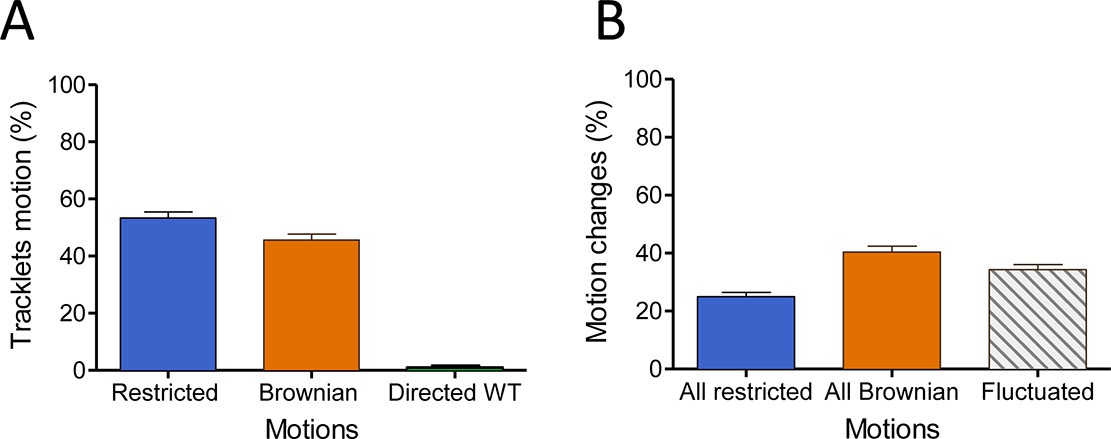
In the basal state, eGFP-CCR5 exhibits different motions at the plasma membrane.
(A) Distribution of tracklets motion: restricted, Brownian, or directed (mean ± SEM, n=28,305 tracks from 19 cells, 3 independent experiments). (B) Distribution of tracklets motion changes along tracks (mean ± SEM, n=48,237 tracks from 45 cells, 7 experiments).
-
Figure 2—source data 1
Source data for Figure 2.
- https://cdn.elifesciences.org/articles/76281/elife-76281-fig2-data1-v2.xlsx
Figure 2—figure supplement 1
In the basal state, FLAG-ST-CCR5 exhibits different motions at the plasma membrane.
(A) Distribution of tracklets motion: restricted, Brownian, or directed (mean +/-SEM, n=14 851 tracks from 24 cells). (B) Distribution of tracklets motion changes along tracks (mean +/-SEM, n=14 851 tracks from 24 cells).
-
Figure 2—figure supplement 1—source data 1
Source data for Figure 2—figure supplement 1.
- https://cdn.elifesciences.org/articles/76281/elife-76281-fig2-figsupp1-data1-v2.xlsx
Figure 3 with 2 supplements
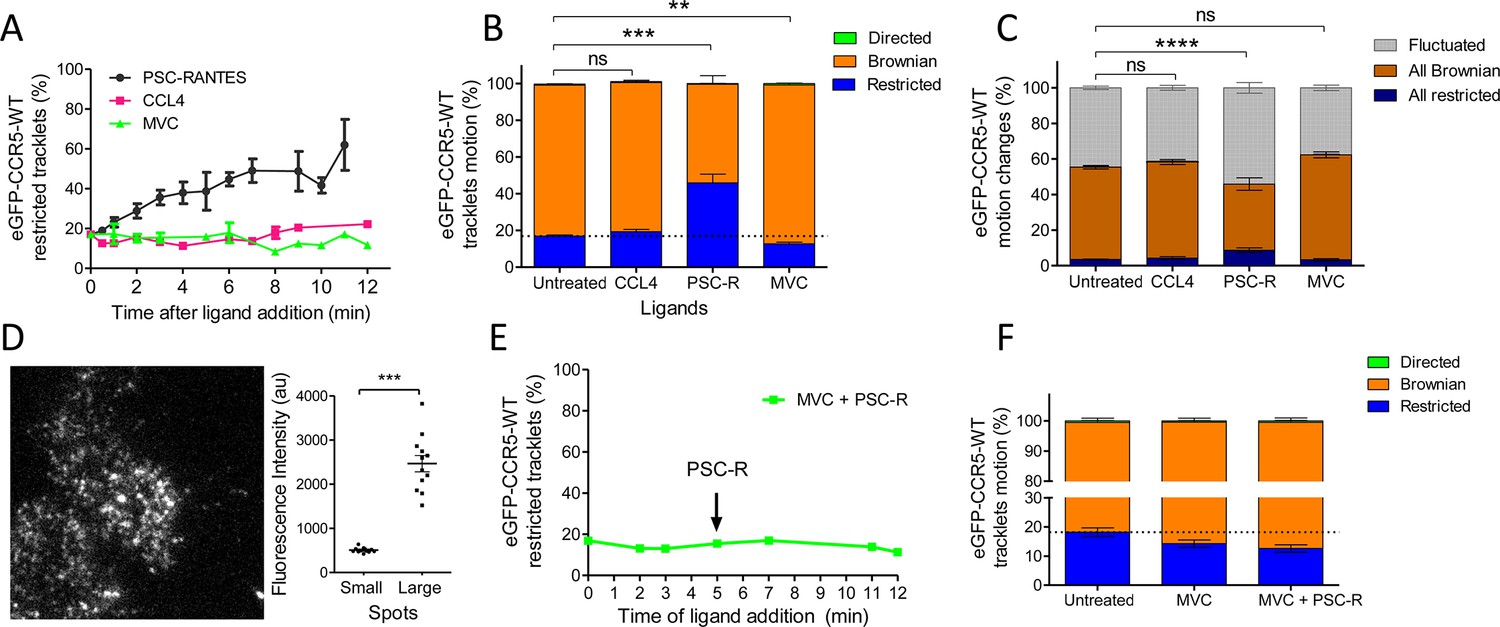
Different ligands, agonists and inverse agonist, impact eGFP-CCR5 mobility differently.
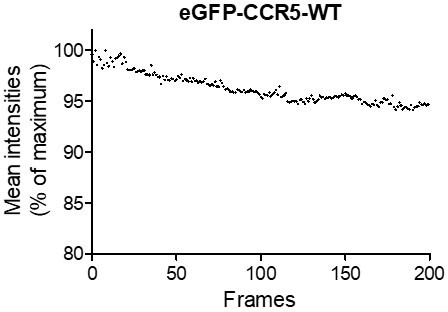
eGFP-CCR5-WT expressing cells were treated or not with a saturating concentration of agonists (CCL4, 200 nM or PSC-RANTES, 20 nM) or inverse agonist (maraviroc, 10 μM) and single particle tracking analysis was performed. (A) Percentage of restricted tracklets after treatment over time (n=tracks from 10, 4, and 3 cells for PSC-RANTES, CCL4, and MVC conditions respectively, at least three independent experiments). (B) Distribution of tracklets motion after 10 min of treatment (mean ± SEM, n=40,564, 15,421, 11,213, 9828 tracks for each condition from 35, 12, 12, and 9 cells, respectively, at least three independent experiments). Unpaired t test on restricted motions only: ns, nonsignificant; **p≤0.01; ***p≤0.001. (C) Distribution of tracklets motion changes along tracks after 10 min of treatment (mean ± SEM, n=48,237, 8954, 16,668, 9828 tracks from 45, 9, 17, and 9 cells for each condition respectively, at least three experiments). Unpaired t test on all restricted motions only: ns, nonsignificant; ****p≤0.0001. (D) (Left) Single particle detection of eGFP-CCR5-WT after 3 min of stimulation with PSC-RANTES (20 nM) from frame 1 of live-imaging movie (one representative image). (Right) Mean of the sum of fluorescence intensity under large immobile spots and small mobile spots after 3–10 min of stimulation (mean ± SEM, n=at least 40 spots from 12 cells, three experiments). (E) Percentage of restricted tracklets after successive stimulation with maraviroc (10 μM, 5 min) and PSC-RANTES (20 nM, 5–12 min; one representative experiment). (F) Distribution of tracklets motions after successive stimulation with maraviroc (10 μM, during 5 min) and PSC-RANTES (20 nM, during 6 min) (mean ± SEM, n=14,467, 3601, 2075 tracks from 14, 2, and 2 cells respectively, one experiment).
-
Figure 3—source data 1
Source data for Figure 3.
- https://cdn.elifesciences.org/articles/76281/elife-76281-fig3-data1-v2.xlsx
Figure 3—figure supplement 1
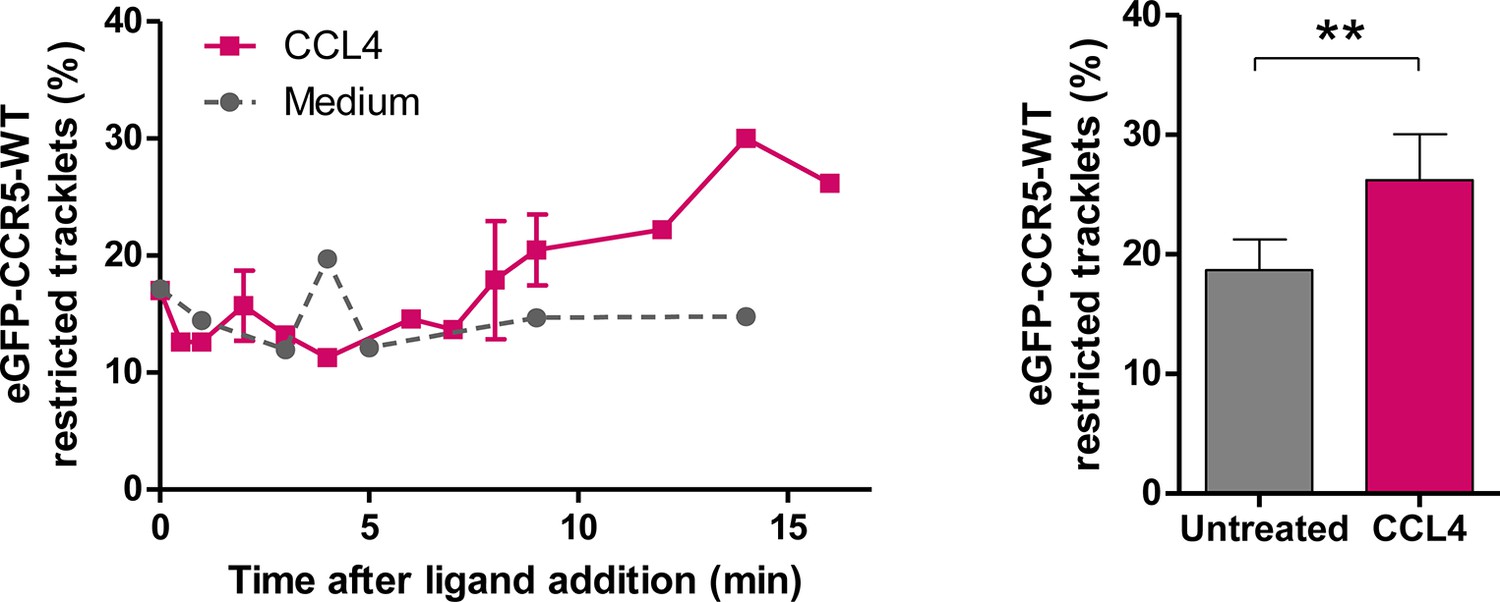
Effect of CCL4 on eGFP-CCR5 mobility.
eGFP-CCR5-WT expressing cells were treated or not with a saturating concentration of CCL4 (200 nM) and single particle tracking analysis was performed. Percentage of restricted tracklets after treatment over time (left) and after 12–16 min of treatment (right) (mean ± SD, n=9951 and 4320 tracks for untreated and CCL4 conditions, from six and three cells, respectively). Unpaired t test: p value 0.0088**.
-
Figure 3—figure supplement 1—source data 1
Source data for Figure 3—figure supplements 1 and 2.
- https://cdn.elifesciences.org/articles/76281/elife-76281-fig3-figsupp1-data1-v2.xlsx
Figure 3—figure supplement 2
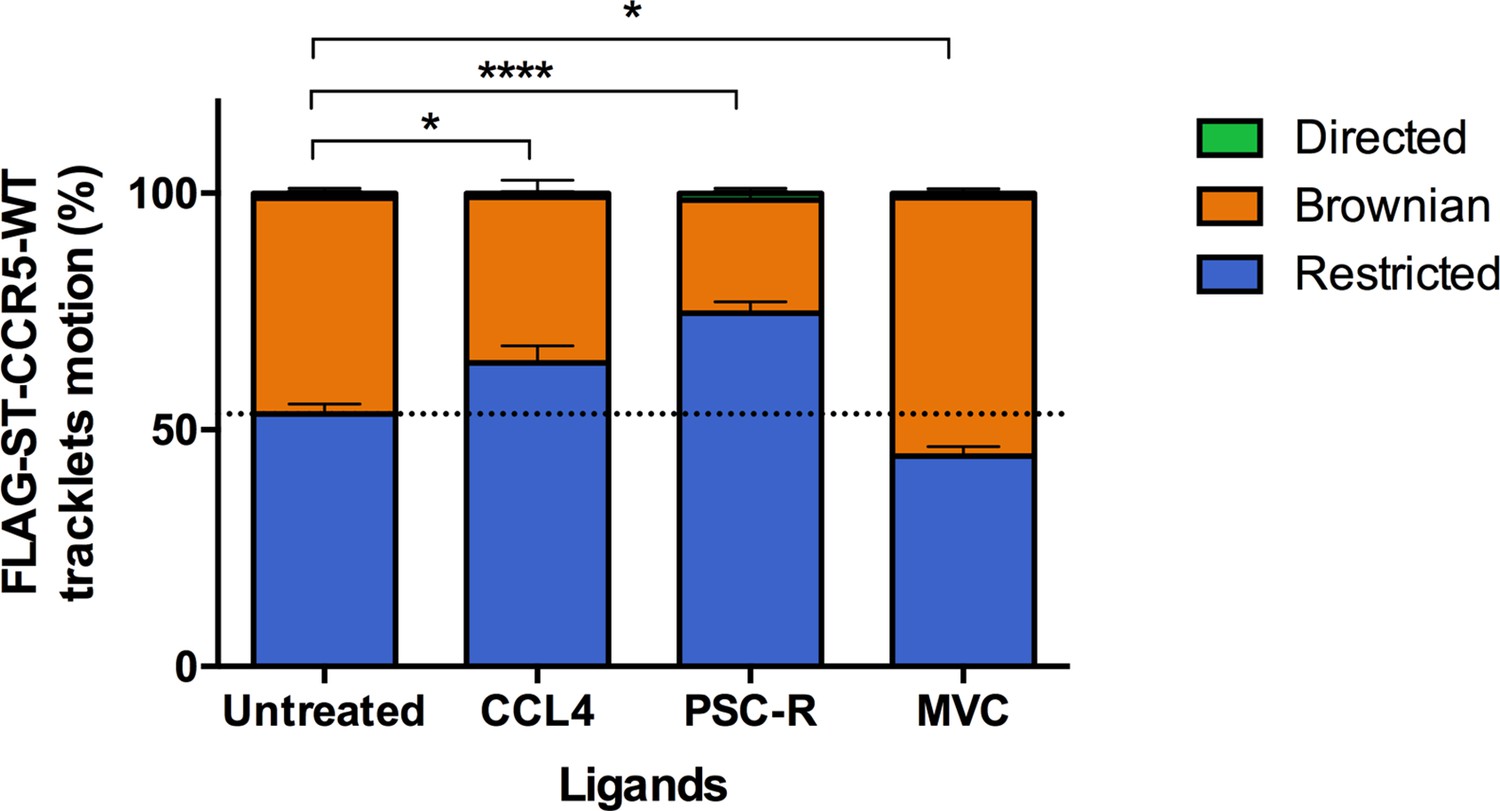
Different ligands, agonists and inverse agonist, impact FLAG-ST-CCR5 mobility differently.
FLAG-ST-CCR5-WT expressing cells were treated or not with a saturating concentration of agonists (CCL4, 100 nM or PSC-RANTES, 100 nM) or inverse agonist (maraviroc, 1 μM) and single particle tracking analysis was performed. Distribution of tracklets motion after 10 min of treatment (mean +/-SEM, n=13,916, 8848, 17,160, 15,478 tracks for each condition from 24, 12, 16, and 22 cells, respectively). Unpaired t test on restricted motions only: **p<0.01, ****p<0.0001.
Figure 4 with 1 supplement

Gi coupling and β-arrestins association restrict eGFP-CCR5 mobility at basal state or after PSC-RANTES stimulation.
(A) Percentage of restricted tracklets in eGFP-CCR5-WT expressing HEK 293 cells pre-treated or not with 100 ng/ml of PTX for 3 hr (mean ± SEM, n=8614 and 11 377 tracks for each condition, 12 and 15 cells respectively, 3 independent experiments). Unpaired t test: p value 0.0083**. (B) Percentage of restricted tracklets over time of eGFP-CCR5-WT expressed on PSC-RANTES (20 nM) treated cells after incubation or not with PTX (100 ng/ml) (mean ± SD, n=3 independent experiments). (C) Proportion of restricted tracklets in eGFP-CCR5-WT expressing cells transfected with siRNA βarr1/2 (mean ± SD, n=6754 and 8854 tracks for each condition, from 7 and 8 cells, respectively). Unpaired t test: p value 0.46, ns. (D) Percentage of restricted tracklets over time of eGFP-CCR5-WT expressed on PSC-RANTES (20 nM) treated cells after siRNA βarr 1/2 transfection (n=1 representative experiment).
-
Figure 4—source data 1
Source data for Figure 4.
- https://cdn.elifesciences.org/articles/76281/elife-76281-fig4-data1-v2.xlsx
Figure 4—figure supplement 1
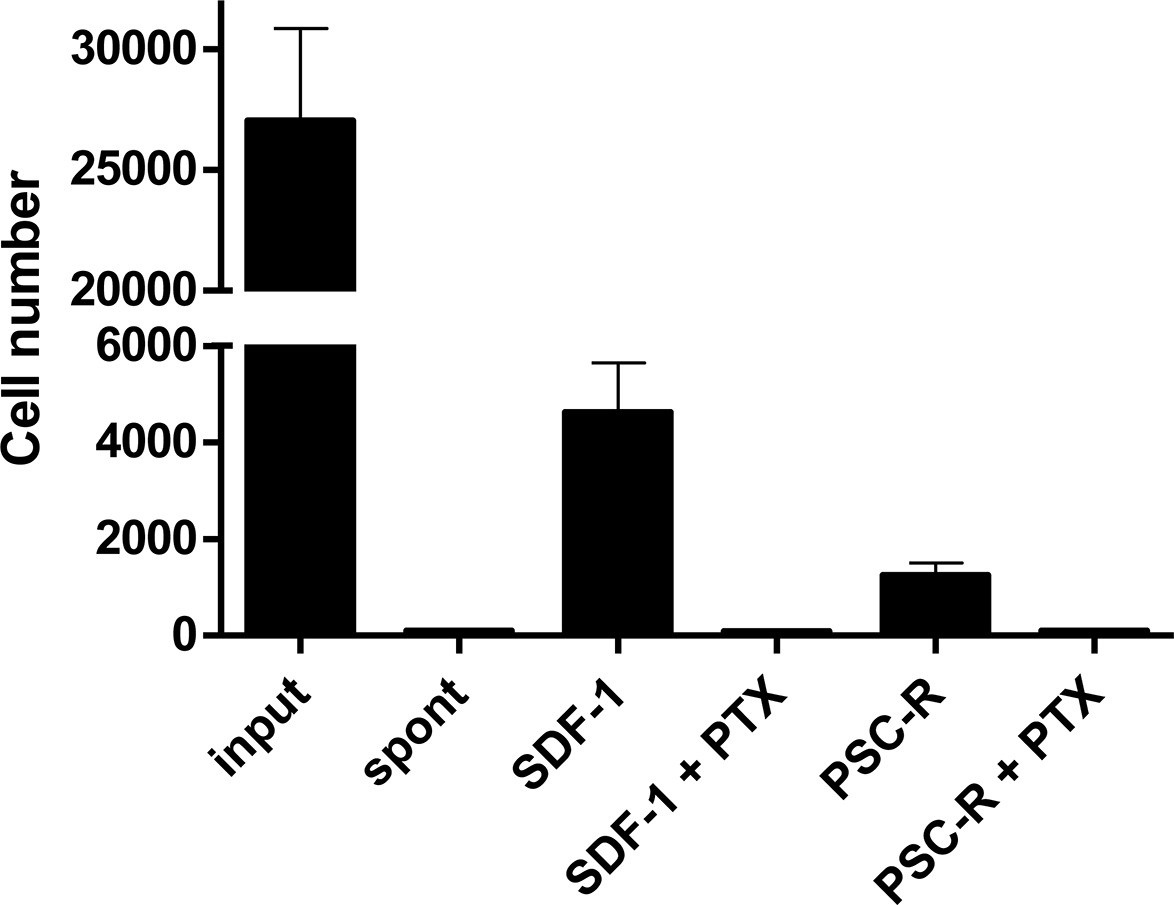
Effect of PTX treatment on chemokine-mediated chemotaxis.
A3.01-R5 cells treated with 100 ng/ml PTX for 3 hr were added to the upper chambers of HTS-transwell. Chemokines were to the lower chambers and chemotaxis were proceeded for 4 hr. The number of cells migrating across the membrane was assessed by flow cytometry. PTX-treatment impaired SDF-1 (10 nM) and PSC-RANTES (33.7 nM)-mediated chemotaxis of A3.01-R5 cells. One representative experiment of two independent experiments (mean ± SD of triplicates). Spont: Spontaneous migration (without chemokines in the lower chamber).
-
Figure 4—figure supplement 1—source data 1
Source data for Figure 4—figure supplement 1.
- https://cdn.elifesciences.org/articles/76281/elife-76281-fig4-figsupp1-data1-v2.xlsx
Figure 5 with 2 supplements
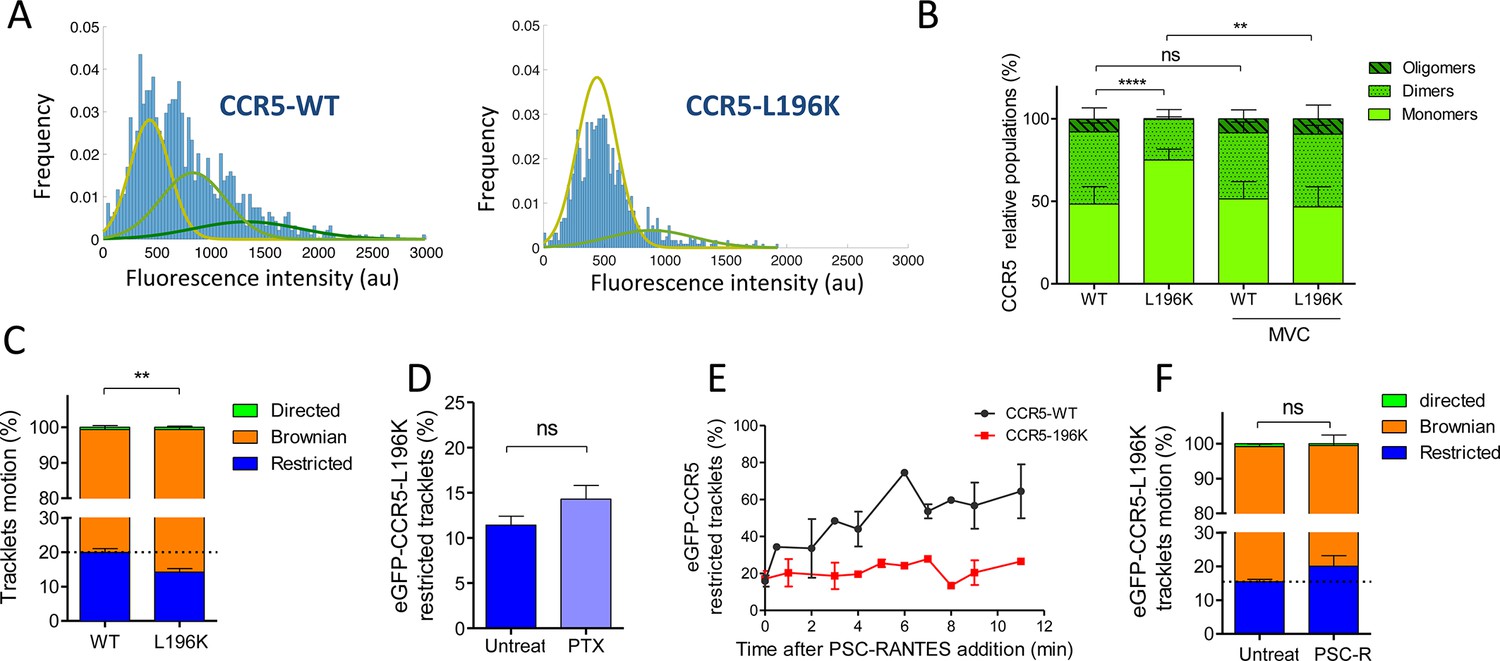
Dimerization through TM5 alters eGFP-CCR5 mobility.
(A) Distribution of the fluorescence intensity of spots detected at the surface of HEK 293 cells expressing eGFP-CCR5-WT or eGFP-CCR5-L196K. One representative experiment out of 6 (n=943 spots from 6 cells and 1207 spots from 8 cells for each condition); (B) Quantification of the fluorescent populations depending on the mean of the gaussian at the surface of cells treated or not with MVC (10 μM) (mean ± SD, nWT = 5171 spots from 47 cells, 11 experiments; nL196K=3144 spots from 30 cells, 7 experiments; nWT-MVC=3 055 spots from 25 cells, 4 experiments; nL196K-MVC=1 776 spots from 16 cells, 3 experiments). Unpaired t test on monomers: p value **p≤0.005; ****p≤0.0001; ns p≥0.05; (C) Distribution of pooled trackets motion of eGFP-CCR5-WT and eGFP-CCR5-L196K (mean ± SEM, n=11,321 tracks from 10 cells and 10,460 tracks from 12 cells in each condition; 2 independent experiments). Unpaired t test on the restricted tracklets: p value 0.0015**. (D) Percentage of restricted tracklets in eGFP-CCR5-L196K cells pre-treated or not with 100 ng/ml of PTX for 3 hr (mean ± SEM, n=5 cells). Unpaired t test: p value 0.15, ns. (E) Percentage of restricted tracklets over time of PSC-RANTES induced eGFP-CCR5-WT or eGFP-CCR5-L196K expressing cells (mean ± SD of 3 independent experiments). (F) Distribution of tracklets motion after 10 min of PSC-RANTES stimulation (20 nM) (mean ± SEM, n=11 218 tracks from 10 cells and 5 433 tracks from 4 cells for untreated and PSC-RANTES treated cells respectively, 2 independent experiments). Unpaired t test: p value 0.055, ns.
-
Figure 5—source data 1
Source data for Figure 5.
- https://cdn.elifesciences.org/articles/76281/elife-76281-fig5-data1-v2.xlsx
Figure 5—figure supplement 1
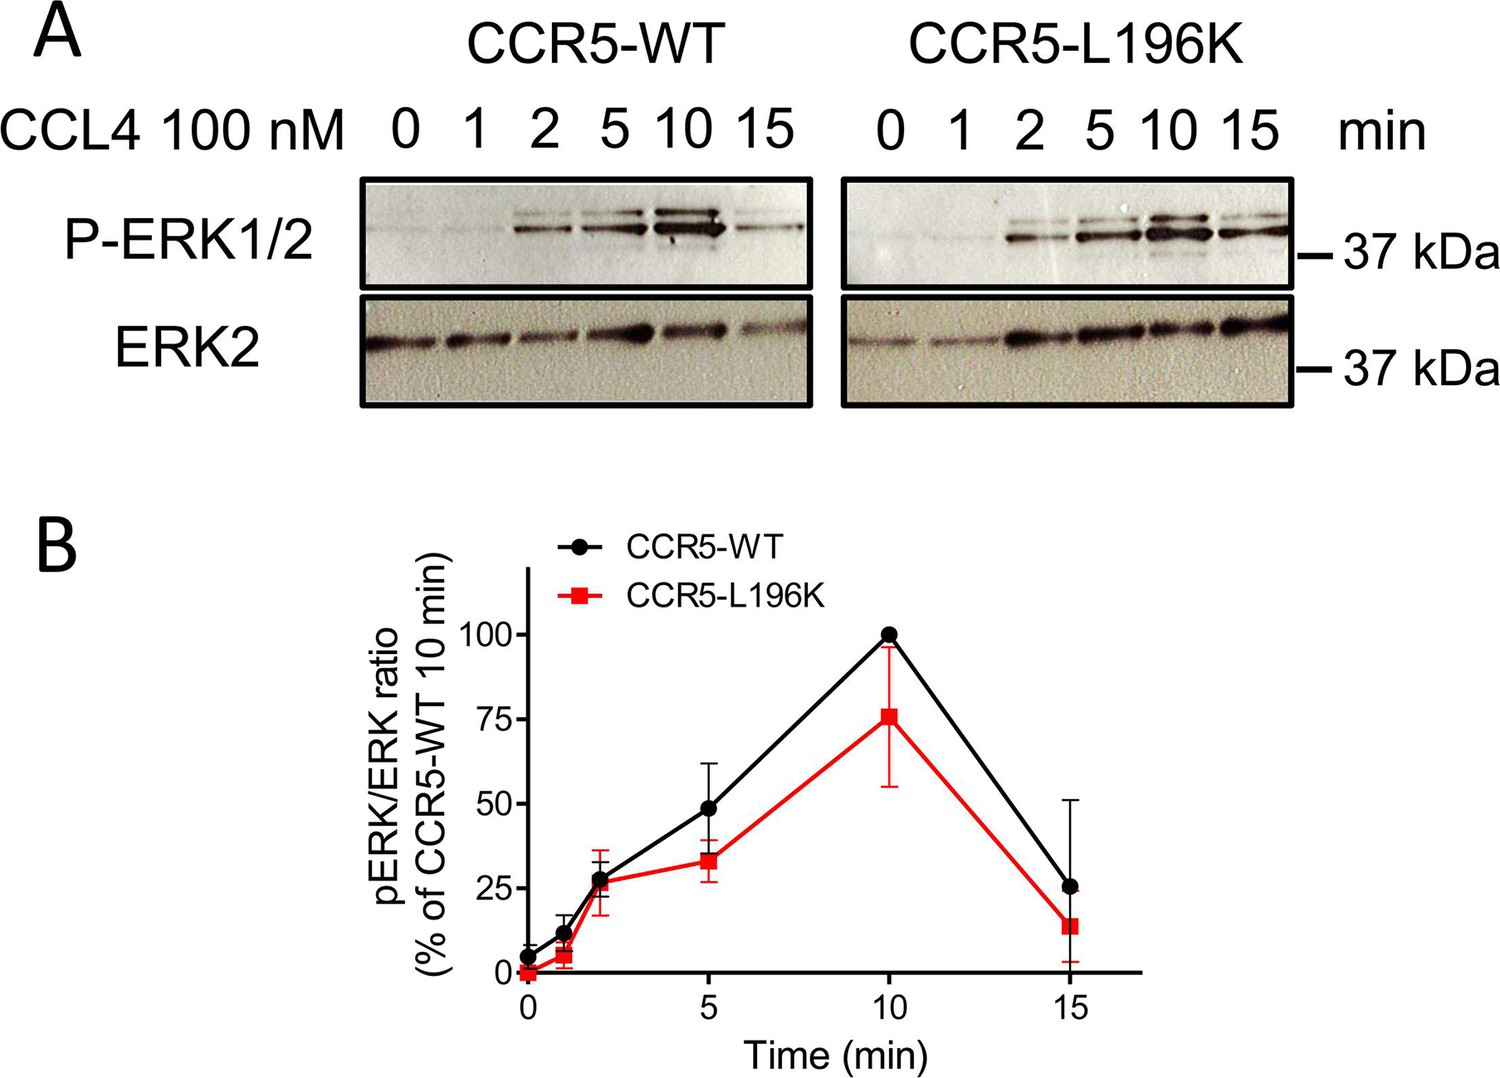
CCR5-WT and CCR5-L196K promote chemokine-induced ERK activation.
(A) (B) CCL4-induced (100 nM) ERK1/2 activation in HEK 293 cells stably expressing FLAG-ST-CCR5-WT or FLAG-ST-CCR5-L196K in the same proportion. (B) mean +/- SEM, n=2.
-
Figure 5—figure supplement 1—source data 1
Source data for Figure 5—figure supplements 1 and 2.
- https://cdn.elifesciences.org/articles/76281/elife-76281-fig5-figsupp1-data1-v2.xlsx
Figure 5—figure supplement 2
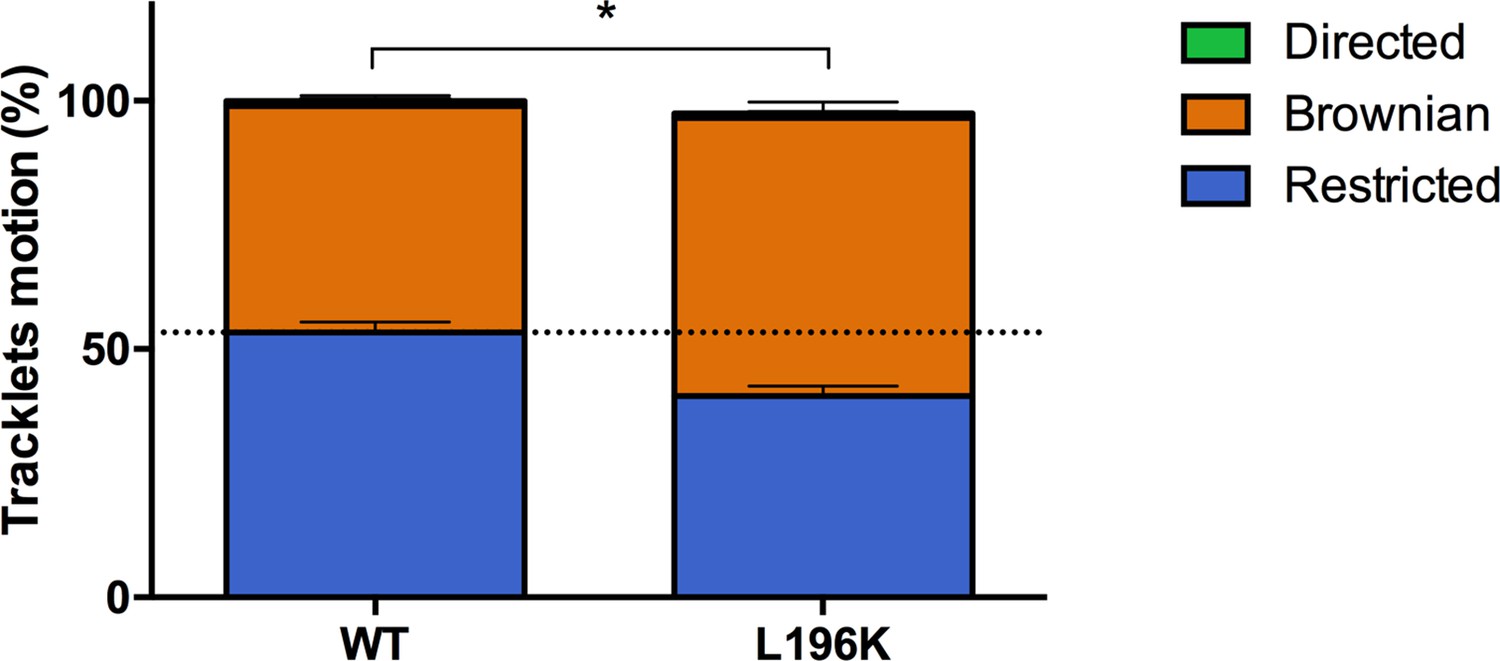
Dimerization through TM5 alters FLAG-ST-CCR5 mobility.
Distribution of pooled tracklets motion of FLAG-ST-CCR5-WT and FLAG-ST-CCR5-L196K (mean +/-SEM, n=13,916, 7367 tracks for each condition from 24 and 15 cells, respectively). Unpaired t test on restricted motions only: p value 0.0002.
Figure 6 with 1 supplement
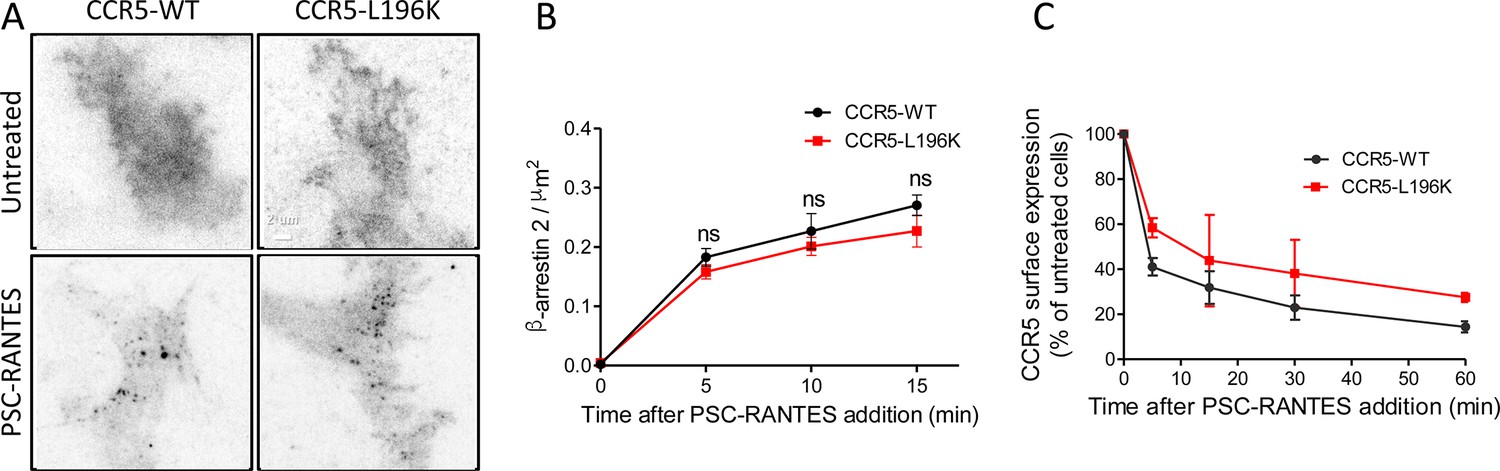
Dimerization through TM5 unaffects β-arrestin 2 recruitment to CCR5 but alters its trafficking.
(A, B) TIRF microscopy on FLAG-ST-CCR5-WT and FLAG-ST-CCR5-L196K cells expressing βarr2-GFP. Cells were stained with M2-Cy3 for FLAG detection and treated or not with 3 nM PSC-RANTES for the indicated times. (A) βarr2-GFP spots were detected on TIRF images from untreated cells or cells treated 10 min with PSC-RANTES. Scale bar 2 μm. (B) Quantification of the βarr2-GFP spots detected over time using ICY software and spot detector plugin (mean +/-SEM, n=at least 6 cells), Unpaired t test: p≥0.05, ns. (C) CCR5 internalization. Cell surface expression of FLAG-ST-CCR5-WT or FLAG-ST-CCR5-L196K was monitored by flow cytometry in stable HEK 293 cell clones after stimulation with a saturating concentration of PSC-RANTES (20 nM) for the indicated time. The percentage of total bound anti-FLAG antibody was calculated from the mean fluorescence intensity relative to untreated cells (mean ± SD from two independent experiments).
-
Figure 6—source data 1
Source data for Figure 6.
- https://cdn.elifesciences.org/articles/76281/elife-76281-fig6-data1-v2.xlsx
Figure 6—figure supplement 1
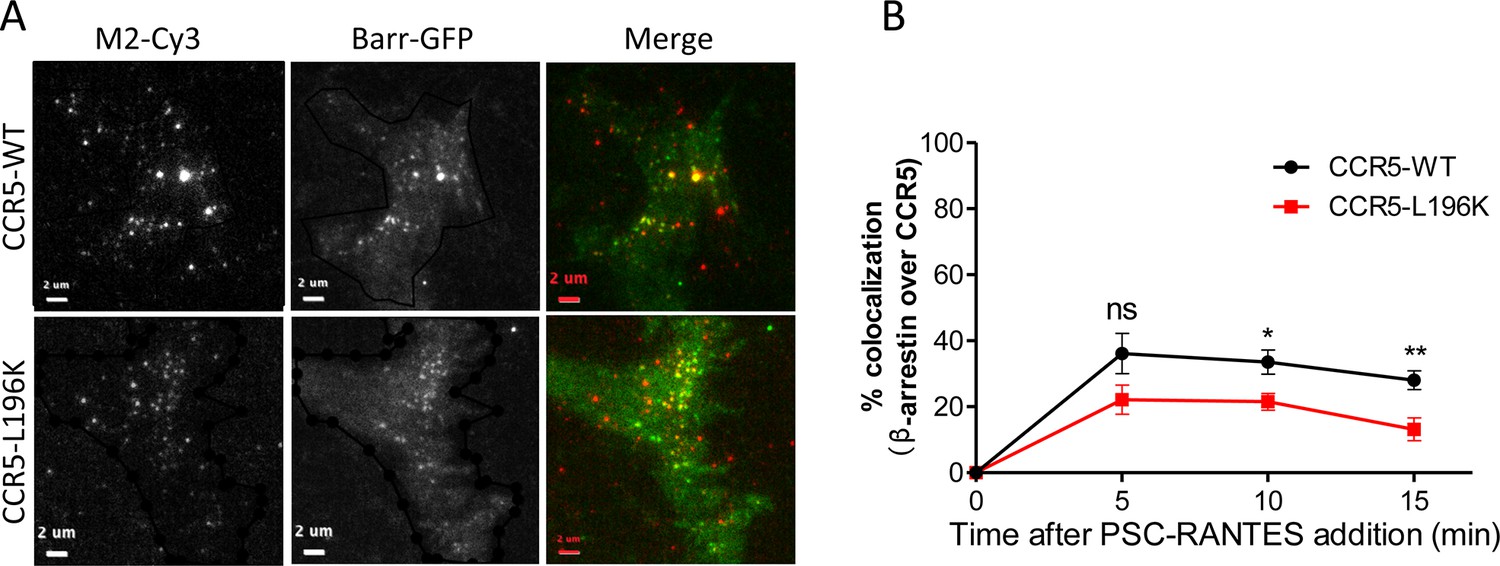
β−arrestin 2 recruitment to CCR5 upon PSC-RANTES stimulation.
TIRF microscopy on FLAG-ST-CCR5-WT and FLAG-ST-CCR5-L196K cells expressing βarr2-GFP. Cells were stained with M2-Cy3 for FLAG detection and treated or not with 3 nM PSC-RANTES for the indicated times. (A) TIRF images of cells treated 10 min with the agonist. Scale bar 2 μm. (B) Quantification of the percentage of colocalization between βarr2-GFP spots and CCR5 fluorescent spots was performed with SODA (Lagache et al., 2018) implemented in the plugin colocalization studio in ICY software(mean +/-SEM, n=at least 8 cells). Unpaired t test: p≥0.05, ns, *p≤0.05; **p≤0.01.
-
Figure 6—figure supplement 1—source data 1
Source data for Figure 6—figure supplement 1.
- https://cdn.elifesciences.org/articles/76281/elife-76281-fig6-figsupp1-data1-v2.xlsx
Figure 7 with 1 supplement
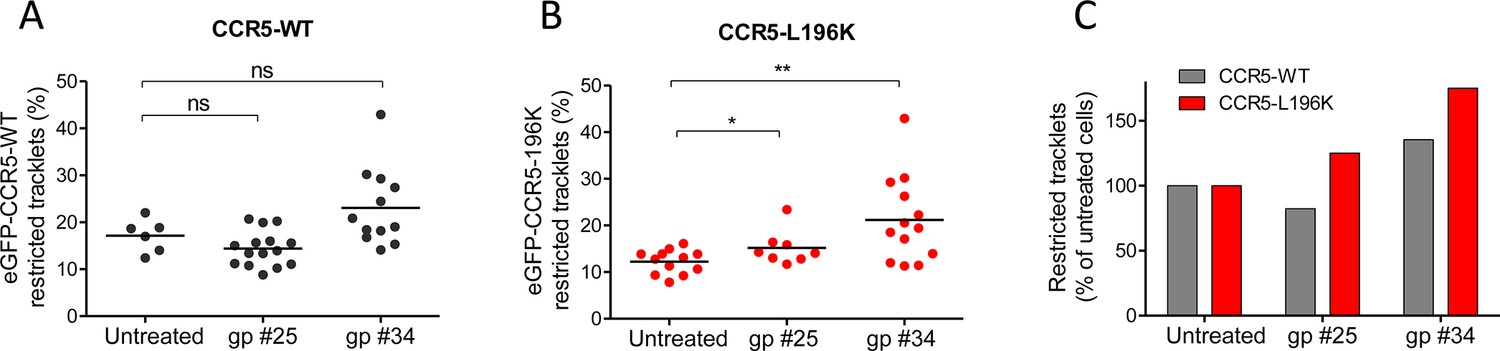
HIV-1 gp120s binding restricts eGFP-CCR5 mobility.
Soluble gp120s were incubated 30 min at RT in the presence of soluble CD4 (ratio sCD4/gp120>5) to allow their binding to CCR5. Then, gp120-sCD4 complexes were added to live eGFP-CCR5-WT or eGFP-CCR5-L196K expressing cells during at least 20 min before single particle analysis. The proportion of restricted tracklets after gp #25 and gp #34 treatment (100 nM) (in complex with sCD4) on eGFP-CCR5-WT (A, C) or eGFP-CCR5-L196K (B, C) expressing cells was represented (n=3 independent experiments). Unpaired t test: **p≤0.005; ***p≤0.0001; ns p≥0.05.
-
Figure 7—source data 1
Source data for Figure 7.
- https://cdn.elifesciences.org/articles/76281/elife-76281-fig7-data1-v2.xlsx
Figure 7—figure supplement 1
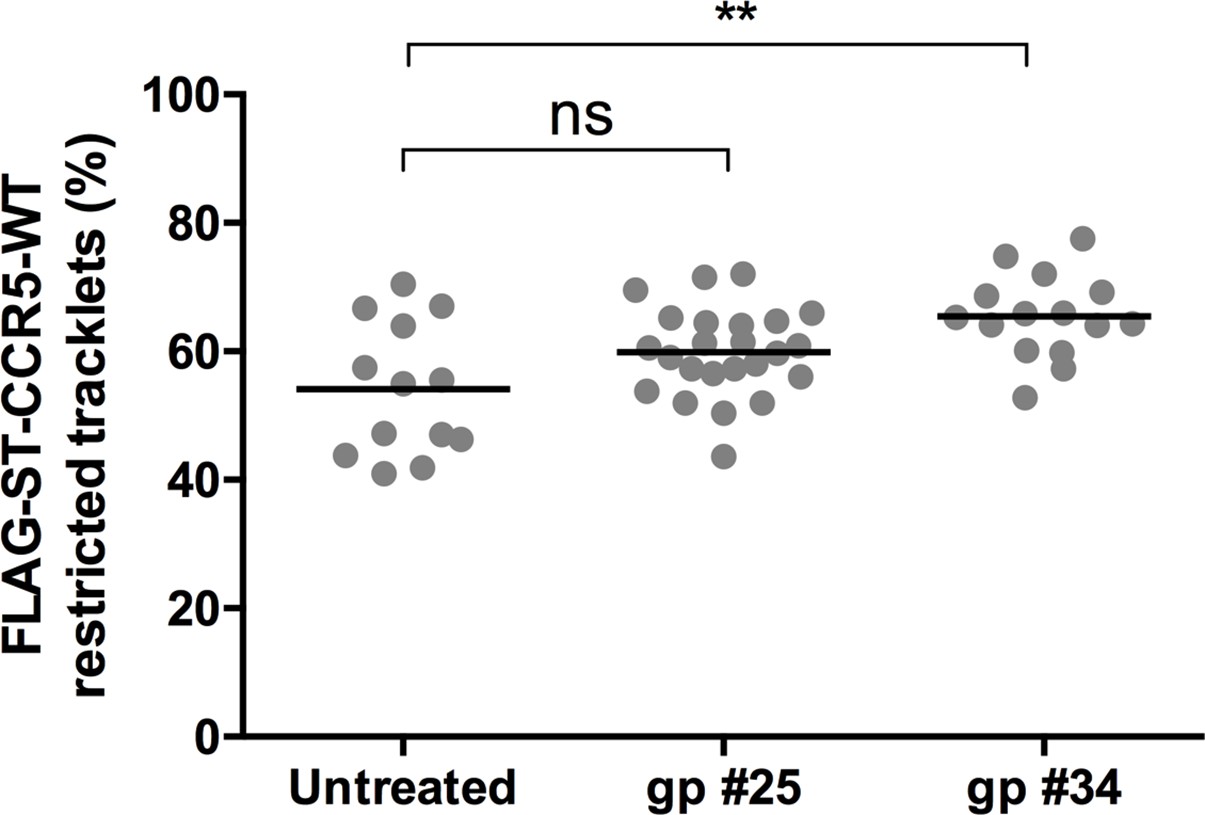
HIV-1 gp120s binding restricts FLAG-ST-CCR5 mobility.
Soluble gp120s were incubated 10 min at RT in the presence of soluble CD4 (ratio sCD4/gp120>5) to allow their binding to CCR5. Then, gp120-sCD4 complexes were added to live FLAG-ST-CCR5-WT expressing cells during at least 10 min before single particle analysis. The proportion of restricted tracklets after gp #25 and gp #34 treatment (100 nM) (in complex with sCD4) on FLAG-ST-CCR5-WT expressing cells was represented (mean +/-SEM, n=11131, 38,895, 24,442 tracks for each condition from 13, 23, and 15 cells, respectively). Unpaired t test: *p≤0.05; **p≤0.01.
-
Figure 7—figure supplement 1—source data 1
Source data for Figure 7—figure supplement 1.
- https://cdn.elifesciences.org/articles/76281/elife-76281-fig7-figsupp1-data1-v2.xlsx
Author response image 1
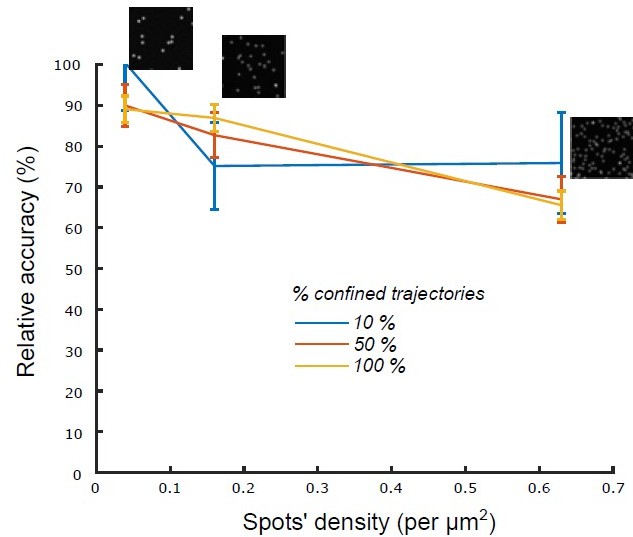
Relative accuracy of statistical classification for increasing spots’ density.
The proportion of confined trajectories was set to 10% (90% Brownian, blue), 50% (50% Brownian, red) and 100% (0% Brownian, green). Confinement parameter was fixed to λ = 2. For each condition (density and proportion of confined trajectories), we run n = 10 simulations with 1000 moving spots in a 1600x1600 pixels (density = 0.039 spots/μm2), 800 X 800 pixels (density = 0.16 spots/μm2) and 400 X 400 pixels (density = 0.63 spots/μm2).
Author response image 2
Videos
Video 1
TIRF movie of a cell stably expressing eGFP-CCR5-WT acquired at 30 Hz.
The region of interest was defined by the green line.
Video 2
TIRF movie of the same cell as in Video 1 analyzed using the Icy software.
Red circles correspond to the detection of bright spots using the Spot detection plugin.
Video 3
TIRF movie of the same cell as in Videos 1 and 2 analyzed using the Icy software and the Spot tracking plugin.
Colored lines correspond to the tracked spots.
Video 4
TIRF movie of a cell stably expressing FLAG-ST-CCR5-WT and stained with M2-Cy3.
Movie was acquired at 10 Hz.
Video 5
TIRF movie acquired at 30 Hz of a cell stably expressing eGFP-CCR5-WT and treated by CCL4 (100 nM) for 14 min.
Video 6
TIRF movie acquired at 30 Hz of cells stably expressing eGFP-CCR5-WT and treated by PSC-RANTES (20 nM) for 3 min.
Video 7
TIRF movie acquired at 30 Hz of a cell stably expressing eGFP-CCR5-L196K and treated by PSC-RANTES (20 nM) for 2 min.
Tables
Key resources table
| Reagent type (species) or resource | Designation | Source or reference | Identifiers | Additional information |
|---|---|---|---|---|
| Cell line (Homo sapiens) | HEK293 cells | ATCC | CRL-1573; RRID: CVCL_0045 | Human embryonic kidney (female) |
| Cell line (Homo sapiens) | A3.01-R5 | Colin et al., 2013 | CEM T cell line derivated cells | |
| Antibody | α-GFP (mouse monoclonal) | Roche | 11814460001 | Flow cytometry dilution (1: 100) |
| Antibody | α-CCR5 2D7 (mouse monoclonal) | BD-Biosciences | 555,991 | Flow cytometry dilution (1: 500) |
| Antibody | FLAG tag M2 (mouse monoclonal) | Sigma | Cat# F3165 | Flow cytometry dilution (1: 750) |
| Antibody | FLAG tag M2-Cy3 (mouse monoclonal) | Sigma | Cat# A9594 | TIRF microscopy dilution (1: 1000) |
| Antibody | Phospho ERK1/2 (mouse monoclonal) | Cell signaling | Cat# 9,106 | Western blot dilution (1:2500) |
| Antibody | ERK2 (Rabbit polyclonal) | Santa-Cruz Biotech | Cat# sc-154 | Western blot dilution (1:750) |
| Antibody | Goat anti-mouse HRP (rat monoclonal) | BD-Biosciences | Cat# 559,751 | Western blot dilution (1:120000) |
| Antibody | Goat anti-rabbit HRP (goat polyclonal) | Jackson | Cat# 111-035-144 | Western blot dilution (1:3500) |
| Antibody | Goat anti-mouse phycoerythrin (PE) (goat polyclonal) | BD-Biosciences | Cat# 550,589 | Flow cytometry dilution (1:100) |
| Recombinant DNA reagent | pmCherry- (plasmid) | other | Provided by F. Perez (Institut Curie). | |
| Recombinant DNA reagent | peGFP-CCR5 (plasmid) | other | Provided by F. Perez (Institut Curie). | |
| Recombinant DNA reagent | peGFP-CCR5-L196K (plasmid) | This paper | Contains a point mutation in CCR5 at position L196. | |
| Recombinant DNA reagent | pFLAG-SNAP-CCR5-WT (plasmid) | Jin et al., 2018 | Provided by Cisbio | |
| Recombinant DNA reagent | pFLAG-SNAP-CCR5-L196K (plasmid) | Jin et al., 2018 | Introduction of a lysine in position L196 | |
| Recombinant DNA reagent | pβarr2-GFP | Storez et al., 2005 | Provided by S. Marullo (Institut Cochin) | |
| SiRNA reagent | βarr1/2 (siRNA) | Dharmacon | See Materials and methods for sequence | |
| SiRNA reagent | Scrambled (siRNA) | Dharmacon | See Materials and methods for sequence | |
| Soluble protein | HIV-1 gp120 #25, #34 | Colin et al., 2018 | Gp120 from PBMCs of patients in early or late HIV-1 infection stage. See details in ‘cell culture and reagents’ section of 'Materials and methods' | |
| Soluble protein | Human sCD4 | Colin et al., 2018 | See details in ‘cell culture and reagents’ section of 'Materials and methods' | |
| Chemical compound, drug | Maraviroc | NIH | Cat# ARP-11580 | CCR5 inverse agonist |
| Chemical compound, chemokine | CCL4 | This paper | Provided by F. Baleux (Institut Pasteur) | |
| Chemical compound, drug | PSC-RANTES | NIBSC | Cat# ARP973 | CCR5 agonist |
| Chemical compound, chemokine | SDF-1 | Peprotec | Cat# 300–28 A | CXCR4 agonist |
| Chemical compound, drug | Pertussis Toxin | Sigma | Cat#179 A | 100 ng/ml |
| Software, algorithm | Prism | GraphPad | 8.1.1 | |
| Software, algorithm | ICY | Open access | Version 2.4.0.0 | https://icy.bioimageanalysis.org/ |
| Software, algorithm | MATLAB | MathWorks | R2017a |
Additional files
Download links
A two-part list of links to download the article, or parts of the article, in various formats.
Downloads (link to download the article as PDF)
Open citations (links to open the citations from this article in various online reference manager services)
Cite this article (links to download the citations from this article in formats compatible with various reference manager tools)
Tracking receptor motions at the plasma membrane reveals distinct effects of ligands on CCR5 dynamics depending on its dimerization status
eLife 11:e76281.
https://doi.org/10.7554/eLife.76281


