Ras/MAPK signalling intensity defines subclonal fitness in a mouse model of hepatocellular carcinoma
- Institut de Génétique Moléculaire de Montpellier, University of Montpellier, France
- Department of surgery and liver transplantation, Hopital Saint Eloi Hopitaux universitaires de Montpelier, France
- Division of Tumor Biology and Immunology, Netherlands Cancer Institute, Oncode Institute, Netherlands
- Centre de Recherche en Biologie Cellulaire de Montpellier (CRBM), University of Montpellier, CNRS, France
Figures
Figure 1 with 3 supplements
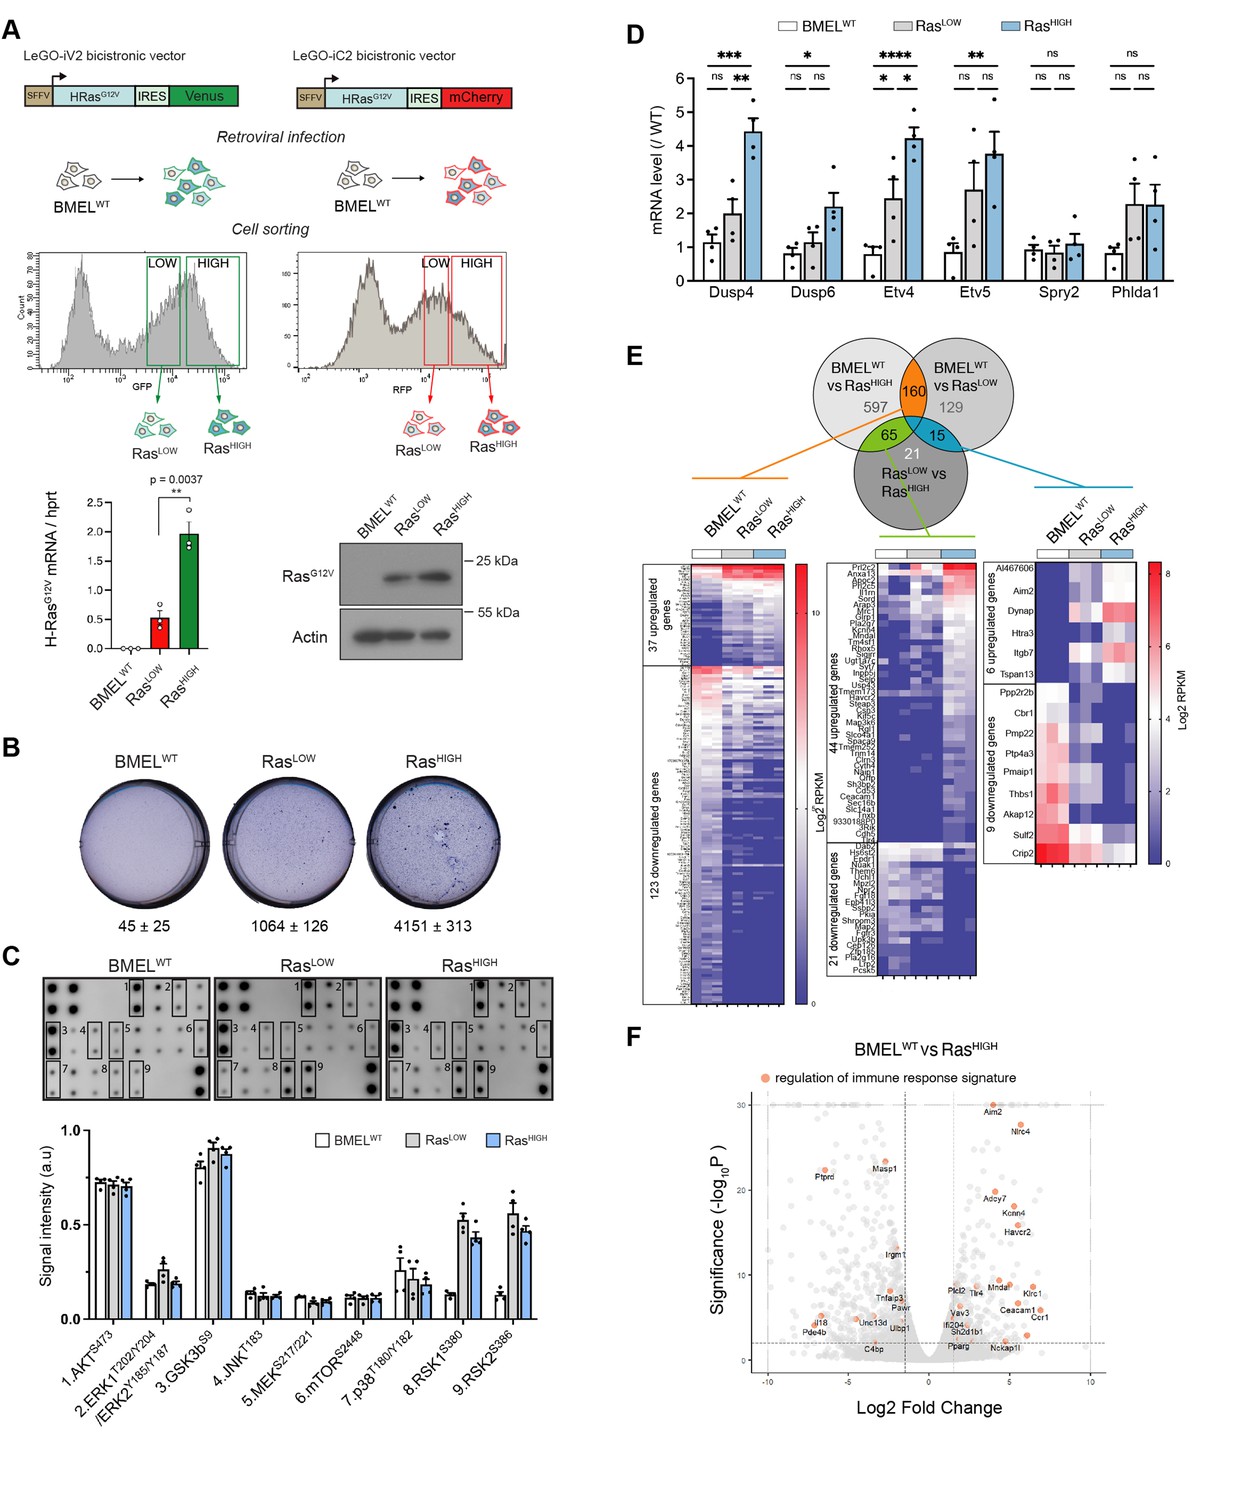
RasG12V oncogenic dosage controls the phenotype of bipotent mouse embryonic liver (BMEL) cells.
(A) Bicistronic vectors were used to transduce BMEL cells that were sorted by flow cytometry according to fluorescence intensities, giving rise to RasLOW and RasHIGH populations labelled with either Venus or mCherry. RasG12V, Venus and mCherry expression were quantified by RTqPCR (see also Figure 1—figure supplement 1), and results for cell lines BMELWT, RasLOW-Cherry, RasHIGH-Venus are shown as mean ± SEM. p-Value of unpaired t-test statistical test is shown. Differences in RasG12V expression were confirmed by western blot analysis (RasLOW-cherry versus RasHIGH-Venus). Actin was used as loading control. (B) Parental non-transformed BMEL (‘BMELWT’), RasLOW and RasHIGH cells were seeded in soft agar, stained with crystal violet and counted after 21 days of culture. Representative wells and mean colony numbers ± SEM from two independent experiments performed in triplicate are shown. (C) Phosphoprotein array performed on BMELWT, RasLOW, and RasHIGH cell lines. Bottom panel shows the quantification of duplicates from two independent experiments. a.u.: arbitrary units. (D) qPCR quantification of Erk target genes signature in RasLOW and RasHIGH BMEL cells normalized to expression in parental BMELWT cells. Mean and SEM from three to four independent experiments are shown. Statistical significance from unpaired t-test are indicated. (E) Venn diagram and heatmaps showing log2 RPKM values of genes regulated by RasG12V in BMEL cells detected by an RNAseq transcriptomic analysis (log2FC >1.5, p-value <0.01). Genes expressed at low levels (all RPKM log2 values <1) were removed from the analysis. From left to right: 160 genes were modulated by Ras similarly in RasLOW and RasHIGH populations, 65 genes were altered only in the RasHIGH cells and the expression of 15 genes was gradually modulated in the RasLOW and RasHIGH populations. (F) Volcano plot presentation of deregulated genes in RasHIGH cells versus parental BMEL cells. Genes belonging to regulation of immune response signature (GO:0050776) are highlighted in orange. ns: not significant, *<0.05, **<0.01, ***<0.001, ****<0.0001.
-
Figure 1—source data 1
Raw western blots for RasG12V expression and phosphoproteome arrays.
- https://cdn.elifesciences.org/articles/76294/elife-76294-fig1-data1-v2.zip
Figure 1—figure supplement 1
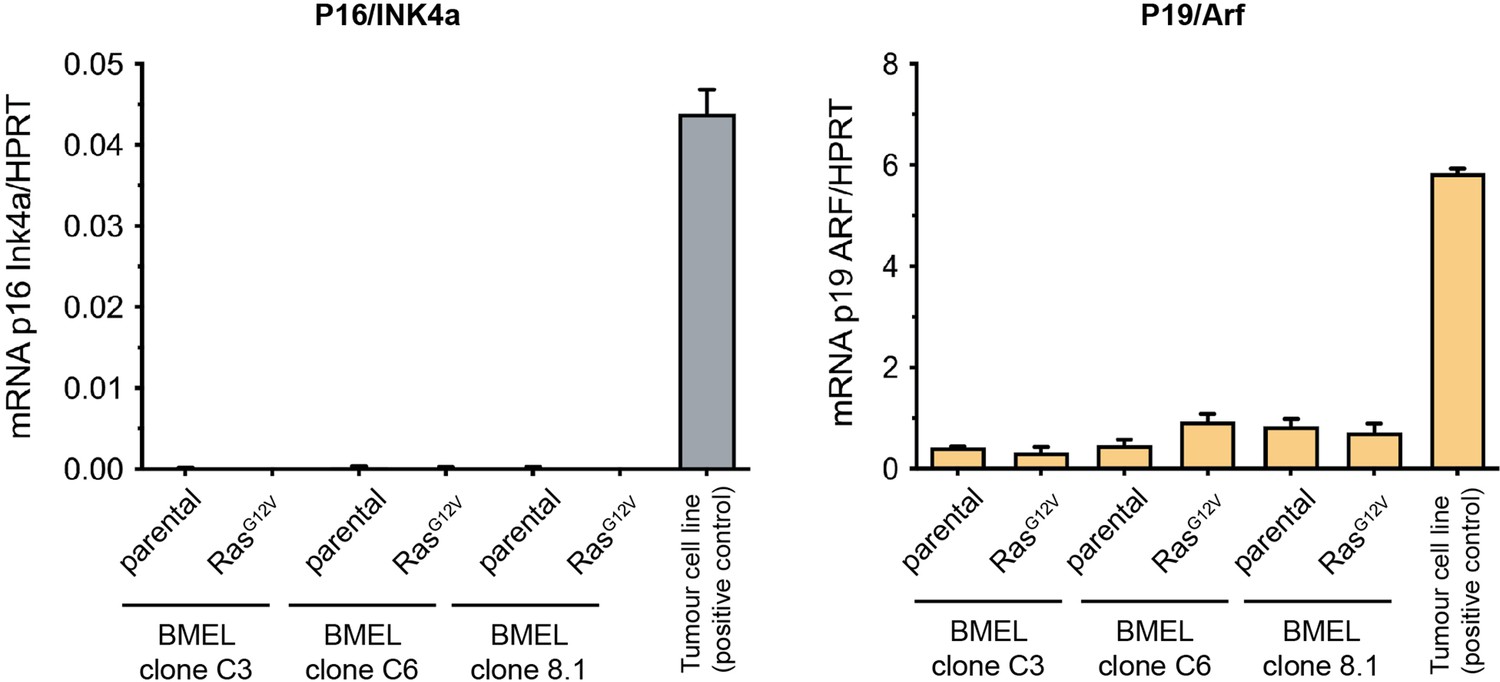
Bipotent mouse embryonic liver (BMEL) clones do not express the p16INK4A tumour suppressor.
Quantification of mRNA expression levels of p16INK4A and p19ARF using qRT-PCR performed on three independent BMEL clones (C3, C6 and 8.1) with or without oncogenic Ras expression, as indicated. N-RASG12D p53null tumour cell line derived from a mouse tumour following a hydrodynamic gene transfer is used as control.
Figure 1—figure supplement 2
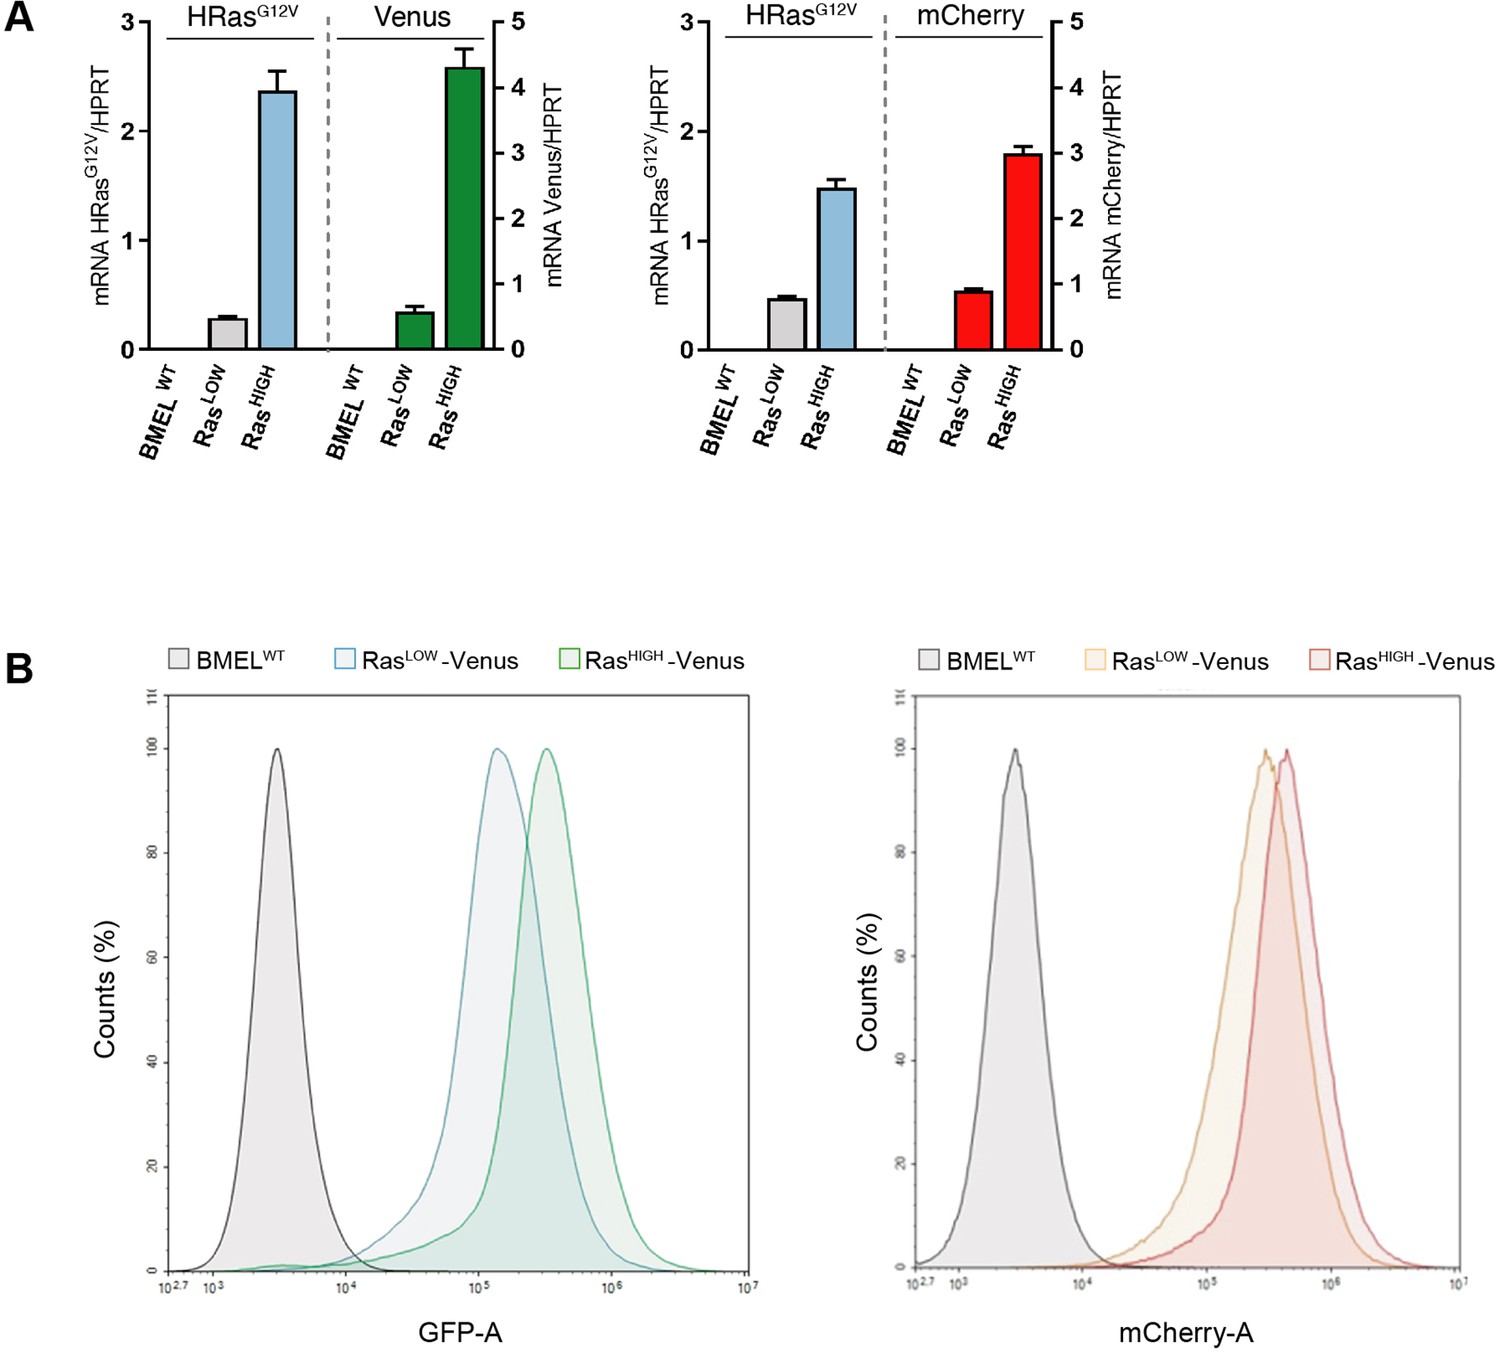
Transgenes expression levels in sorted cell populations.
(A) RTqPCR quantification of H-RasG12V, Venus and mCherry mRNA expression normalized to Hprt expression in indicated cell populations after cell sorting. Mean value and SD from triplicates are shown. (B) Fluorescence intensity profiles of RasLOW and RasHIGH Venus (left panel) and mCherry (right panel) sorted BMEL cell populations, showing overlap in transgene expression in populations.
Figure 1—figure supplement 3
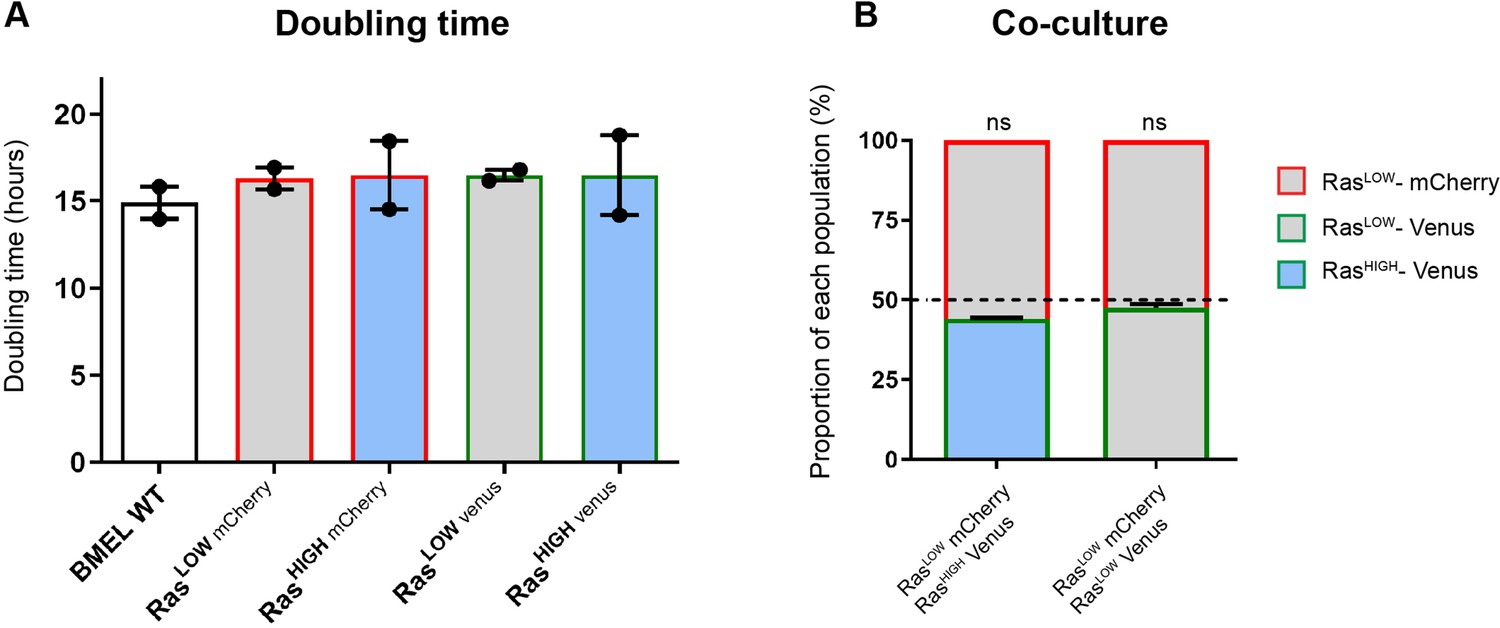
RasG12V expression level does not change bipotent mouse embryonic liver (BMEL) proliferation rates ex vivo.
(A) Doubling times in 2D culture for the indicated cell lines. Mean and values from two independent experiments are shown. (B) Composition of cellular populations after 5 days of culture of 1:1 mix of RasHIGH-Venus and RasLOW-mCherry cells and 1:1 mix of RasLOW-Venus and RasLOW-mCherry cells. Mean ± SEM are indicated for three independent experiments. Deviations from the theoretical value of 50% (dashed line) were calculated using one-sample t-test.
Figure 2
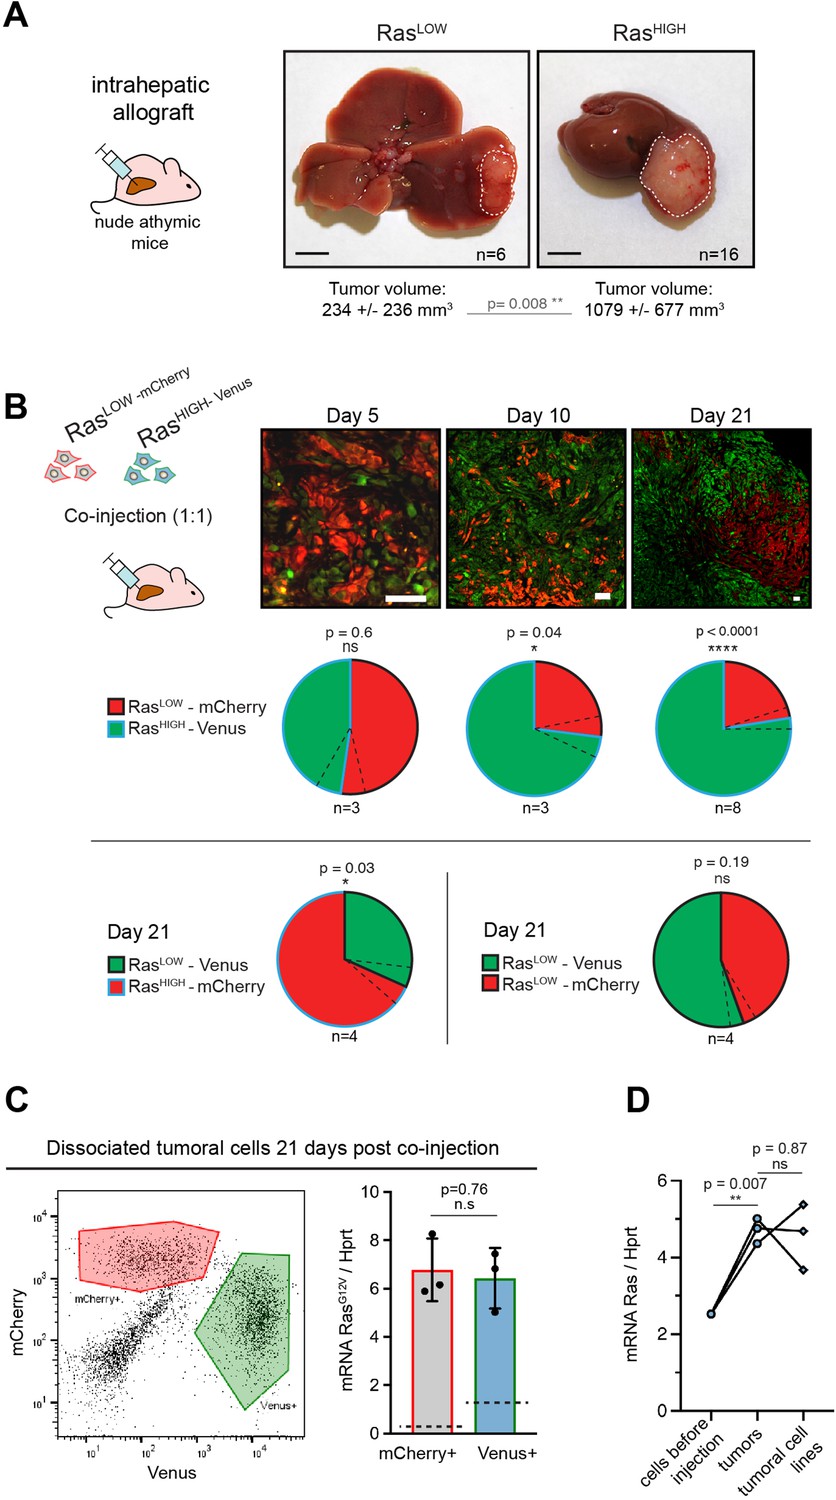
High level of Ras expression confers a selective advantage during in vivo tumour growth.
(A) Macroscopic liver tumours 3 weeks after intrahepatic injection of 105 RasLOW or RasHIGH bipotent mouse embryonic liver (BMEL) cells, as indicated. Mean ± SD volumes are indicated, with statistical significance of unpaired t-test. Scale bars: 5 mm. (B) Mice were injected orthotopically with a 1:1 mix of RasHIGH-Venus (green) and RasLOW-mCherry (red) cells and sacrificed at day 5, 10, and 21, as indicated. Representative images of tumour sections are shown in the upper panels. Different magnifications were used to take into account the tumour growth (scale bars: 50 μm). Contribution of RasHIGH and RasLOW cells to the tumour composition was estimated by image analysis and flow cytometry, which gave identical results. Mean ± SEM (dashed lines) are shown. The significance of deviations from the theoretical value of 50% (i.e. no selective advantage) was calculated by the one-sample t-test. (C) Cells from dissociated tumours were sorted by flow cytometry (left panel) and the mean expression of RasG12V in Venus- and mCherry-labelled populations was quantified by RTqPCR. Mean ± SEM from three independent tumours are shown. Dashed lines indicate the mean level of expression of RasG12V in the population of cells prior to injection. (D) Mean RasG12V expression level quantified by RTqPCR in RasHIGH cells before injection, cells freshly isolated from the tumours as well as in cell lines isolated from tumours kept in culture for 14 days. Unpaired t-test statistical significance is indicated. ns: not significant, *<0.05, **<0.01, ****<0.0001.
Figure 3

Distinct tumour environments select a site-specific range of optimal Ras signalling intensity.
(A) Representative images of paired liver and peritoneal tumours collected 3 weeks after injection of BMEL-RasLOW-Cherry and RasHIGH-Venus cells, as indicated. Lower panel shows hematoxylin/eosin (HE) stainings. (B) Quantification of liver and peritoneal tumour volumes from three independent experiments (mean ± SD). LiverT: liver tumour, PerT: peritoneal tumour. Unpaired t-test p-values are indicated. (C) Liver and peritoneal tumours resulting from injection of RasLOW-mCherry or RasHIGH-Venus cells, as indicated, were dissociated and fluorescent cells were sorted by flow cytometry. RasG12V expression levels in cells prior to injection and in cells purified from the tumours were quantified by Taqman RTqPCR. Mean ± SD are shown. Unpaired t-test p-values are shown. (D) Scatter plots representation of gene expression in tumoural and stromal cells from liver and peritoneal tumours. Pseudo counts mean value from four independent samples is shown. Genes upregulated or downregulated (ratio >2) in perT versus LiverT are shown in red or blue, respectively. Lower panels show the enrichment plot for the indicated gene ontology (GO) terms: positive regulation of MAPK cascade, regulation of apoptotic signalling, immune response regulation. (E) Immunohistochemical analysis of cell proliferation, apoptotic cell death, and necrotic areas in RasHIGH liver and peritoneal tumours. Numbers on each panel represent mean ± SEM from the analysis of duplicate tumour sections from seven animals. ns: not significant, *<0.05, **<0.01, ***<0.001.
Figure 4 with 1 supplement

Site-specific immune contexts of primary and metastatic tumour locations.
(A) Cibersortx algorithm was used to perform cell type deconvolution of RNAseq data from stroma of matched liver and peritoneal tumours (n=4). Ten immune cell populations were included in the signature, as indicated. (B) Macrophage polarization marker expression was analysed by RTqPCR performed on RNA isolated from stromal cells sorted from liver and peritoneal tumours. (C) Dendritic cells (DCs) (CD45+, CD11c+, MHCIIhigh, F4/80-, CD24+) from liver and peritoneal tumours were analysed by flow cytometry. The histogram represents the percentage of DCs among the total CD45+ population, indicating the proliferating (Ki67+, dashed bars) and non-proliferating (Ki67-, filled bars) DCs. (D) Immunohistochemistry performed on liver and peritoneal tumour sections using anti-MFG-E8 antibody, quantification of positive staining is shown in the right panel. Scale bars: 100 μm. (E) Flow cytometry analysis of CD45+CD11b+Ly6G-Ly6C- F4/80low (monocyte-derived macrophages) and CD45+CD11b+Ly6G-Ly6C- F4/80high (tissue-resident macrophages) from liver and peritoneal tumours. (F) Quantification of CD115+, Ki67+, and MHCIIhigh cells among CD45+CD11b+Ly6G-Ly6C-F4/80high macrophages. (G) 5000 cells (NRASG12D p53KO) were injected orthotopically in C57BL/6J mice and athymic nude mice, as indicated. Macroscopic images of representative liver and peritoneal tumours collected 3 weeks after injections (scale bar = 5 mm). Numbers indicate the fraction of inoculated animals that developed tumours. All quantitative analyses were subjected to a paired Student’s t-test. p-Values: #<0.05, ##<0.01, ###<0.001.
Figure 4—figure supplement 1
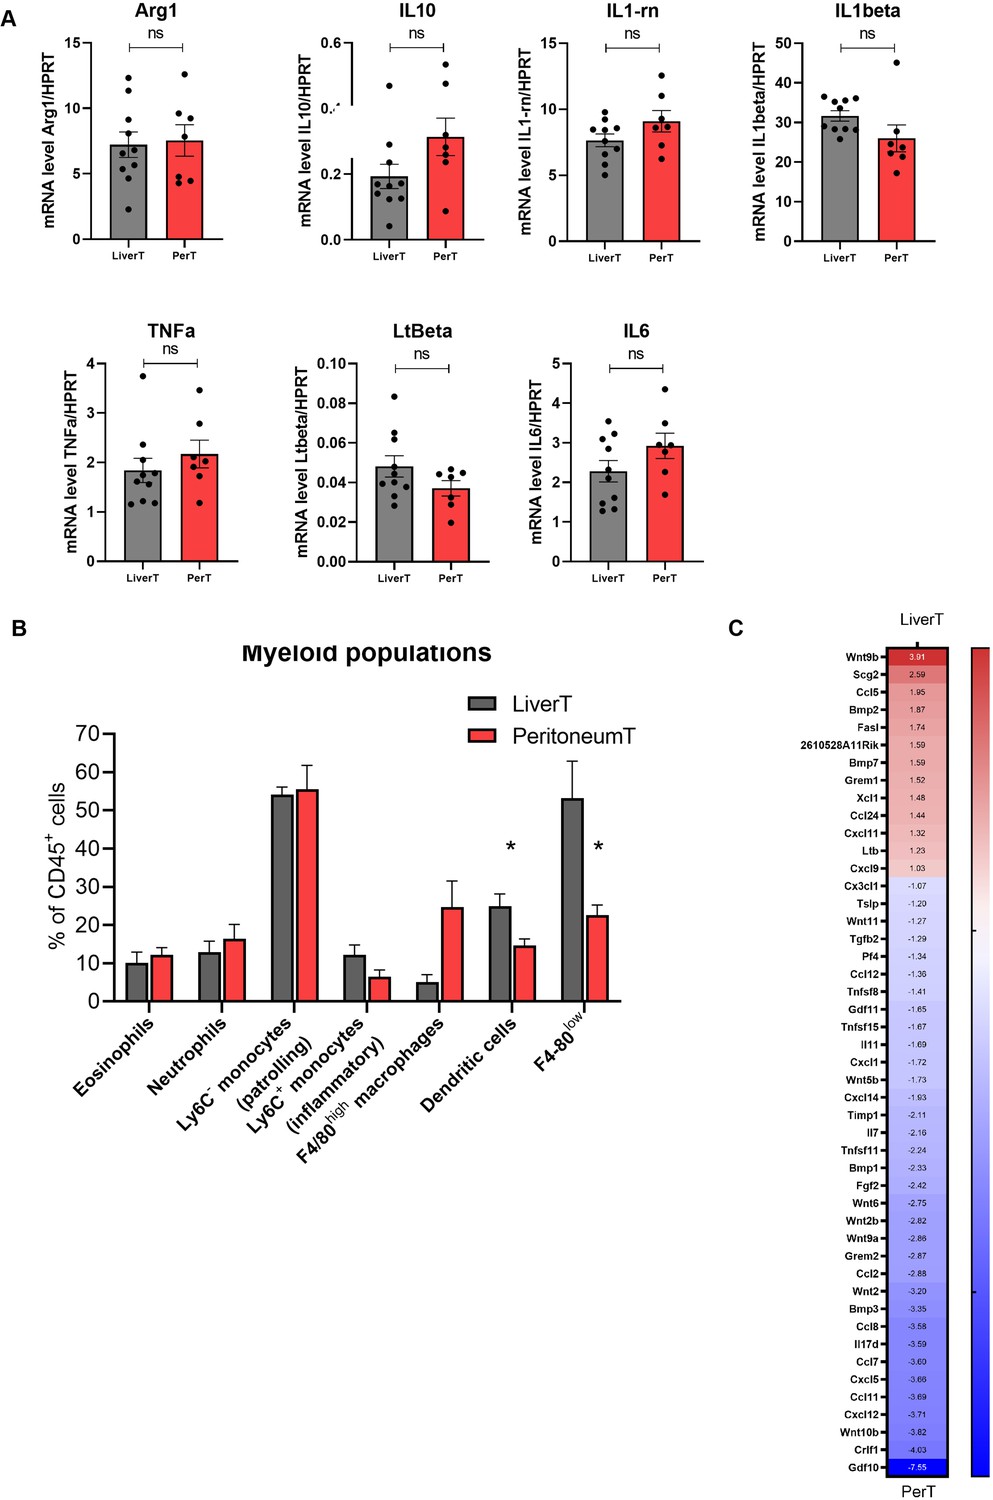
Myeloid infiltrates differ in the microenvironments of hepatic and peritoneal tumours.
(A) Additional macrophage polarization markers were analysed by RTqPCR performed on RNA isolated from stromal cells isolated from liver and peritoneal tumours. ns: not significant. (B) Quantification of myeloid populations defined as CD45+CD11b+Ly6GintLy6Cint eosinophils, CD45+CD11b+Ly6G+neutrophils, CD45+CD11b+Ly6G-Ly6C- patrolling monocytes, CD45+CD11b+Ly6G-Ly6C+ inflammatory monocytes, CD45+CD11b+Ly6G-Ly6C-F4/80high macrophages, CD45+CD11c+MHCIIhighF4/80 CD24+ dendritic cells and F4/80low immature macrophages by flow cytometry analysis of sorted liver and peritoneal stromal cells from athymic nude mice tumours (n=4). Student’s t-test, p-value: *<0.05. (C) Heatmap of cytokines differentially expressed in stromal cells of liver and peritoneal tumours. Numbers display log2 fold change (FC) values for each gene (Deseq, log2FC >1.5 p-value <0.05).
Figure 5 with 1 supplement
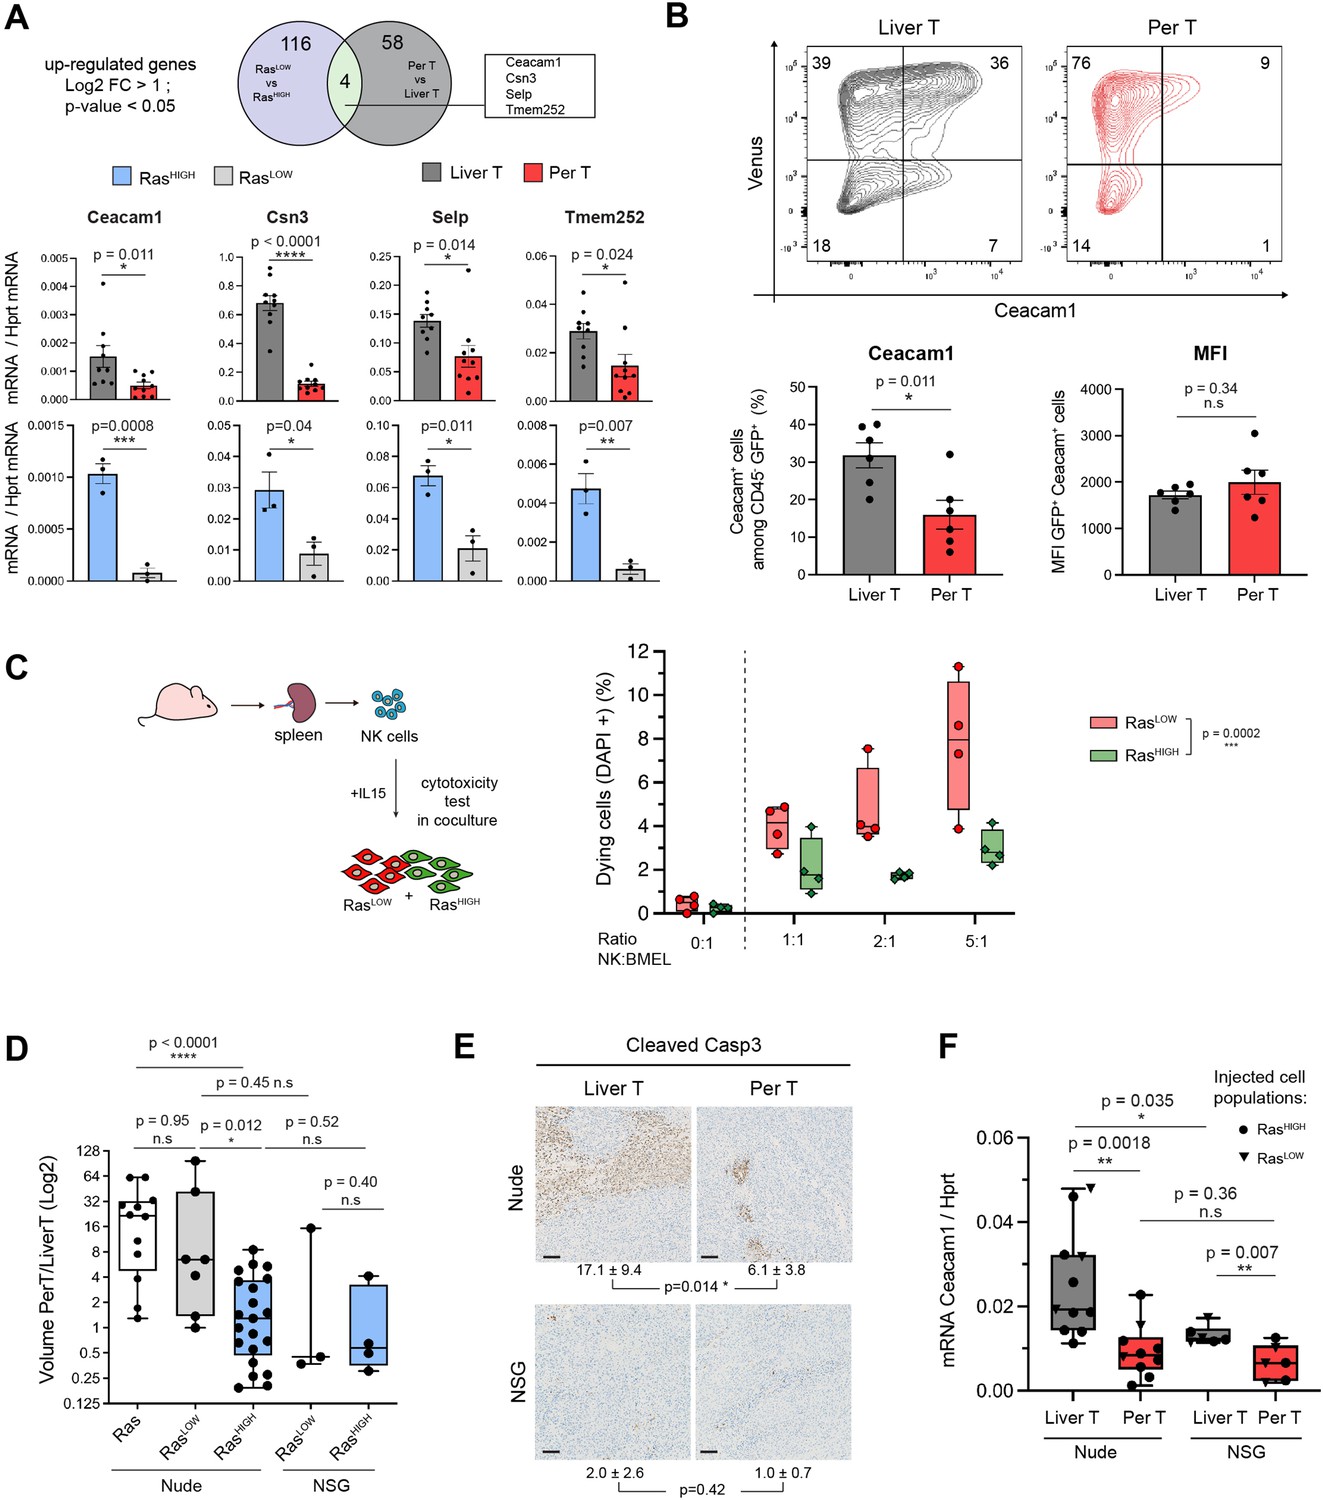
Natural killer (NK) cells contribute to clonal selection in liver tumours.
(A) Venn diagram representing differentially expressed genes (log2FC >1, p-value <0.05) from RNAseq data of RasLOW versus RasHIGH bipotent mouse embryonic liver (BMEL) cells and sorted tumoural cells derived from peritoneal versus liver tumours. Bottom panel: RTqPCR quantification of the four genes upregulated both in the hepatic versus peritoneal tumours and in RasHIGH versus RasLOW cells. Upper panels: analysis of FACS-sorted cells isolated from tumours, lower panels: analysis of ex vivo grown cells. (B) Flow cytometry analysis of tumoural cells (CD45- Venus+ Ceacam1+) isolated from the liver and the peritoneal tumours. Numbers indicate percentage of cells in each quadrant. Bottom panels show quantification (left) and mean fluorescent intensity (MFI, right) of the Ceacam1 expressing tumour cells. (C) NK cytotoxicity test: NK cells isolated from the spleen of nude mice were activated with IL15 and incubated with co-cultures of RasHIGH: RasLOW clones (1:1). Synopsis of the experiment (left panel) and FACS quantification of DAPI-positive cells (right panel). Values are duplicates from two independent experiments. p-Value from two-way ANOVA test is indicated. (D) Ratios of tumour volumes from matched peritoneal and liver tumours (PerT/LiverT) originating from non-sorted BMEL-Ras cells, RasLOW or RasHIGH populations, as indicated, orthotopically inoculated into athymic nude or NOD-SCID-gamma (NSG) mice. (E) Immunohistochemical analysis of activated caspase 3 performed on liver and peritoneal tumours in athymic nude and NSG mice. Mean ± SD values of positive cells from five animals are indicated. Scale bar: 100 µm. (F) RTqPCR quantification of Ceacam1 expression in sorted tumour cells from athymic nude and NSG mice. Unpaired Student’s t-test, p-values. ns: not significant, *<0.05, **<0.01, ***<0.001, and ****<0.0001 p-values.
Figure 5—figure supplement 1
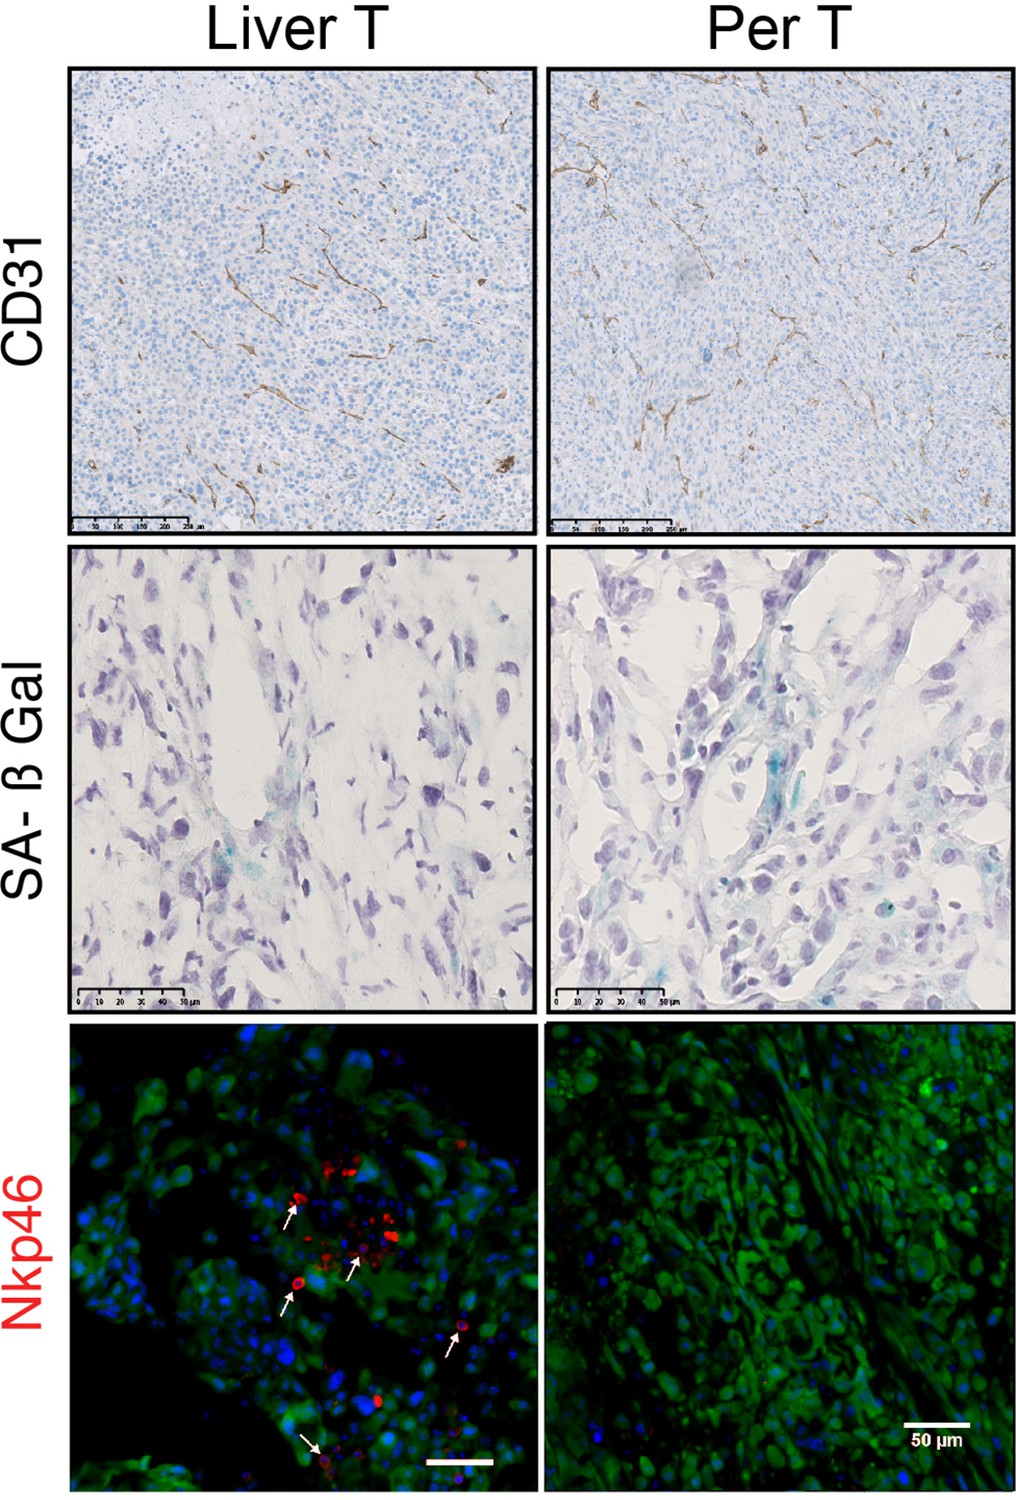
Differences in natural killer (NK) cells infiltration between liver and peritoneal tumours.
Immunhistochemistry performed on athymic nude mice liver and peritoneal tumours initiated by inoculation of RasHIGH bipotent mouse embryonic liver (BMEL) cells were analysed in respect to anti-CD31 (upper panels) and senescence-associated β-galatosidase staining (middle panels). Lower panels: immunofluorescence staining of RasHIGH (Venus-labelled, green) tumours with the NK-specific anti-Nkp46 antibody (red). Arrows show Nkp46-positive cells that infiltrated liver tumours.
Author response image 1
Tables
Table 1
List of primers used in RTqPCR.
| Gene name | Forward primer | Reverse primer |
|---|---|---|
| Venus | AAGGCTACGTCCAGGAG | CGGTTCACCAGGGTGTC |
| mCherry | TCCGAGCGGATGTACCC | GGCCTTGTAGGTGGTCT |
| HRas | GAGGATGCCTTCTACACGTT | GCACACACTTGCAGCTC |
| HRas Taqman primers | GGCATCCCCTACATCGAGA | CTCACGCACCAACGTGTAGA |
| Hprt | GCAGTACAGCCCCAAAATGG | GGTCCTTTTCACCAGCAAGCT |
| Hprt Taqman primers | CCTCCTCAGACCGCTTTTT | AACCTGGTTCATCATCGCTAA |
| Phlda1 | GGGCTACTGCTCATACCGC | AAAAGTGCAATTCCTTCAGCTTG |
| Dusp4 | CGTGCGCTGCAATACCATC | CTCATAGCCACCTTTAAGCAGG |
| Dusp6 | GCGTCGGAAATGGCGATCT | ATGTGTGACGACTCGTACAGC |
| Etv4 | CGGAGGATGAAAGGCGGATAC | TCTTGGAAGTGACTGAGGTCC |
| Etv5 | TCAGTCTGATAACTTGGTGCTTC | GGCTTCCTATCGTAGGCACAA |
| Sprty2 | TCCAAGAGATGCCCTTACCCA | GCAGACCGTGGAGTCTTTCA |
| Ceacam1 | CACAGGACCCTATGTGTGTGAAA | CACTGGCTCAAGGACTGTA |
| Ceacam1 Taqman primers | GGGCTGGCATATTTCCTCTATT | GTTGTCAGAAGGAGCCAGATT |
| Csn3 | CAGTCTGCTGGAGTACCTTATG | AGGATTGGCCACAGTATTTACTAT |
| Selp | CACTGGCTCAAGGACTGTA | TCCAGTAGCCAGGCATCTTA |
| Tmem252 | GAACAGGACTGGGCTGAT | CTCTTCATAAGCTGGAGGGTAAA |
| Arg1 | CATTGGCTTGCGAGACG | CCAGCTTGTCTACTTCAGTCAT |
| IL10 | TAATGCAGGACTTTAAGGGTTACT | CATCCTGAGGGTCTTCAGC |
| TGFb1 | TGCTAATGGTGGACCGC | CATGTTGCTCCACACTTGATTT |
| Mrc1 (CD206) | GGTGGGCAGTCACCATA | GGTTCTCCTGTAGCCCAAG |
| Ltbeta | CCTGCTGCCCACCTCATA | CGACGTGGCAGTAGAGGTAATA |
| IL6 | CTAAGGACCAAGACCATCCAAT | GATATGCTTAGGCATAACGCAC |
| TNFa | TCAGTTCTATGGCCCAGACC | GTCTTTGAGATCCATGCCG |
| IL1beta | TTCCCATTAGACAACTGCACTAC | TATTCTGTCCATTGAGGTGGAGAG |
| IL1-rn | AAGCCTTCAGAATCTGGGATAC | GGATGCCCAAGAACACACT |
| iNOS | GTGGTGACAAGCACATTTGG | GTGGTTGAGTTCTCTAAGCATGA |
| p16 INK4 | GAGCAGCATGGAGTCCG | GGGTACGACCGAAAGAGTT |
| p19 ARF | TTGGTGAAGTTCGTGCGAT | TGGTCCAGGATTCCGGT |
| Csf1 | AGCGACCACCCAGGAGTA | AGTTAGTGCCCAGTGAAGATT |
Table 2
Flow cytometry antibodies.
| Antibodies Myeloid panel | Clone | Source | Fluorochrome |
|---|---|---|---|
| Anti-Ki67 | B56 | BD Biosciences | BV786 |
| Anti-MHCII | M5/114 | BD Biosciences | BV650 |
| Anti-Ly6C | HK1.4 | BioLegend | BV605 |
| Anti-CD11b | M1/70 | BD Biosciences | BV412 |
| Anti-F4/80 | BM8 | BioLegend | PE-Cy7 |
| Anti-CD11c | N418 | Invitrogen | PE-Cy5.5 |
| Anti-CD45 | 30-F11 | BioLegend | AF700 |
| Anti-Ly6G | 1A8 | BioLegend | APC |
| Anti-CD24 | M1/69 | eBioscience | PerCp-eFlour710 |
| Anti-CD115 | AFS98 | Biolegend | PE/Dazzle |
| Anti-Ceacam1 | CC1 | eBioscience | PE-Cy7 |
Table 3
IHC antibodies.
| Name | Clone | Source | Species | Cat # | Dilution |
|---|---|---|---|---|---|
| Ki67 | SP6 | Spring Bioscience | Rabbit | M3064 | 1:250 |
| Caspase 3 | ASP175 | Cell signalling | Rabbit | 9661S | 1:4000 |
| CD31 | Polyc | Abcam | Rabbit | Ab28364 | 1:75 |
| MFG-E8 | 18A2-G10 | MBL | Hamster | D199-3 | 1:1000 |
Additional files
-
Supplementary file 1
RNAseq and gene expression data.
(a) Gene signature for the low threshold Ras/MAPK signalling (Figure 1E left panel). (b) Gene expression modified only in RasHIGH cells (Figure 1E middle panel). (c) Genes for which expression correlated with intensity of Ras/MAPK signalling (Figure 1E right panel). (d) Genes differentialy expressed in peritoneal tumour cells versus liver tumour cells. (e) GSEA identified enriched gene sets liver versus peritoneum isolated tumour cells.
- https://cdn.elifesciences.org/articles/76294/elife-76294-supp1-v2.docx
-
MDAR checklist
- https://cdn.elifesciences.org/articles/76294/elife-76294-mdarchecklist1-v2.pdf
Download links
A two-part list of links to download the article, or parts of the article, in various formats.
Downloads (link to download the article as PDF)
Open citations (links to open the citations from this article in various online reference manager services)
Cite this article (links to download the citations from this article in formats compatible with various reference manager tools)
Ras/MAPK signalling intensity defines subclonal fitness in a mouse model of hepatocellular carcinoma
eLife 12:e76294.
https://doi.org/10.7554/eLife.76294


