Natural killer (NK) cell-derived extracellular-vesicle shuttled microRNAs control T cell responses
- Immunology Service, Hospital de la Princesa, Universidad Autónoma de Madrid, Instituto Investigación Sanitaria Princesa, Spain
- Intercellular Communication in the Inflammatory Response. Vascular Pathophysiology Area, National Center for Cardiovascular Research (CNIC), Spain
- Universidad Autónoma de Madrid, Spain
- Department of Immunology and Oncology, National Centre for Biotechnology, Spanish National Research Council, Spain
- Instituto Madrileño de Estudios Avanzados en Nanociencia (IMDEA Nanociencia) & Nanobiotecnología (IMDEA-Nanociencia), Unidad Asociada al Centro Nacional de Biotecnología (CSIC), Spain
- CIBER de Enfermedades Cardiovasculares (CIBERCV), Spain
Figures
Figure 1 with 2 supplements

Natural killer-derived extracellular vesicles (NK-EVs) have a specific microRNA (miRNA) signature and are enriched in miRNAs related with Th1 functions.
(A) Heatmap showing small RNA sequencing analysis of miRNAs differentially expressed in resting and activated human NK cells and their secreted EVs. Data are from NK cells isolated from five healthy donors. Significance was assessed using the Benjamini-Hochberg procedure and only miRNAs with an adjusted p-value < 0.05 are shown. (B) Histogram plot showing logarithmic fold-increase expression between activated NK cells and their released EVs. Only fold-changes with adjusted p-value < 0.05 and log fold-change > 2 are represented. MiRNAs significantly more expressed in cells than in their secreted exosomes are shown in green, while miRNAs significantly more represented in the EV fraction are shown in red. (C) Summary of molecular and cellular functions targeted by NK-EV miRNAs identified by unbiased ingenuity pathway analysis (IPA). The numbers indicate the molecules targeted by miRNAs over-represented in NK-EVs compared to NK cells. (D) Log fold-change in the small RNASeq expression of miRNAs significantly overexpressed in NK-EVs compared to their secreting cells, related to Th1 functions. Significance was assessed using Benjamini-Hochberg adjusted p-values; *p<0.05,**p<0.01, ***p<0.001, ****p<0.0001. (E,F) Quantitative real-time PCR of NK-EV upregulated miRNAs in resting NK cells, activated NK cells, and secreted EVs. Bars represent the mean ± SEM of cells and vesicles obtained from five healthy donors, normalized to the small nucleolar RNU5G. Data show the validation of CD4+ T cell (E) and dendritic cell (DC) (F) function-related miRNAs, obtained by the 2-∆∆Ct method, using Biogazelle software. Significance was assessed by paired t-test; *p<0.05.
Figure 1—figure supplement 1
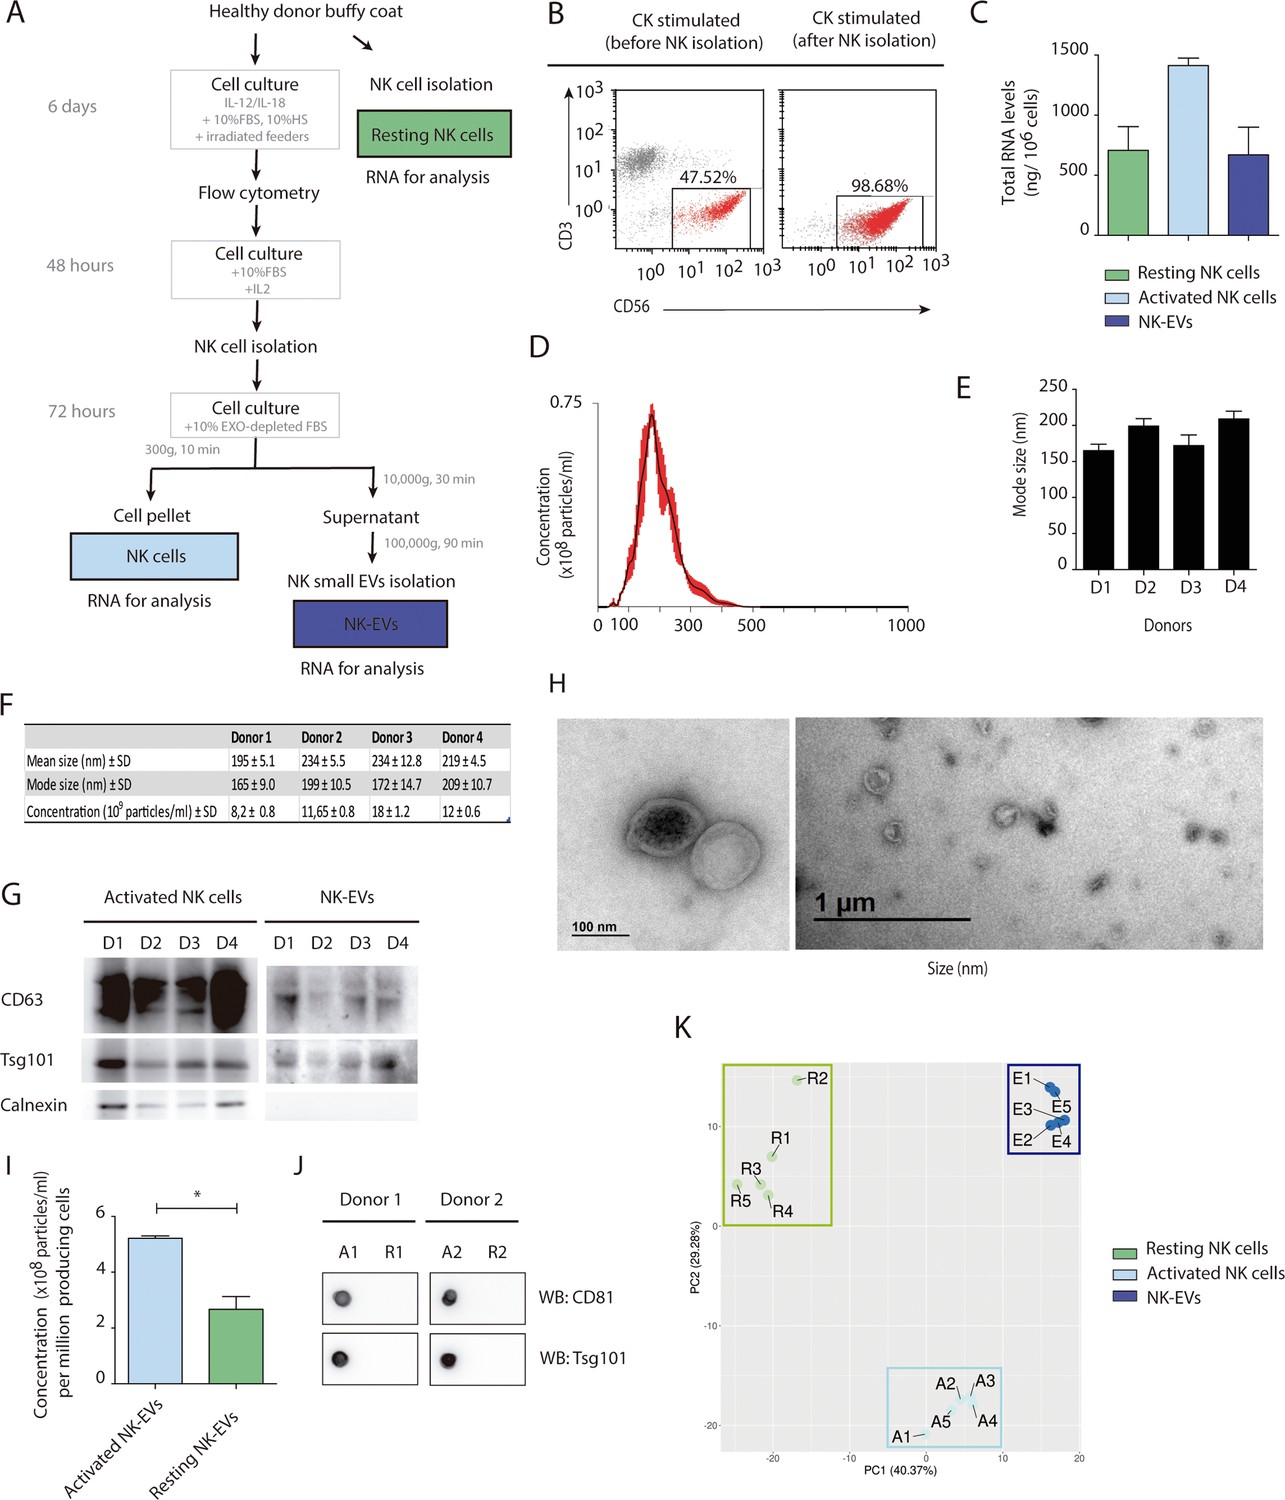
Natural killer-derived extracellular vesicle (NK-EV) isolation and characterization.
(A) Scheme of NK cells (resting and activated) and NK-EV RNA samples preparation for small RNA sequencing analysis. (B) Representative flow cytometry dot plot of peripheral blood mononuclear cells (PBMCs) from healthy donor’s buffy coats in the presence of NK-enrichment cytokine (CK) cocktail with IL-12 and IL-18 for 6 days. Dot plots show the enrichment of CD3- CD56+ NK cells after 6–8 days culture with cytokines and irradiated feeder cells (left panel) and NK cell isolation (right panel), being greater than 95% in all experiments. (C) Quantification of total RNA (Nanodrop) from isolated samples for small RNA sequencing analyses (resting and activated cells and NK-EVs). (D–F) Characterization of isolated NK-derived small EVs by NanoSight analysis. A representative plot from all analysed samples is shown (D). NanoSight determination of size quantification (E) and statistics, including mean and mode size and EV concentration (F) of EVs isolated from four healthy donors, as described in the manuscript’s Materials and methods section. (G) NK cell total lysates and NK-EV fractions were analysed by Western blot, probing with the exosomal markers Tsg101 and CD63 and Calnexin, as indicated. (H) Electron microscopy images from activated NK cell-derived EVs. (I, J) Small EVs released by 3.5 × 10⁶ either resting or activated cells were isolated by ultracentrifugation and analysed by nanoparticle-tracking analysis (NTA) (I) and dot plot (J), respectively, to quantify NK-EV release. (K) Principal component analysis plot from small RNA sequencing data; resting NK cell (green), activated NK cells (light blue), and exosome samples (dark blue) are represented. Individual dots represent the values for the different individual donors (n=5; A: activated NK cells, R: resting NK cells, E: NK-EVs).
-
Figure 1—figure supplement 1—source data 1
Uncropped Western blots from the figure.
- https://cdn.elifesciences.org/articles/76319/elife-76319-fig1-figsupp1-data1-v2.tif
-
Figure 1—figure supplement 1—source data 2
Original Western blot image showing CD63 expression.
- https://cdn.elifesciences.org/articles/76319/elife-76319-fig1-figsupp1-data2-v2.tif
-
Figure 1—figure supplement 1—source data 3
Original Western blot image showing Tsg101 expression.
- https://cdn.elifesciences.org/articles/76319/elife-76319-fig1-figsupp1-data3-v2.tif
-
Figure 1—figure supplement 1—source data 4
Original Western blot image showing Tsg101 expression.
- https://cdn.elifesciences.org/articles/76319/elife-76319-fig1-figsupp1-data4-v2.tif
Figure 1—figure supplement 2
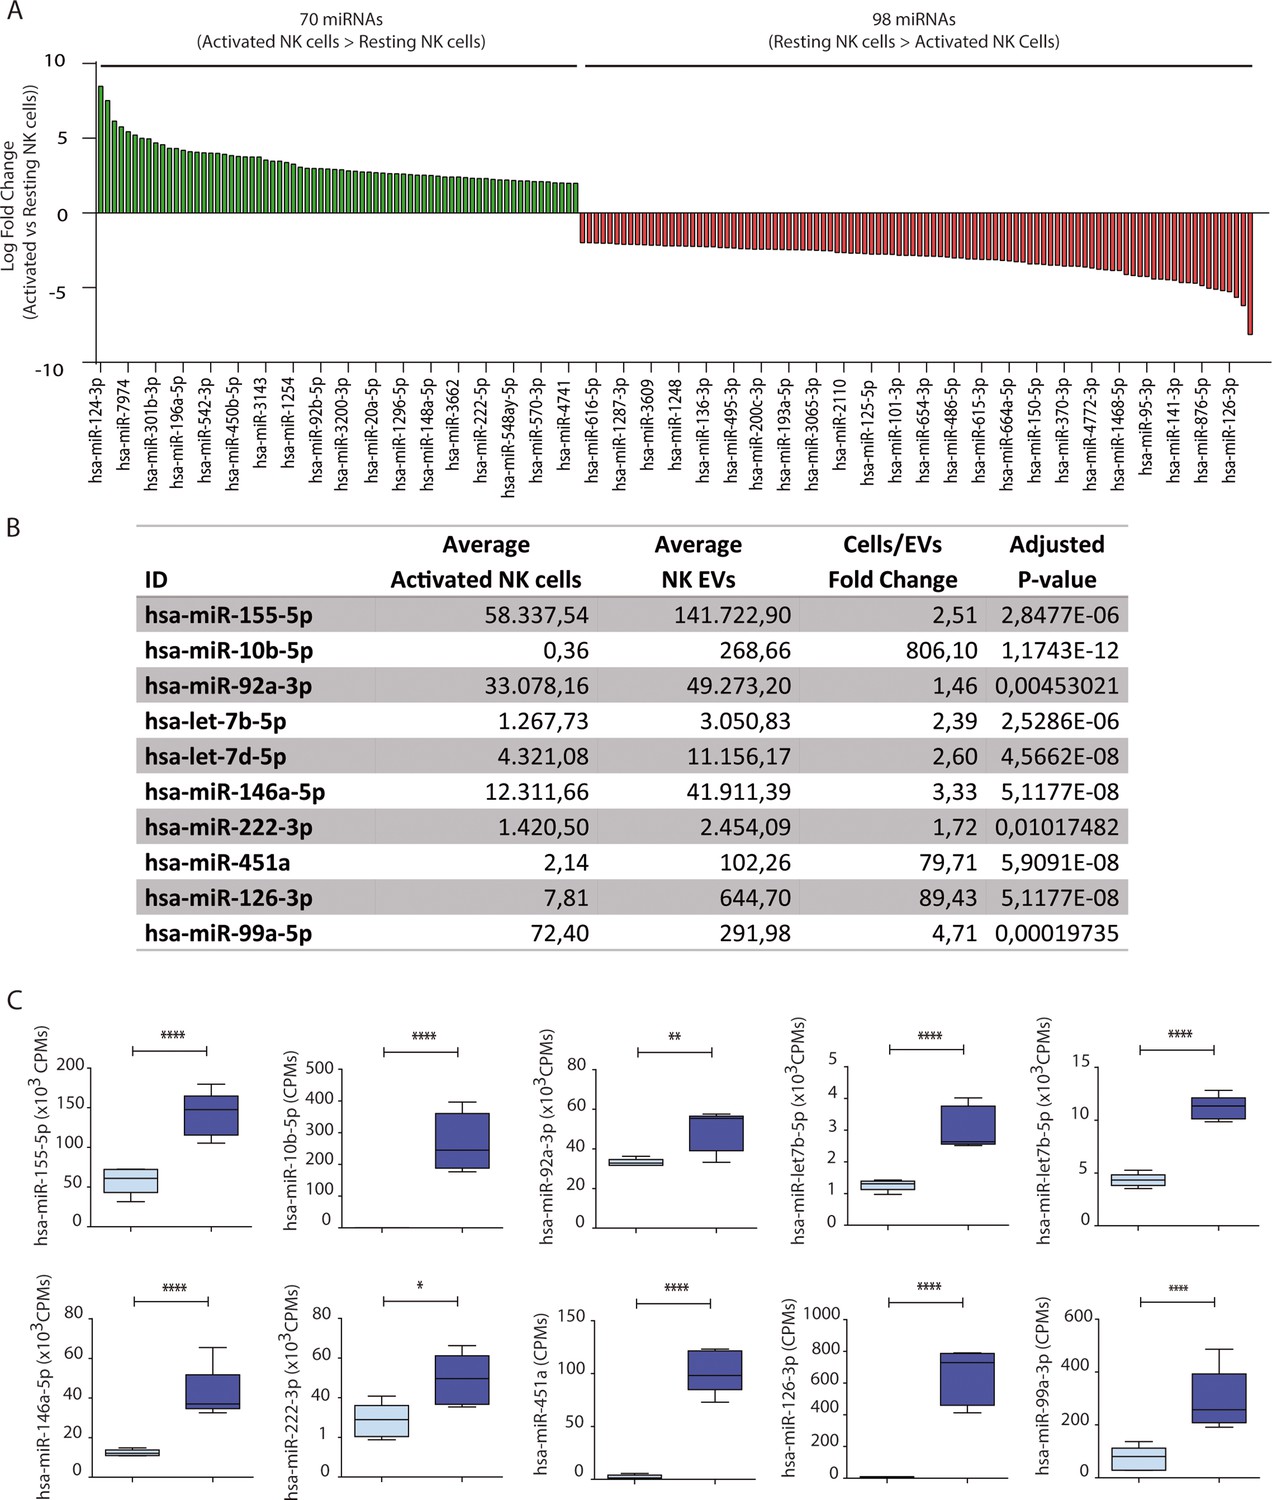
Natural killer-derived extracellular vesicle (NK-EV) microRNA (miRNA) content.
(A) Waterfall plot showing logarithmic fold-increase expression between resting and activated NK cells. Only fold-changes with adjusted p-value < 0.05 are represented. MiRNAs significantly increased in activated NK cells are shown in green, while miRNAs significantly more represented in resting cells are shown in red. (B) Table showing average expression of activated NK cells and their released NK-EVs and activated cell to EV fold-change and adjusted p-values from small RNA sequencing analyses. (C) Box and whiskers plots showing average counts per million of miRNAs for activated NK cells (light blue) and their released small EVs (dark blue).
Figure 2 with 3 supplements
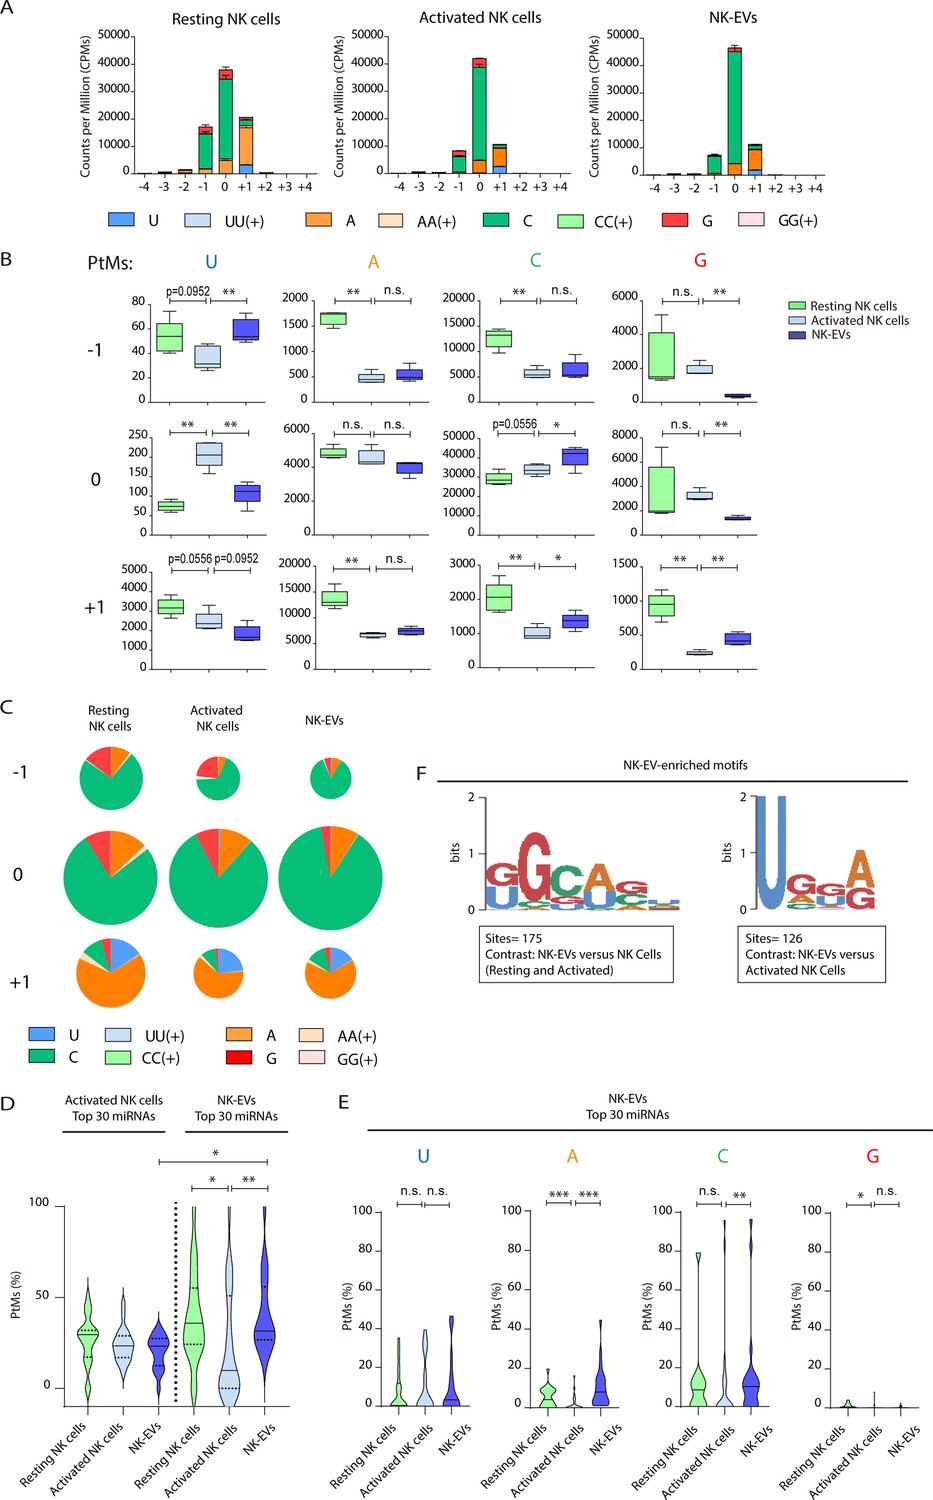
Resting natural killer (NK) cells, activated NK cells, and their released extracellular vesicles (EVs) contain microRNAs (miRNAs) with a different post-transcriptional modification (PtM) signature.
(A) Bar charts showing the PtM profile of miRNAs from resting NK cells, activated NK cells, and NK-derived EVs (NK-EVs), expressed in normalized counts per million (CPMs) at the 3p-end. Modifications from the canonical sequence (either additions or substitutions) in positions ranging from –4 to +4 are represented. (B) Box and whiskers plots show the additions of U, A, C, and G at the indicated positions (ranging from –1 to +1) in miRNAs from resting NK cells, activated NK cells, and NK-EVs. Significance was assessed, comparing resting and activated NK cells and activated NK cells with their released small EVs using non-parametric t-test; *p<0.05, **p<0.01. (C) Pie charts show the proportion of the different modifications (U, A, C, and G) for each position (from –1 to +1) for resting NK cells, activated NK cells, and NK-EV miRNAs, respectively. The area of each pie chart is proportional to the total number of reads bearing the specified PtMs at the indicated positions. (D) Violin plots represent the fraction of miRNA reads with PtMs. Analysis was performed comparing the most differentially expressed miRNAs in activated NK cells compared to NK-EVs. The left panel summarizes the data obtained from the 30 miRNAs most expressed in activated NK cells, while the right panel shows the percentage of reads with PtMs from the 30 miRNAs with a higher expression in NK-EVs compared to their secreting activated NK cells. Individual miRNAs with less than 10 reads were excluded from the analysis. The median value is shown as a solid line and quartiles represented as dotted lines. Significance was assessed with the Kruskal-Wallis test; *p<0.05, **p<0.01. (E) Violin plots represent the fraction of miRNA reads with U, A, C, or G mono-additions at positions –1, 0, and +1. Analysis was performed for the 30 miRNAs more enriched in NK-EVs, comparing the PtM signature in resting cells and activated cells, and activated cells and their released NK-EVs. Significance was assessed with the non-parametric t-test Wilcoxon matched-pairs signed ranked test; *p<0.05, **p<0.01,***p<0.001. (F) Over-represented motifs in NK-EV-miRNAs, using the ZOOPS model. For each data set, all miRNAs annotated in miRBase 21 were used as background. Short motifs with adjusted E-value<0.2 are shown.
Figure 2—figure supplement 1
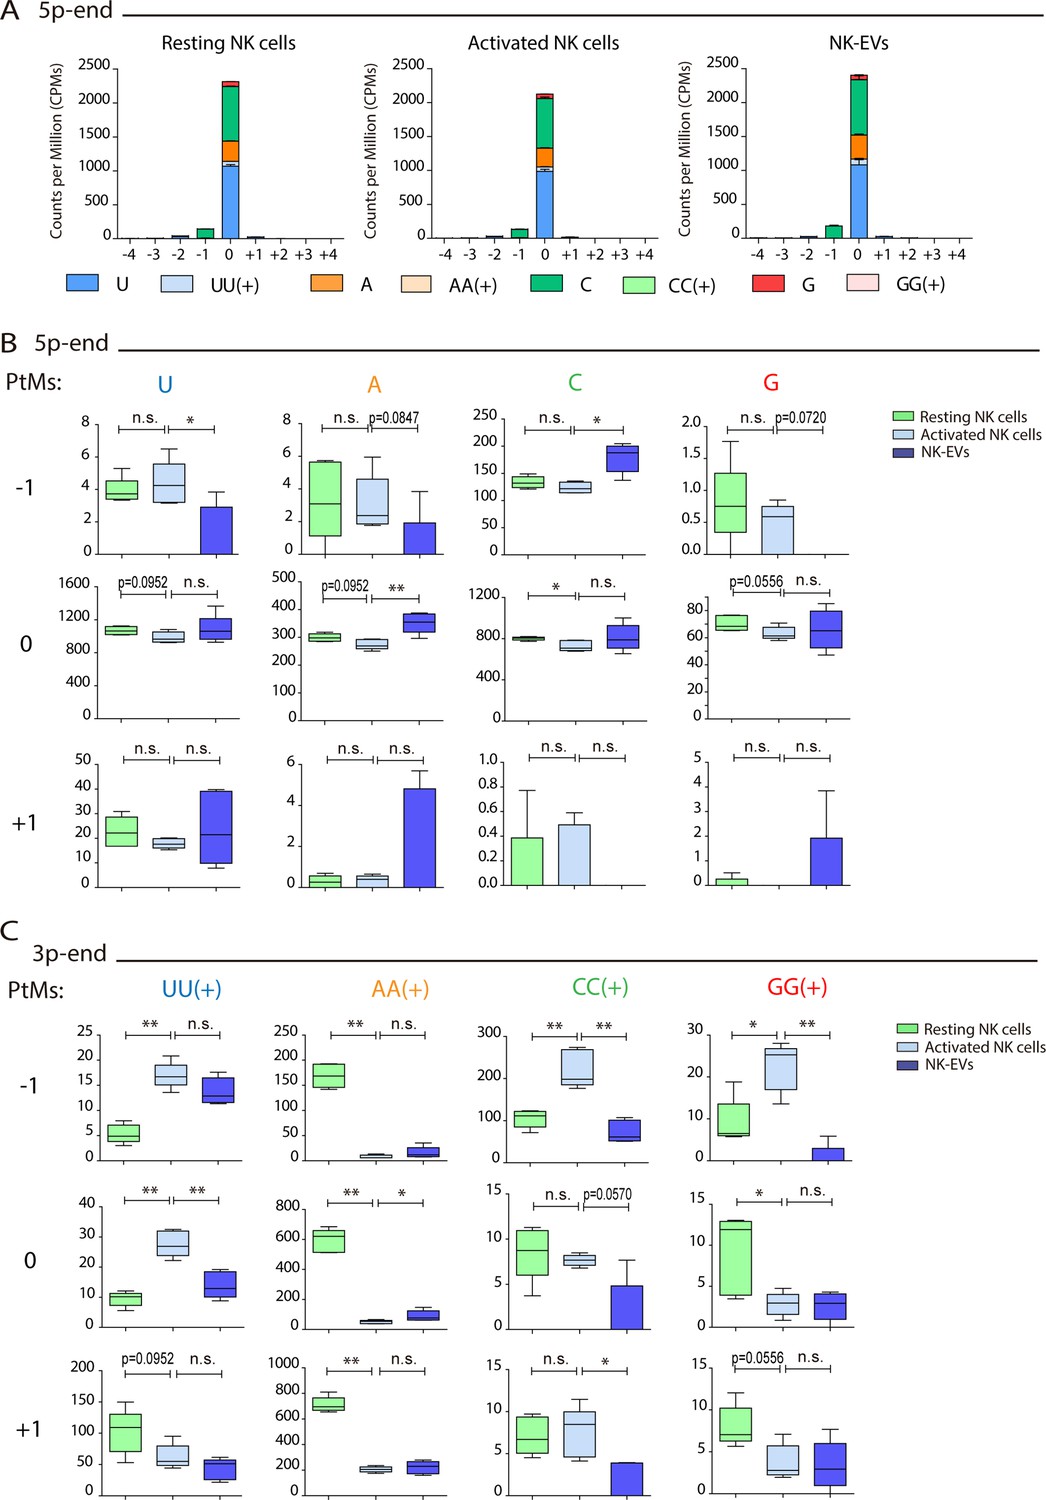
Resting natural killer (NK) cells, activated NK cells, and NK-derived extracellular vesicle (NK-EV) microRNAs (miRNAs) have a different isomiR signature.
(A) Bar charts showing the post-transcriptional modification (PtM) profile of miRNAs from resting NK cells, activated NK cells, and NK-EVs, expressed in normalized counts per million (CPMs) at the 5p-end. Modifications from the canonical sequence (either additions or substitutions) in positions ranging from –4 to +4 are represented. (B) Box and whiskers plots show the mono-additions of U, A, C, and G at the indicated positions (ranging from –1 to +1) in miRNAs from resting NK cells, activated NK cells, and NK-EVs at the 5p-end. Significance was assessed by non-parametric t-test, comparing resting with activated NK cells, and activated NK cells with their released NK-EVs, respectively; *p<0.05, **p<0.01. (C) Box and whiskers plots show the additions of two or more U, A, C, and G at the indicated positions (ranging from –1 to +1) in miRNAs from resting NK cells, activated NK cells, and NK-EVs at the 3p-end. Significance was assessed by non-parametric t-test, comparing resting and activated NK cells and activated NK cells and their released NK-EVs, respectively; *p<0.05, **p<0.01.
Figure 2—figure supplement 2
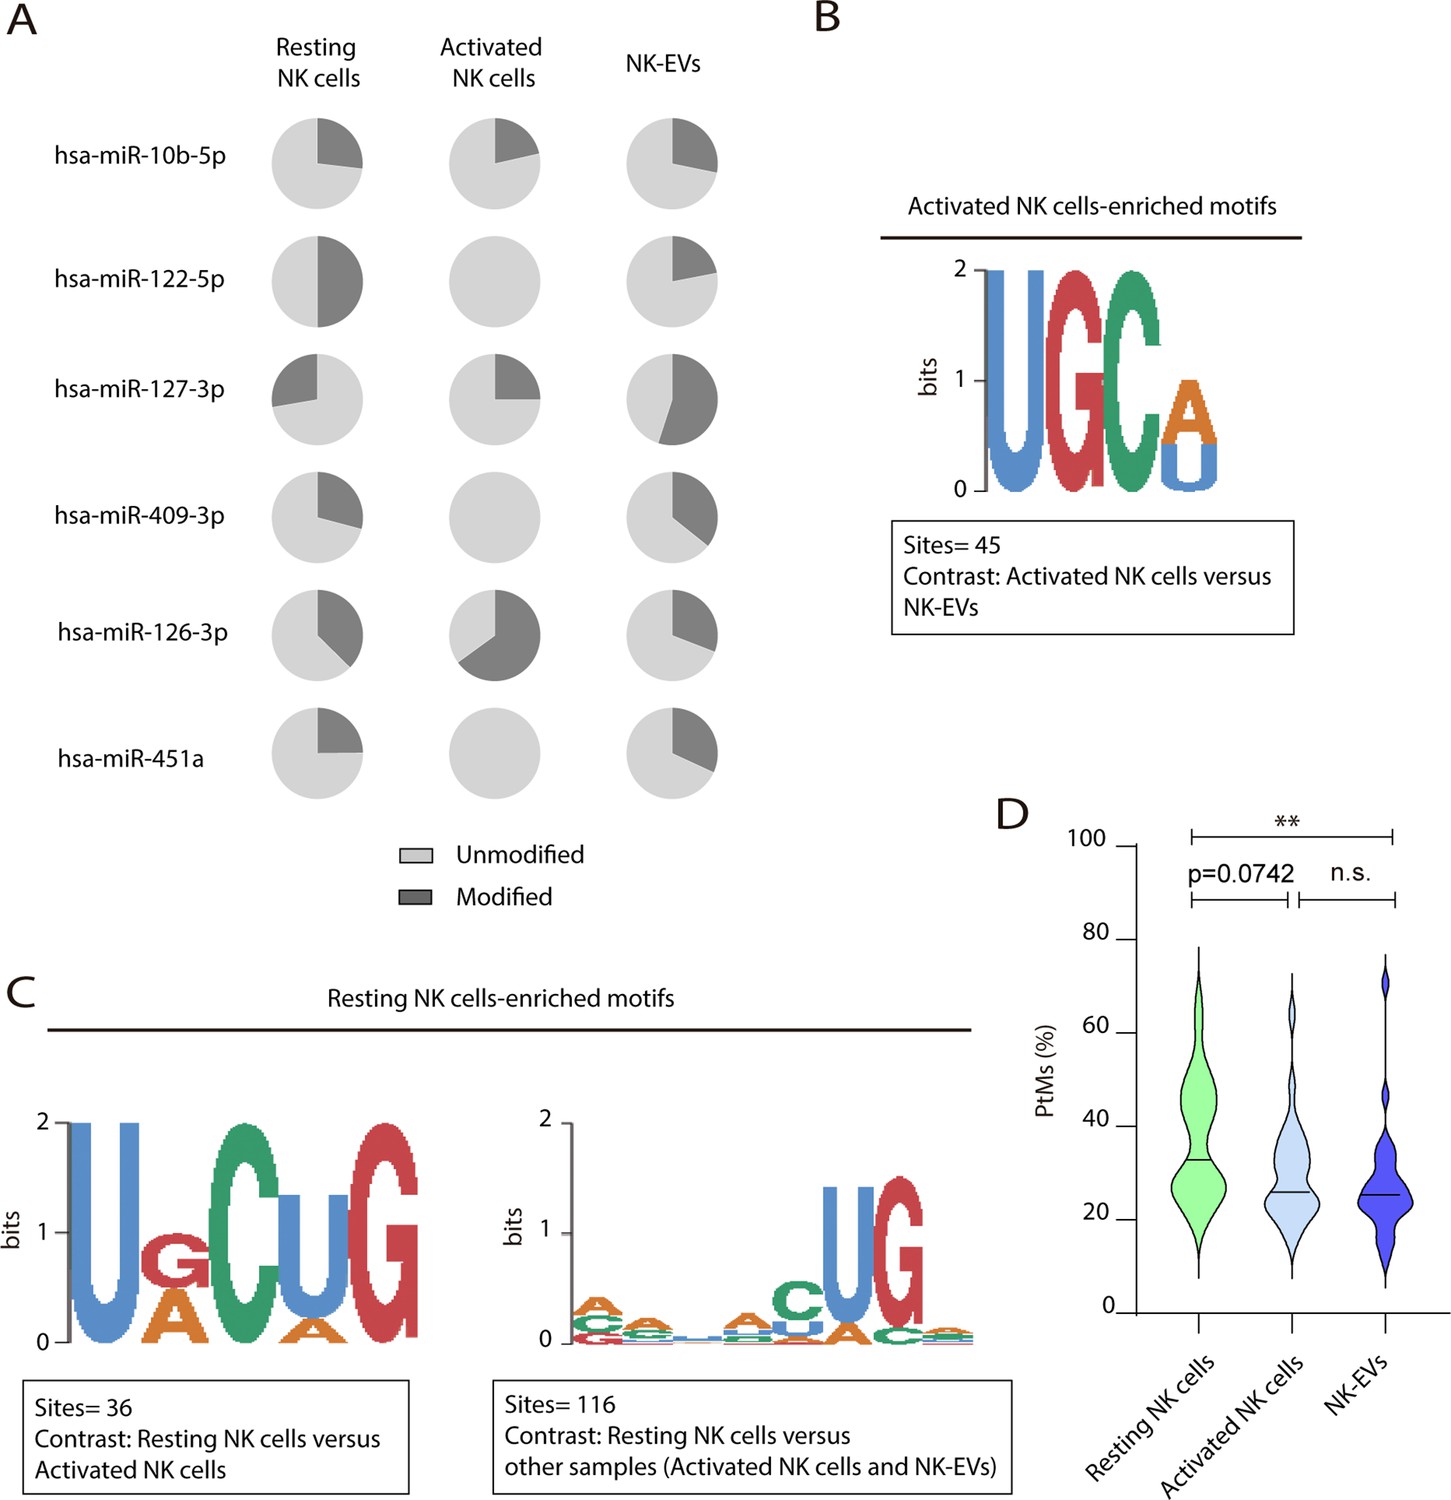
Post-transcriptional modification (PtM) characterization of the most expressed microRNAs (miRNAs) in resting and activated natural killer (NK) cells over-represented motifs.
(A) Pie charts showing the proportion of the modified (dark grey) and unmodified (light grey) fractions, respectively, for the six miRNAs more differentially enriched in activated NK-derived extracellular vesicles (NK-EVs) compared to their secreting cells. (B) Violin plots represent the average percentage of reads with PtMs from each miRNA. Analysis was performed comparing the most expressed miRNAs in NK-EVs. The median value is shown as a solid line. (C,D) Over-represented motifs in resting NK cells (C) and activated NK cells (D), using the ZOOPS model. For each data set, all miRNAs annotated in miRBase 21 were used as background. Short motifs with adjusted E-value<0.2 are shown.
Figure 2—figure supplement 3
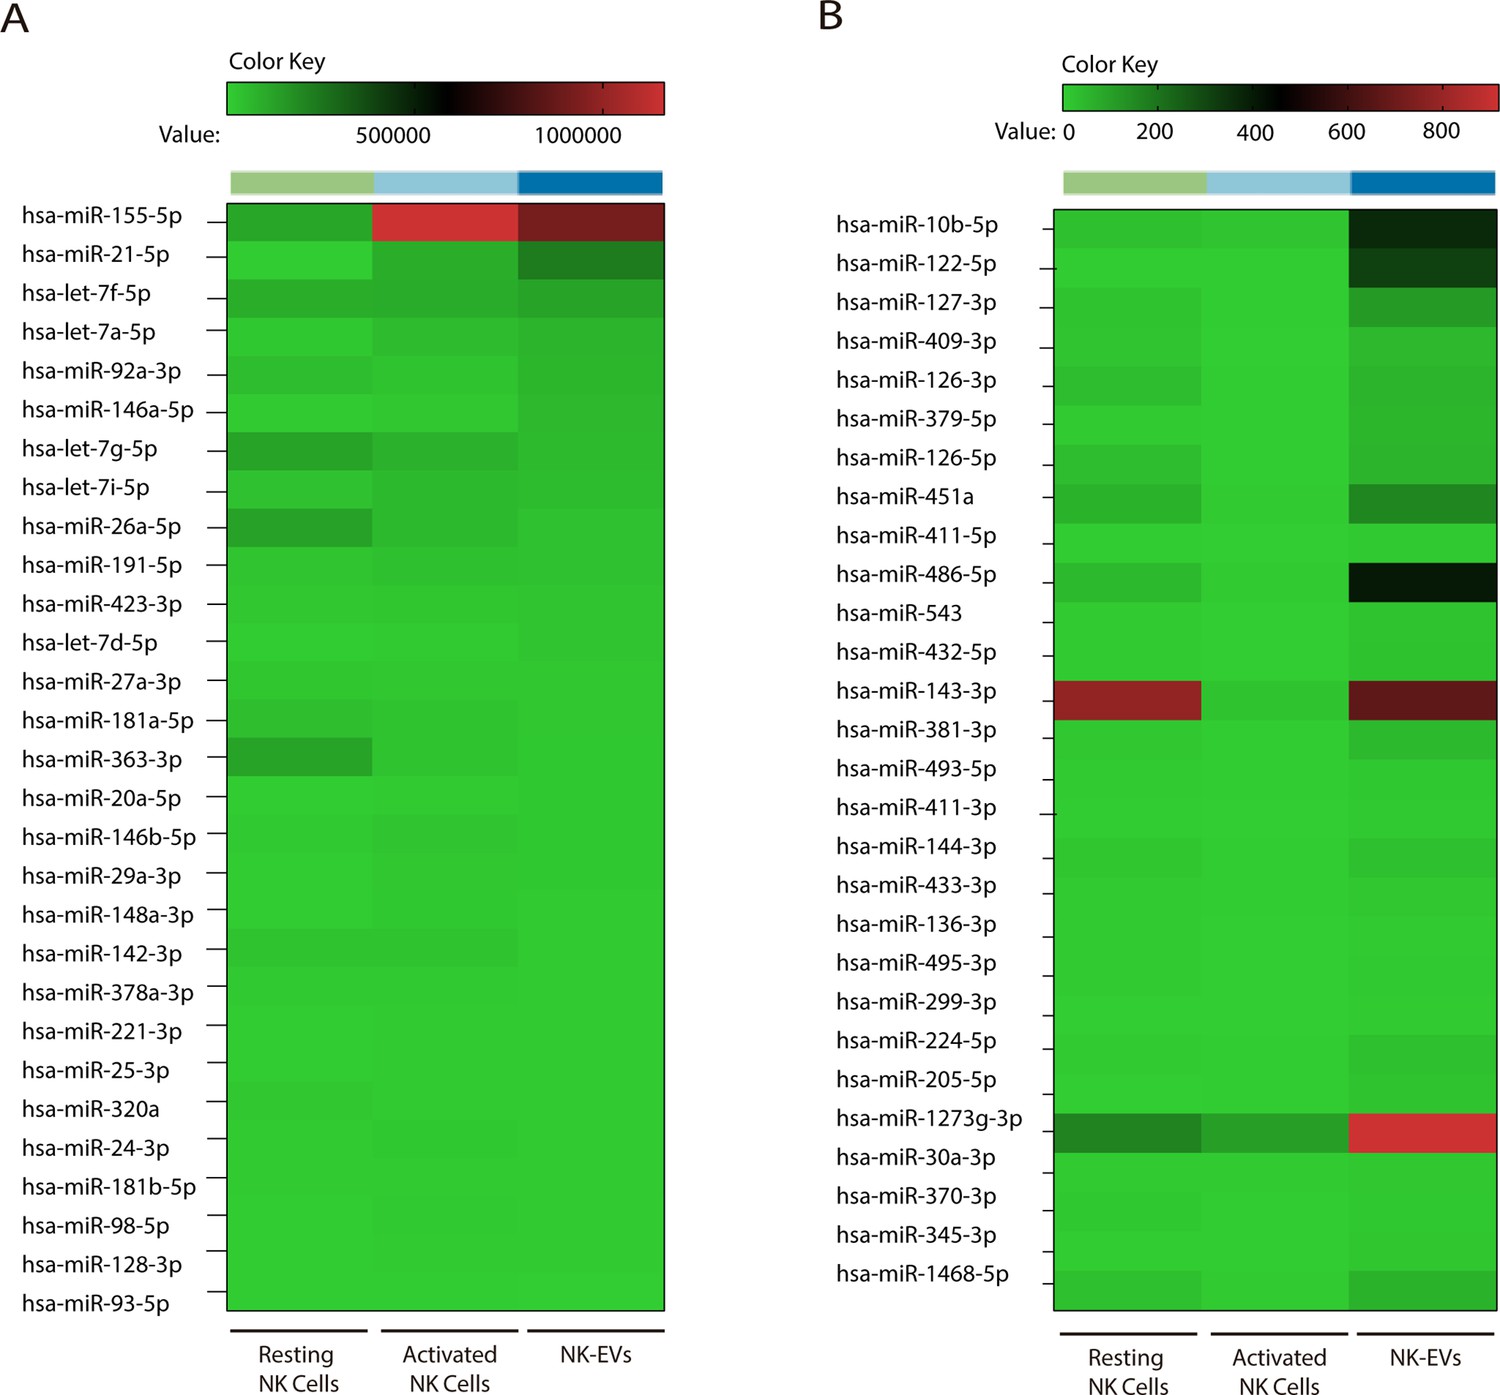
Natural killer-derived extracellular vesicle (NK-EV)-enriched microRNAs (miRNAs).
(A,B) Heatmaps showing small RNA sequencing analysis of the top 30 miRNAs with higher levels of expression in NK-EVs (A) and those more differentially expressed in NK-EVs compared to activated NK cells (B), respectively. For each analysis, the relative expression of individual miRNAs in resting and activated human NK cells and their secreted exosomes is shown. Data are from five healthy donor’s isolated NK cells.
Figure 3 with 3 supplements

Natural killer-derived extracellular vesicles (NK-EVs) promote Th1 differentiation via Gata3 downmodulation and T-bet de-repression correlating with increased levels of miR-10b-5p and miR-92a-3p.
CD4+ T cells isolated from healthy human buffy coats were cultured either in non-polarizing or in cytokine Th1-polarizing conditions, with a mixture of IL-2 and IL-12, in the presence or absence of NK-EVs. (A) Flow cytometry analysis of isolated CD4+ T lymphocytes incubated under non-cytokine polarizing (upper panels) and Th1 cytokine-polarizing (with a mixture of IL-2 and IL-12, lower panels) conditions. A representative experiment is shown. Box and whiskers plots show the expression of CD4 and IFN-γ in gated live cells (min to max and median values), after addition of NK-EVs(Right panel). Plots show the quantification of n≥4 independent experiments. Significance was assessed with paired Student’s t-test; *p<0.05, **p<0.01. (B) ELISA quantification of soluble IFN-γ in supernatants from cultured cells in the indicated conditions (unpolarized, upper panel; cytokine polarized, lower panel). The chart shows the median concentration from n≥4 independent experiments. Significance was assessed with paired Student’s t-test; *p<0.05. (C) Flow cytometry analysis of isolated CD4+ T cells cultured in the different conditions. Graphs show the mean fluorescence intensity of T-BET in gated live single CD4+ T cells after 3 and 6 days of culture, respectively. Significance was assessed with paired Student’s t-test; *p<0.05. (D,E) Quantitative real-time PCR at days 3 and 6 showing mRNA levels of TBX21 (D) and GATA3 (E), respectively, normalized to GAPDH and ACTB. Significance was assessed by paired Student’s t test; *p<0.05. (F) Quantitative real-time PCR at day 3 to detect microRNA (miRNA) levels in CD4+ T cells after culture in the indicated conditions. MiR-10b-5p (left panel) and miR-92a-3p (right panel) relative expression is shown, and normalized to RNU1A1 and RNU5G. Significance was assessed by paired Student’s t test; *p<0.05.
Figure 3—figure supplement 1
Natural killer-derived extracellular vesicle (NK-EV) microRNAs (miRNAs) and T cell function.
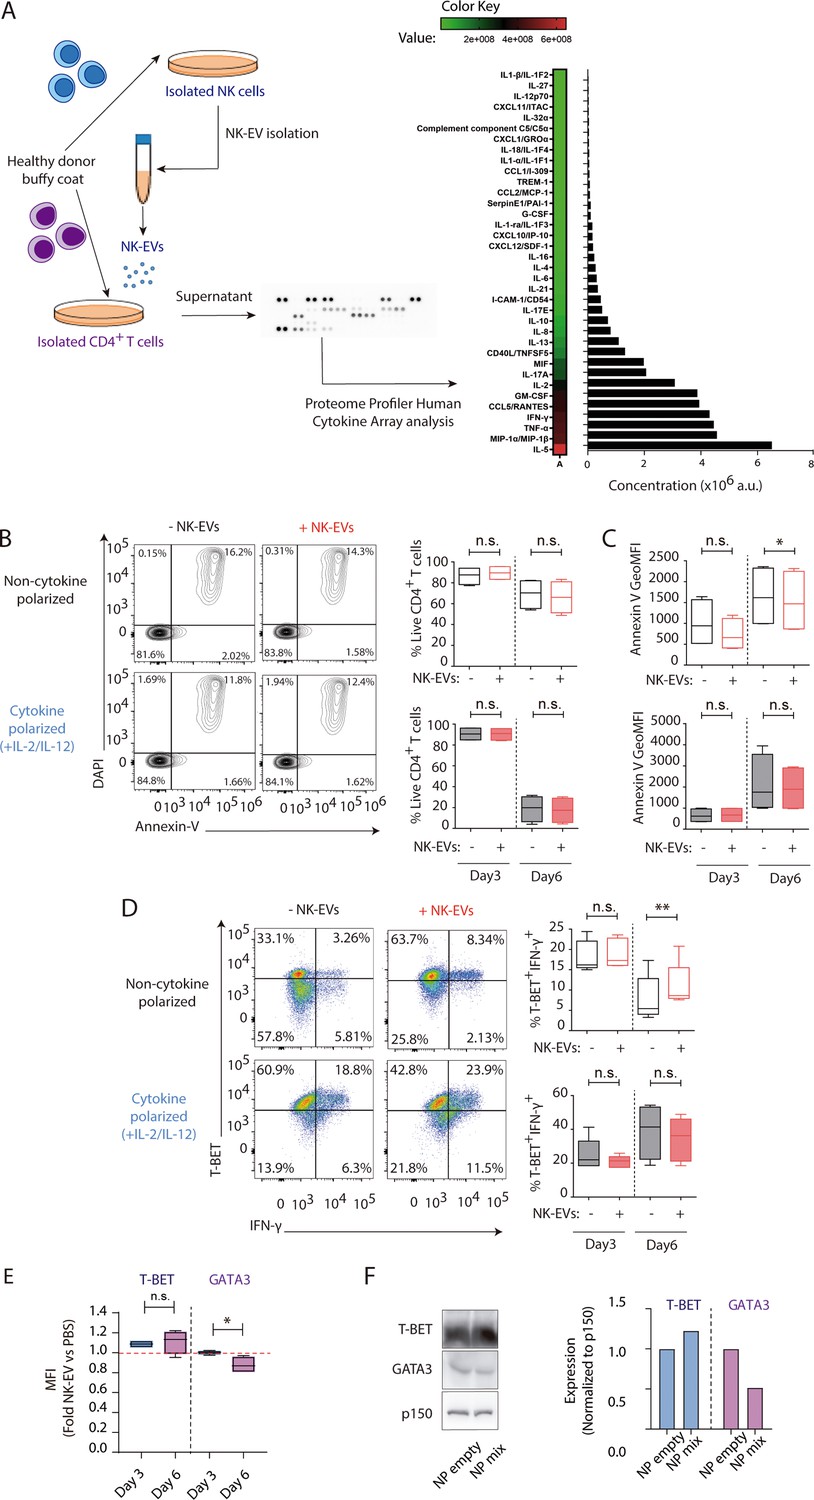
(A) Cytokine profiler of CD4+ T lymphocytes incubated for 16 hr with NK-EVs. Data show the relative expression of the indicated cytokines and chemokines, expressed in arbitrary units (a.u.). (B) Flow cytometry analysis showing the viability of isolated CD4+ T cells incubated under non-cytokine-polarizing (upper panel) and Th1 cytokine-polarizing (with a mixture of IL-2 and IL-12, lower panel) conditions. Contour plots show a representative staining with the viability marker DAPI and expression of the apoptotic marker Annexin-V in CD4+ T cells. Plots show the quantification of live DAPI- Annexin-V- CD4+ T cells ± SEM, in the different culture conditions and after addition of NK-EVs. Plots show the quantification of n≥4 independent experiments. Significance was assessed with paired Student’s t-test. (C) Quantification of Annexin-V Geometric Mean Fluorescence Intensity. Data shown are from n≥4 independent experiments. Significance was assessed with paired Student’s t-test; *p<0.05. (D) Flow cytometry analysis of isolated CD4+ T cells incubated under non-cytokine-polarizing (upper panel) and Th1 cytokine-polarizing (with a mixture of IL-2 and IL-12, lower panel) conditions. Box and whiskers plots show the expression of T-bet and IFN-γ in gated live cells ± SEM, after addition of NK-EVs. Plots show the quantification of n≥4 independent experiments. Significance was assessed with paired Student’s t-test; *p<0.05, **p<0.01. (E) Flow cytometry analysis of CD4+ isolated cells 3 and 6 days after NK-EV incubation. Box and whiskers plots show the relative expression of T-BET (left) and GATA3 (right) proteins, normalized to PBS-treated cells (quantification of n≥4 independent experiments). Significance was assessed with paired Student’s t-test; *p<0.05. (F) CD4+ T cells were incubated with nanoparticles containing the NK-EV microRNAs (miRNAs) miR-10b and miR-92a and control nanoparticles for 72 hr. Thereafter cells were lysed and resolved in 10% SDS-PAGE and probed with the appropriate antibodies for T-BET, GATA3, and p150 protein detection, as indicated. Quantification of expression normalized to the p150 house-keeping marker is shown (lower panel).
-
Figure 3—figure supplement 1—source data 1
Uncropped Western blots from the figure.
- https://cdn.elifesciences.org/articles/76319/elife-76319-fig3-figsupp1-data1-v2.tif
-
Figure 3—figure supplement 1—source data 2
Original Western blot image showing p150 expression.
- https://cdn.elifesciences.org/articles/76319/elife-76319-fig3-figsupp1-data2-v2.tif
-
Figure 3—figure supplement 1—source data 3
Original Western blot image showing T-BET expression.
- https://cdn.elifesciences.org/articles/76319/elife-76319-fig3-figsupp1-data3-v2.tif
-
Figure 3—figure supplement 1—source data 4
Original Western blot image showing GATA3 expression.
- https://cdn.elifesciences.org/articles/76319/elife-76319-fig3-figsupp1-data4-v2.tif
Figure 3—figure supplement 2
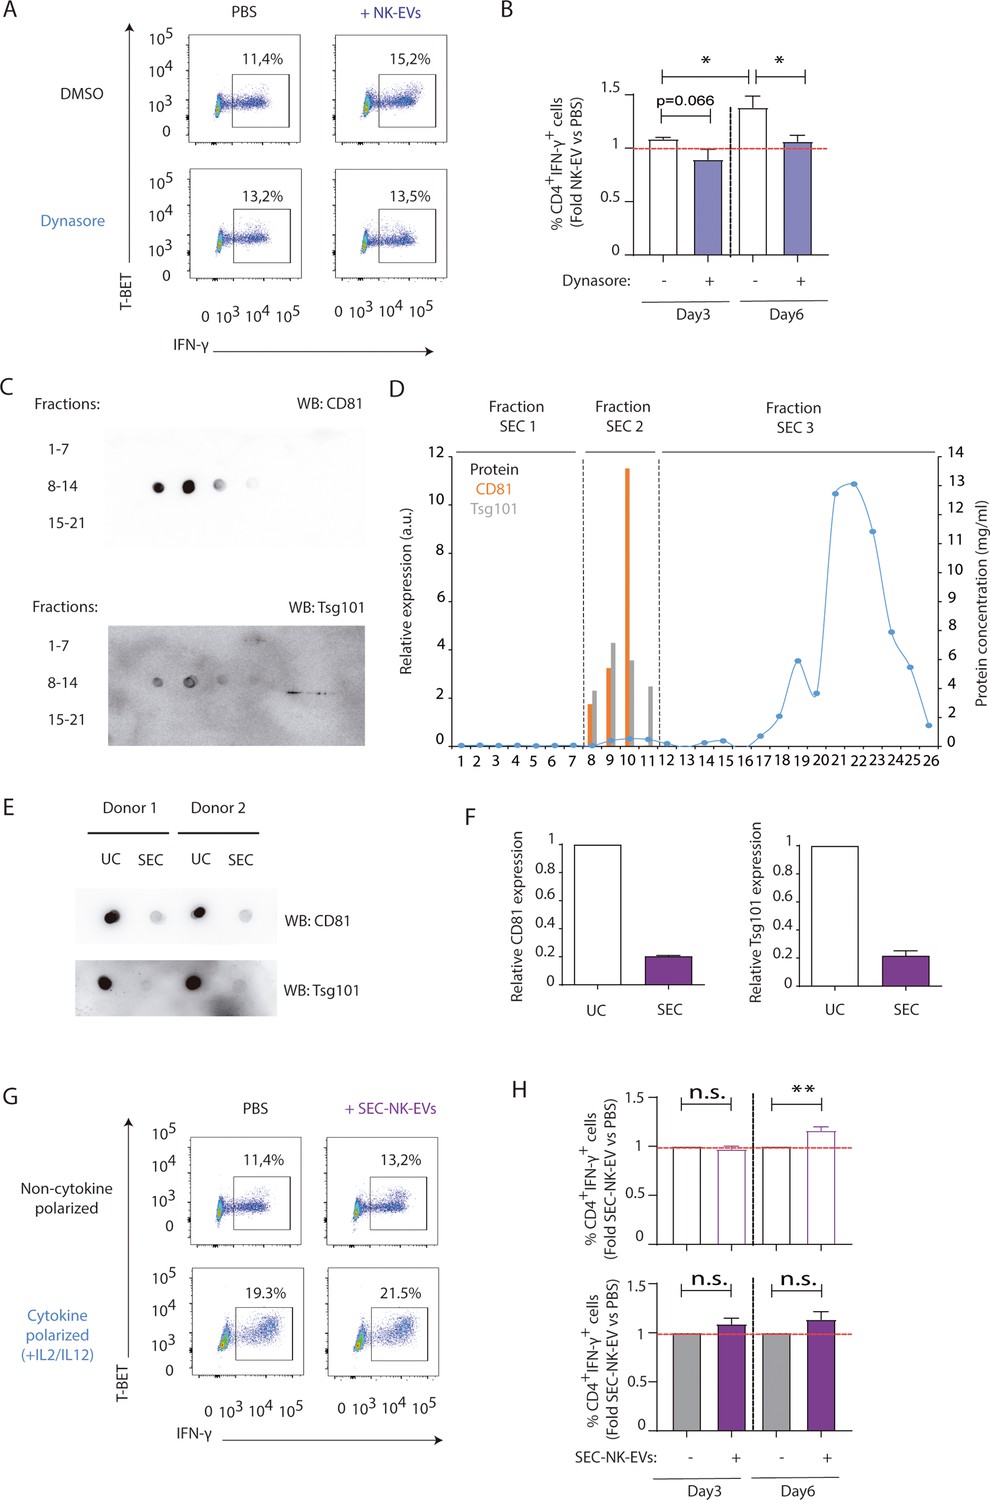
Extracellular vesicle (EV) uptake blockade using Dynasore and size-exclusion chromatography (SEC) analyses confirm the specificity of natural killer-derived EV (NK-EV) microRNAs (miRNAs) effects.
(A,B) Isolated CD4+ T cells were incubated with 80 µM of Dynasore prior to functional analyses. (A) Flow cytometry analysis showing T-BET and IFN-γ. A representative experiment is shown. (B) Bar charts plots show the quantification of T-BET and IFN-γ expression in gated live cells (i to anmedian values), normalizing NK-EV (obtained by ultracentrifugation, as previously described) to PBS-treated cells. Panel shows the quantification of n≥4 independent experiments. Significance was assessed with paired Student’s t-test; *p<0.05. (C–F) NK-EVs from activated NK cells were isolated by SEC. (C) Dot blot analyses of recovered fractions show the expression of the small EV markers CD81 and Tsg101 in fractions 8–11. (D) Quantification of the different fractions relative expression of CD81 and Tsg101, assessed by ImageJ software analysis of dot-plots, and protein concentration measured by Nanodrop. SEC fractions 8–11 (SEC2) were pooled and ultracentrifuged at 100,000× g functional analyses. (E). Dot blots of small EVs obtained by either ultracentrifugation or SEC were probed against the small EV markers Tsg101 and CD81. (F) Quantification of dot blots from (E). (G,H) Isolated CD4+ T cells were incubated with SEC-isolated NK-EVs. (G) Flow cytometry analysis showing T-BET and IFN-γ representative experiment is shown. (H) Bar charts show the quantification of T-BET and IFN-γ expression in gated live cells CD4+ T cells, normalizing NK-EV (obtained by SEC) to PBS-treated cells. Panel shows the quantification of n≥4 independent experiments. Significance was assessed with paired Student’s t-test; **p<0.01.
Figure 3—figure supplement 3
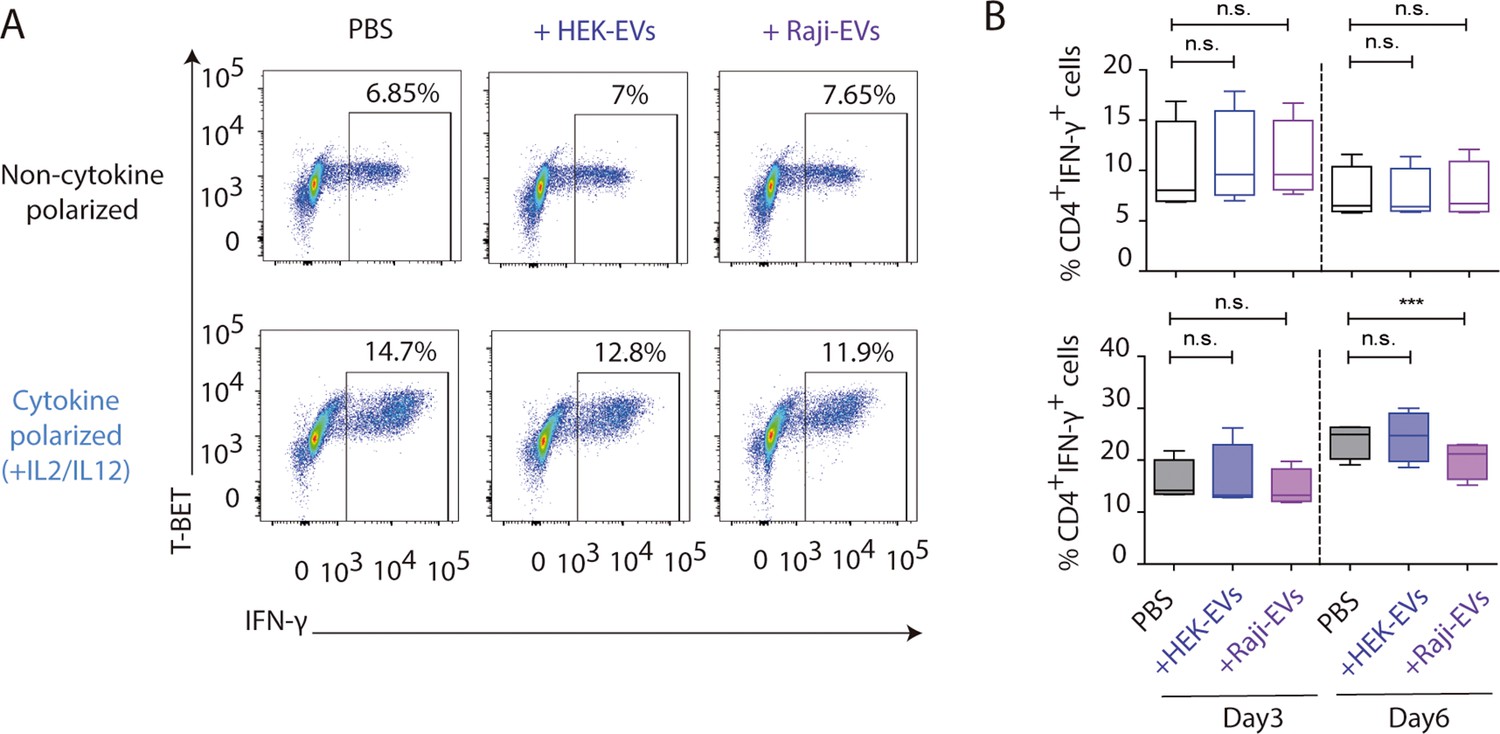
HEK and Raji-derived small extracellular vesicles (EVs) exhibit a distinct effect on T cell function than natural killer-derived EVs (NK-EVs).
Small EVs were isolated by differential ultracentrifugation from Raji and HEK human cell lines and their effects on isolated CD4+ T cells were analysed. (A) Flow cytometry analyses showing T-BET and IFN-γ expression in CD4+ T cells treated with either PBS, HEK-EVs, or Raji-EVs, as indicated, either in the presence or absence of Th1-polarizing cytokines. A representative experiment is shown. (B) Charts show the quantification of the percentage of CD4+ IFN-γ T cells in the different conditions from four independent experiments. Significance was assessed with paired Student’s t-test; ***p<0.001.
Figure 4 with 2 supplements
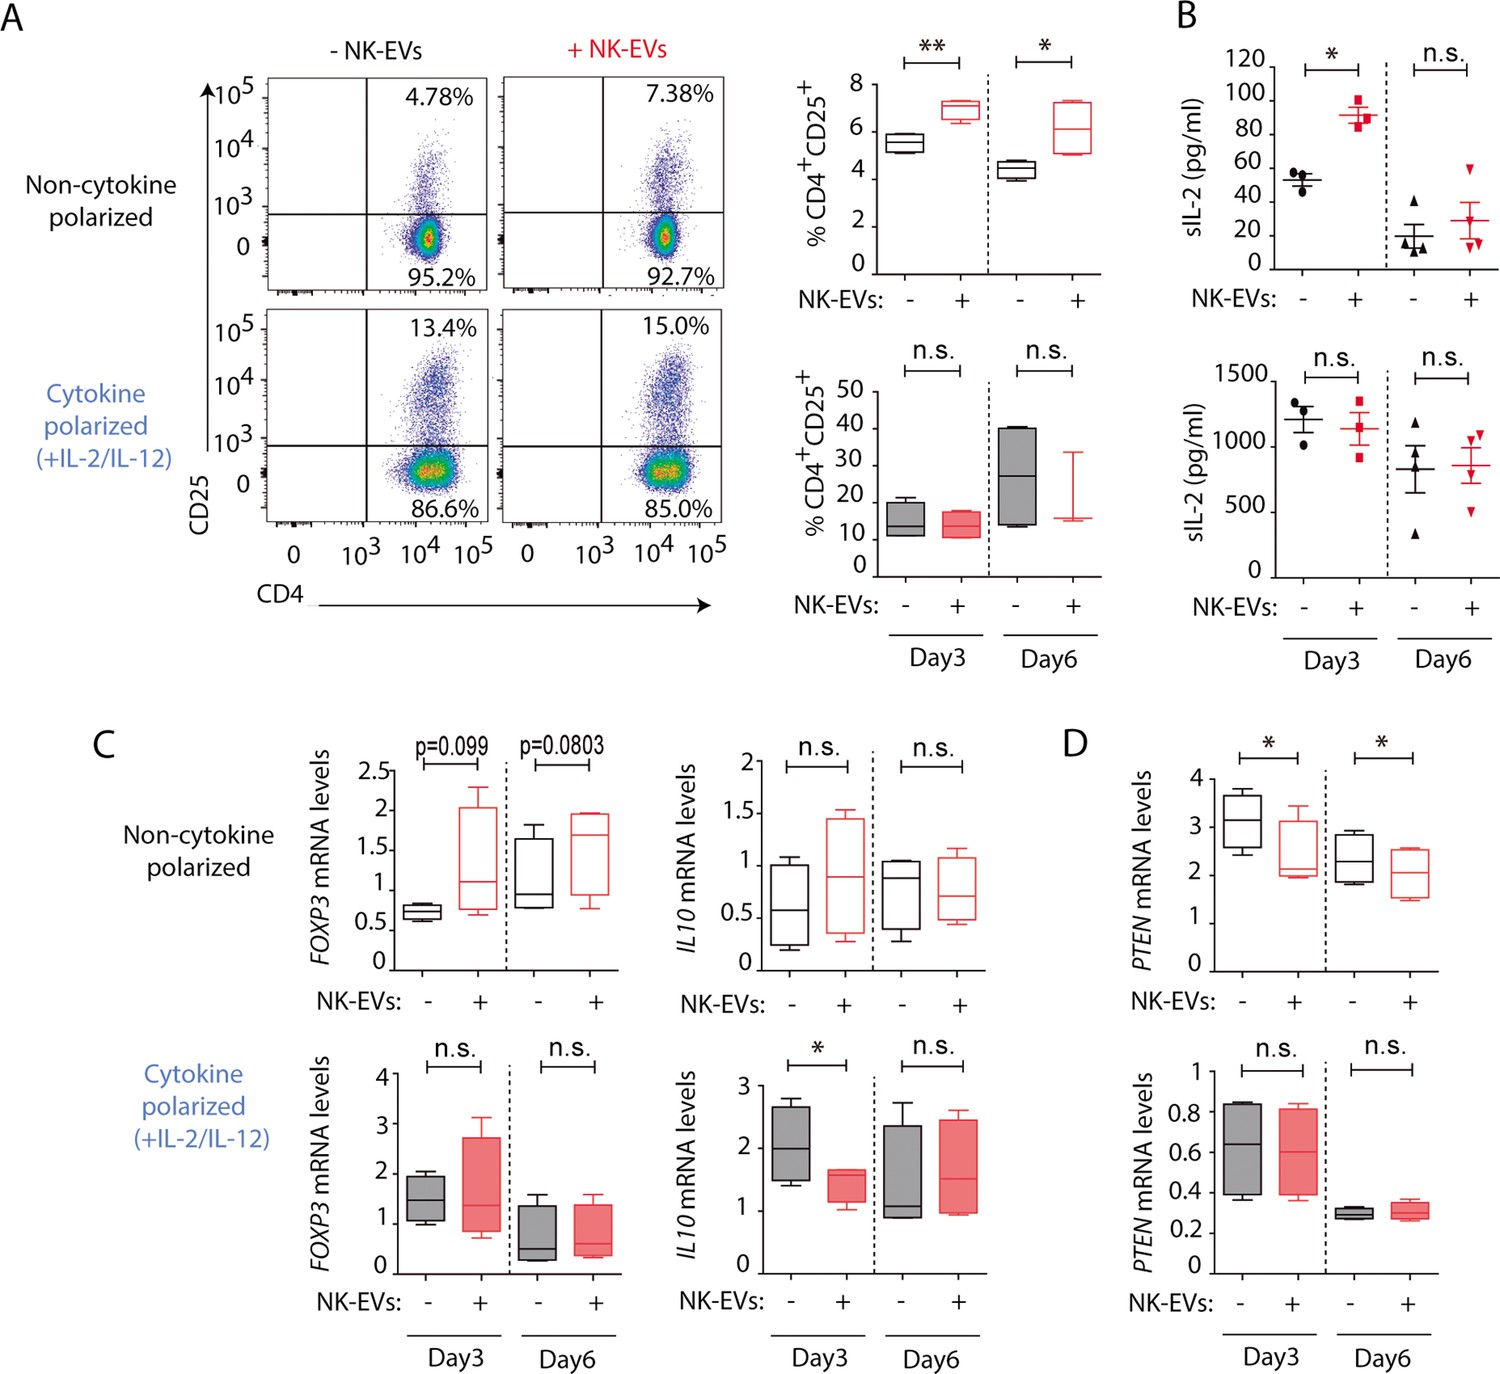
Natural killer-derived extracellular vesicles (NK-EVs) promote CD4+ T cell activation and IL-2 release but not regulatory T cell (Treg) responses.
(A) Flow cytometry analysis of isolated CD4+ T cells incubated under non-cytokine-polarizing (upper panel) and Th1 cytokine-polarizing (with a mixture of IL-2 and IL-12, lower panel) conditions. Dot plots show the expression of CD4 and CD25 in gated single live cells ± SEM, after addition of NK-EVs. Plots show the quantification of n≥4 independent experiments. Significance was assessed with paired Student’s t-test; *p<0.05, **p<0.01. (B) ELISA quantification of soluble IL-2 in supernatants from CD4+ cultured T cells in the indicated conditions (unpolarized, upper panel; cytokine polarized, lower panel). The graph shows the mean concentration from n≥3 independent experiments. Significance was assessed by paired Student’s t-test; *p<0.05. (C,D) Quantitative real-time PCR showing FOXP3 (C, left); IL10 (D, right) and PTEN (D) mRNA levels at days 3 and 6 in CD4+ T cells after culture in the indicated conditions. Relative expression is shown, normalized to GAPDH and ACTB. Significance was assessed by paired Student’s t test; *p<0.05.
Figure 4—figure supplement 1
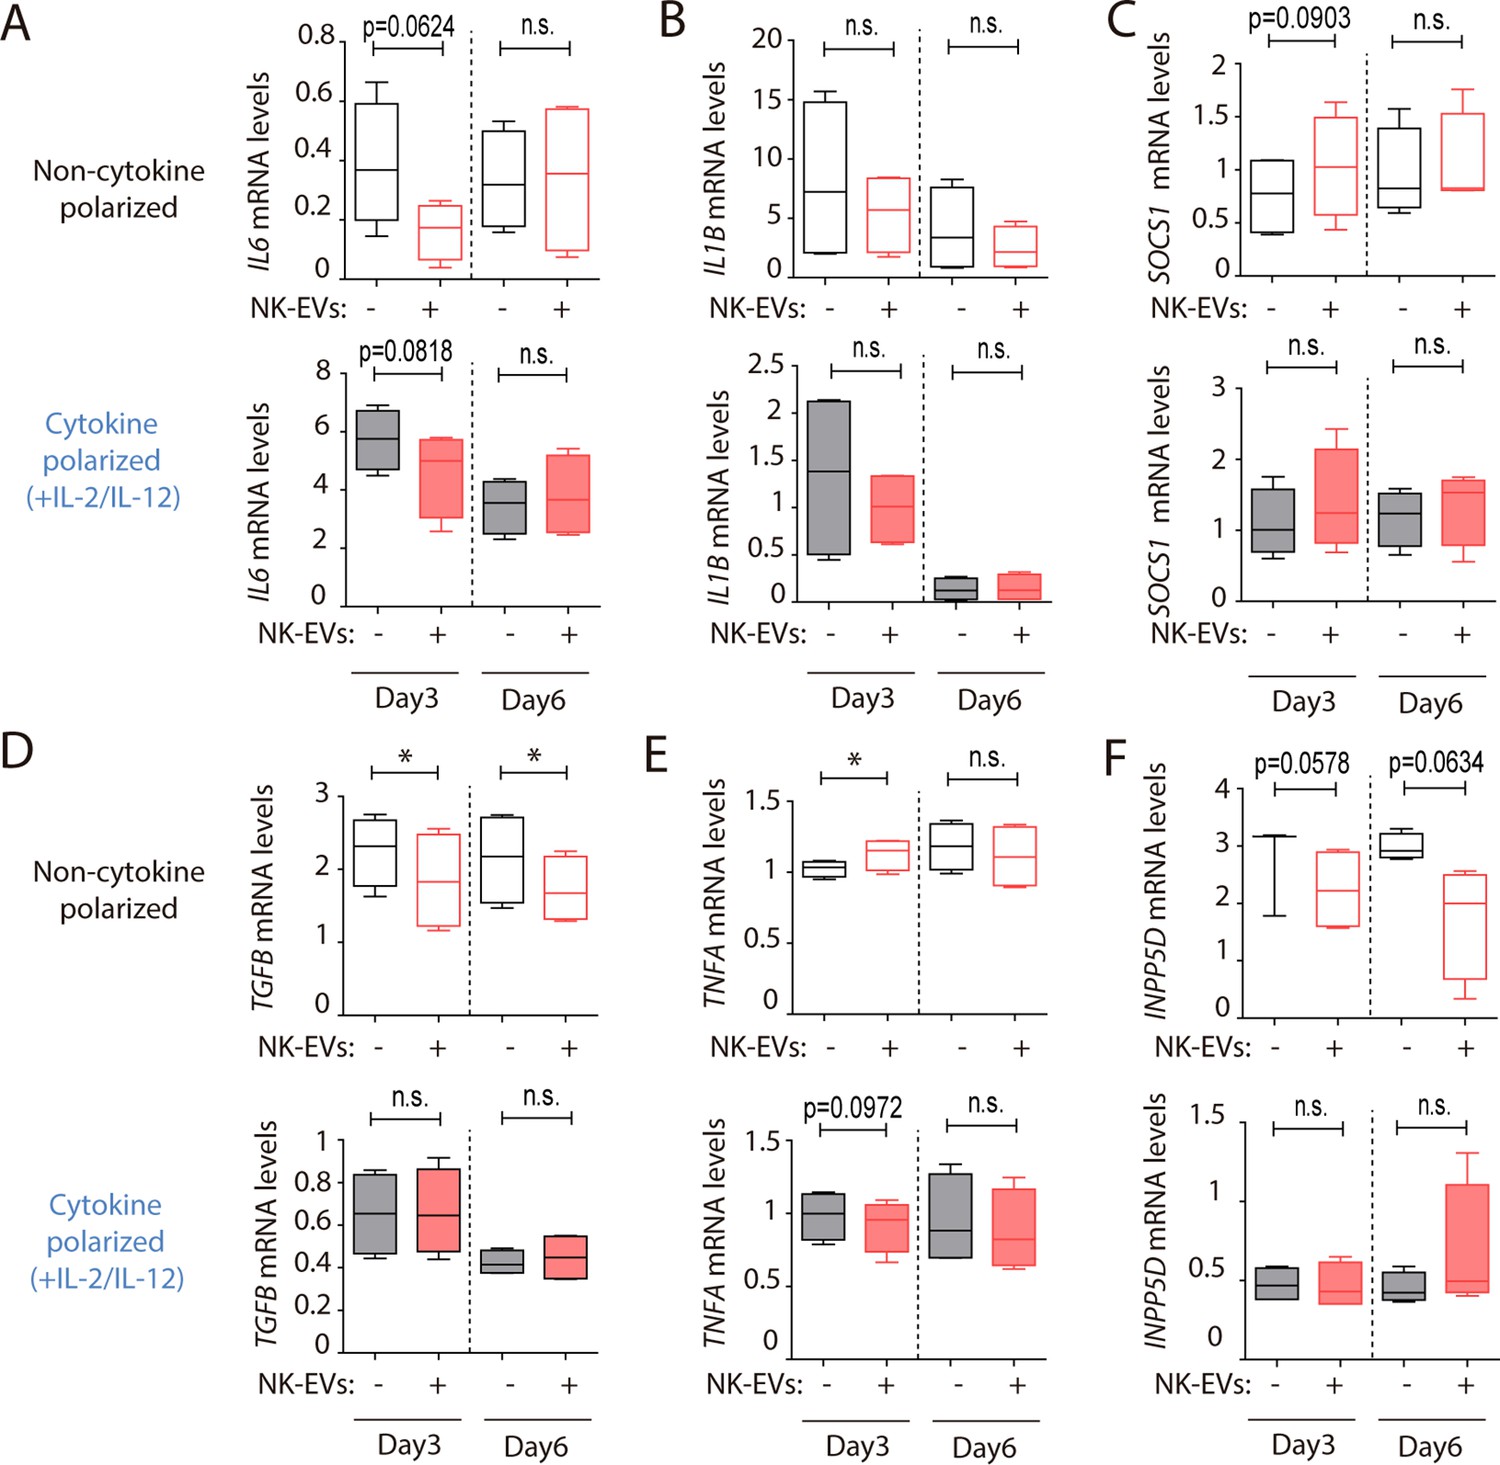
mRNA target modulation in CD4+ T cells mediated by natural killer-derived extracellular vesicles (NK-EVs).
(A–F) Quantitative real-time PCR at days 3 and 6, as indicated in either non-polarizing (upper panels) or cytokine-polarizing (lower panels) conditions, showing mRNA levels of IL6 (A), IL1B (B), SOCS1 (C), TGFB (D), TNFA (E), and INPP5D (F) respectively, normalized to GAPDH and ACTB. Significance was assessed with paired Student’s t test; *p<0.05.
Figure 4—figure supplement 2
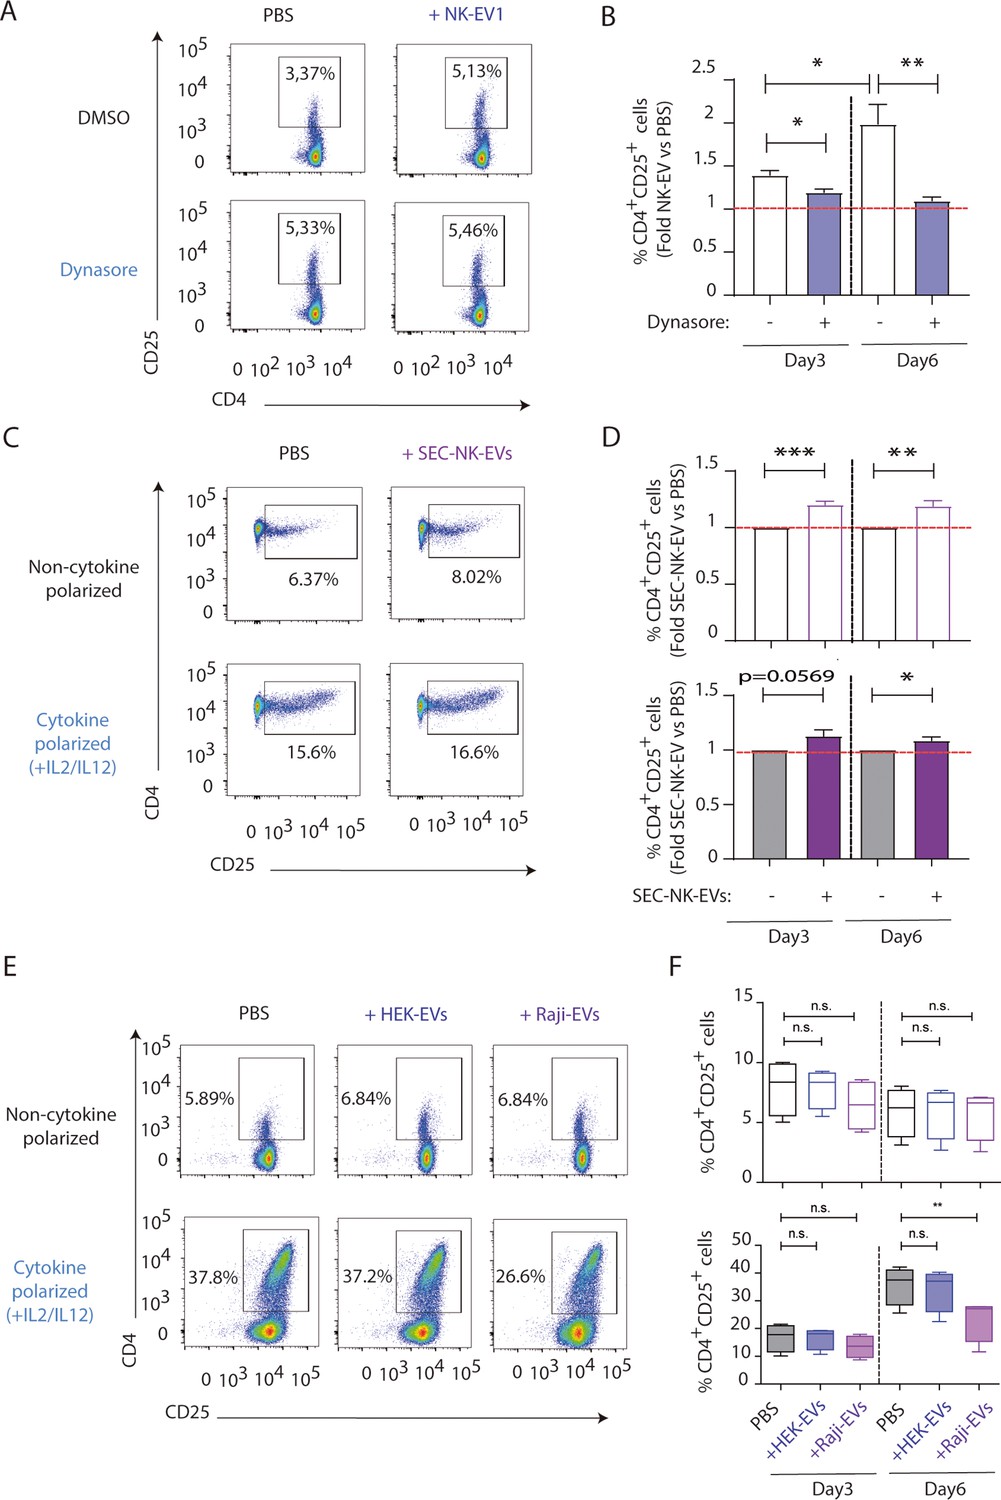
T cell activation is specific of natural killer-derived extracellular vesicles (NK-EVs).
(A,B) Isolated CD4+ T cells were incubated with 80 µM of Dynasore prior to functional analyses. (A) Flow cytometry analysis showing CD4 and CD25. A representative experiment is shown. (B) Bar charts plots show the percentage of CD4+ CD25+ cells in gated live T cells (min to max and median values), normalizing NK-EV (obtained by ultracentrifugation, as previously described) to PBS-treated cells. Panel show the quantification of n≥4 independent experiments. Significance was assessed with paired Student’s t-test; *p<0.05. (C,D) NK-EVs from activated NK cells were isolated by size-exclusion chromatography (SEC). (C) Flow cytometry analysis showing CD4 and CD25 expression. A representative experiment is shown. (D) Bar charts show the percentage of CD4+ CD25+ T cells, normalizing NK-EV (obtained by SEC) to PBS-treated cells. Panel shows the quantification of n≥4 independent experiments. Significance was assessed with paired Student’s t-test; *p<0.05, **p<0.01, **p<0.001. (E,F) Small EVs were isolated by differential ultracentrifugation from Raji and HEK human cell lines and their effects on isolated CD4+ T cells were analysed. (E) Flow cytometry analyses showing CD4 and CD25 expression in CD4+ T cells treated with either PBS, HEK-EVs, or Raji-EVs, as indicated, either in the presence or absence of Th1-polarizing cyokines. A representative experiment is shown. (F) Charts show the quantification of the percentage of CD4+ CD25+ T cells in the different conditions from four independent experiments. Significance was assessed with paired Student’s t-test; **p<0.01.
Figure 5 with 1 supplement
Natural killer-derived extracellular vesicles (NK-EVs) enhance monocyte and monocyte-derived dendritic cells (moDCs) polarization, costimulatory and presentation activities.
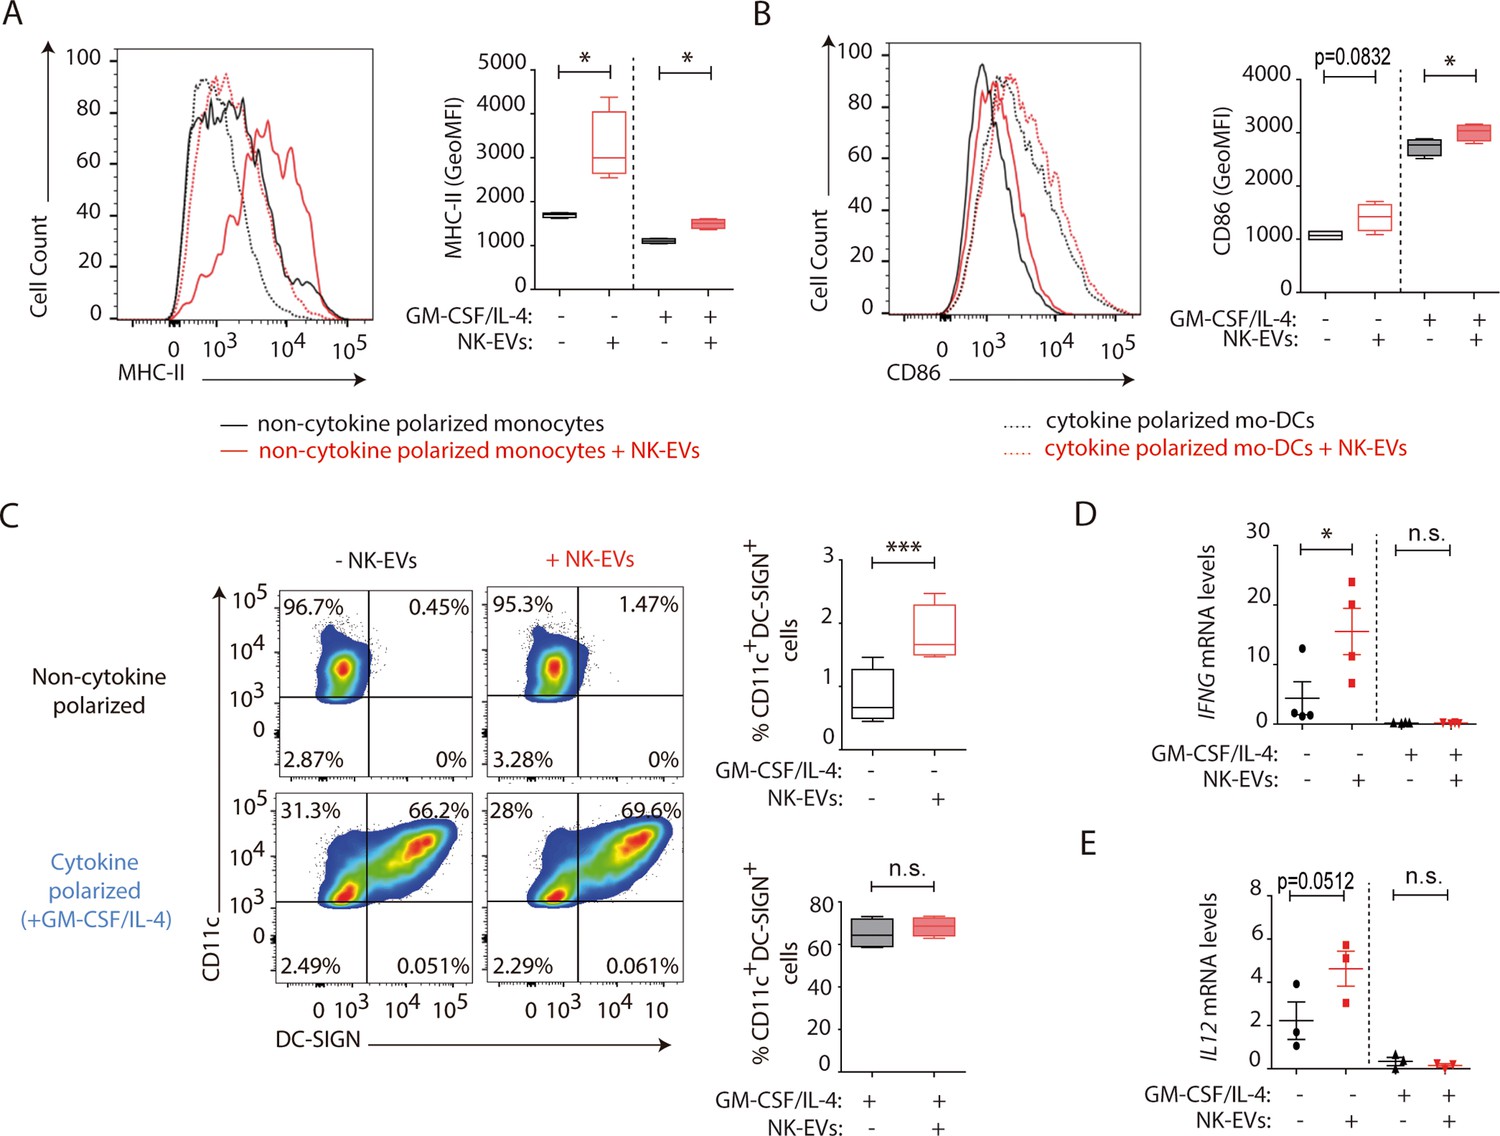
CD14+ monocytes isolated from buffy coats from healthy donors were cultured under non-polarizing and cytokine monocyte-derived DC-polarizing conditions, with a mixture of GM-CSF and IL-4, with or without NK-EVs. (A,B) Flow cytometry analysis of isolated CD14+ monocytes in the different culture conditions. Histogram plots show the expression of MHC-II (A) and CD86 (B), after 6 days of culture in the indicated conditions, either in the presence (dotted line) or absence (solid line) of polarizing cytokines. A representative plot of n≥4 experiments of the mean fluorescence intensity (MFI) of these proteins in live cultured cells (left panel), and their quantification (right panel) are shown. Significance was assessed by paired Student’s t test; *p<0.05. (C) Flow cytometry analysis of isolated CD14+ monocytes in the different culture conditions. Dot plots show the expression of CD11c and DC-SIGN in the indicated culture conditions (left panel) and their quantification (right panel). Significance was assessed by paired Student’s t test; ***p<0.001. (D,E) Quantitative real-time PCR showing IFNG (D) and IL12 (E) mRNA levels in CD14+ cells 6 days after culture in the indicated conditions. Relative expression is shown, normalized to GAPDH and ACTB. Significance was assessed by paired Student’s t test; *p<0.05.
Figure 5—figure supplement 1
Natural killer-derived extracellular vesicles (NK-EVs) impact on monocyte and monocyte-derived dendritic cell (moDC) function.
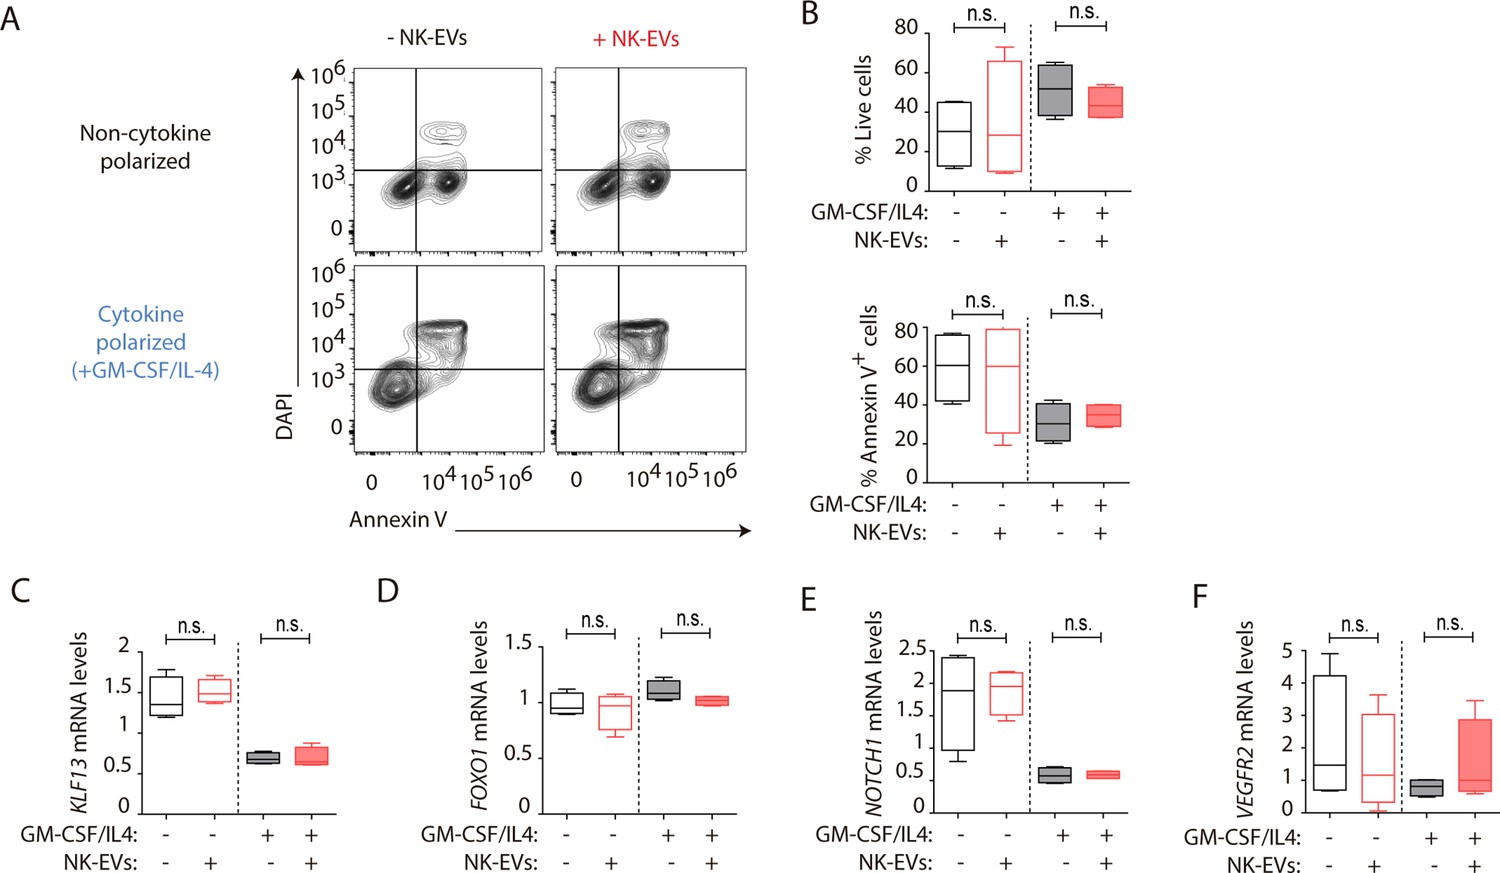
(A) Flow cytometry viability analysis of isolated CD14+ monocytes (non-polarized, upper panel) and moDCs (cytokine-polarized with a mixture of GM-CSF and IL-4, lower panel) in the indicated culture conditions. Contour plots show a representative staining with the viability marker DAPI and the apoptotic marker Annexin-V in cultured cells. (B) Plots show the quantification of live DAPI-Annexin-V-CD14+ monocytic cells ± SEM, in the different culture conditions and after addition of NK-EVs. Plots show the quantification of n≥4 independent experiments. Significance was assessed with paired Student’s t-test. (C–F) Quantitative real-time PCR at day 6, of isolated CD14+ monocytes, cultured as indicated in either non-polarizing or cytokine-polarizing conditions. Plots show the relative mRNA levels of the putative NK-EV microRNAs (miRNAs) mRNA targets KLF13 (C), FOXO1 (D), NOTCH1 (E), and VEGFR2 (F) respectively, normalized to GAPDH and ACTB. Significance was assessed with paired Student’s t test.
Figure 6 with 2 supplements
Natural killer-derived extracellular vesicle (NK-EV) T cell function-related microRNAs (miRNAs) partially mimic NK-EV-mediated effects in vivo.
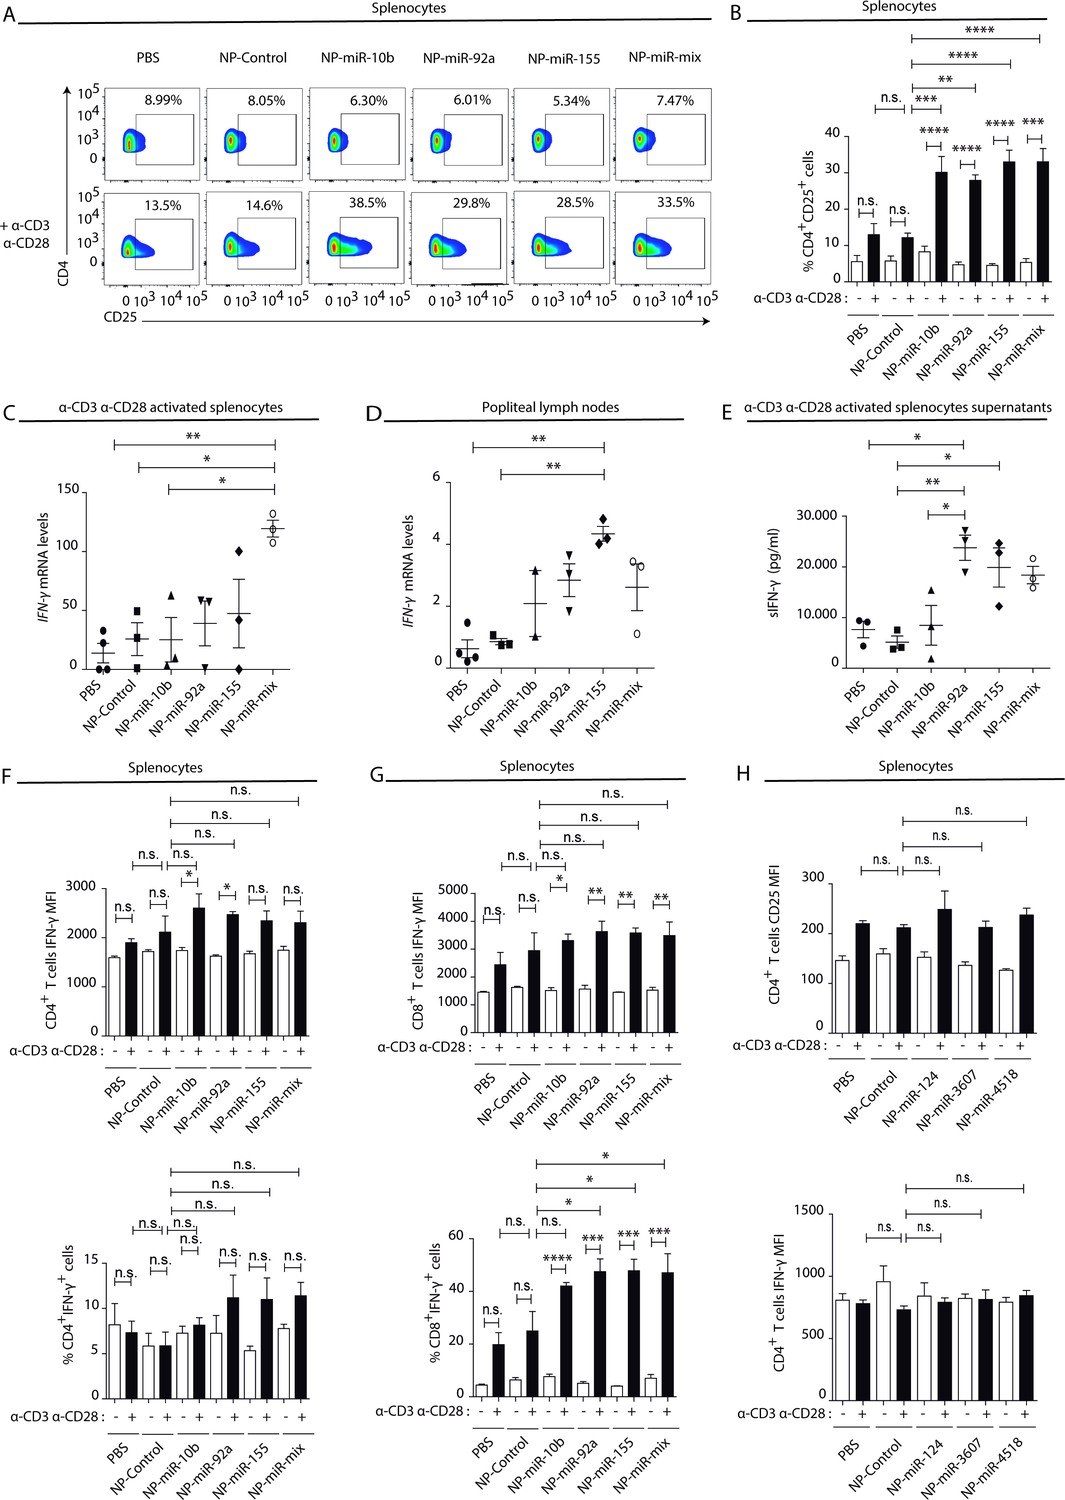
Nanoparticles (NPs) bearing the identified NK-EV miRNAs (miR-10b, miR-92a, and miR-155) were generated and their functional effects were evaluated in vivo after footpad injection of control and miRNA-loaded NPs in wild-type C57BL/6 mice. (A) Flow cytometry analysis of live splenocytes isolated 6 days after footpad injection with the indicated control or miRNA-loaded NPs. Isolated cells were either left unstimulated (upper panel) or incubated for 16 hr with anti-CD3 and anti-CD28 antibodies (lower panel) before analysis. Density plots show the expression of CD4 and CD25 in TCRβ+CD4+-gated live T lymphocytes. A representative plot of n≥3 mice is shown. (B) Bars summarize the quantification of the percentage of CD4+CD25+T cells shown in (A) from n≥3 mice in untreated splenocytes (white) and anti-CD3 plus anti-CD28 stimulated splenocytes (black). Significance was assessed by two-way ANOVA, followed by Tukey’s test; **p<0.01, ***p<0.001, ****p<0.0001. (C,D) Quantitative real-time PCR showing Ifng mRNA levels in anti-CD3 and anti-CD28-activated splenocytes (C) and draining popliteus lymph nodes (D), 6 days after footpad nanoparticle-based miRNA delivery. Relative expression is shown, normalized to Gapdh and Actb. Significance was assessed by one-way ANOVA Bonferroni test; *p<0.05, **p<0.01. (E) ELISA quantification of soluble IFN-γ in supernatants from splenocytes harvested and isolated 6 days after miRNA delivery and cultured with anti-CD3 and anti-CD28 antibodies for 16 hr. The graph shows the mean concentration from n≥3 independent experiments. Significance was assessed by one-way ANOVA Bonferroni test; *p<0.05, **p<0.01. (F,G). Upper panel bar charts show the mean fluorescence intensity (MFI) expression of IFN-γ and lower panels the percentage of IFN-γ expressing cells, analysed by flow cytometry in CD4+ T cells (F), CD8+ T cells (G). Splenocytes were either left unstimulated (white) or stimulated with anti-CD3 plus anti-CD28 antibodies for 16 hr (black). Significance was assessed by two-way ANOVA, followed by Tukey’s test; *p<0.05,**p<0.01, ***p<0.001, ****p<0.0001. (H) The effects of the non-NK-EV-associated control miRNAs (hsa-miR-124, hsa-miR-3607, and hsa-miR-4518) were also evaluated in vivo after footpad injection of control and miRNA-loaded NPs in immunocompetent wild-type C57BL/6 mice. Bar charts show the MFI expression of CD25 (upper panel) IFN-γ (lower panel), respectively, analysed by flow cytometry in CD4+ T cells. Significance was assessed by two-way ANOVA, followed by Tukey’s test.
Figure 6—figure supplement 1
Natural killer-derived extracellular vesicle (NK-EV) microRNAs (miRNAs) partially mimic NK-EV-mediated effects in vivo in spleen and draining popliteal lymph nodes.
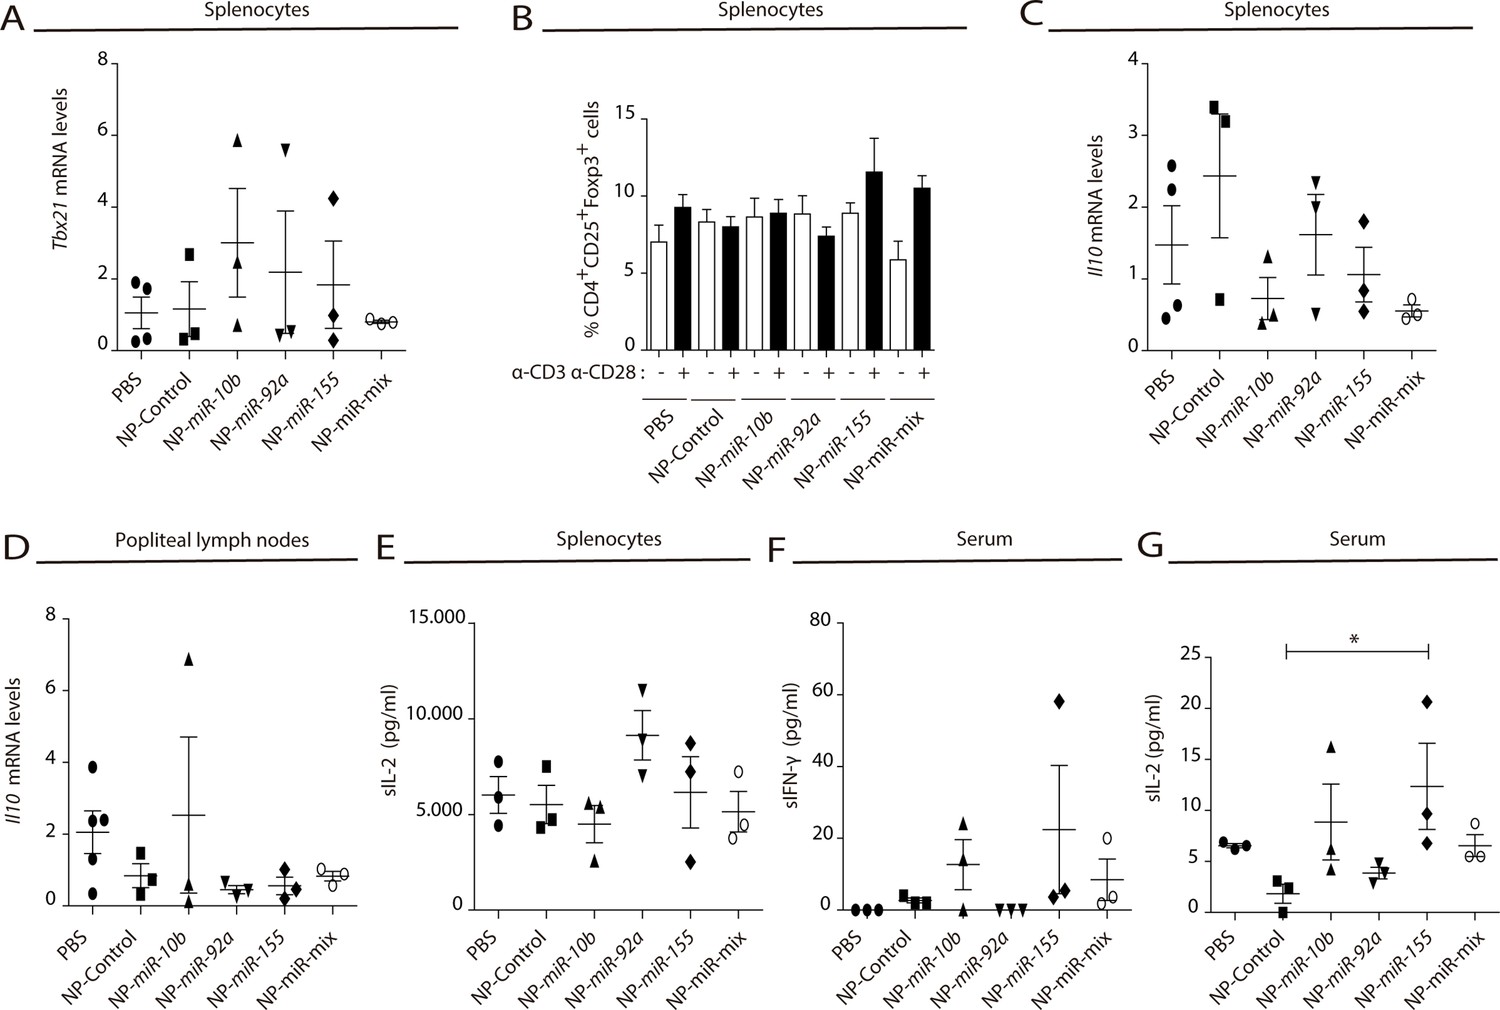
(A) Quantitative real-time PCR showing Tbx21 mRNA levels in splenocytes 6 days after nanoparticle-based miRNA delivery. Relative expression is shown, normalized to Gapdh and Actb. Significance was assessed by one-way ANOVA Bonferroni test. (B) Flow cytometry analysis of live splenocytes isolated 6 days after footpad injection with the indicated control or miRNA-loaded nanoparticles (NPs). Isolated cells were either left unstimulated (white) or incubated for 16 hr with anti-CD3 and anti-CD28 antibodies (black) before analysis. Bars show the percentage of CD4+CD25+Foxp3+live T lymphocytes. Experiments from n≥3 mice are shown. Significance was assessed by two-way ANOVA, followed by Tukey’s test. (C,D) Quantitative real-time PCR showing ll10 mRNA levels in splenocytes (C) and in popliteal draining lymph nodes (D) 6 days after nanoparticle-based miRNA delivery. Relative expression is shown, normalized to Gapdh and Actb. Significance was assessed by one-way ANOVA Bonferroni test. (E) ELISA quantification of soluble IL-2 in supernatants from splenocytes harvested and isolated after 6 days miRNA delivery and cultured with anti-CD3 and anti-CD28 antibodies for 16 hr. The graph shows the mean concentration from n≥3 mice per condition. Significance was assessed by one-way ANOVA Bonferroni test. (F,G) ELISA quantification of soluble IFN-γ (F) and IL-2 (G) in serum from mice 6 days after NP footpad injection. The graph shows the mean concentration from n≥3 mice per condition. Significance was assessed by one-way ANOVA Bonferroni test; *p<0.05.
Figure 6—figure supplement 2

Natural killer-derived extracellular vesicle (NK-EV) microRNAs (miRNAs) and non-NK-EV miRNA candidates loaded into gold nanoparticles.
(A,B) Heatmaps show the average expression of the NK-EV-enriched miRNAs has-miR10b-5p, has-miR-92a-3p, and has-miR-155-5p (A) and the miRNAs expressed at very low levels in NK-EVs comparing to their parental cell lines (B). These selected miRNAs were loaded onto gold nanoparticles for functional analyses.
Figure 7
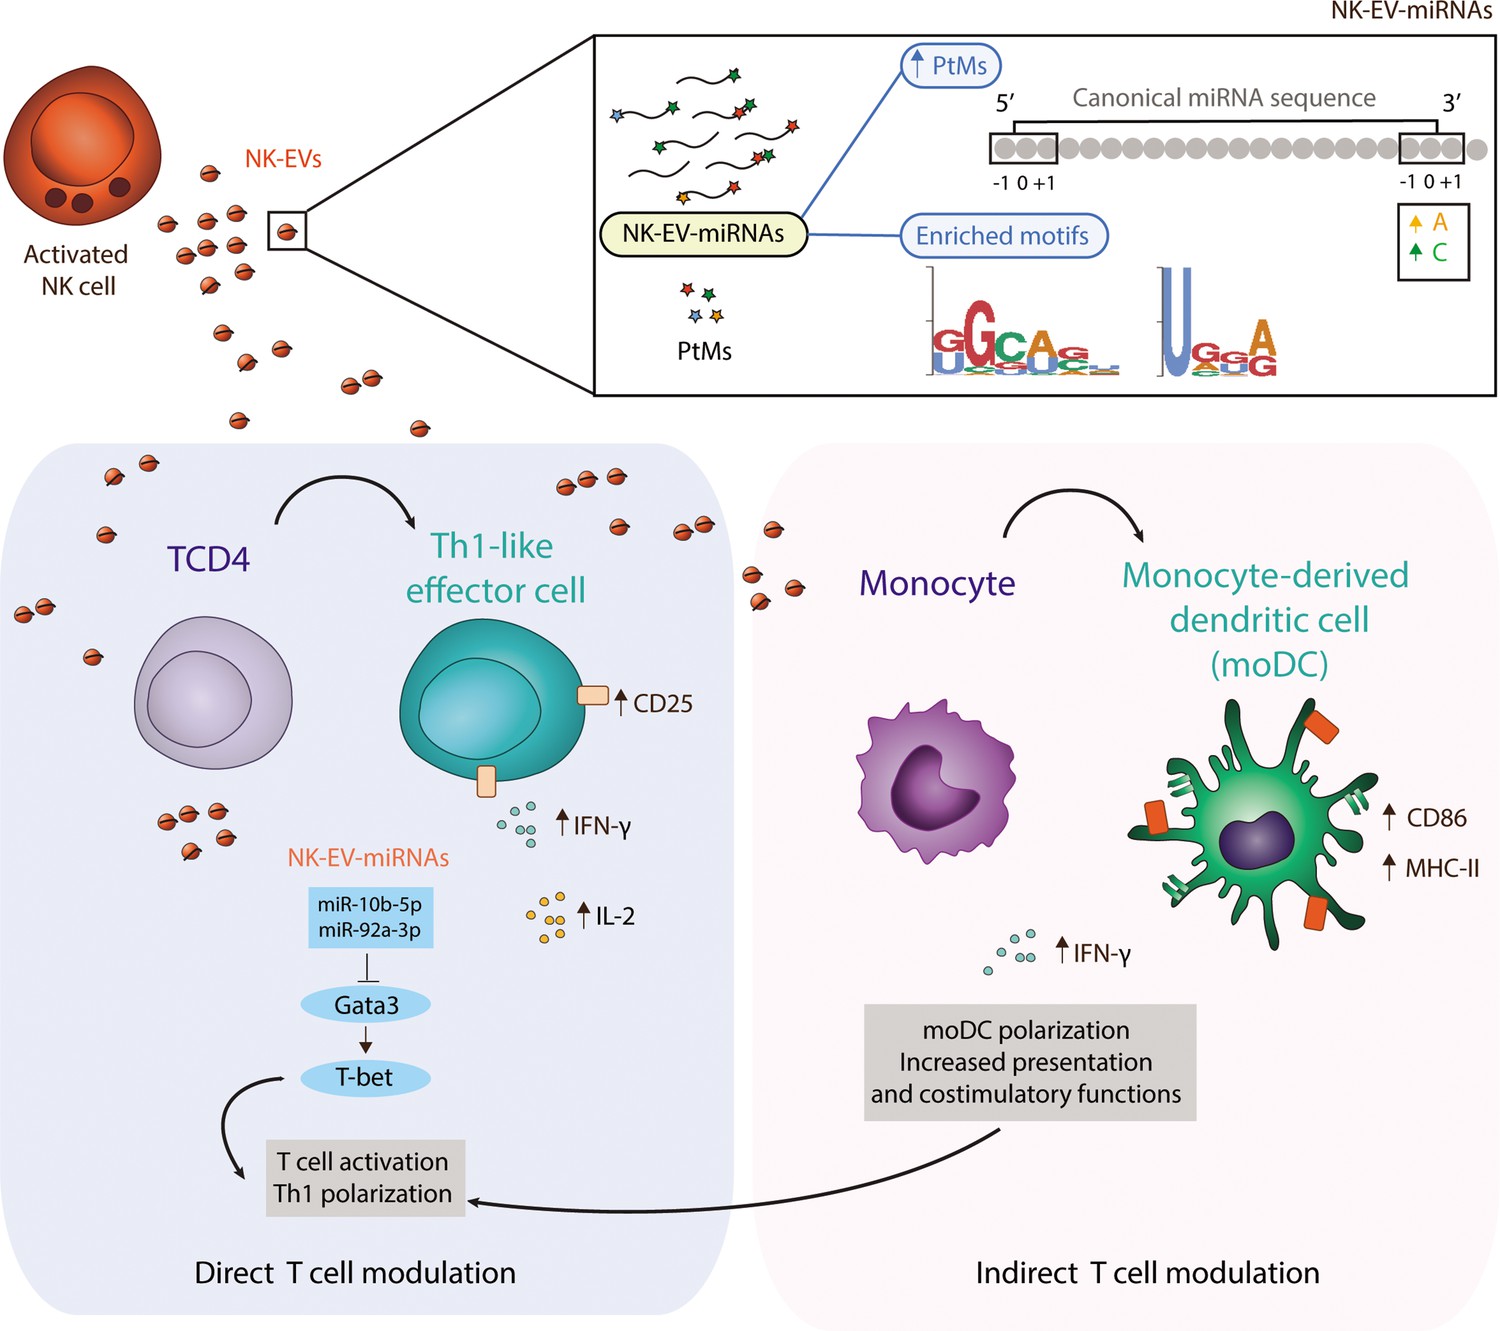
Natural killer-derived extracellular vesicle (NK-EV) microRNAs (miRNAs) promote Th1-like responses.
NK cells release small EVs that are enriched in post-transcriptionally modified miRNAs and specific short motifs. NK-EVs have a direct impact on T cells fate and function, promoting Th1-like responses, marked by increased levels of IFN-γ and IL-2 release. NK-EV-miRNAs miR-10b-5p and miR-92a-3p may account, at least partially, for the observed effects, via GATA3 downmodulation and subsequent T-bet de-repression that drives Th1 skewing. Additionally, NK-EVs promote monocyte polarization to monocyte-derived dendritic cells (moDCs) and enhance their presentation and costimulatory capacities, by upregulating MHC-II and CD86, respectively. This pathway also may contribute to the regulation of Th1-like responses mediated by NK-EVs.
Additional files
-
Supplementary file 1
Small RNA sequencing of resting natural killer (NK) and activated NK cells and their derived NK-extracellular vesicles (EVs).
Table summarizes the analysis of samples generated from five donors, showing differentially expressed microRNAs (miRNAs). Provided as an additional Excel file.
- https://cdn.elifesciences.org/articles/76319/elife-76319-supp1-v2.xlsx
-
Supplementary file 2
Natural killer-derived extracellular vesicle (NK-EV) microRNAs (miRNAs) mRNA target candidates.
Table summarizes putative mRNA targets for selected NK-EV miRNAs identified by in silico analyses, using the miRTarBase database. T cell function-related miRNAs are highlighted in orange and dendritic cell (DC)-related miRNAs in blue.
- https://cdn.elifesciences.org/articles/76319/elife-76319-supp2-v2.tif
-
Supplementary file 3
Antibodies and primers.
Specific primers for the detection of mRNA related with T cell functions are shown in orange and dendritic cell (DC) function-related miRNAs in blue. Housekeeping mRNAs are shown in grey.
- https://cdn.elifesciences.org/articles/76319/elife-76319-supp3-v2.xlsx
-
Supplementary file 4
Oligonucleotides for microRNAs (miRNA) duplex gold nanoparticles (AuNPs) design.
- https://cdn.elifesciences.org/articles/76319/elife-76319-supp4-v2.pptx
-
Transparent reporting form
- https://cdn.elifesciences.org/articles/76319/elife-76319-transrepform1-v2.pdf
Download links
A two-part list of links to download the article, or parts of the article, in various formats.
Downloads (link to download the article as PDF)
Open citations (links to open the citations from this article in various online reference manager services)
Cite this article (links to download the citations from this article in formats compatible with various reference manager tools)
Natural killer (NK) cell-derived extracellular-vesicle shuttled microRNAs control T cell responses
eLife 11:e76319.
https://doi.org/10.7554/eLife.76319


