Anatomical and functional connectivity support the existence of a salience network node within the caudal ventrolateral prefrontal cortex
- McLean Hospital, Harvard Medical School, United States
- University of Rochester School of Medicine & Dentistry, United States
- Massachusetts General Hospital, Harvard Medical School, United States
- Medical University of South Carolina, United States
- Translational Neuropscienc lab Division, Center for Biomedical Imaging and Neuromodulation, Nathan S. Kline Institute for Psychiatric Research, United States
- Nash Family Department of Neuroscience and Friedman Brain Institute, Icahn School of Medicine at Mount Sinai, United States
- Department of Psychiatry, New York University at Langone, United States
- Department of Psychiatry, Columbia University Medical Center, United States
Figures
Figure 1

Injection sites.
(A) Location of 8 injection locations in the vlPFC selected for retrograde analysis. Seven cases were analyzed as the main results (red), and one case was used as validation (yellow). Injection locations in (B) the dACC and (C) the AI selected for anterograde validation of the salience node. Abbreviations: arsp = arcuate sulcus spur; cc = corpus callosum; cgs = cingulate sulcus; cs = circular sulcus; iar = inferior arcuate sulcus; ls = lateral sulcus; los = lateral orbital sulcus; mos = medial orbital sulcus; ps = principal sulcus; rs = rostral sulcus; sar = superior arcuate sulcus.
Figure 2 with 2 supplements
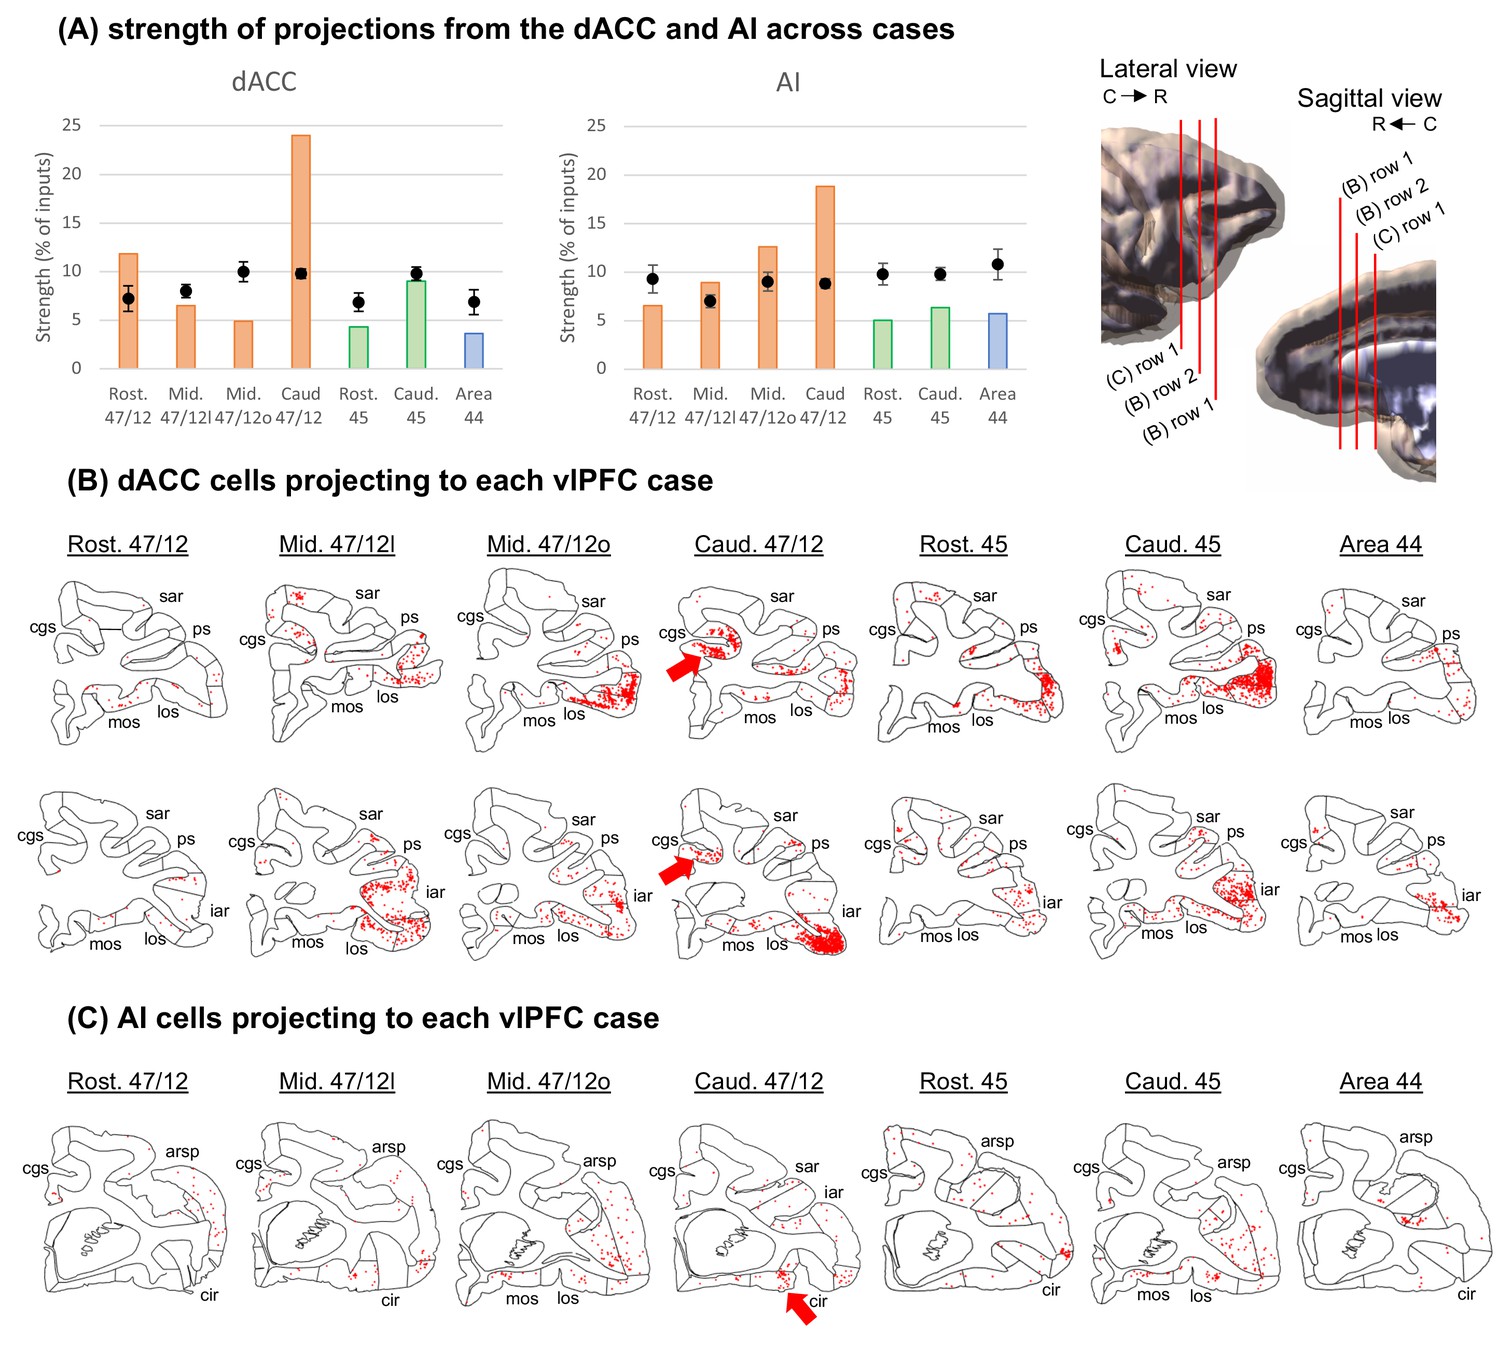
Strength of projections from Salience Network cortical nodes grouped by cytoarchitectonic divisions across cases.
(A) The dACC corresponds to area 24, while the AI is the combination of areas OPAl, Opro, IPro, and AI. Orange bars illustrate cases with injections in area 47/12, green bars in area 45, and blue bars in area 44. Black dots show the average and standard-deviation of random sampling from the respective areas in each case. 3D models represent the location of coronal slices from figures B-C. Coronal sections and the respective labeled cells (red dots) in the (B) dACC and (C) AI projecting to the caudal area 47/12 in the vlPFC. The black circles represent the areas of interest for the Salience Network. Abbreviations: arsp = arcuate sulcus spur; cgs = cingulate sulcus; cir = circular sulcus; iar = inferior arcuate sulcus; los = lateral orbital sulcus; mos = medial orbital sulcus; ps = principal sulcus; sar = superior arcuate sulcus.
Figure 2—figure supplement 1

Strength of projections from the frontal and insular cortices to different regions of the vlPFC.
Bars are sorted from stronger to weaker projections in each case. Orange bars illustrate cases with injections in area 47/12, green bars in area 45, and blue bars in area 44. Black dots show the average and standard-deviation of random sampling from the respective areas in each case. Red squares highlight cytoarchitectonic areas relevant for the Salience Network.
Figure 2—figure supplement 2
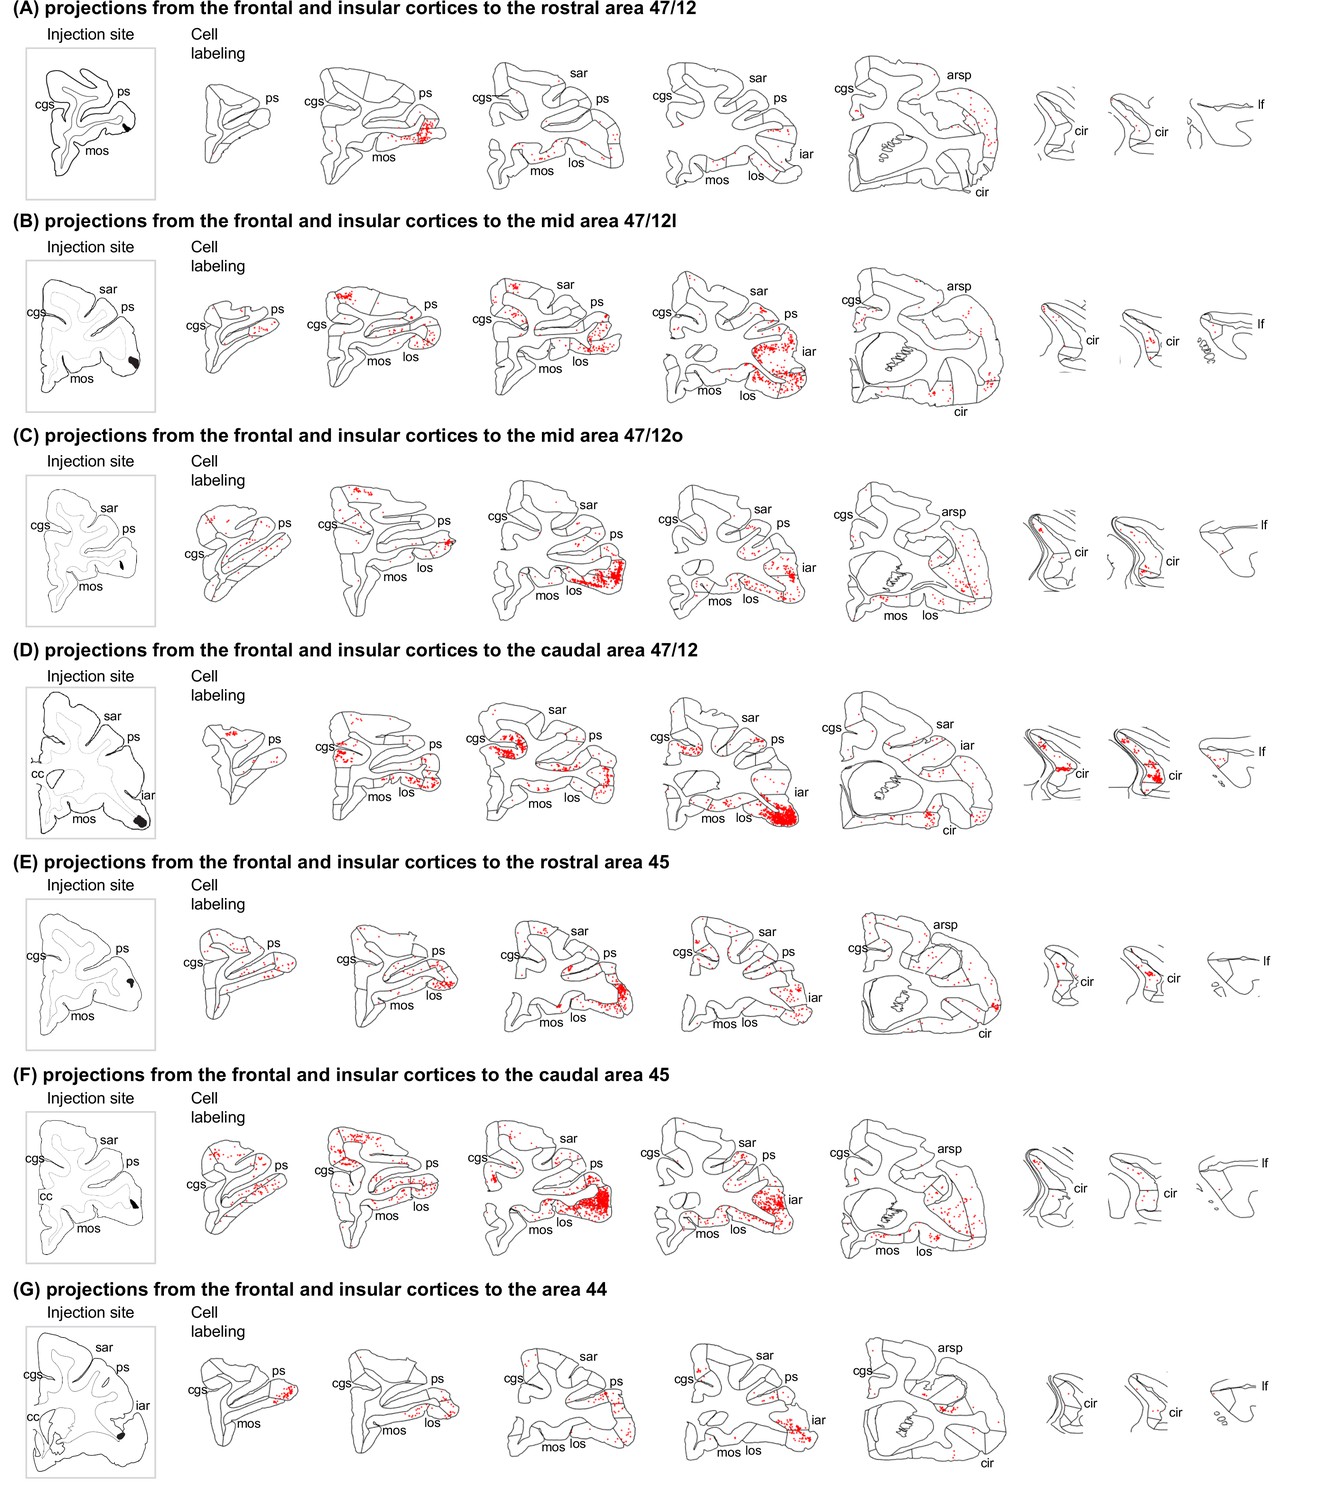
Labeled input neurons following retrograde tracer injections in different vlPFC locations.
(A–G) Injection locations and retrogradely labeled cells in the main vlPFC cases. Each line contains rostral to caudal coronal sections and the respective labeled cells (red dots) from one case. Sections of the same column have matching locations along the rostro-caudal axis. The last three columns correspond to the IC. Abbreviations: arsp = arcuate sulcus spur; cgs = cingulate sulcus; cir = circular sulcus; iar = inferior arcuate sulcus; lf = lateral fissure; los = lateral orbital sulcus; mos = medial orbital sulcus; ps = principal sulcus; sar = superior arcuate sulcus.
Figure 3 with 1 supplement
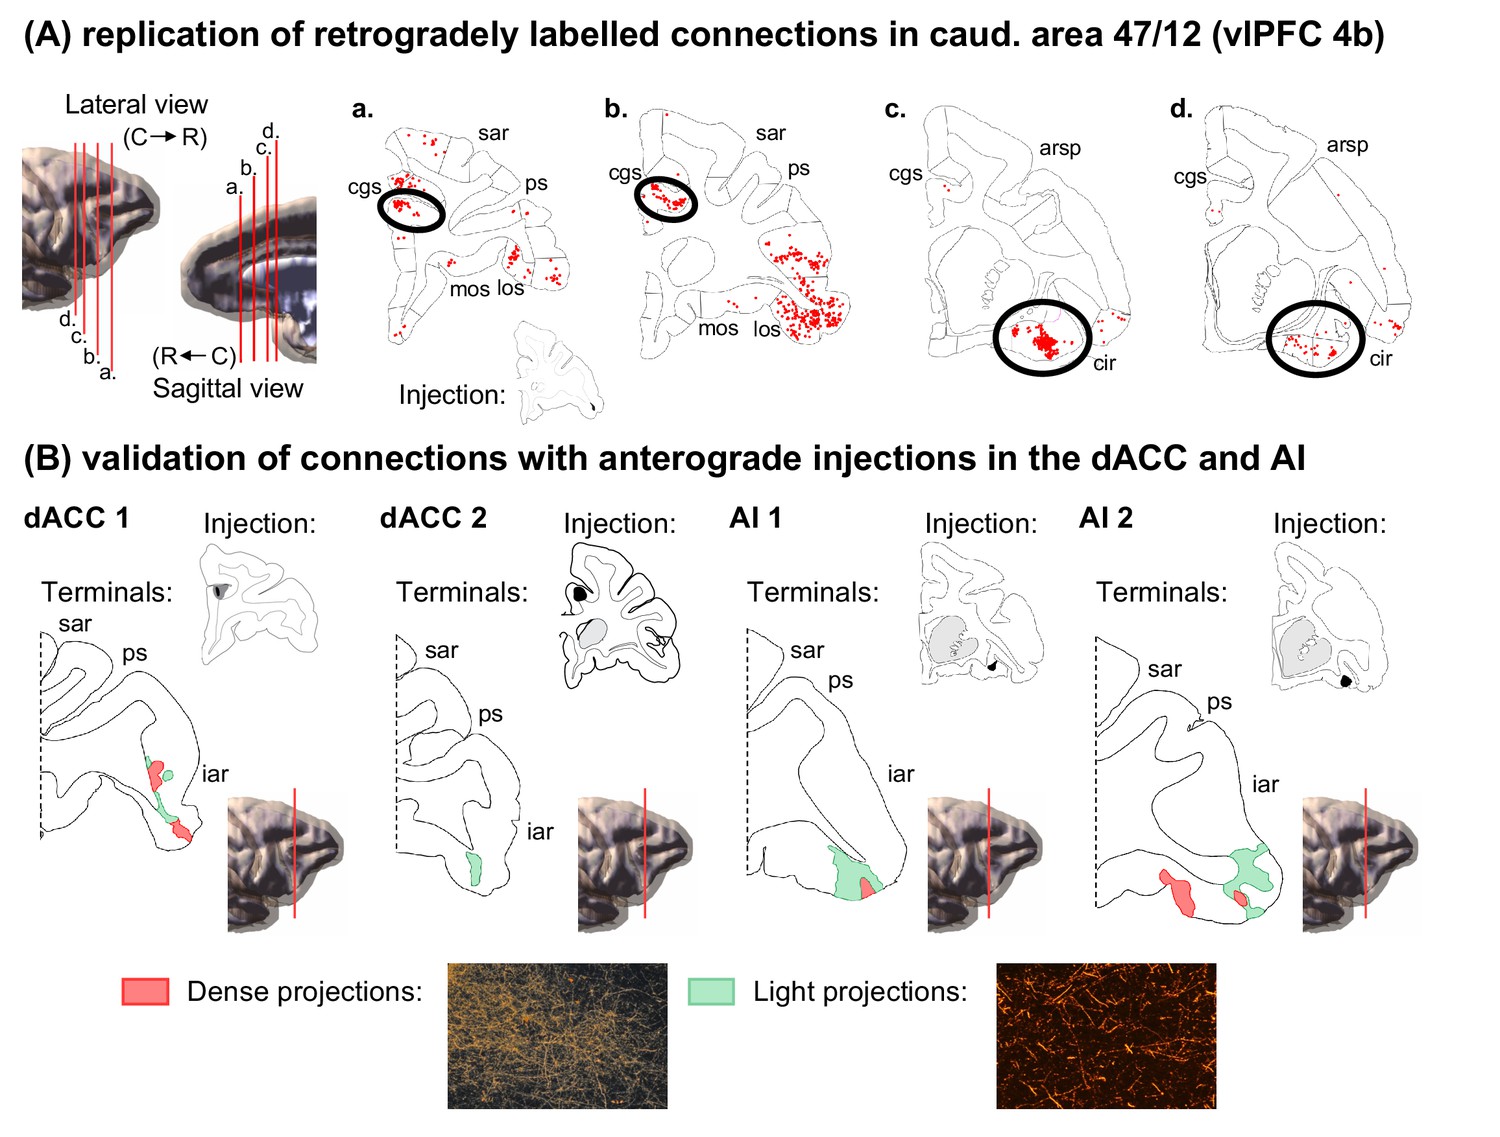
Anatomical replication and validation of the caudal 47/12 as a salience network node.
(A) Coronal sections and the respective labeled cells (red dots) from the validation retrograde tracing injection in caudal 47/12 (case 4b). 3D models represent the location of coronal slices. (B) Coronal sections and the respective labeled terminal fields from the validation anterograde tracer injections in the dACC and AI (red areas correspond to dense axonal projections and green areas to light axonal projections). Abbreviations: arsp = arcuate sulcus spur; cgs = cingulate sulcus; cir = circular sulcus; iar = inferior arcuate sulcus; los = lateral orbital sulcus; mos = medial orbital sulcus; ps = principal sulcus; sar = superior arcuate sulcus.
Figure 3—figure supplement 1
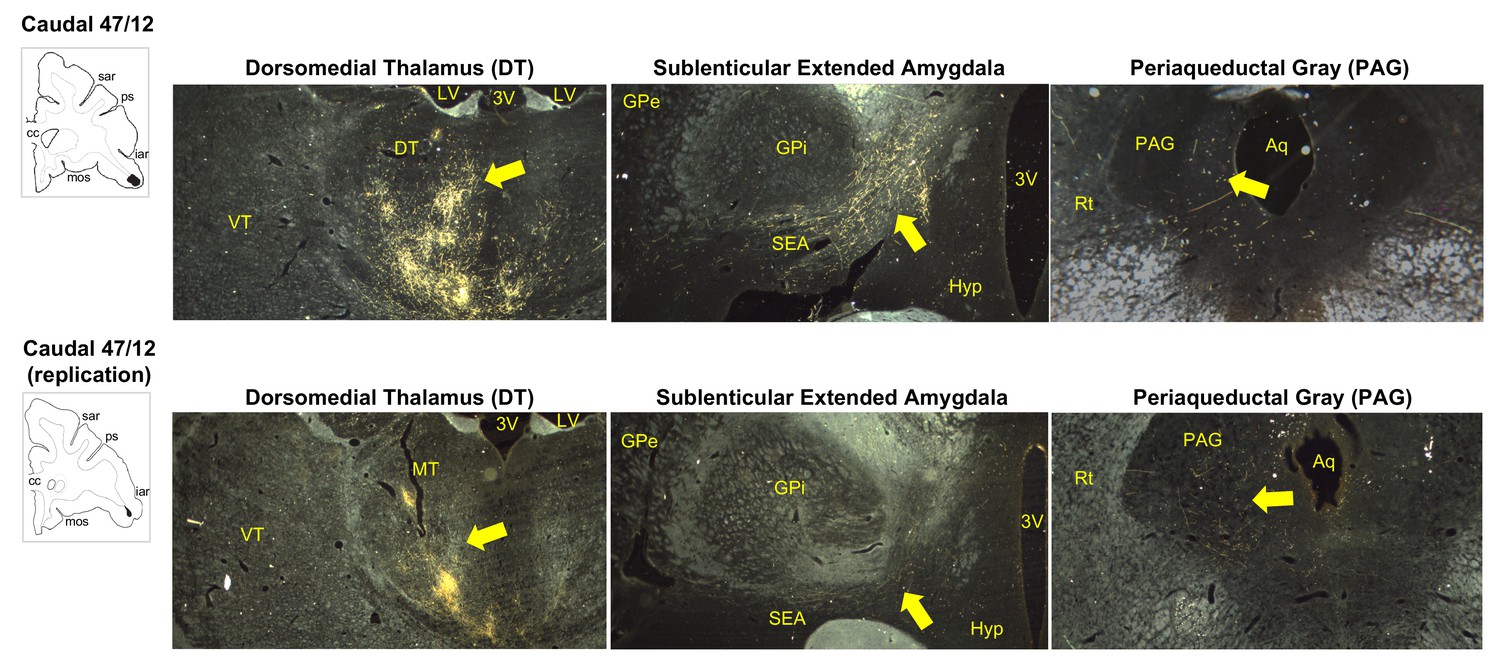
Terminal fields from injections in caudal vlPFC area 47/12 within the dorsomedial thalamus (1 x amplification), sublenticular extended amygdala (1 x), and periaqueductal gray (2 x).
Abbreviations: 3V=3 rd ventricle; Aq = Aqueduct; DT = Dorsomedial thalamus; GPe = Globus pallidus ext.; GPi = Globus pallidus int.; Hyp = Hypothalamus; LV = lateral ventricle; PAG = Periaqueductal gray; Rt = Reticular formation; SEA = Sublenticular extended amygdala; SP = superior peduncle; VT = Ventralposterior thalamus.
Figure 4 with 1 supplement
Functional connectivity analysis in the macaque brain.
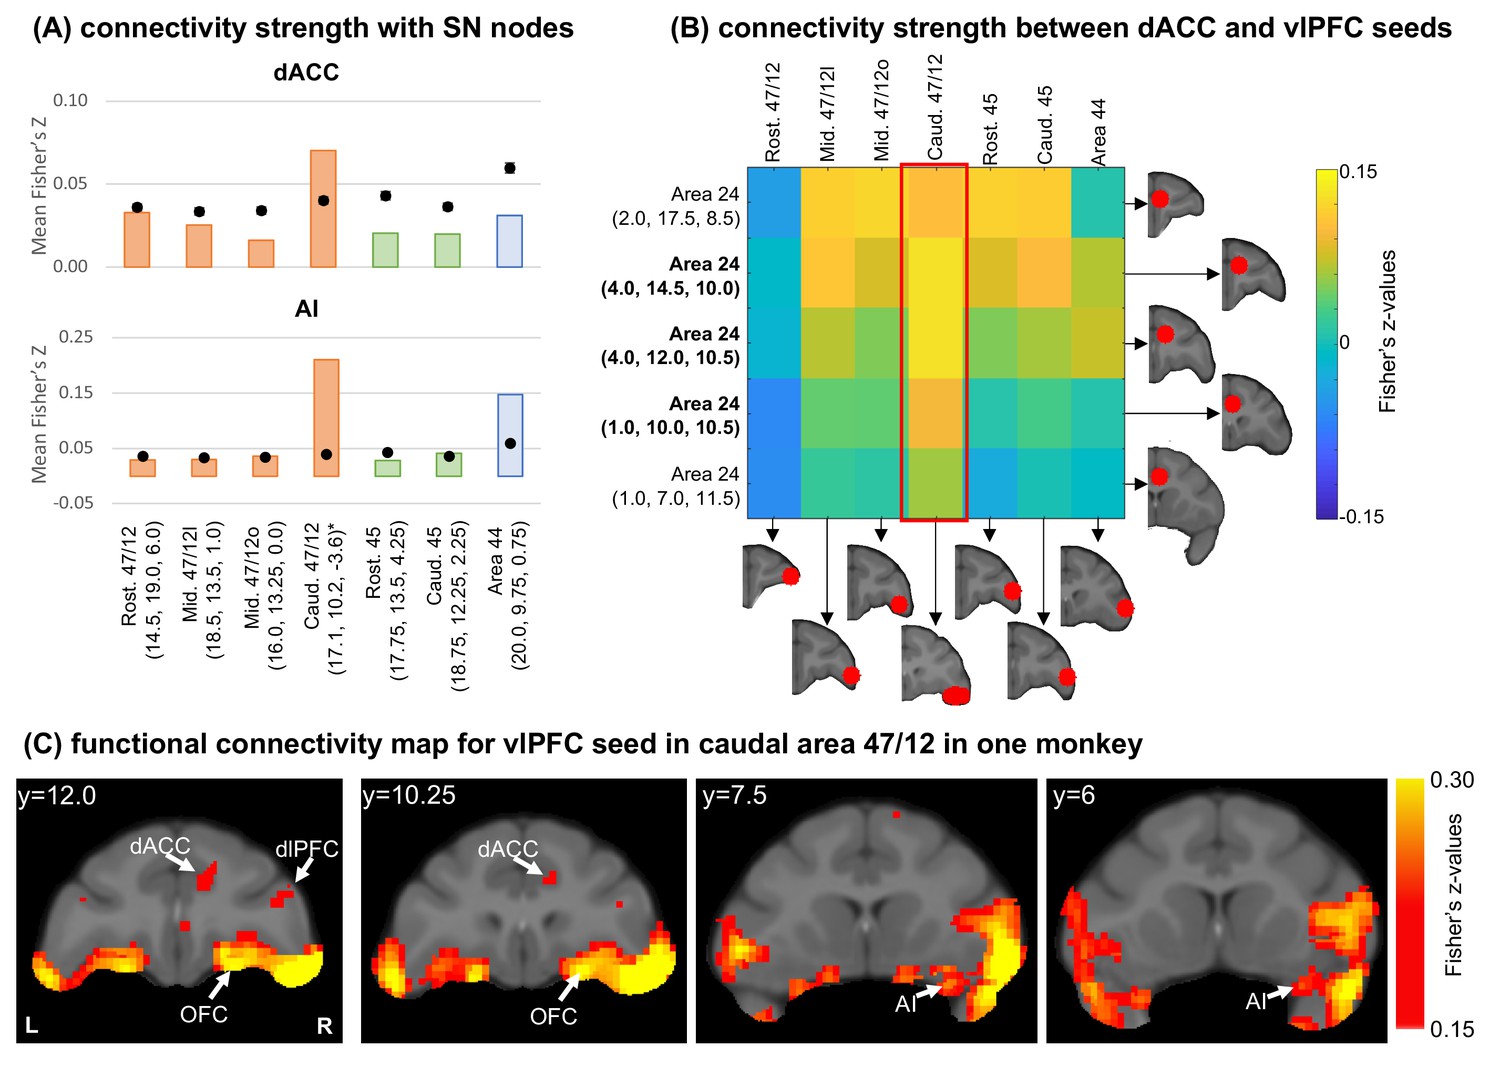
(A) Average connectivity strength (Fisher’s Z-values) between vlPFC seeds and the dACC and AI masks. Orange bars illustrate cases with injections in area 47/12, green bars in area 45, and blue bars in area 44. Black dots show the average and standard-deviation of the voxel permutation analysis. *Centroid’s coordinates (please see Figure 4—figure supplement 1B for individual seed locations). (B) Connectivity strength (Fisher’s Z-values) between dACC and vlPFC seeds. In bold the seeds overlapping with the dACC mask. The red frame indicates the connectivity strength between caudal 47/12 and the different dACC seeds. (C) Different views of the voxel distribution for the caudal 47/12 seed from one monkey.
Figure 4—figure supplement 1

Macaque fMRI analysis.
(A) dACC and AI masks created for connectivity strength analysis. Coordinates are in the MNI template. (B) Caudal 47/12 seeds for individual monkeys in the macaque MNI template. The panel in the right shows how the seeds overlap. Yellow = monkey 1; Blue = monkeys 2 and 3; Green = monkey 3; Red = monkey 5. Green lines show the centroid location.
Figure 5 with 1 supplement
Functional connectivity analysis in the human brain.
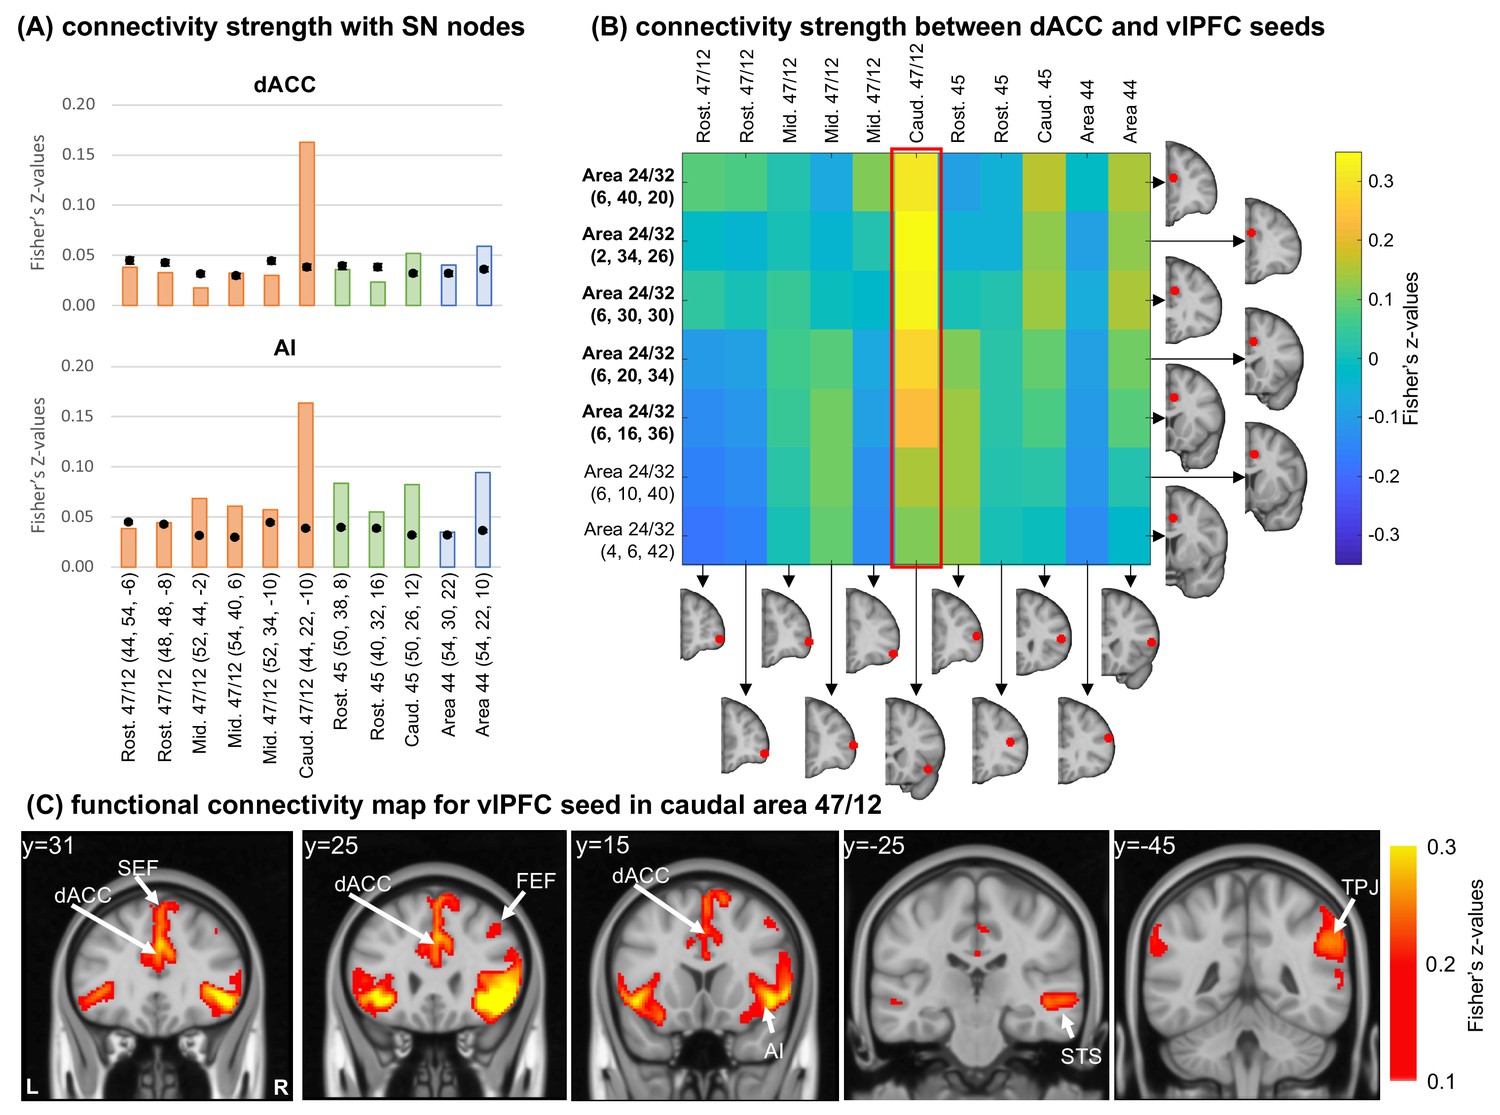
(A) Average connectivity strength (Fisher’s Z-values) between vlPFC seeds and the dACC and AI masks. Orange bars illustrate cases with injections in area 47/12, green bars in area 45, and blue bars in area 44. Black dots show the average and standard-deviation of the voxel permutation analysis. The red frame indicates the connectivity strength between the caudal 47 seed and the dACC seeds. (B) Connectivity strength (Fisher’s Z-values) between dACC and vlPFC seeds. In bold the seeds overlapping with the dACC mask. (C) Different views of the voxel distribution for the caudal 47/12 seed. All coordinates are in the human MNI space.
Figure 5—figure supplement 1
Replication of human fMRI analysis.
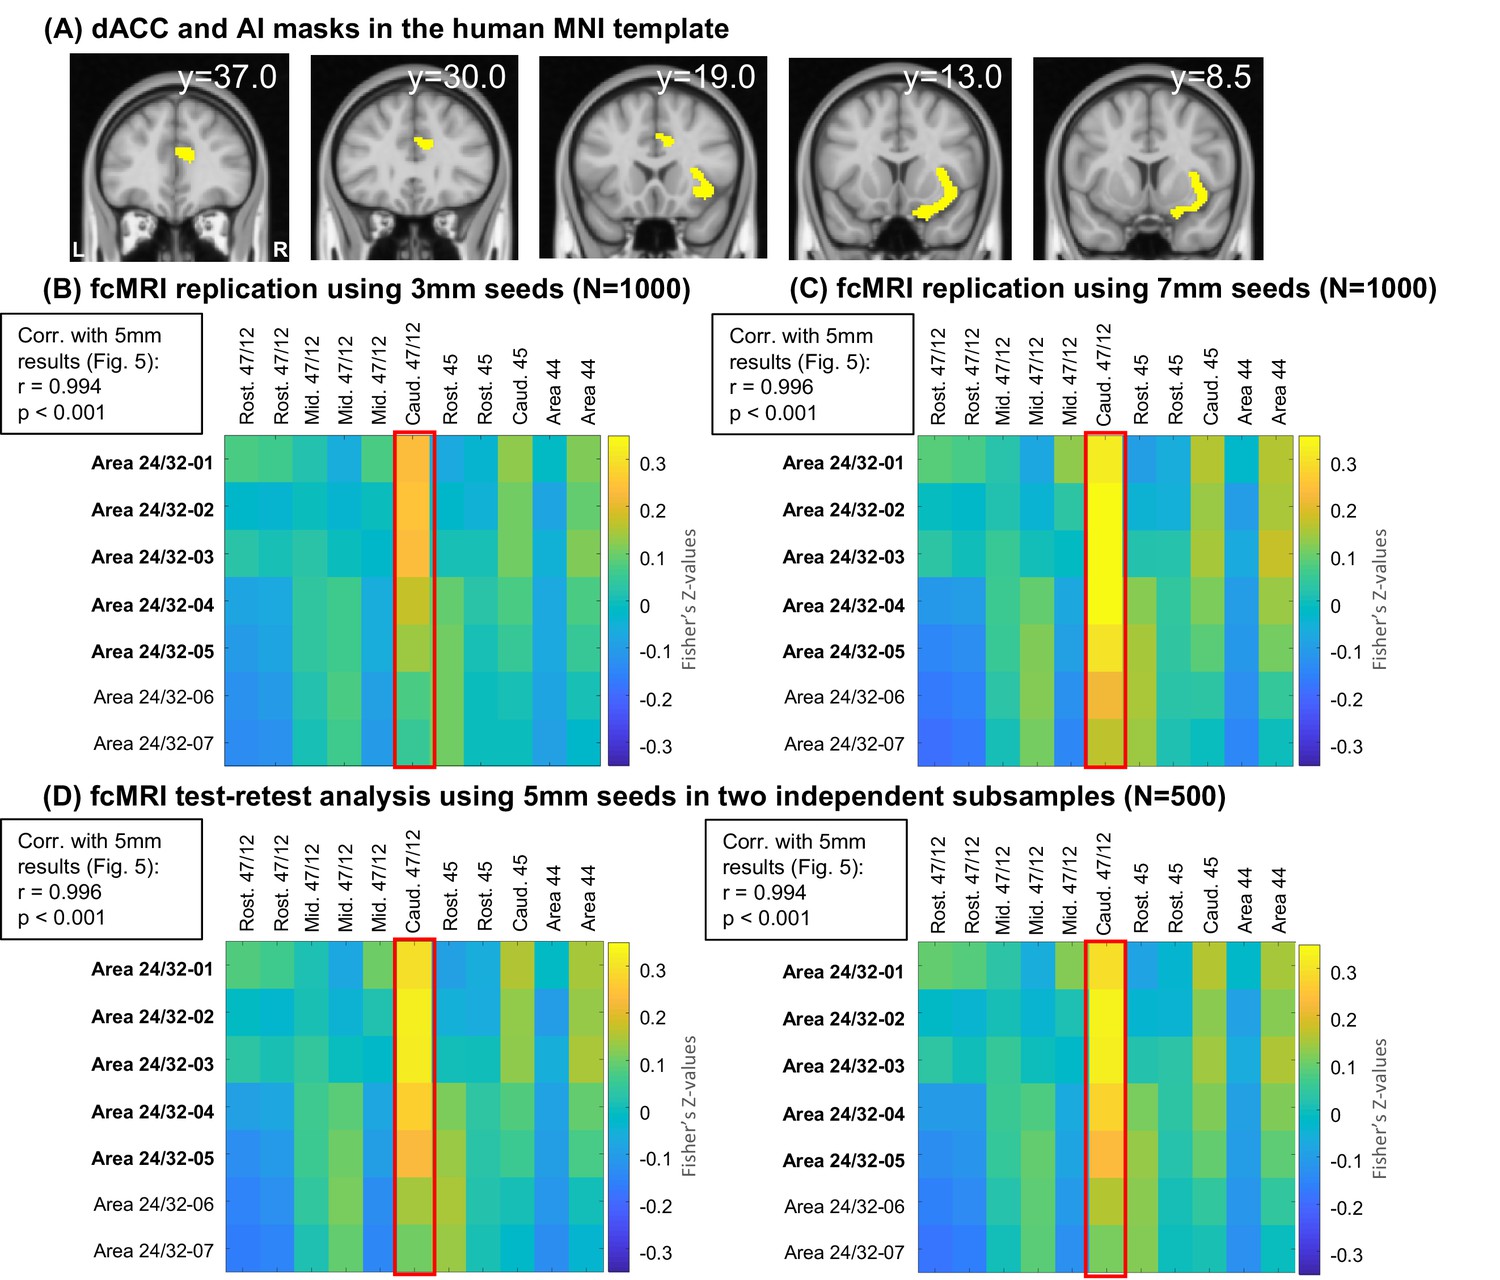
(A) dACC and AI masks created for connectivity strength analysis. Coordinates are in the MNI template. (B) Connectivity strength (Fisher’s z-values) between dACC and vlPFC 3 mm seeds. (C) Connectivity strength (Fisher’s z-values) between dACC and vlPFC 7 mm seeds. (D) Test-retest analysis using two independent subsamples of 500 subjects. Red frames highlight results for the caudal 47/12 seed.
Additional files
-
Supplementary file 1
ROI centers for fMRI analysis.
- https://cdn.elifesciences.org/articles/76334/elife-76334-supp1-v2.pptx
-
Transparent reporting form
- https://cdn.elifesciences.org/articles/76334/elife-76334-transrepform1-v2.pdf
Download links
A two-part list of links to download the article, or parts of the article, in various formats.
Downloads (link to download the article as PDF)
Open citations (links to open the citations from this article in various online reference manager services)
Cite this article (links to download the citations from this article in formats compatible with various reference manager tools)
Anatomical and functional connectivity support the existence of a salience network node within the caudal ventrolateral prefrontal cortex
eLife 11:e76334.
https://doi.org/10.7554/eLife.76334


