A CD4+ T cell reference map delineates subtype-specific adaptation during acute and chronic viral infections
- Department of Oncology, UNIL CHUV and Ludwig Institute for Cancer Research Lausanne, University of Lausanne, Switzerland
- Agora Cancer Research Center, Switzerland
- Swiss Institute of Bioinformatics, Switzerland
- David H. Smith Center for Vaccine Biology and Immunology, Department of Microbiology and Immunology, University of Rochester, United States
- Single Cell Analysis Facility, Frederick National Laboratory for Cancer Research, Leidos Biomedical Research Inc, United States
- Laboratory of Immune Cell Biology, Center for Cancer Research, National Cancer Institute, National Institutes of Health, United States
Figures
Figure 1 with 1 supplement
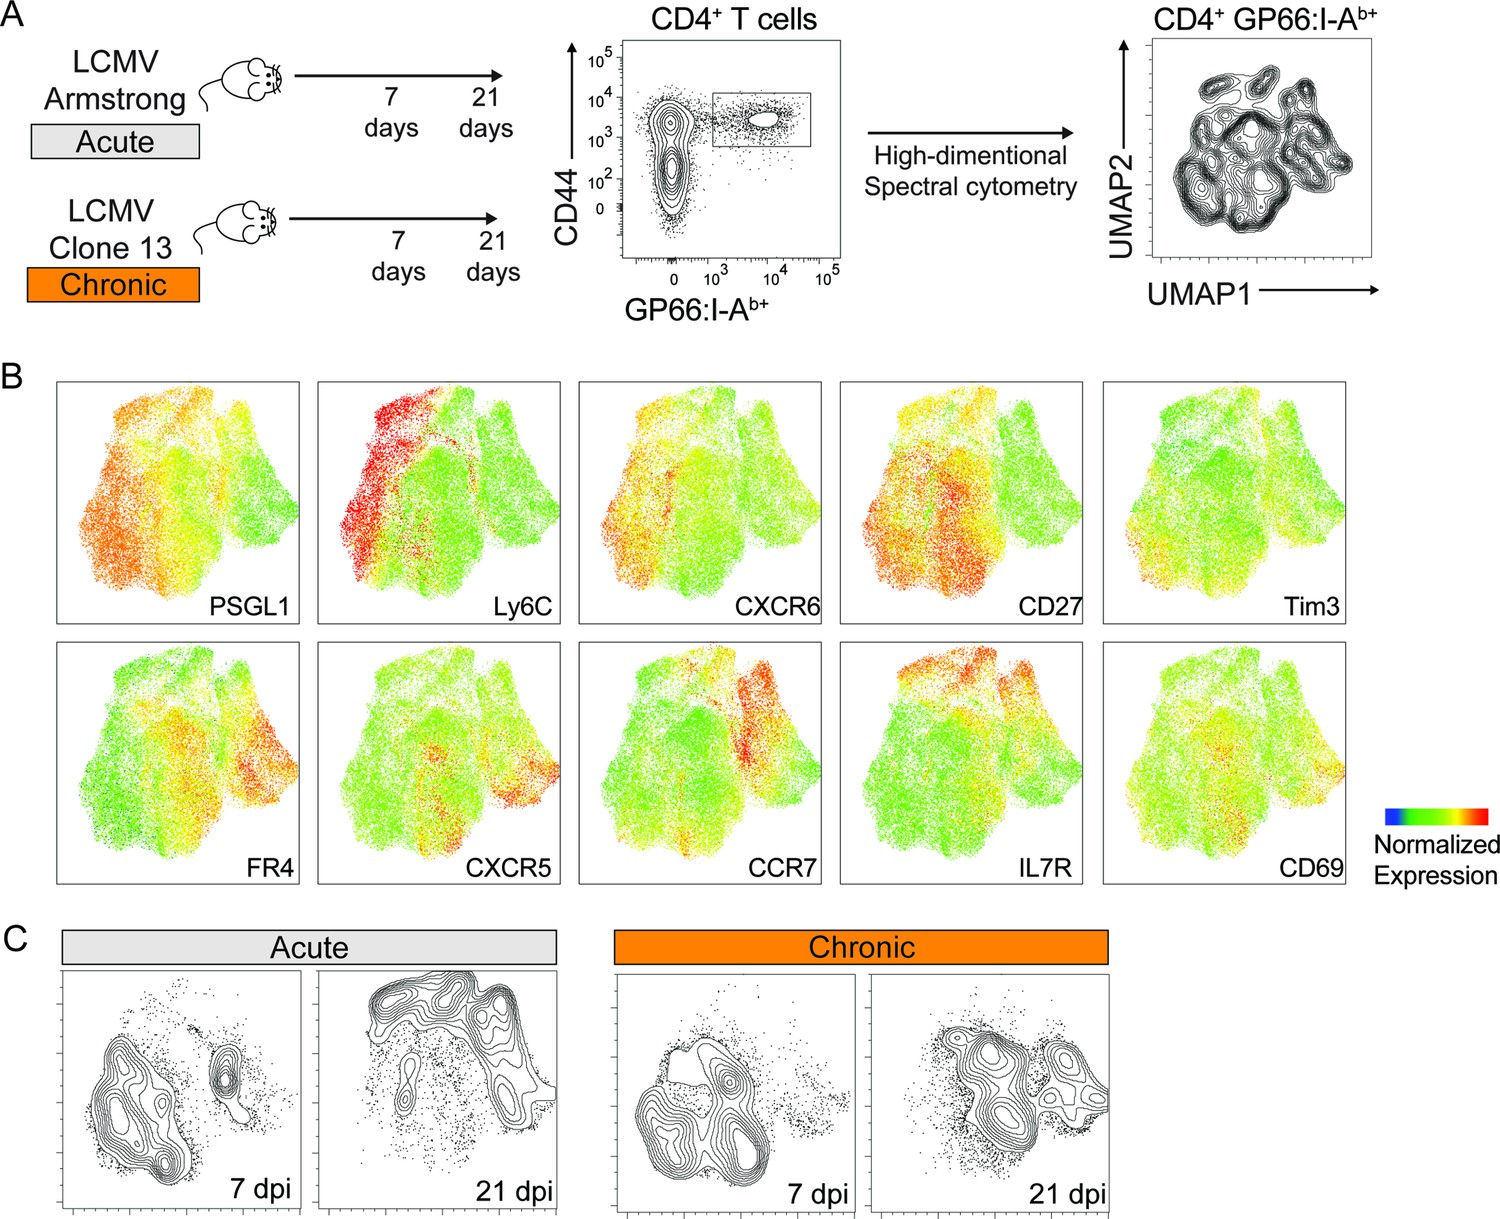
Phenotypic characterization of virus-specific CD4+ T cells by spectral flow cytometry.
Spleen GP66:I-Ab+ CD4+ T cells were analyzed 7 and 21 days after infection with LCMV Armstrong and Clone 13. (A) Schematic of experimental procedures. Uniform Manifold Approximation and Projection (UMAP) visualization was calculated based on the expression of 14 markers on virus-specific CD4+ T cells pooled from 5 animals. (B) Expression of selected markers shown on the UMAP as in (A). (C) CD4+ T cells from each condition were highlighted as contour lines on the UMAP. Experiment with 4–5 mice per group, representative of two independent experiments. See also Figure 1—figure supplement 1 for spectral cytometry analysis including GP33:H2Db+ CD8+ T cells, and for surface marker panels used to characterize T cell populations.
Figure 1—figure supplement 1
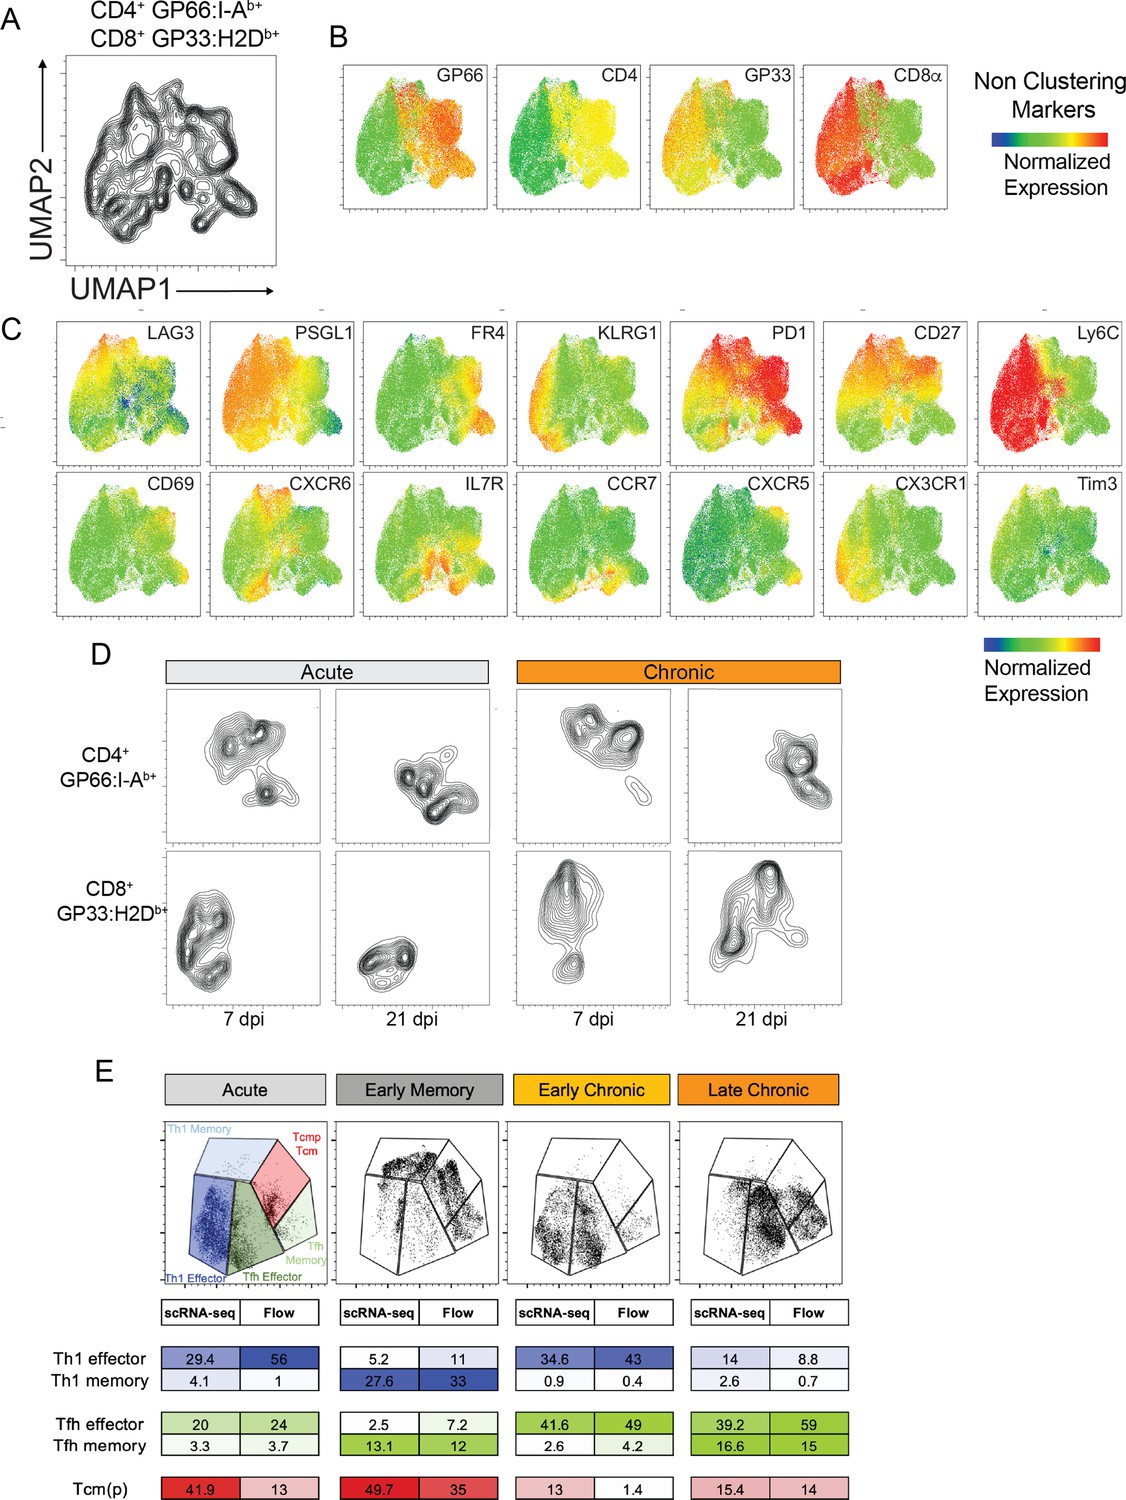
Phenotypic characterization of virus-specific T cells.
Spleen GP66:I-Ab+ CD4+ and GP33:H2Db+ T cells were analyzed 7 and 21 dpi after infection with LCMV Armstrong and Clone 13. (A) UMAP was calculated based on the expression of 14 markers on virus-specific T cells. (B) CD4, CD8 and tetramer levels shown on the UMAP as in (A). (C) Expression of 14 parameters used to generate the UMAP. (D) T cells from the indicated conditions were projected on the UMAP. Experiment with 4–5 mice per group, representative of two independent experiments. (E) Percentage of the main CD4+ T cell states defined by scRNA-seq and spectral cytometry (Flow). Populations in spectral cytometry (see also Figure 1) were defined with the following surface markers: Th1 Effector: PSGL1high CXCR6high Ly6chigh/int; Th1 Memory: PSGL1high CXCR6high Ly6chigh/int IL7Rhigh; Tfh Effector: PSGL1low CXCR5high Ly6cneg, Tfh Memory; PSGL1low CXCR5high Ly6cneg CD27low; Tcmp/Tcm: CCR7high.
Figure 2 with 1 supplement
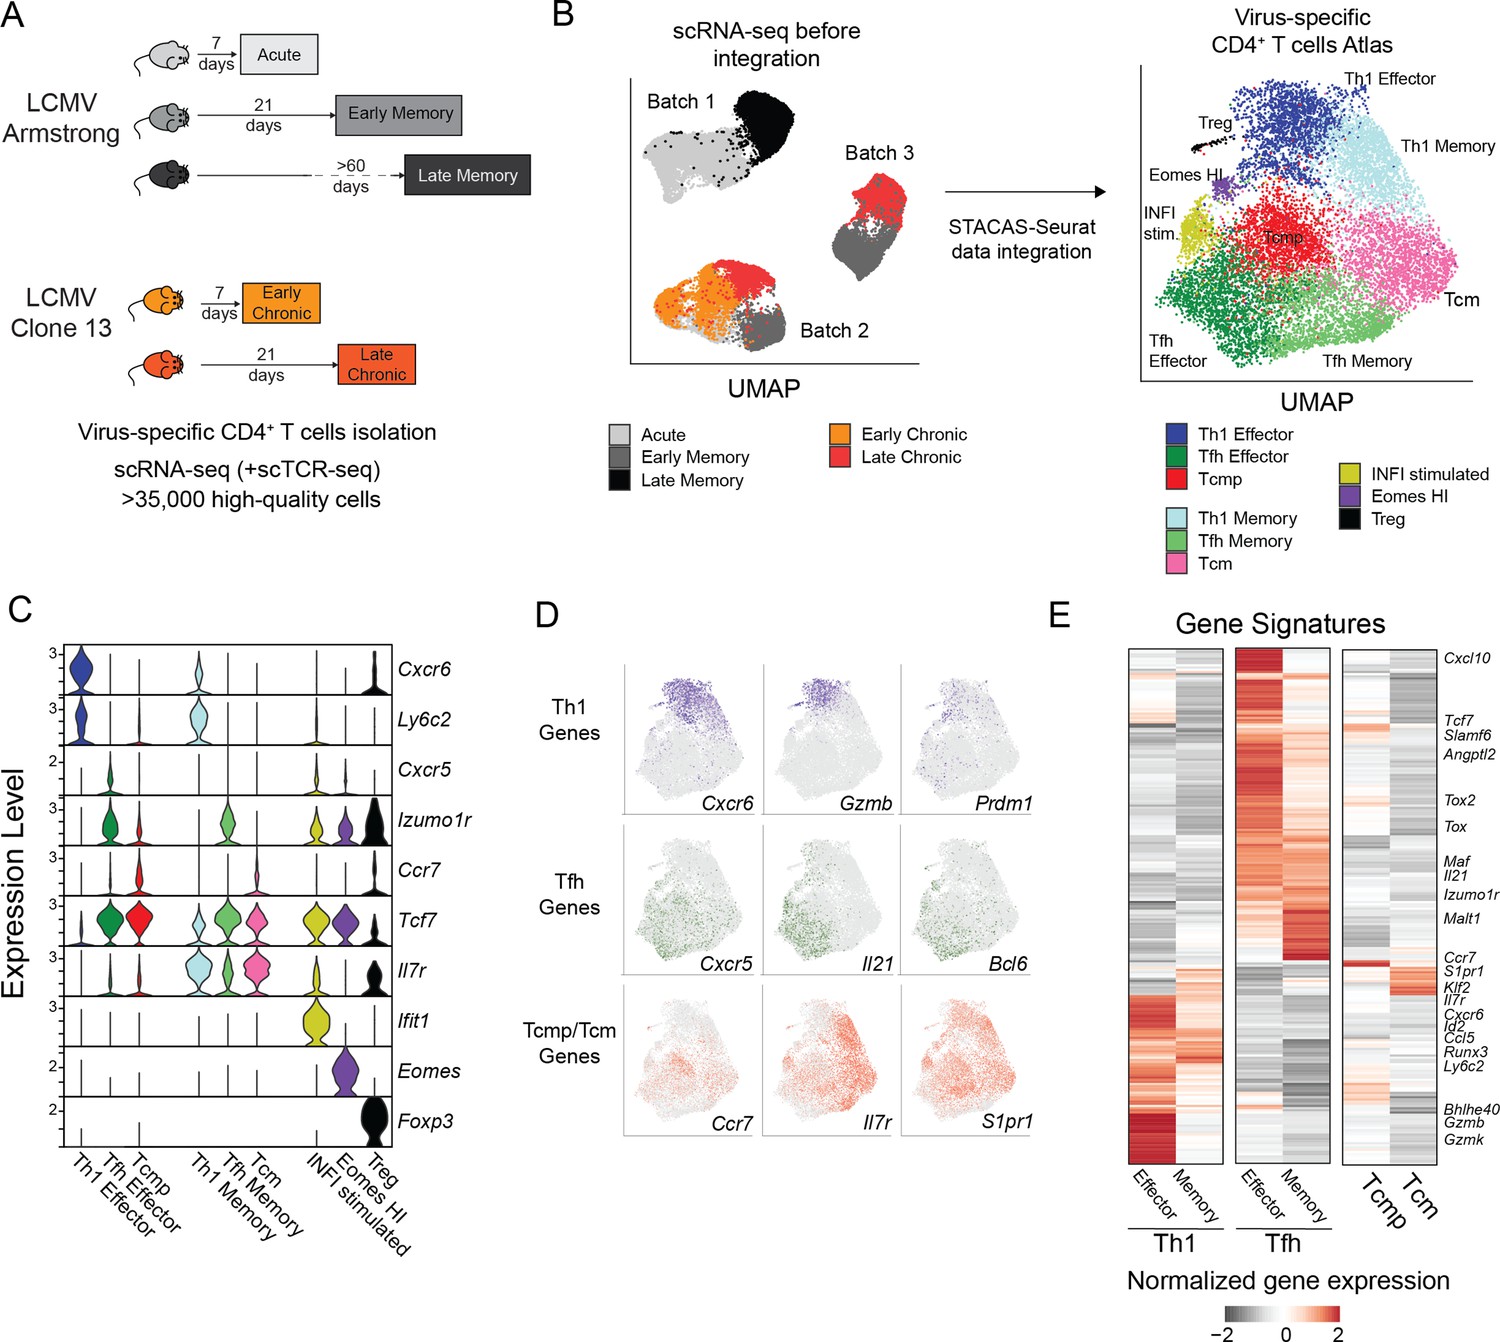
Transcriptional landscape of CD4+ T cell states during infections.
(A) Schematic experimental design to assess virus-specific T cell transcriptomes at different timepoints in acute (Armstrong) and chronic (Clone 13) LCMV infections (additional information in Supplementary file 1). (B) UMAP visualization of single-cell data before and after dataset integration, highlighting the samples and batches on the left and the 9 CD4+ T cell subtypes of the reference map on the right. (C) Expression levels of key marker genes in the 9 subtypes of the reference map. (D) Single-cell expression visualized in the UMAP space for key marker genes of Th1, Tfh and Tcmp/Tcm subtypes. (E) Average expression of differentially expressed genes in the six major subtypes of the reference map; selected genes are highlighted.
Figure 2—figure supplement 1
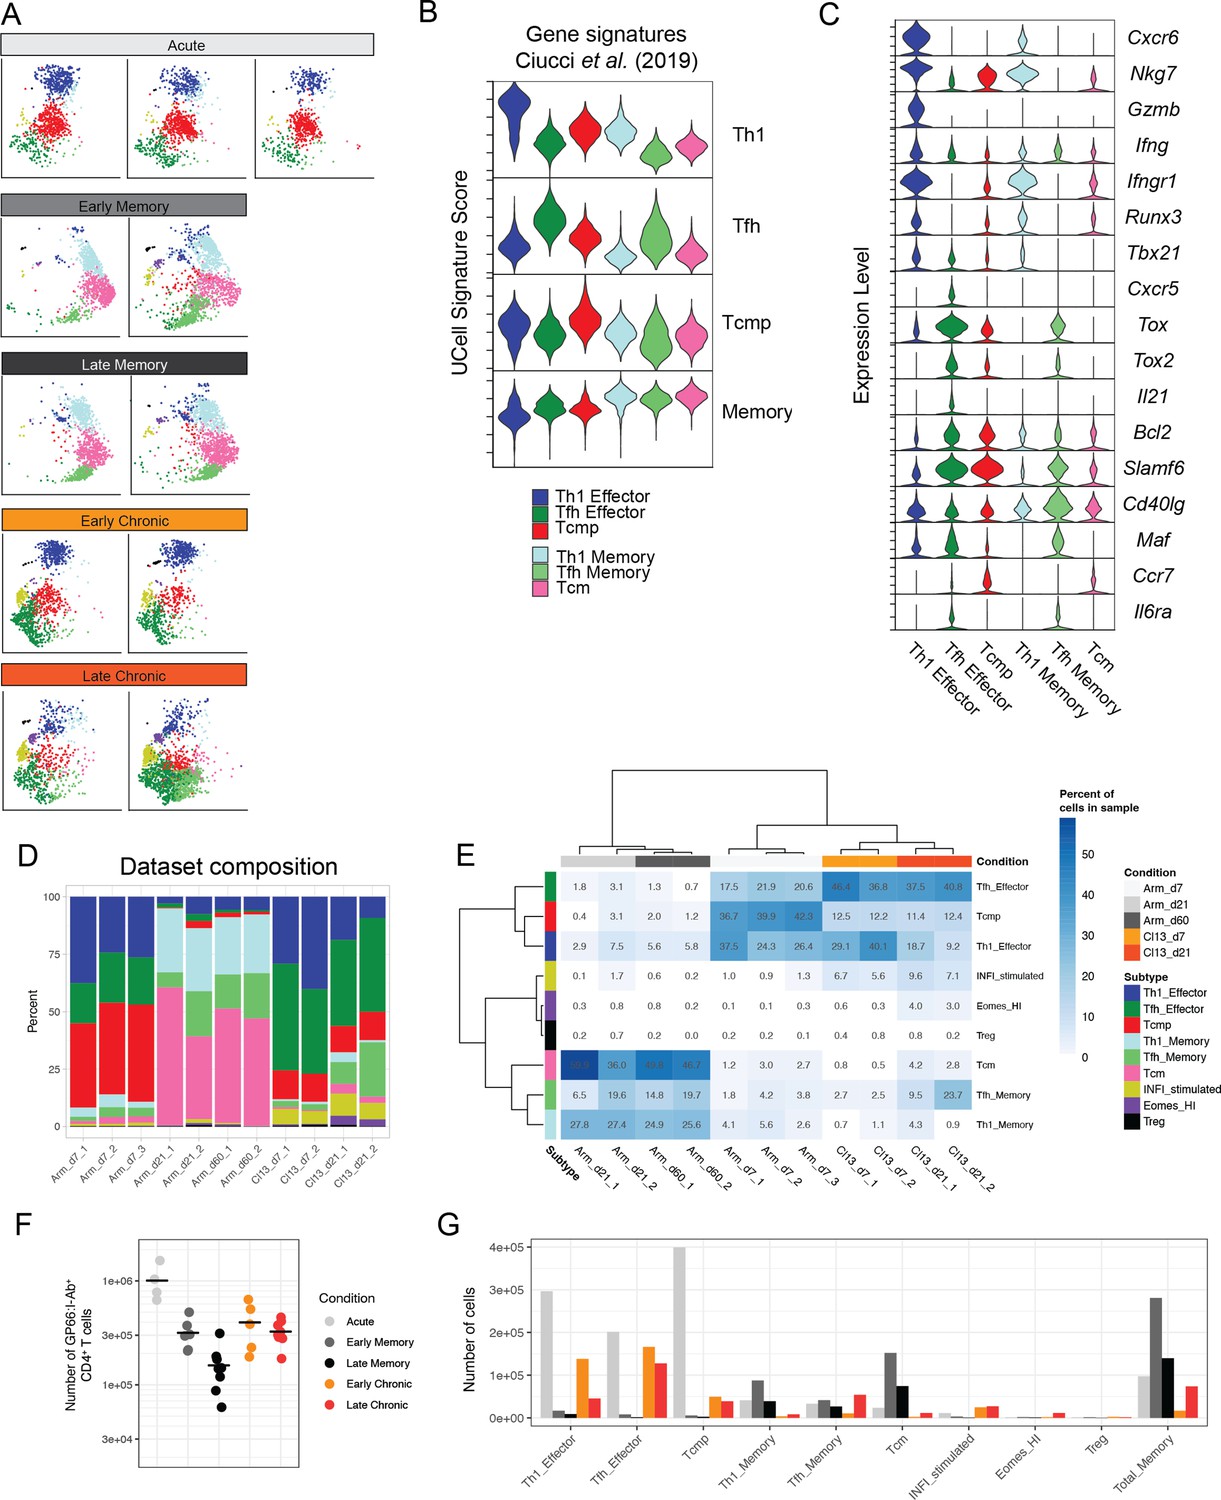
Distribution and consistency of CD4+ T cell states during infections.
(A) Distribution of individual samples in the UMAP space of the reference map (related to Figure 2). Samples are grouped by timepoint and condition. (B) Signature scores for the six major reference subtypes using the gene signatures defined by Ciucci et al., 2019. (C) Relative gene expression of selected genes on cells assigned to six main CD4+ T cell states. (D) Summary of cell subtype composition for all samples included in the reference map. (E) Heatmap of subtype frequencies for each subtype-sample combination; hierarchical clustering groups samples by condition rather than by sequencing batch. (F) Absolute number of spleen GP66:I-Ab+CD4+ T cells for individual mice at different timepoints of infection. (G) Estimate of absolute number of cells by subtype, calculated by multiplying average absolute number of T cells per condition with subtype frequencies in the reference map.
Figure 3 with 1 supplement
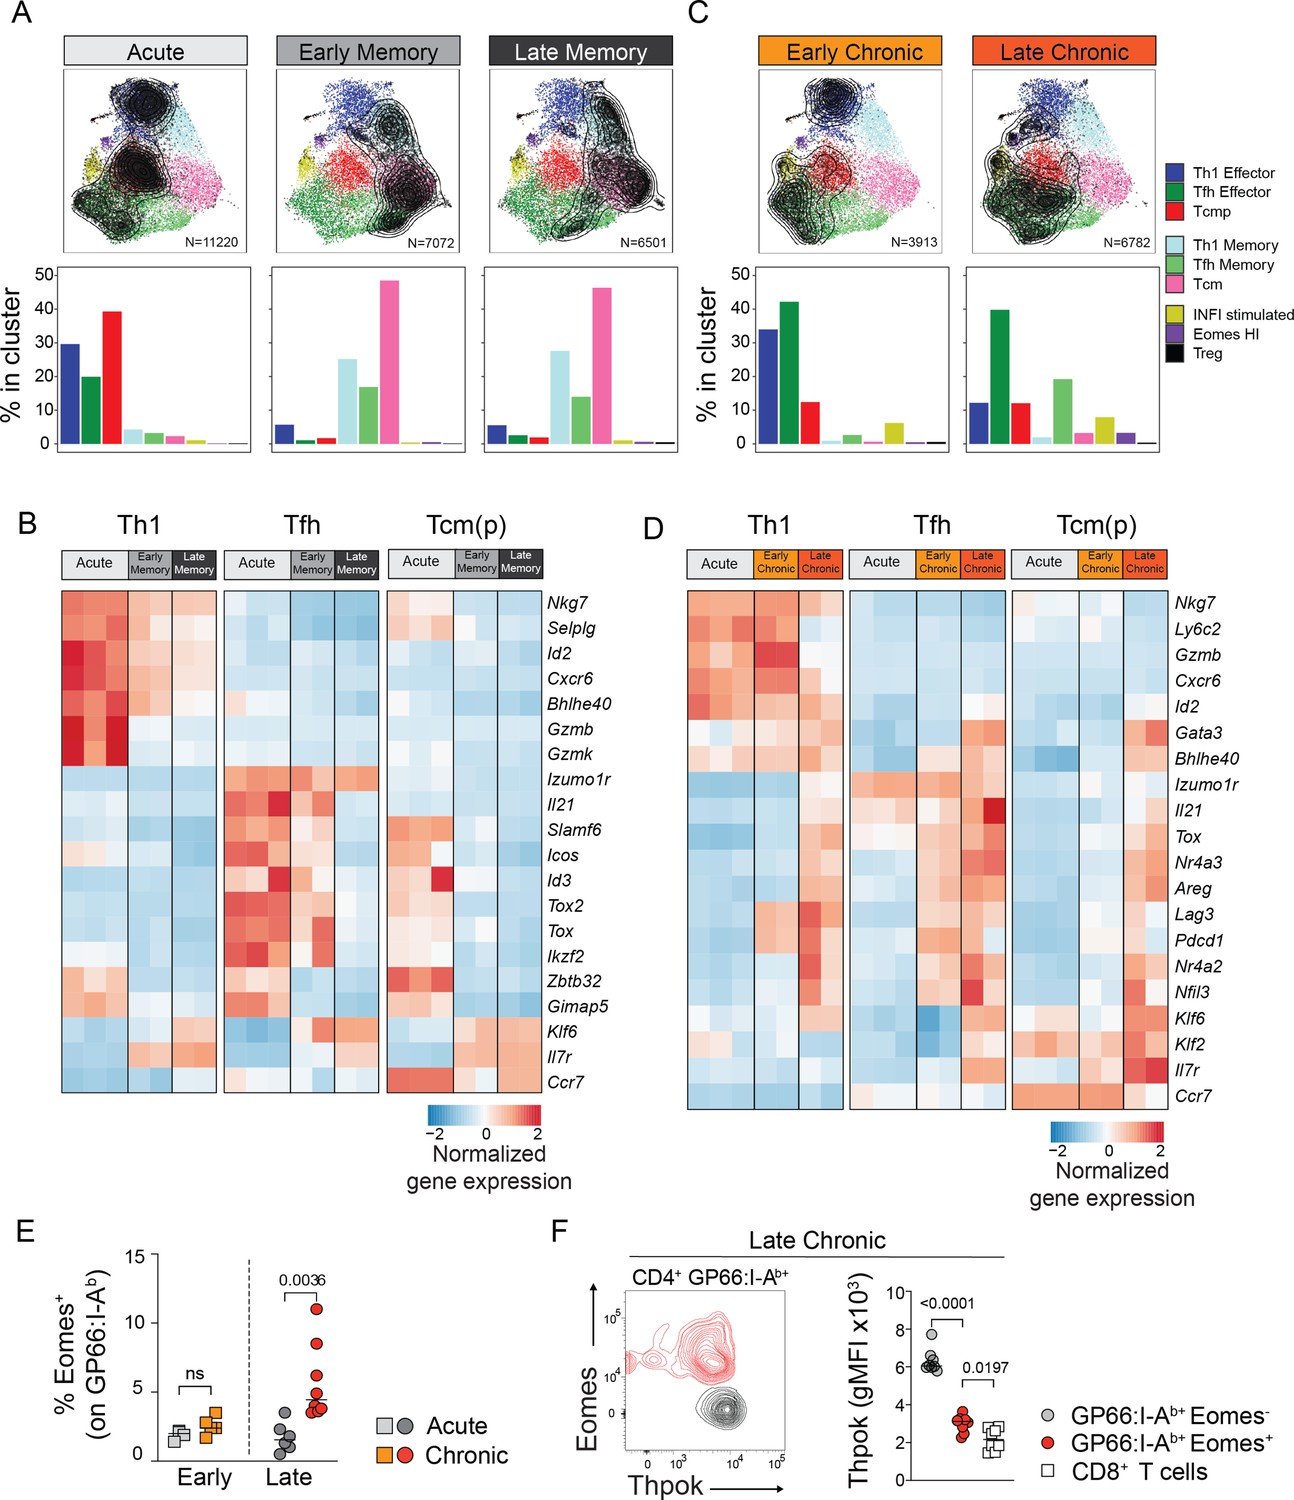
Subset-specific adaptation of CD4+ T cell states in chronic and acute infections.
(A,C) Distribution of T cell states at different timepoints after acute and chronic infections. In the UMAP plots, contour lines indicate the density of T cells for each type of infection and timepoint; the barplots in the bottom row indicate the percentage of cells in each subtype in the indicated condition. (B,D) Normalized average expression during acute and chronic infections among Th1, Tfh and Tcm(p) subtypes. Selected genes from differentially expressed genes shown in Figure 3—figure supplement 1A,C. (E,F) Animal were infected with LCMV Armstrong (Acute) or Clone 13 (Chronic) and analyzed at the indicated timepoints (Early: 7dpi; Late: 21dpi). (E) Graph shows the percentage of Eomes+ cells among spleen GP66:I-Ab+T cells. (F) Plot (left) shows the intracellular expression of Eomes and Thpok on spleen GP66:I-Ab+T cells analyzed 21 dpi after LCMV Clone 13 infection. Graph (right) shows Thpok mean fluorescent intensity (gMFI) in the indicated population. (E,F) are from one experiment with >5 mice per group, representative of 2 independent experiments.
Figure 3—figure supplement 1
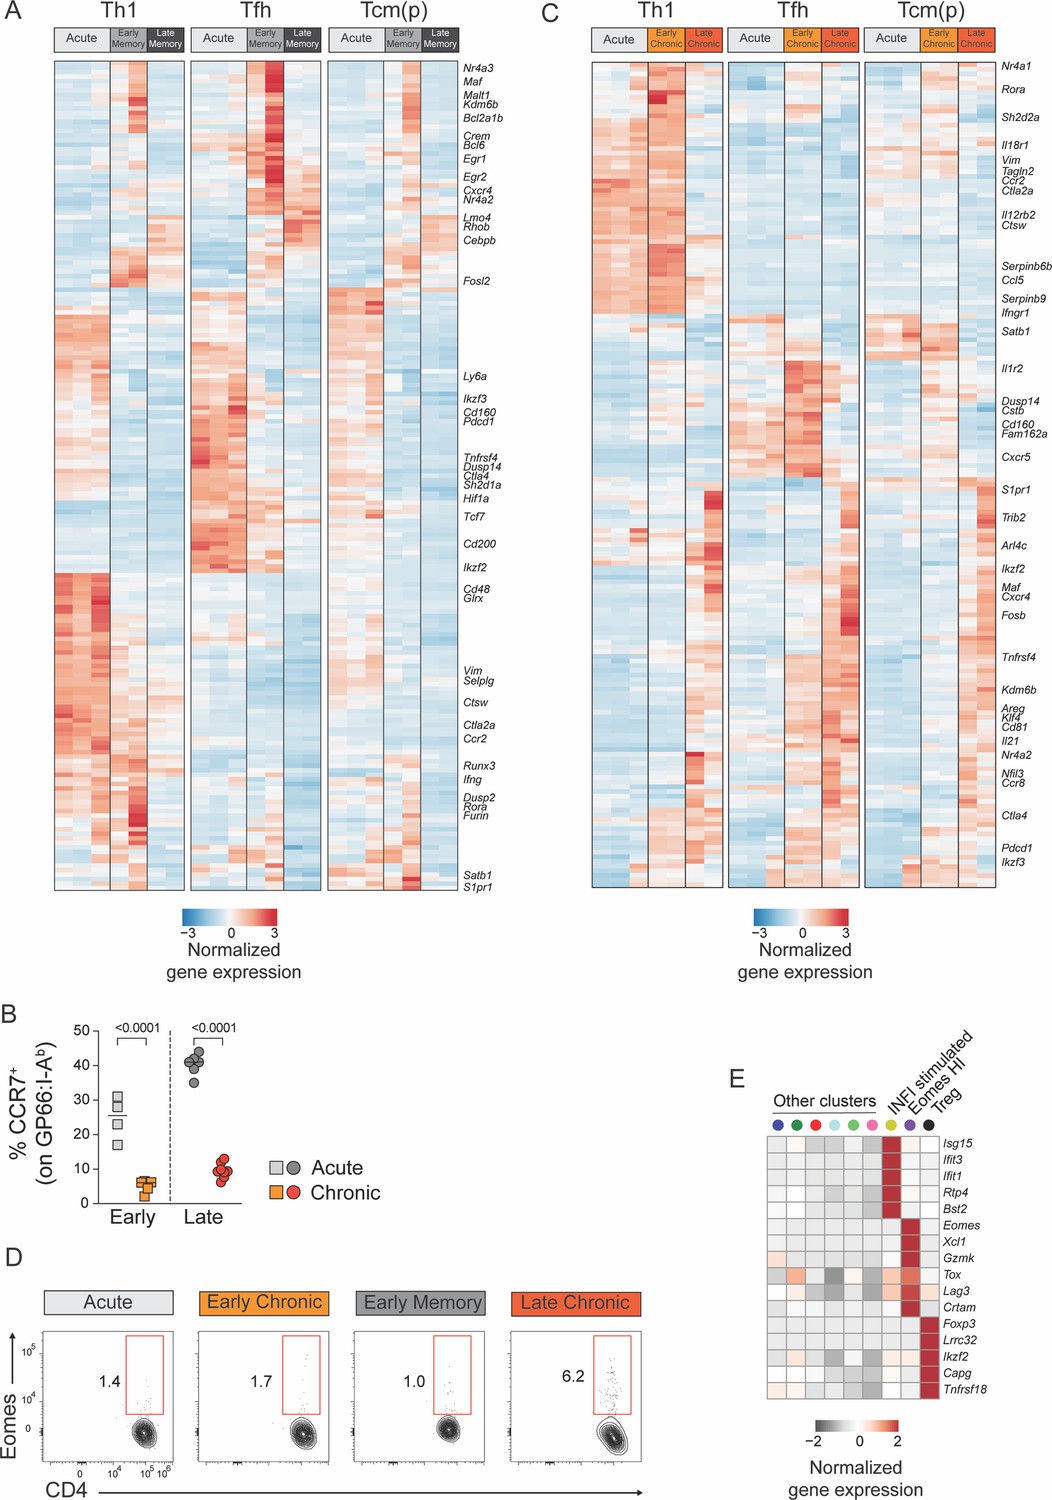
Adaptation of CD4+ T cell states in chronic and acute infections.
(A,C) Normalized average expression during acute and chronic LCMV infections among Th1, Tfh, and Tcm(p) subtypes. (B,D) Animal were infected with LCMV Armstrong (Acute) or Clone 13 (Chronic) and spleen GP66:I-Ab+T were analyzed at the indicated timepoints (Early: 7dpi; Late: 21dpi). (B) Graph shows the percentage of CCR7+ cells and (D) the expression of Eomes and CD4 at the indicated timepoints. Date are from one experiment with >5 mice per group, representative of two independent experiments. (E) Average expression of differentially expressed genes in the three minor subtypes of the reference map.
Figure 4 with 1 supplement
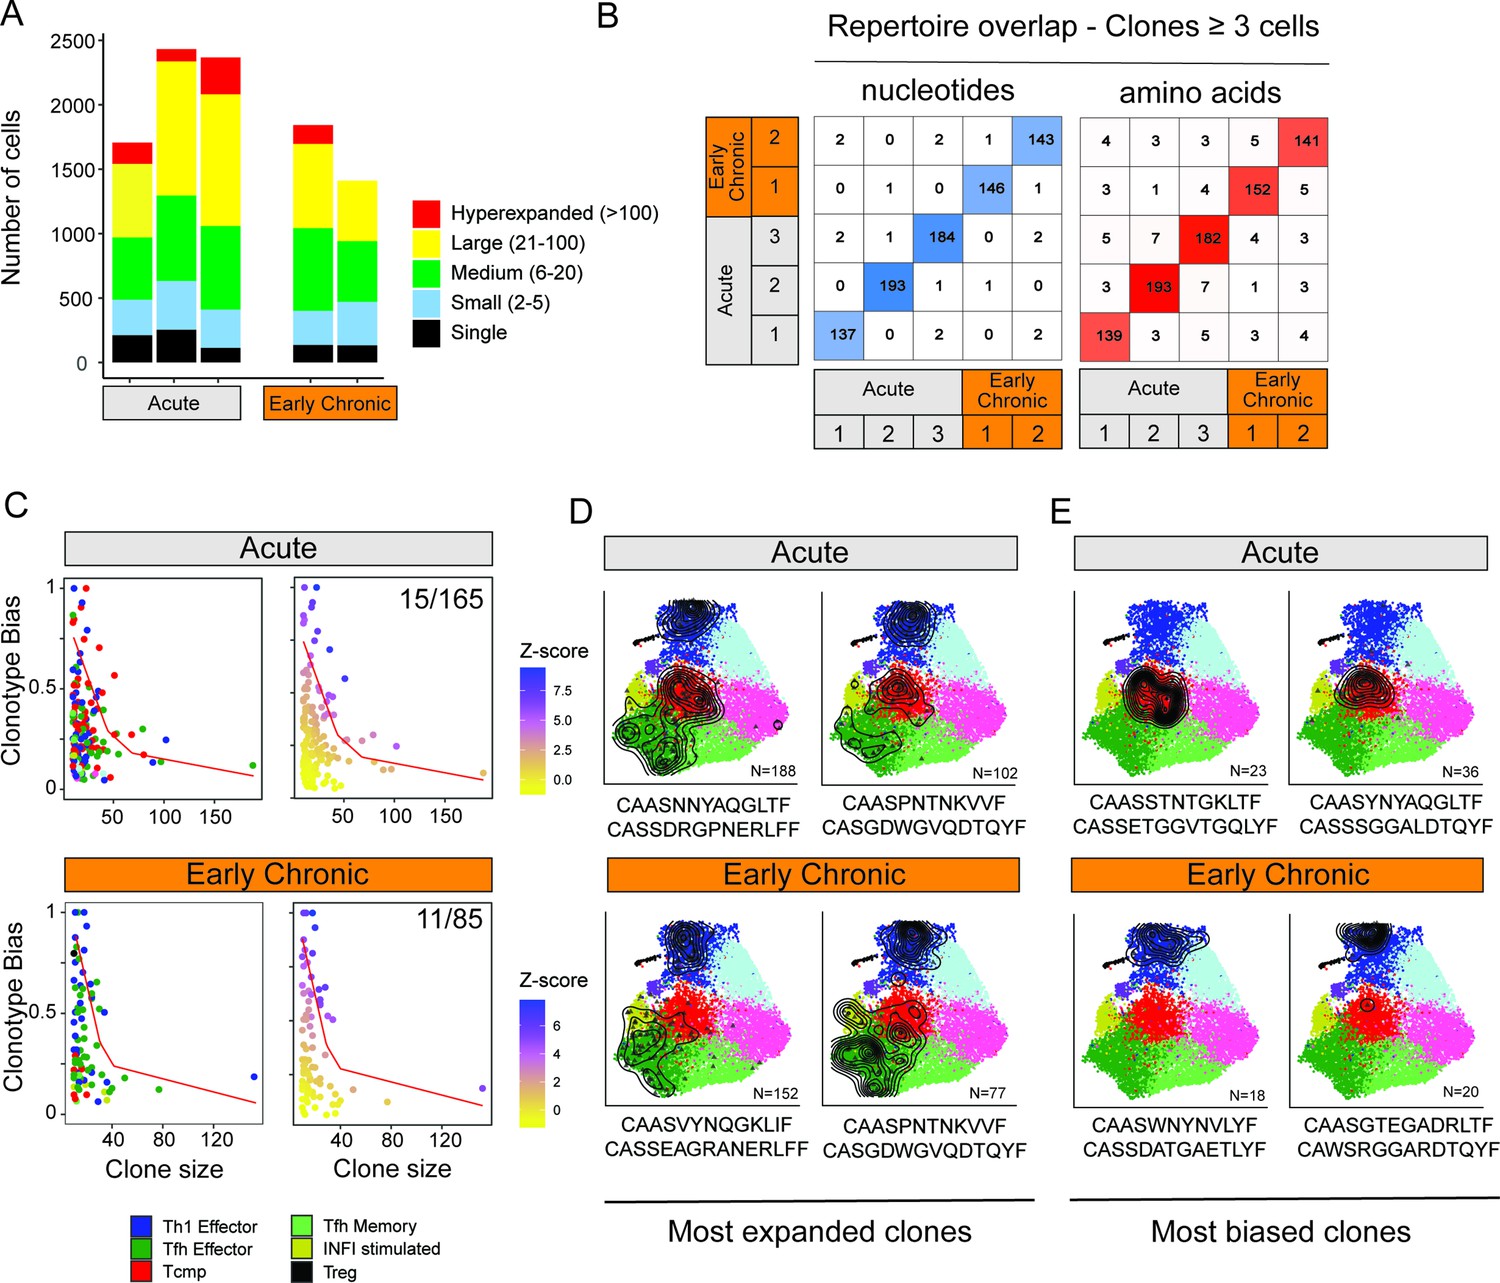
Clonal structure of virus-specific CD4+ T cells and clonotype-fate relationship.
(A) Fraction of clonal space occupied by clonotypes with different levels of expansion. For each sample (three replicates for Acute, two replicates for Early Chronic), the plot indicates the number of single cells that belong to clonotypes in one of the five classes of expansion. (B) Number of clones with identical CDR3 nucleotides or amino acid sequence pairs between individual samples among clonotypes with ≥3 cells. (C) Clonotype bias analysis for acute and chronic infection samples. Plots show clonotype bias vs. clonal size for all clones with >10 cells. Clonotypes are colored by predominant T cell subtype (left) or by Z-score of the clonotype functional bias (right). Red line highlights the null distribution (background distribution) for each condition. (D, E) Distribution of cells over the reference map for the (D) four most expanded and (E) four most biased clonotypes in acute and chronic infections. The CDR3 alpha and beta sequences and the clonotype size are indicated for each clonotype.
Figure 4—figure supplement 1
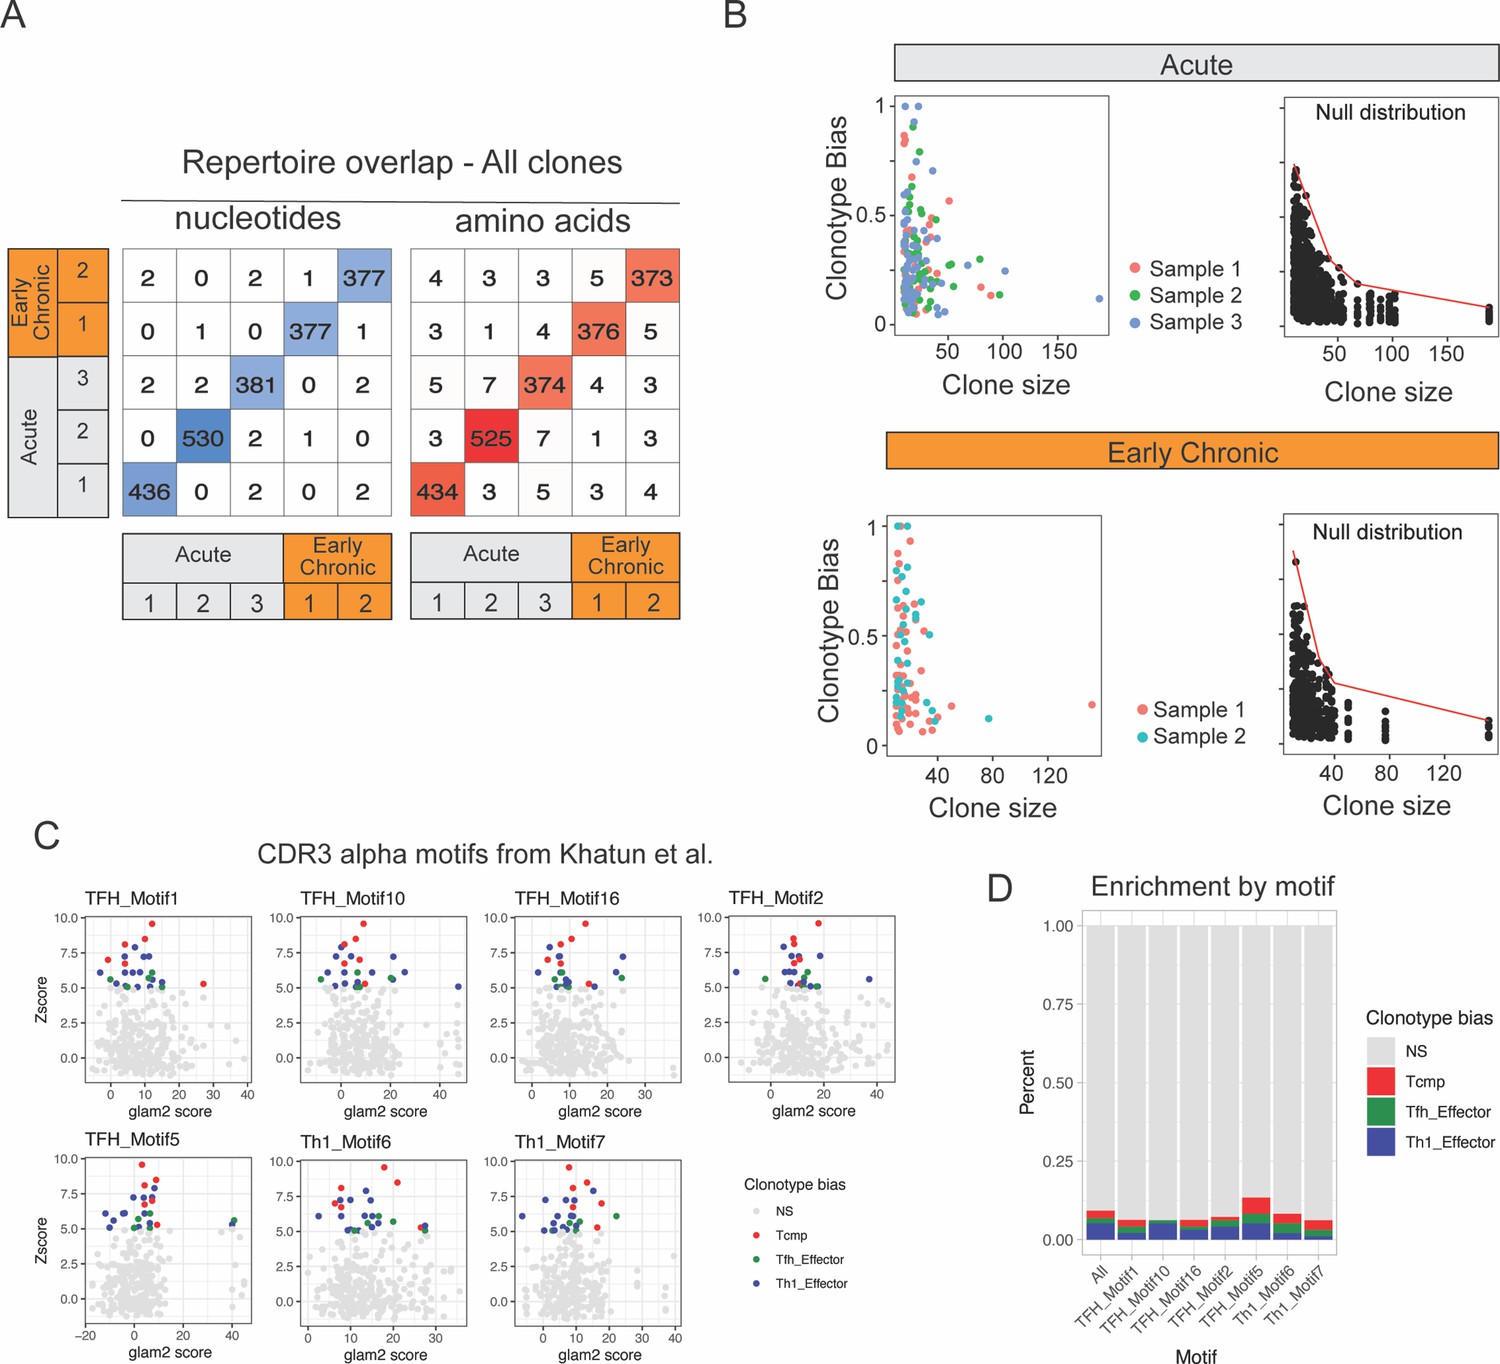
Repertoire overlap of virus-specific CD4+ T cells and clonotype bias.
(A) Number of clones with identical CD3 nucleotides or amino acid sequence pairs between individual samples among all clonotypes. (B) Clonotype bias analysis for acute and chronic infection samples. A clonotype bias of 1 indicates that a clonotype is composed uniquely of cells from the same subtype, and a clonotype bias of zero corresponds to a clonotype that matches exactly the (random) background subtype distribution. Left plots show clonotype bias colored by sample for all clone with >10 cells. Left plot shows null distribution (background distribution) for each condition. (C) Motif scores calculated on our clonotype data using for significant TCR alpha CDR3 motifs identified by Khatun et al., 2021. Clonotype-biased clones (Zscore >5) are colored according to the dominant CD4 +T cell subtype. (D) Percent and type of biased clones among the top 65% clones as ranked by each of the seven TCR alpha CDR3 motifs. ‘All’ column represents the percent and type of biased clones on all data, regardless of ranking by a specific CDR3 motif.
Figure 5 with 3 supplements

Interpretation of CD4+ T cell states in external datasets by projection into the reference map.
(A) Independent scRNA-seq datasets can be projected into the CD4+ T cell reference map using the ProjecTILs algorithm and interpreted in the context of the space and cell states of the reference. (B) UMAP embeddings for the external data by Ciucci et al., 2019 at 7 and 30 days after acute LCMV infection projected into the reference map. Contour lines indicate the density of projected cells. (C) Radar plots showing average expression profiles of a panel of CD4+ T cell marker genes, for the projected cells from Ciucci et al., 2019 (blue and red) compared to the reference map profiles (black) grouped by predicted subtype. (D) UMAP embeddings for projected scRNA-seq data of Bcl6- and Prdm1-deficient virus-specific CD4+ T cells isolated 7 days after acute infection with LCMV Armstrong (data from Ciucci et al., 2022). (E) UMAP embeddings for projected scRNA-seq data of virus-specific CD4+ T cells isolated 33 days after chronic infection with LCMV Clone13, in animals treated with anti-PDL1 or isotype control (data from Snell et al., 2021). Barplots in the bottom row indicate the percentage of cells projected in each reference subtype.
Figure 5—figure supplement 1
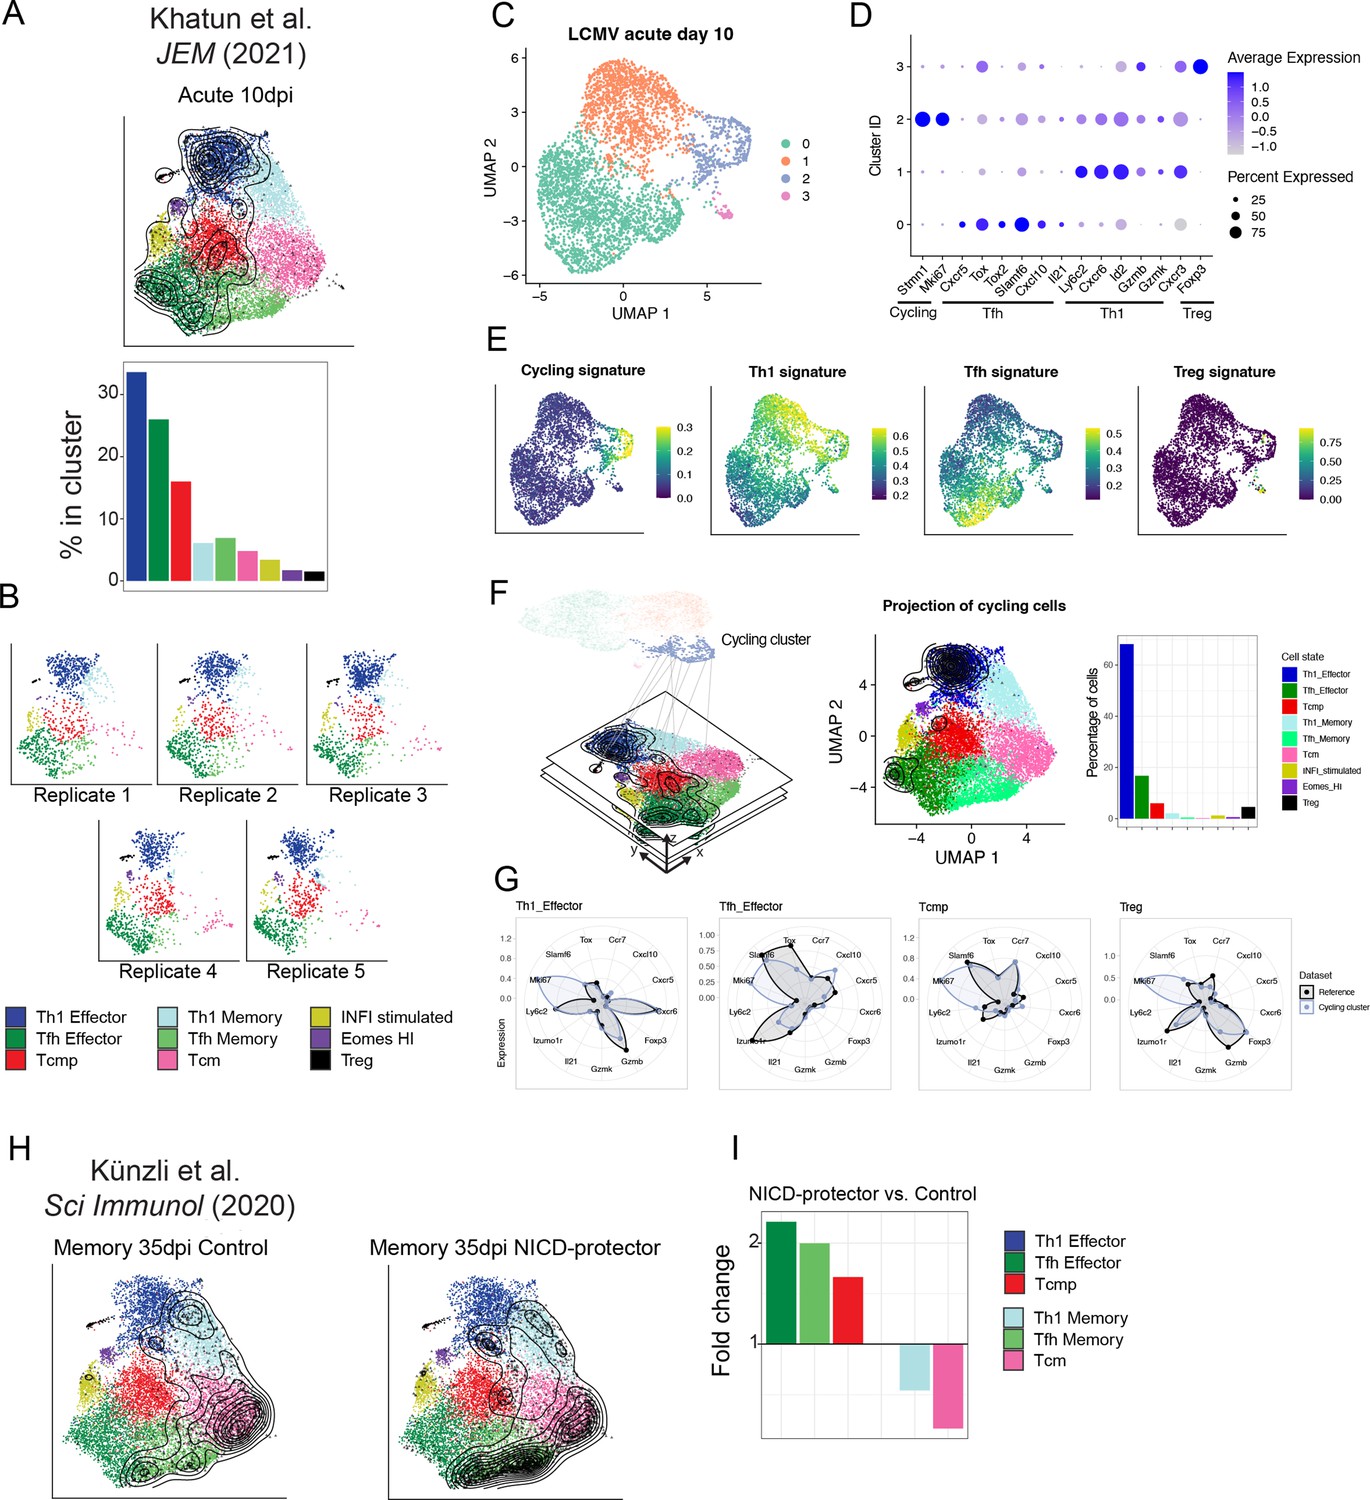
Reference-based classification of independent datasets.
(A–G) Analysis of scRNA-seq data for virus-specific CD4 +T cell data 10 days after LCMV acute infection (Khatun et al., 2021). (A) UMAP embeddings and subtype composition after projection into the reference map. (B) Distribution of cells for five individual replicates from the same study. (C) UMAP visualization of unsupervised clustering (performed in PCA space). (D) Average expression of key markers identify a Th1 cluster (1), a cluster of cycling cells (2), a Tfh cluster (3) and a Treg cluster (4). Cycling cells in cluster 2 express a mixture of both Th1 and Tfh markers. (E) Signature scores suggest that the cycling cluster contains a mixture of multiple phenotypes (Th1, Tfh, and Treg). (F) Subtype composition of all cells in the cycling cluster after reference projection. (G) Expression profile for a panel of marker genes for projected cycling cells and for the reference map (Mki67 is a marker for cycling). (H) UMAP embeddings for the virus-specific CD4 +T cell scRNA-seq data by Künzli et al., 2020 35 days after LCMV acute infection, for NAD-induced cell death (NICD)-protector treated mice and control. (I) Fold-change for composition of CD4 +T cells states in NICD-protector vs. control sample, highlighting relative increase and decrease in the frequency of individual cell subtypes. Black contour lines in all UMAP identify the density of single cells from the projected dataset, overlaid on the space of the reference.
Figure 5—figure supplement 2
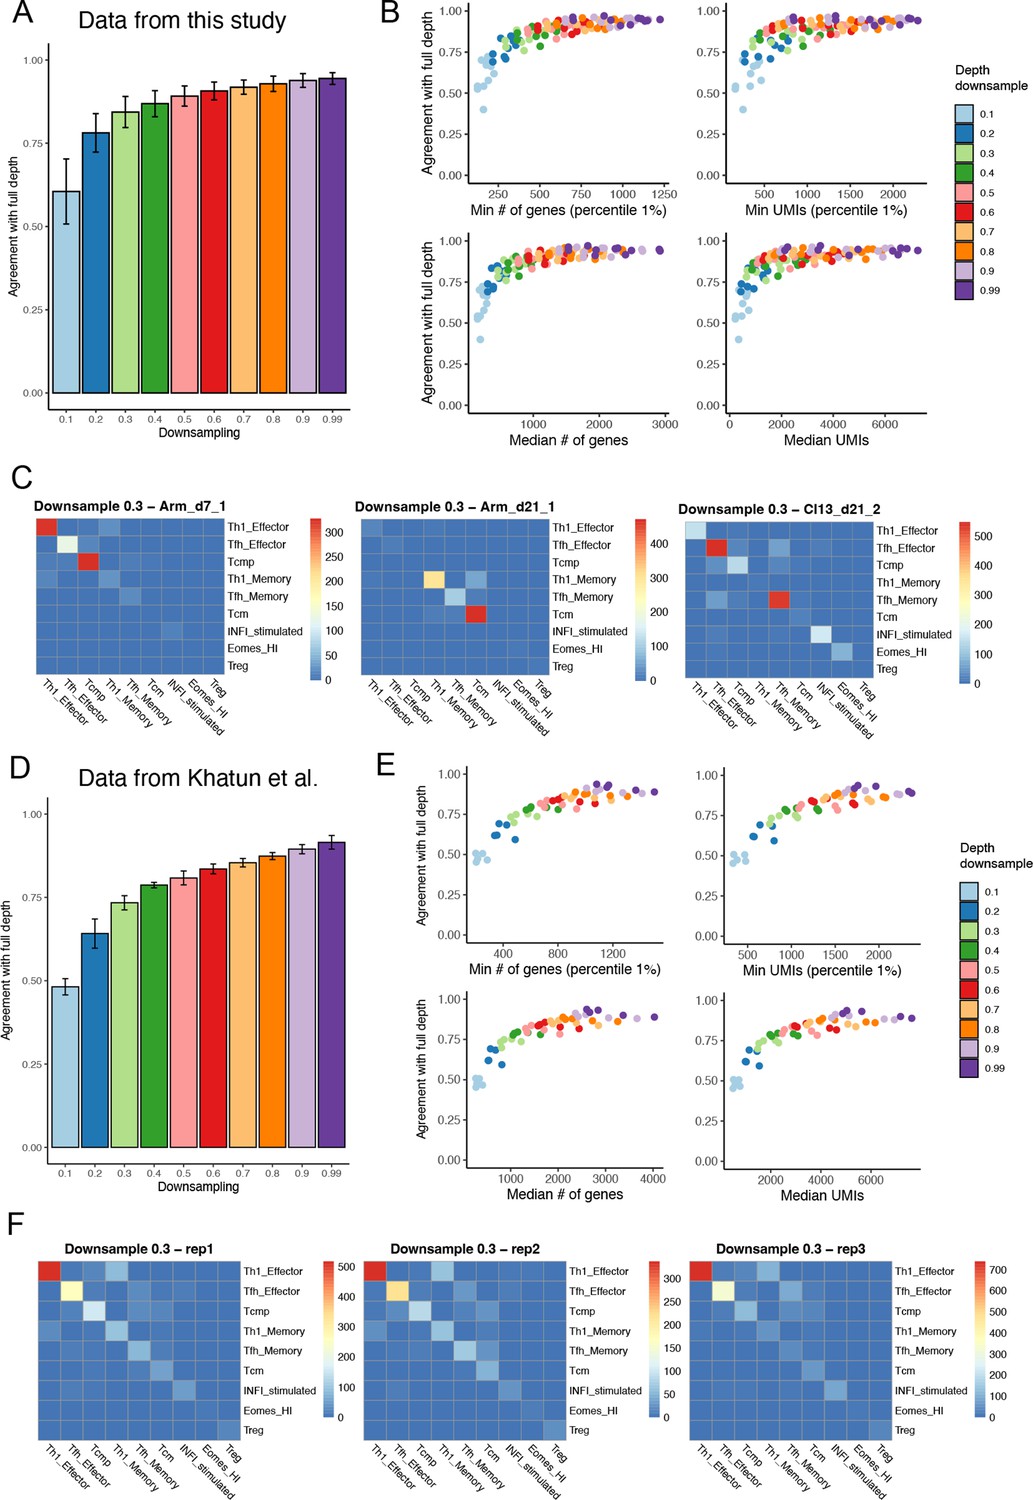
Effect of sequencing depth on reference-based annotation.
(A) Data for each sample generated in this study were downsampled for sequencing depth and re-projected into the reference map, allowing to measure the agreement in cell type annotation between full depth and different downsampling levels (10–99%). Error bars show standard deviation across individual samples. (B) Annotation agreement between full depth and downsampled datasets as a function of minimum and median number of genes, and minimum and median number of UMIs. (C) Number of cells shared between subtypes in full-depth vs. 30% downsampled datasets, for three select samples. Off-diagonal elements represent annotation disagreement between full-depth and downsampled datasets. (D to F) Same as (A to C), using instead the five replicates of LCMV acute data from Khatun et al., 2021.
Figure 5—figure supplement 3
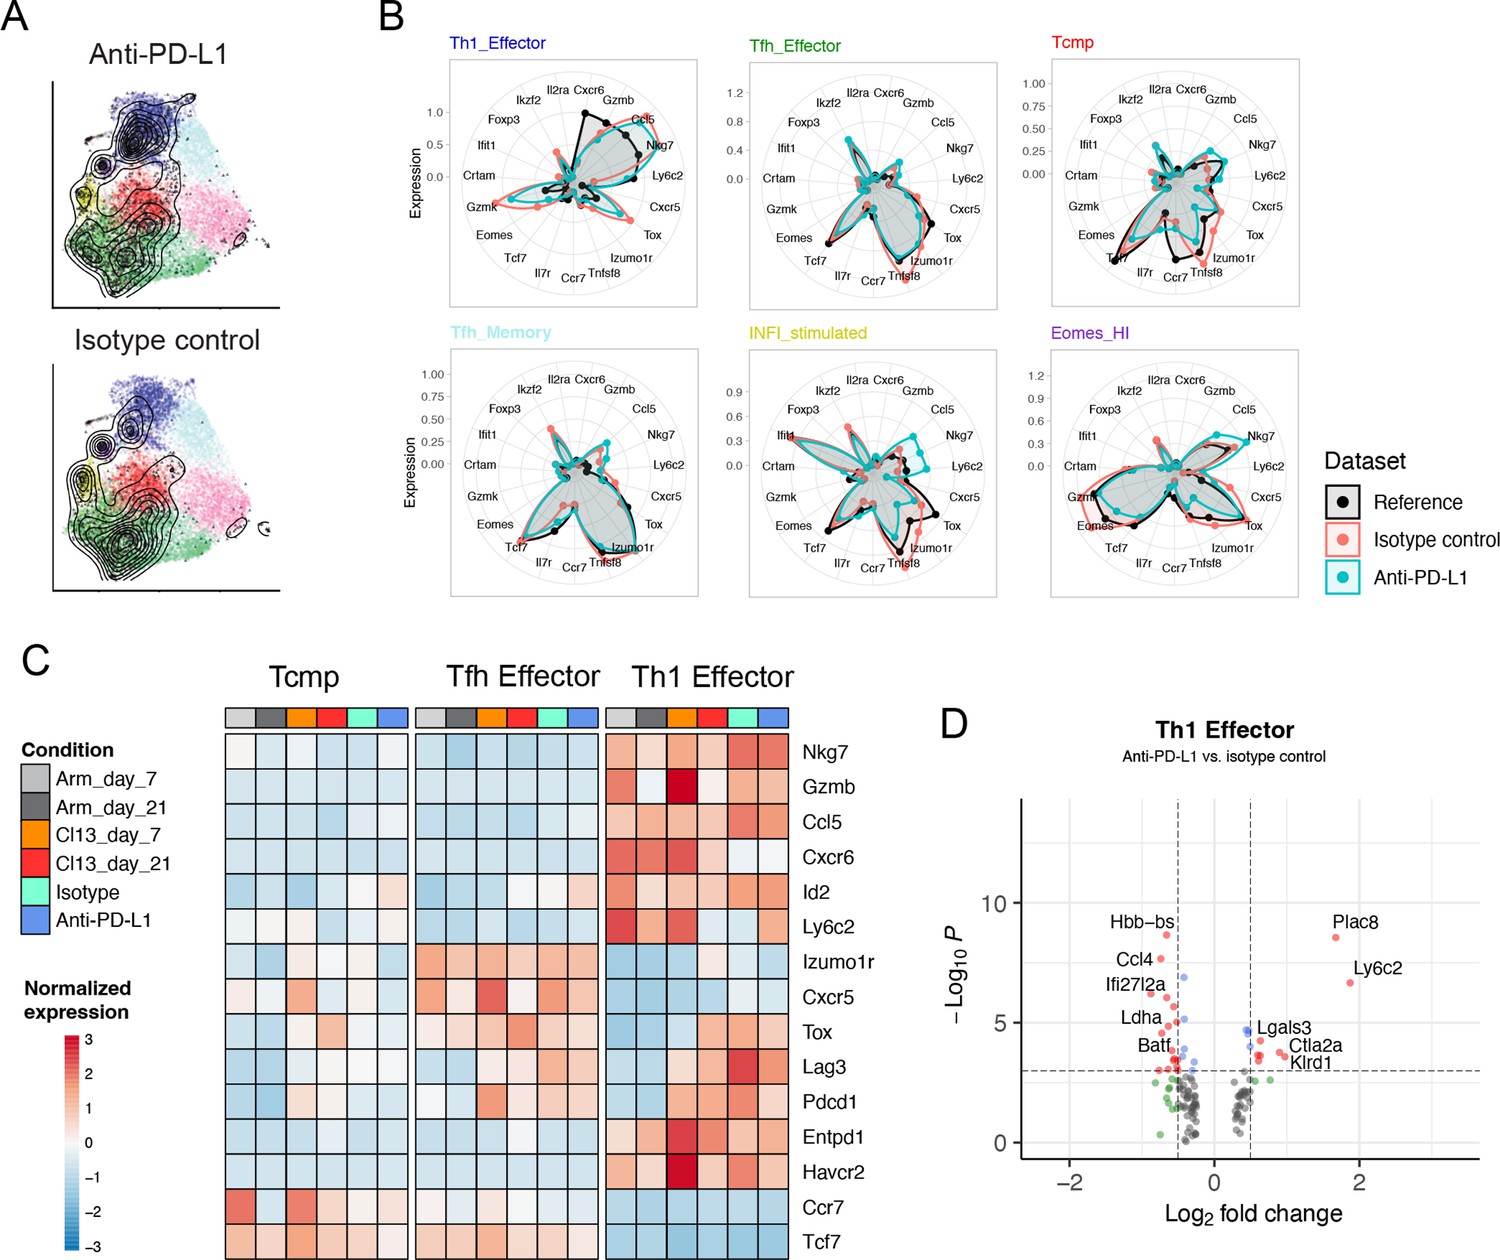
Reference-based analysis of CD4+ T cells in late chronic infection.
(A) UMAP embeddings of projected scRNA-seq data of virus-specific (SMARTA) CD4+ T cells isolated from anti-PDL1 treated or isotype control animals with LCMV chronic infection at day 33 p.i., from the study by Snell et al., 2021. (B) Average expression profiles for a panel of marker genes in the six most represented reference cell states, for the reference and the two conditions (isotype vs. anti-PDL1 treated). (C) Average expression, normalized by row, for a panel of lineage genes and exhaustion markers in each timepoint represented by the reference map, as well as for the two projected samples. (D) Differentially expressed genes between isotype-treated and anti-PDL1-treated Th1 effector cells; red points identify genes with log2 fold-change >0.5 and p-value <10–3 (Wilcoxon test).
Figure 6
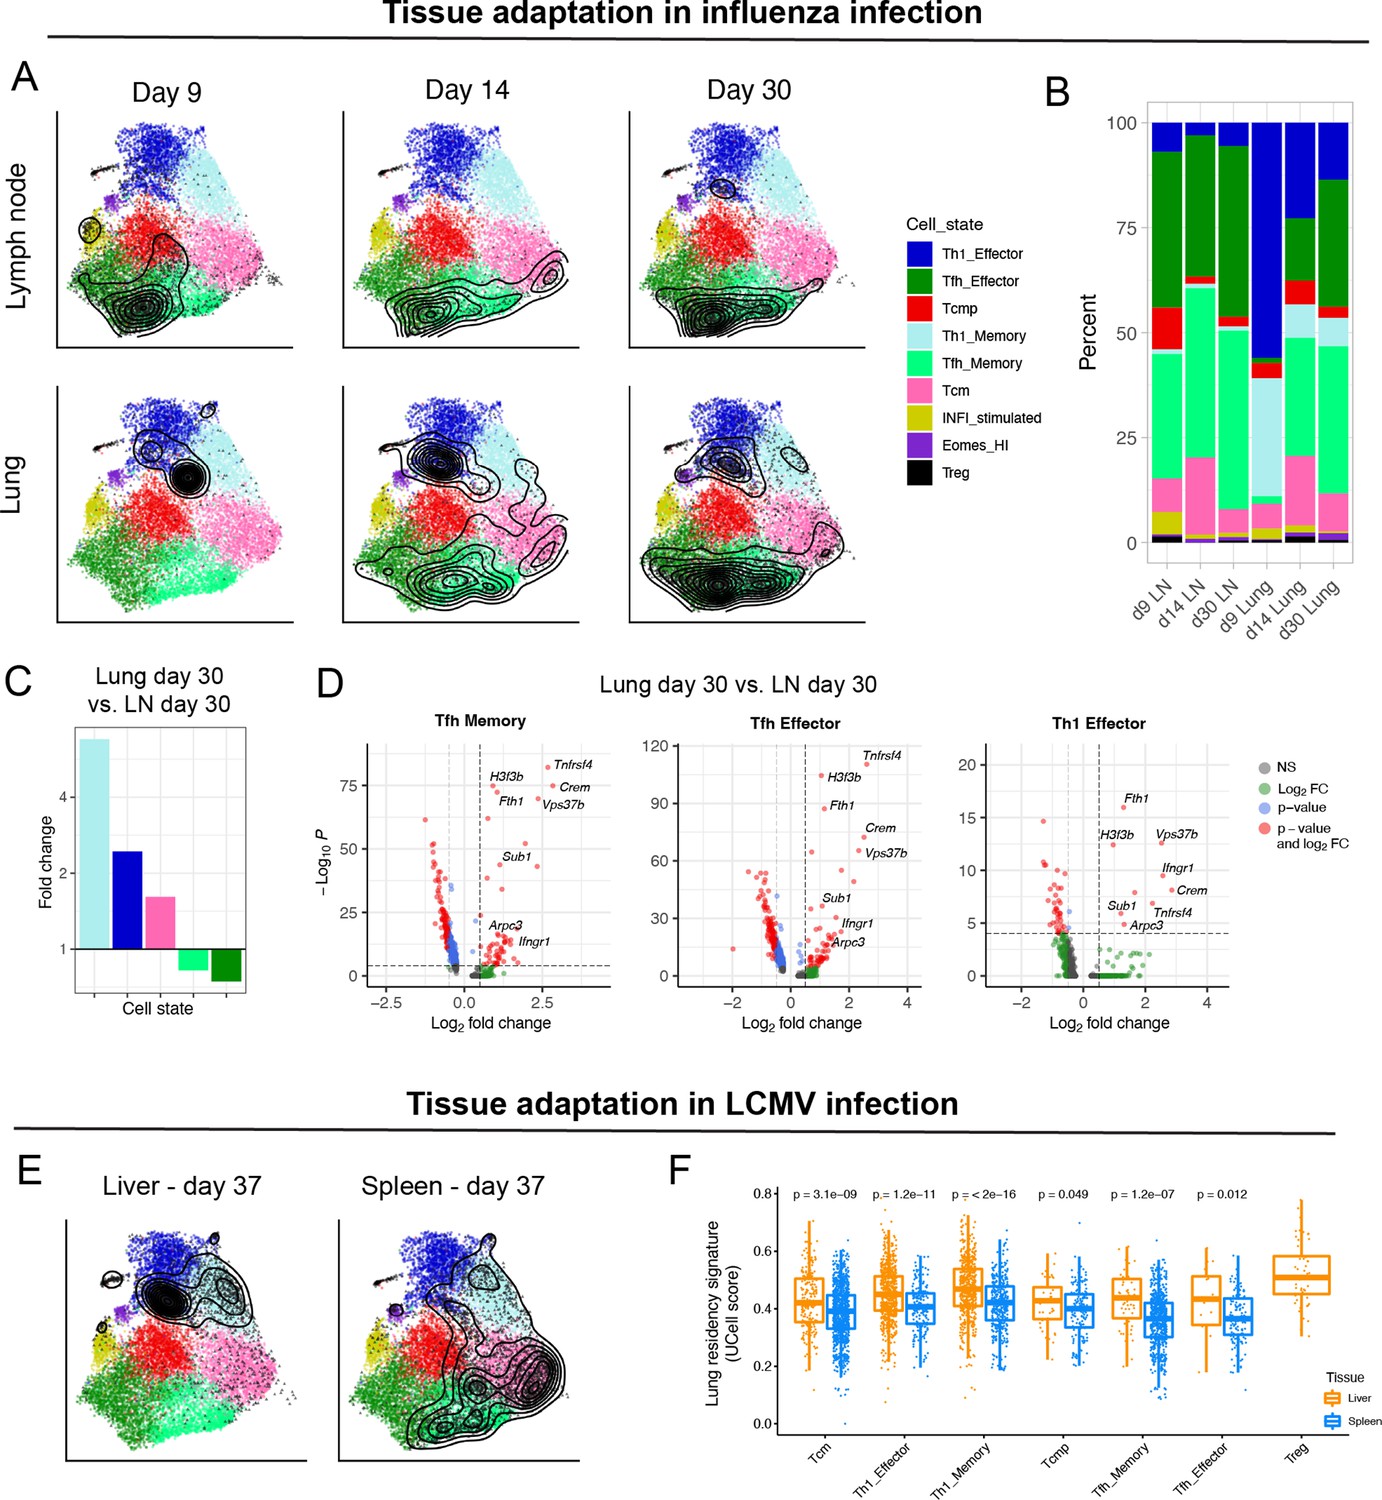
Diversity of virus-specific CD4+ T cells across tissues.
(A) Reference projection of influenza-specific CD4+ T cells isolated from draining lymph nodes and lungs at different timepoints after infection (Swarnalekha et al., 2021). Black contour lines represent density of cells over the reference UMAP embeddings. (B) Summary of subtype composition (percentage of total cells) for each of the six samples in this study. (C) Fold-change of cell subtype proportions between lung and lymph node at day 30 p.i. (D) Differentially expressed genes for select subtypes between lung and lymph node at day 30 p.i. The genes consistently found in all three comparisons (hereby ‘lung residency signature’) are: Crem, Tnfrsf4, H3f3b, Fth1, Ifngr1, Vps37b, Sub1, and Arpc3 (p-values from Wilcoxon test). (E) Reference projection of LCMV-specific CD4+ T cells from liver and spleen at day 37 p.i. (Künzli et al., 2020). (F) UCell scores on spleen and liver samples for the “lung residency signature” learned from CD4+ T cells in influenza infection (p-values from Wilcoxon test).
Figure 7
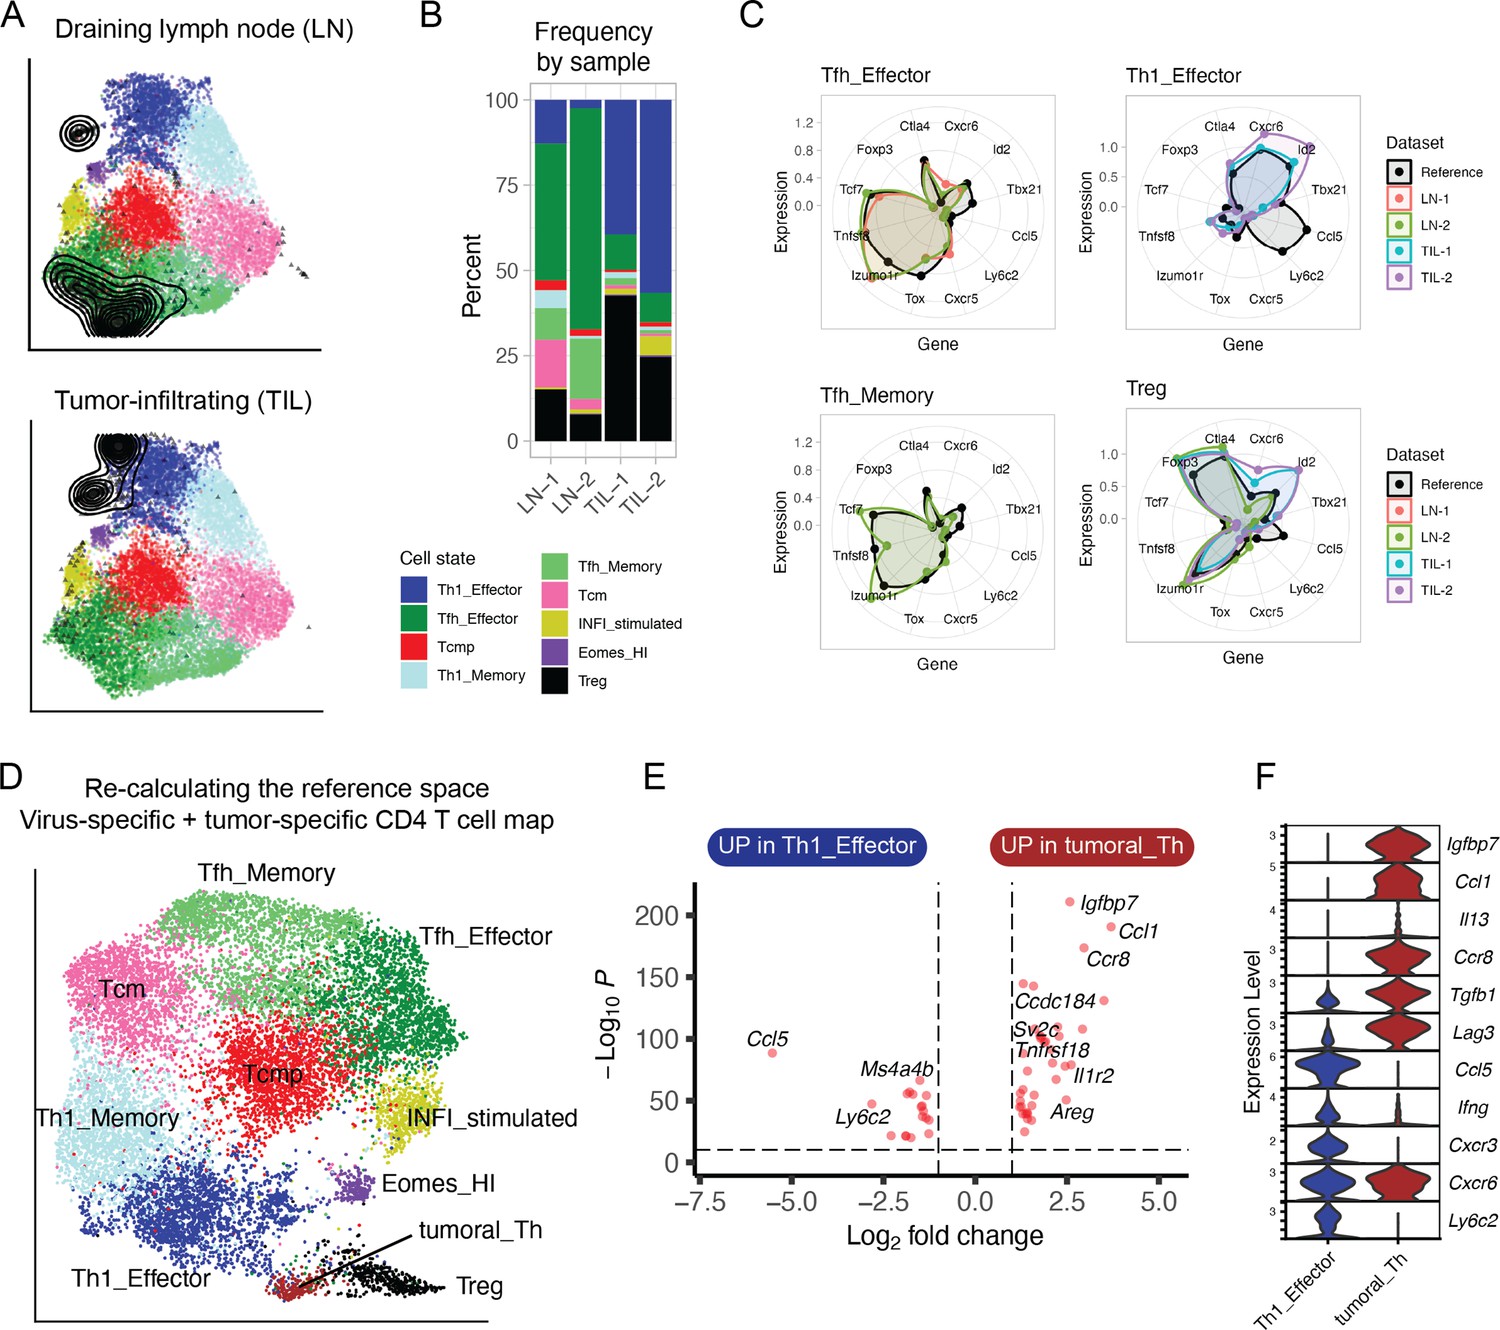
Projection of tumor-specific CD4+ T cells into the reference viral map.
(A) Reference projection of tumor-specific (GP66:I-Ab+) CD4+ T cells isolated from the tumors (TIL) or draining lymph nodes (LN) of animals inoculated with MC38-GP tumor. Black points and contour lines represent projected cells and their density over the reference UMAP embeddings. (B) Subtype composition as percentage of total cells for each sample. (C) Radar plots showing average expression profiles of a panel of CD4+ T cell marker genes, for the projected tumor-specific CD4+ T cells from the indicated organs compared to the reference map profiles (black). (D) Re-calculated UMAP plot generated after merging virus-specific T cell data (reference map) with tumor-specific T cell data (projected data). Non-Treg, non-Tfh tumor-infiltrating CD4+ T lymphocytes (TILs) emerge as a distinct cluster (‘Tumoral_Th’). (E) Differentially expressed genes between virus-specific T helpers (Th1 Effector) and tumor-infiltrating T helpers (‘Tumoral_Th’); p-values from Wilcoxon test. (F) Expression of genes associated with Th1 or Th2 functions in the indicated cell subtypes (log-normalized UMI counts).
Author response image 1
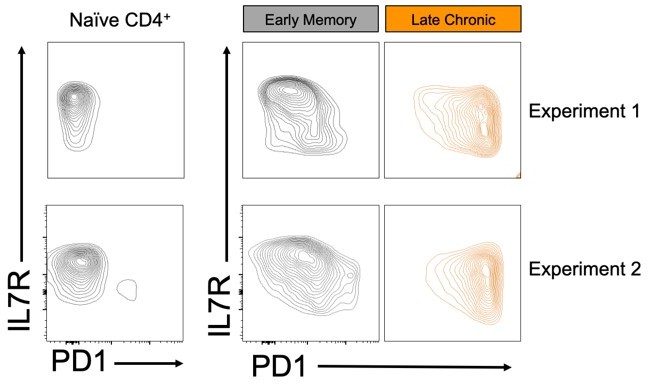
Flow cytometry expression of PD1 and IL7R on naïve and GP66 CD4+ T cells for each of the indicated sample processed for scRNAseq capture.
Additional files
-
Transparent reporting form
- https://cdn.elifesciences.org/articles/76339/elife-76339-transrepform1-v2.docx
-
Supplementary file 1
Summary of scRNA-seq and scTCR-seq data generated in this study.
- https://cdn.elifesciences.org/articles/76339/elife-76339-supp1-v2.xlsx
-
Supplementary file 2
Gene signatures for CD4+ T cell subtypes.
- https://cdn.elifesciences.org/articles/76339/elife-76339-supp2-v2.xlsx
-
Supplementary file 3
Auxiliary gene sets used in this study.
- https://cdn.elifesciences.org/articles/76339/elife-76339-supp3-v2.xlsx
Download links
A two-part list of links to download the article, or parts of the article, in various formats.
Downloads (link to download the article as PDF)
Open citations (links to open the citations from this article in various online reference manager services)
Cite this article (links to download the citations from this article in formats compatible with various reference manager tools)
A CD4+ T cell reference map delineates subtype-specific adaptation during acute and chronic viral infections
eLife 11:e76339.
https://doi.org/10.7554/eLife.76339


