Humanization of wildlife gut microbiota in urban environments
- Department of Ecology and Evolutionary Biology, Cornell University, United States
- Princeton University, United States
- Tulane University, United States
Figures
Figure 1 with 7 supplements
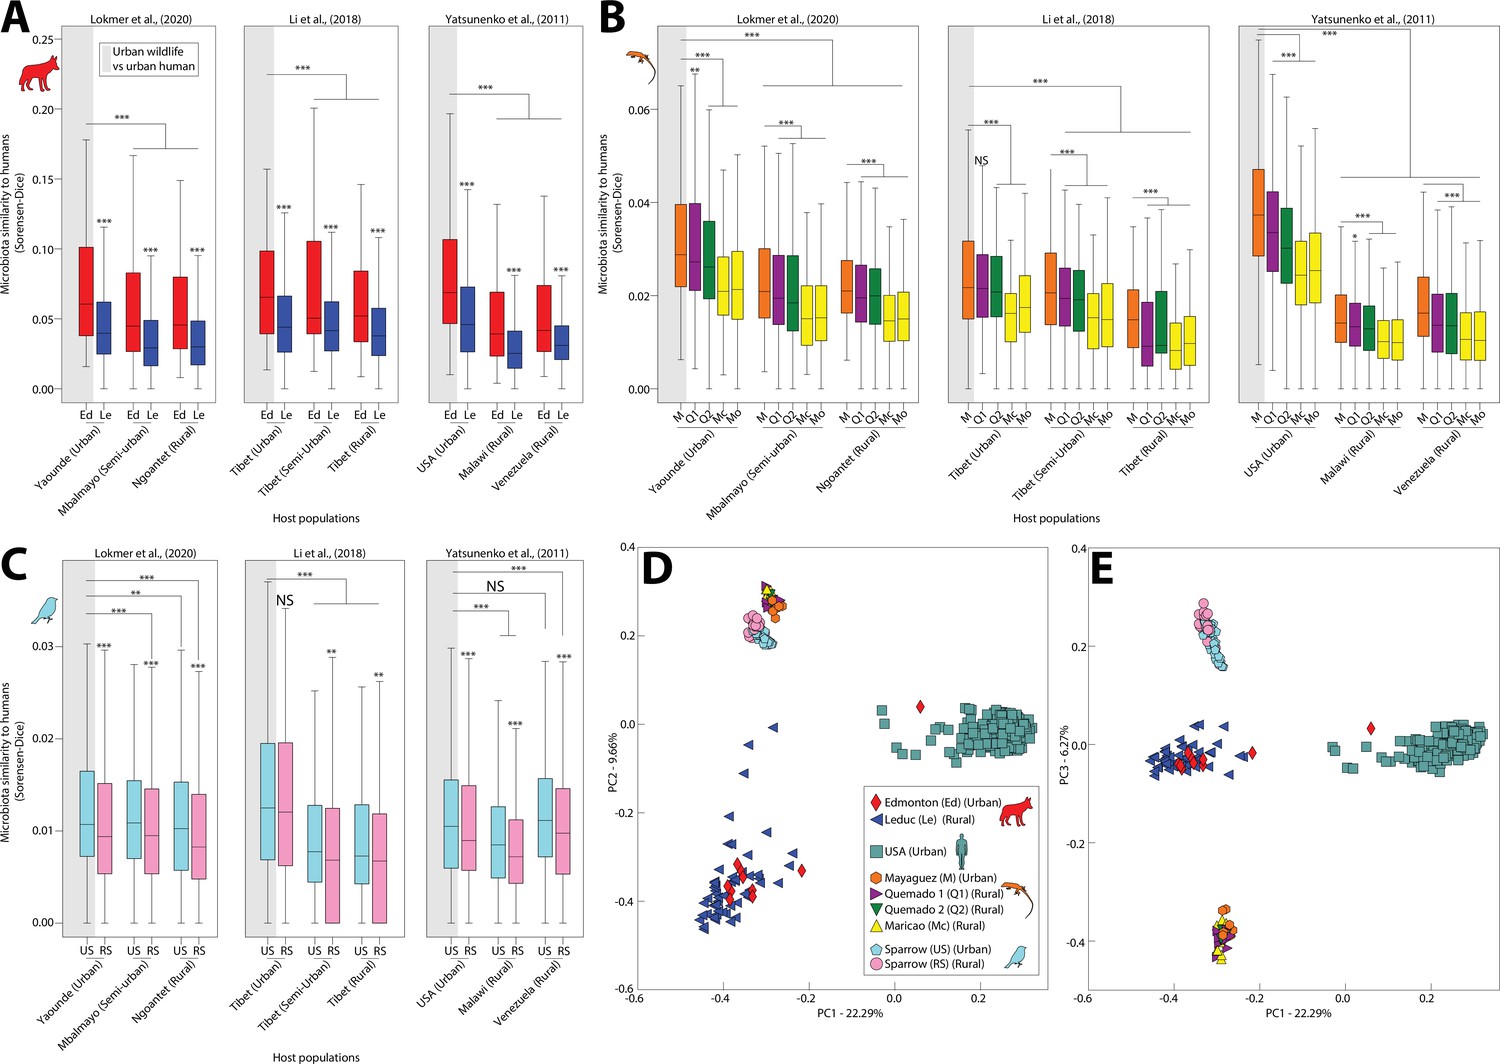
Humanization of urban anole and coyote gut microbiota.
Boxplots in (A–C) show microbiota similarities (binary Sorensen–Dice) between wildlife and human populations. Each panel (A–C) contains results derived from comparisons including a single wildlife species, and each plot within each panel contains results derived from comparisons including a single human datasets (Lokmer et al., 2020; Li et al., 2018; or Yatsunenko et al., 2012). Each box corresponds to comparisons including a single wildlife population as indicated by the key in (D). Gray shading behind single boxplot in each plot indicates the comparison between urban wildlife and urban human populations. Boxplots display median and interquartile range. Asterisks directly above boxplots indicate significant differences of dissimilarity to a single human population between urban and rural conspecific wildlife populations. Other asterisks indicate significant differences to the comparison between urban wildlife and urban humans (leftmost boxplot in each plot). p values were calculated from nonparametric Monte Carlo permutation tests; NS p > 0.05; *p < 0.05; **p < 0.01; ***p = 0.001. Principal coordinates analysis plots in (D) and (E) show patterns of dissimilarities among anole, coyote, and human (USA adults) gut microbiota profiles based on binary Sorensen–Dice dissimilarities. Each point represents the gut-microbiota profile of an individual anole, coyote, sparrow, or human, as indicated by the key in (D).
Figure 1—figure supplement 1
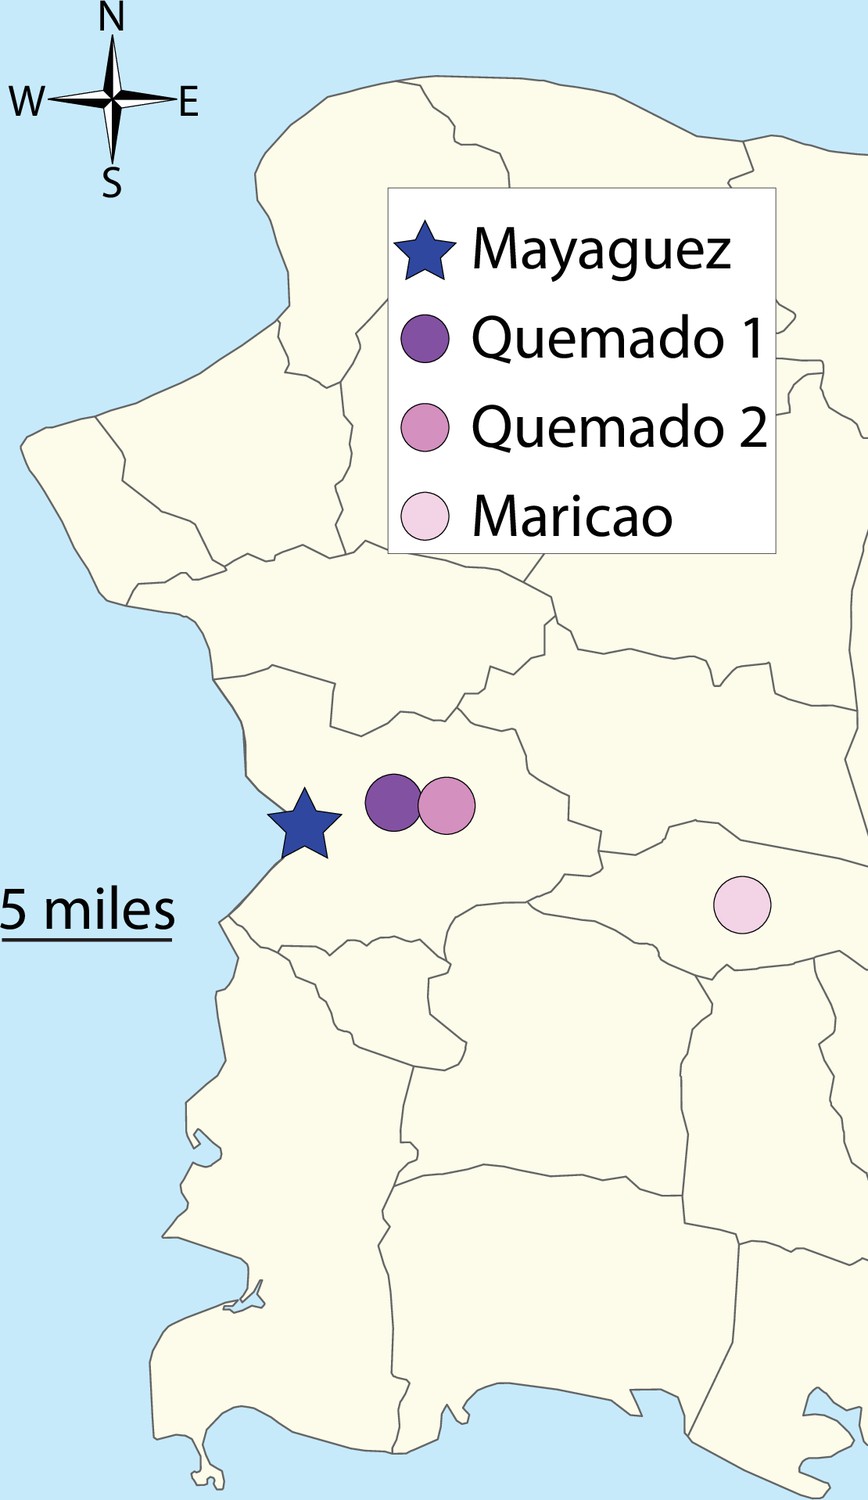
Map of wildlife sampling locations.
Circles and star indicate sampling sites of anole populations as indicated by the key. Star indicates urban sampling location and circles indicate rural sampling locations.
Figure 1—figure supplement 2
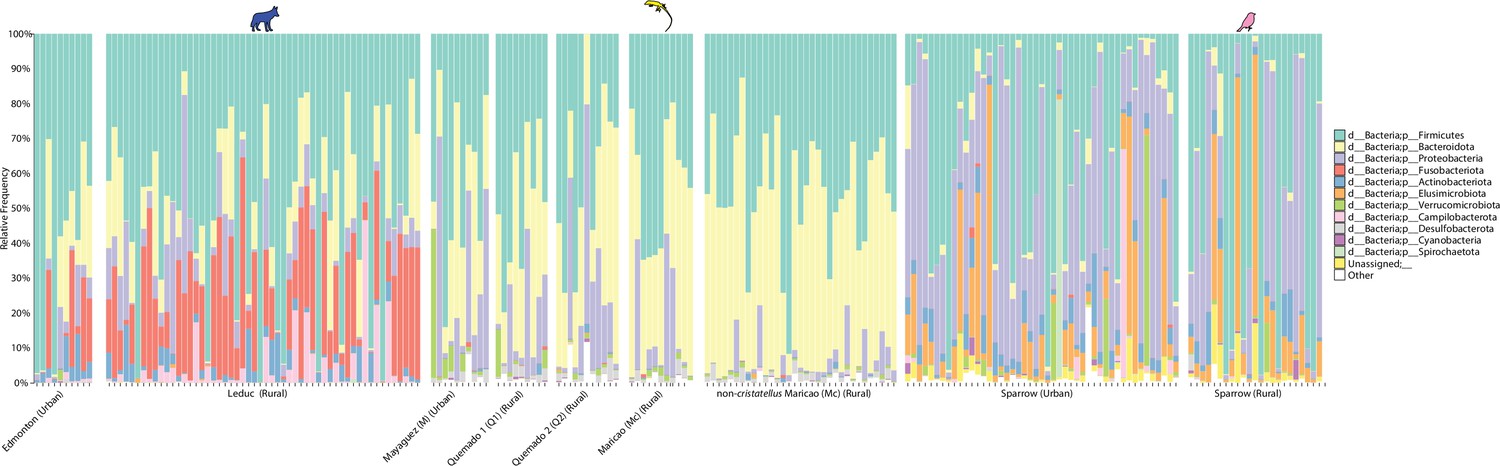
Taxonomic profiles of gut microbiota in urban and nonurban locations.
Stacked barplots display the relative abundances of bacterial phyla in anoles and coyotes from locations shown in Figure 1. Each bar corresponds to a bacterial phylum as indicated by the key.
Figure 1—figure supplement 3
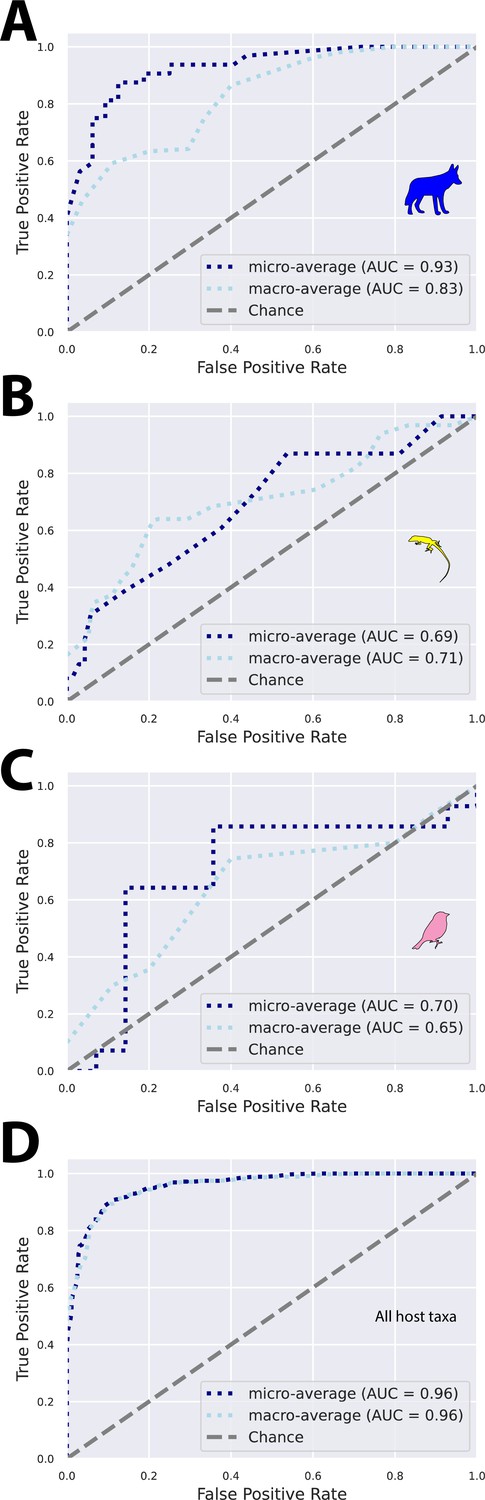
Random forest analyses discriminate urban and rural wildlife populations.
Receiver operating characteristic (ROC) curves show classification accuracies of random forest models trained to differentiate between urban and rural populations for coyotes (A), anoles (B), and sparrows (C). In (D), all host taxa were included in a single analysis in which models were trained to differentiate rural and urban individuals. For all panels, models were trained using a random 50% subset of the samples for each wildlife species and tested on the remaining 50%. Plots were generated using ‘qiime sample-classifier classify-samples’ in QIIME2.
Figure 1—figure supplement 4
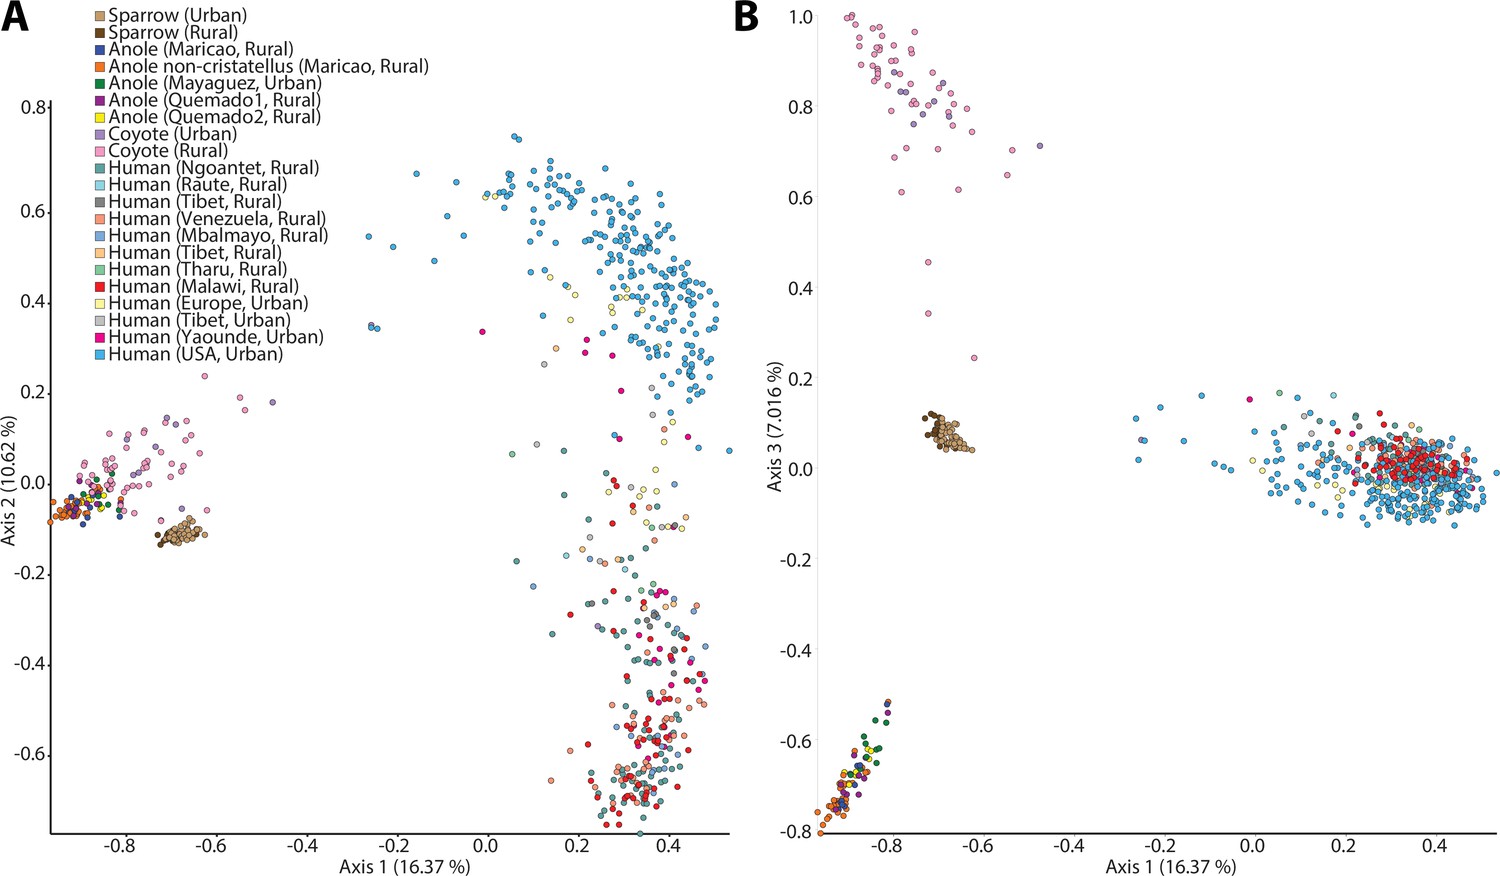
Principal coordinates plots of all samples.
Plots show first and second (A) and first and third (B) axes from principal coordinates analyses of Sorensen–Dice dissimilarities among samples. Each point represents a sample, and points are colored based on host population as indicated in the key.
Figure 1—figure supplement 5
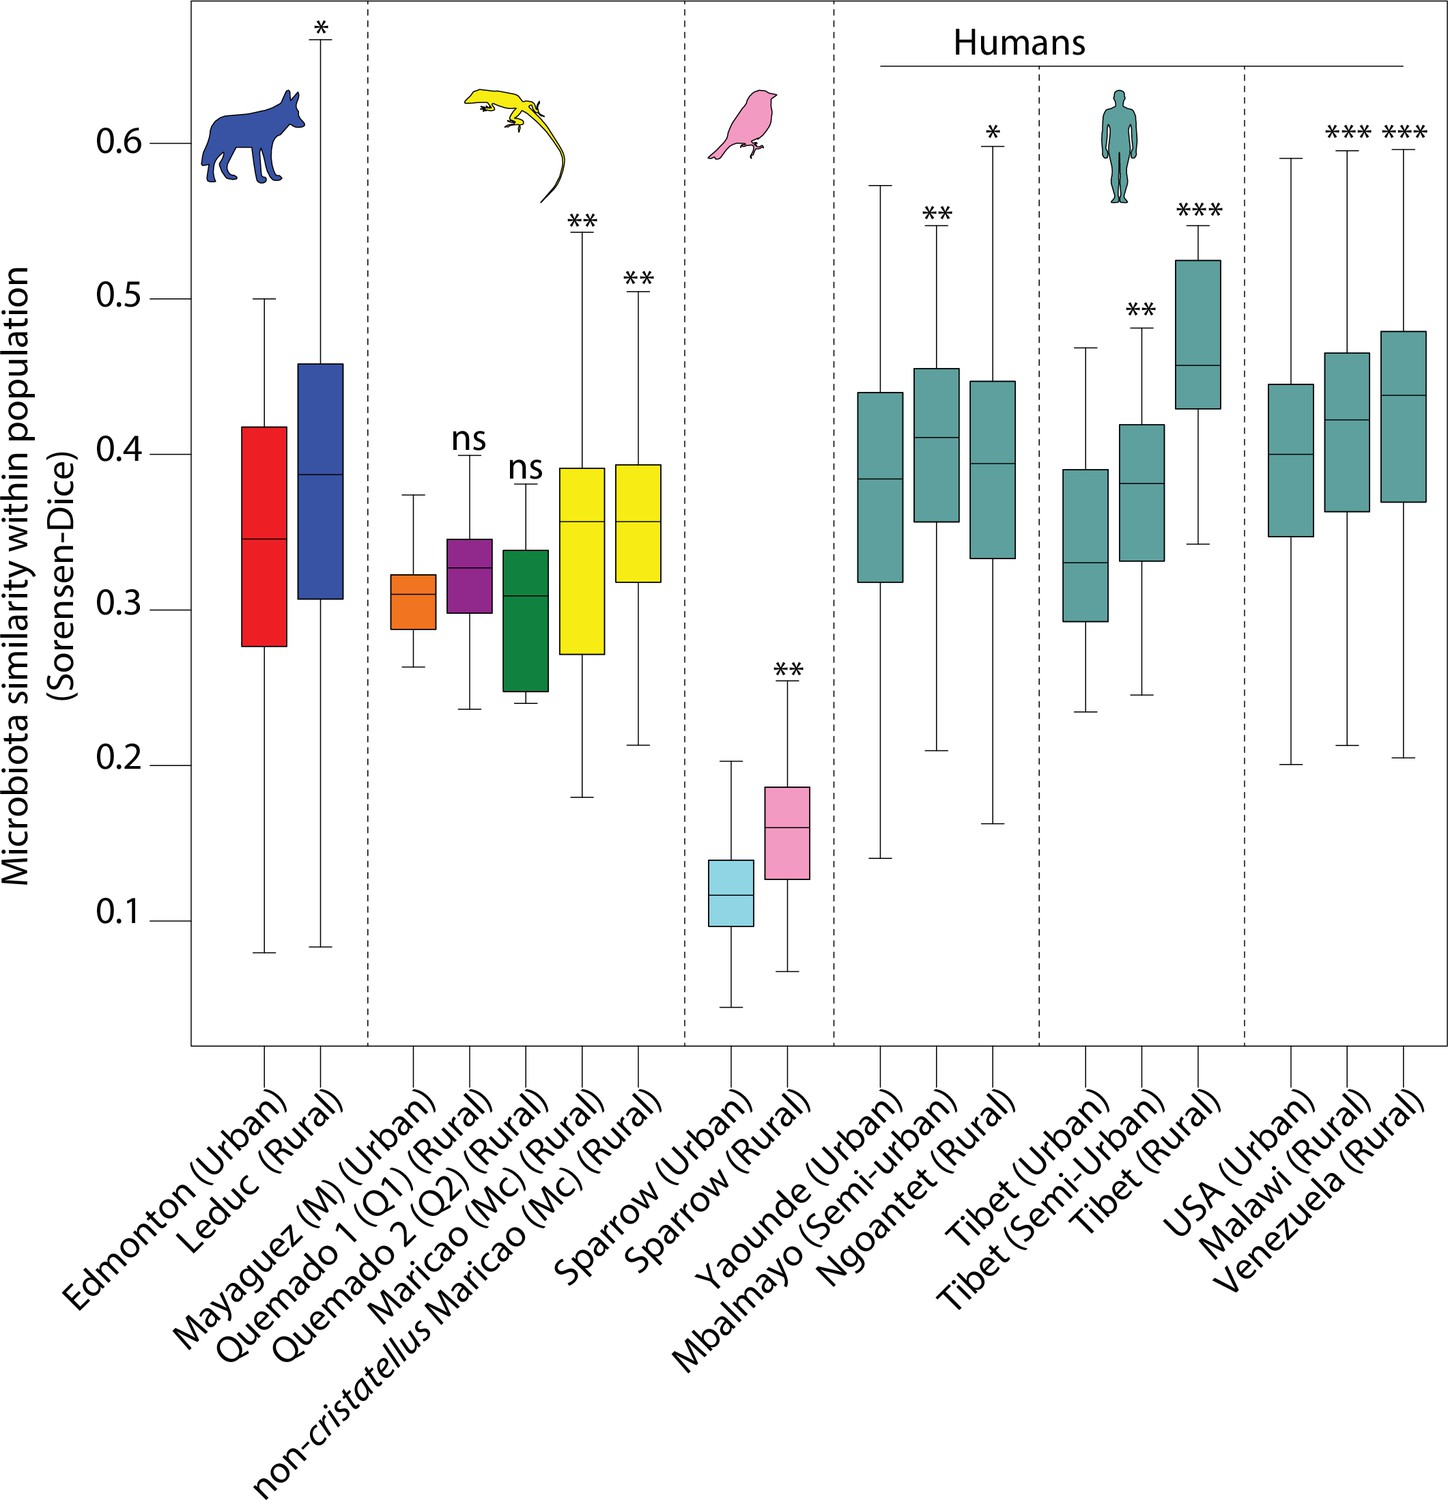
Differences among intrapopulation beta diversity between urban and nonurban populations.
Boxplots show median and interquartile ranges of Sorensen–Dice beta diversity dissimilarities within each population. Asterisks indicate significant differences between rural and urban populations within each dataset based on Kruskal–Wallis tests; NS p > 0.05; *p < 0.05; **p < 0.01; ***p = 0.001.
Figure 1—figure supplement 6
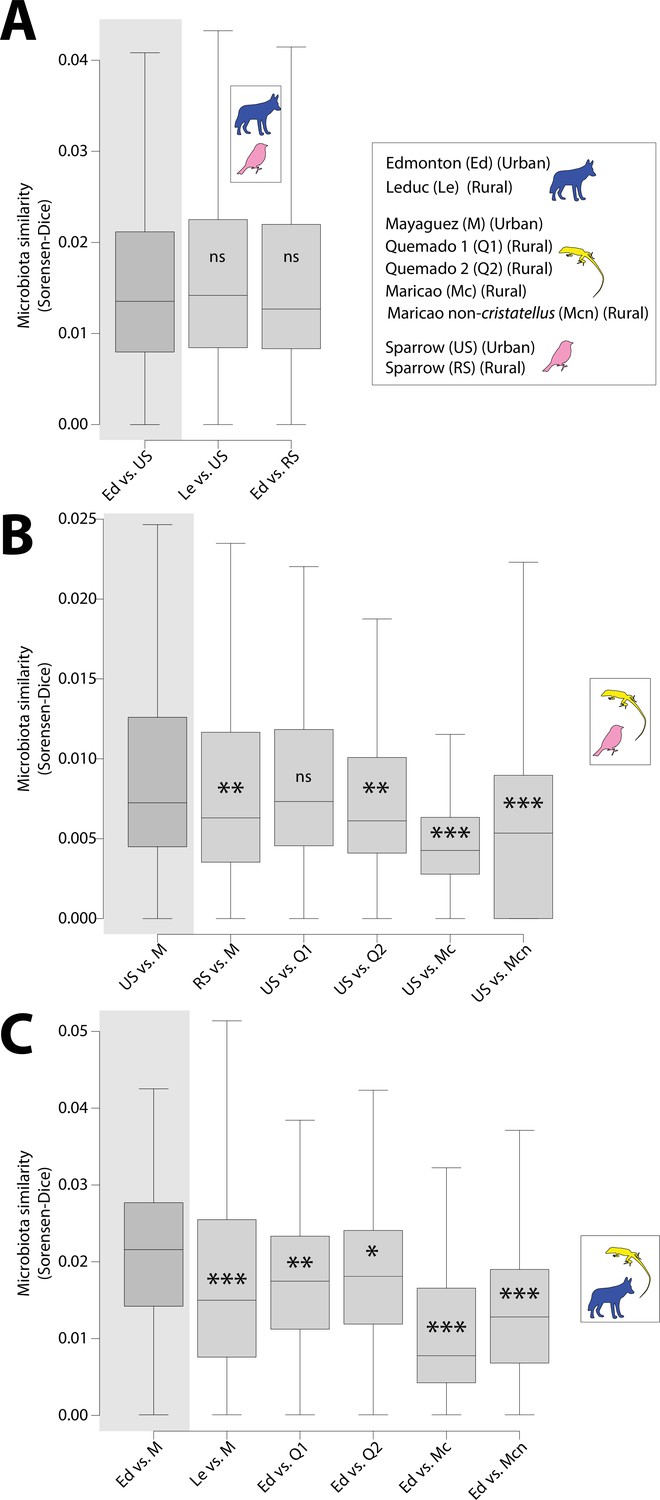
Tests for convergence of gut microbiota between wildlife species in urban environments.
Boxplots show median and interquartile ranges of Sorensen–Dice beta diversity dissimilarities between pairs of populations; coyotes and sparrows (A), sparrows and anoles (B), and coyotes and anoles (C). Host population names are abbreviated as indicated in the key. Inset within each set of plots shows host species being compared. Gray shared region denotes comparison of urban populations. Significant differences relative to the comparison between urban populations are shown with asterisks; NS p > 0.05; *p < 0.05; **p < 0.01; ***p = 0.001. Test statistics and p values for comparisons are presented in Supplementary file 4.
Figure 1—figure supplement 7
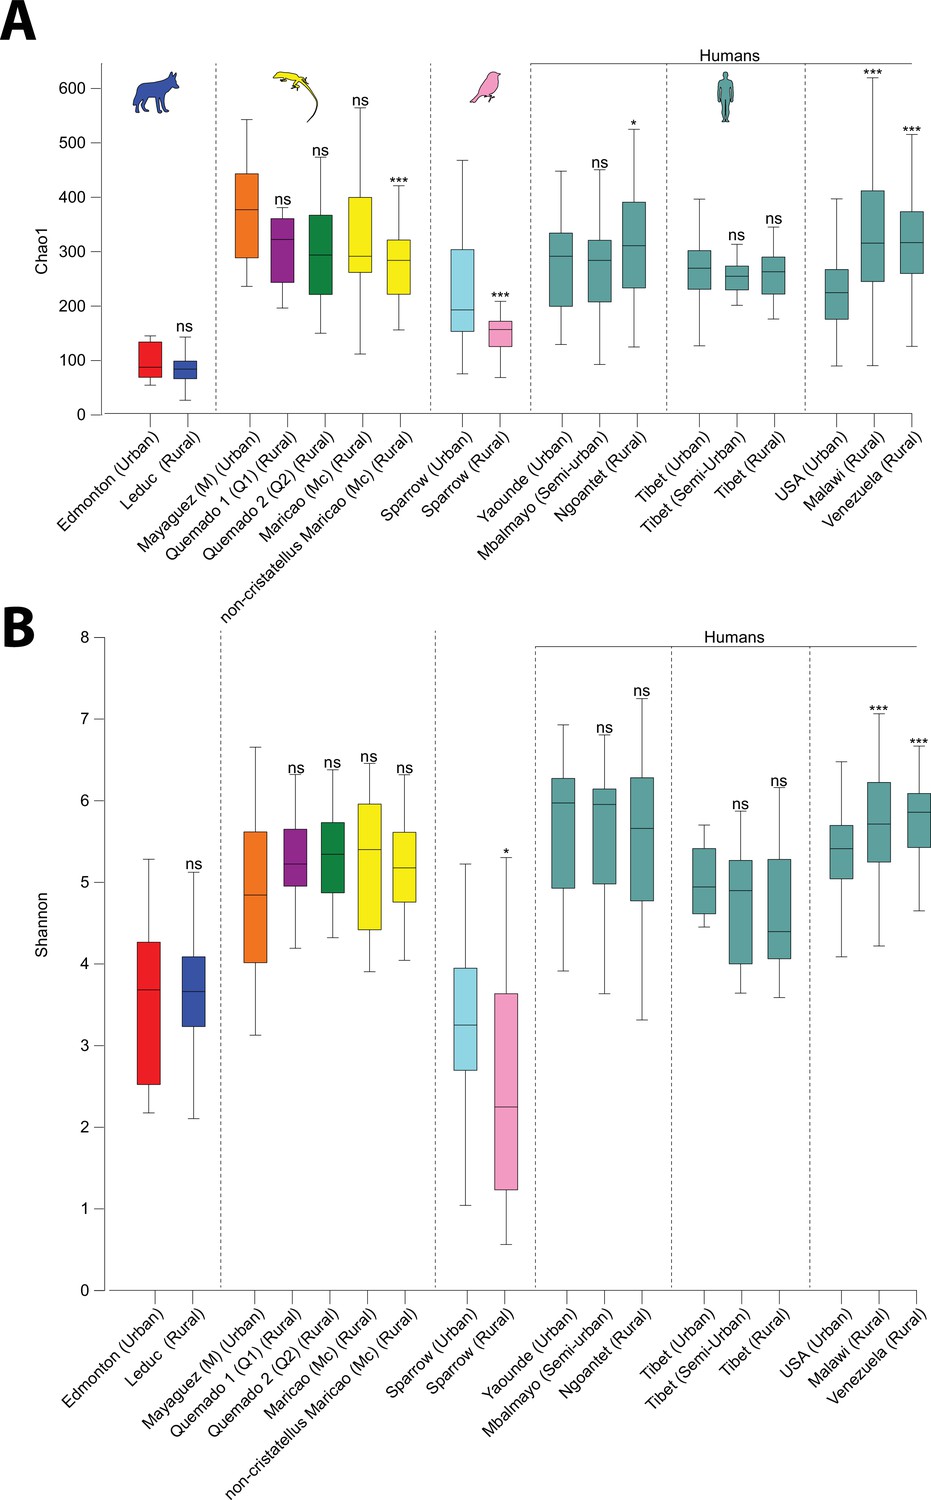
Differences in alpha diversity between urban and nonurban populations.
Boxplots show median and interquartile ranges of alpha diversity dissimilarities Chao1 (A) and Shannon entropy (B) within each population. Asterisks indicate significant differences between rural and urban populations within each dataset based on Kruskal–Wallis tests; NS p > 0.05; *p < 0.05; ***p < 0.001.
Figure 2 with 4 supplements
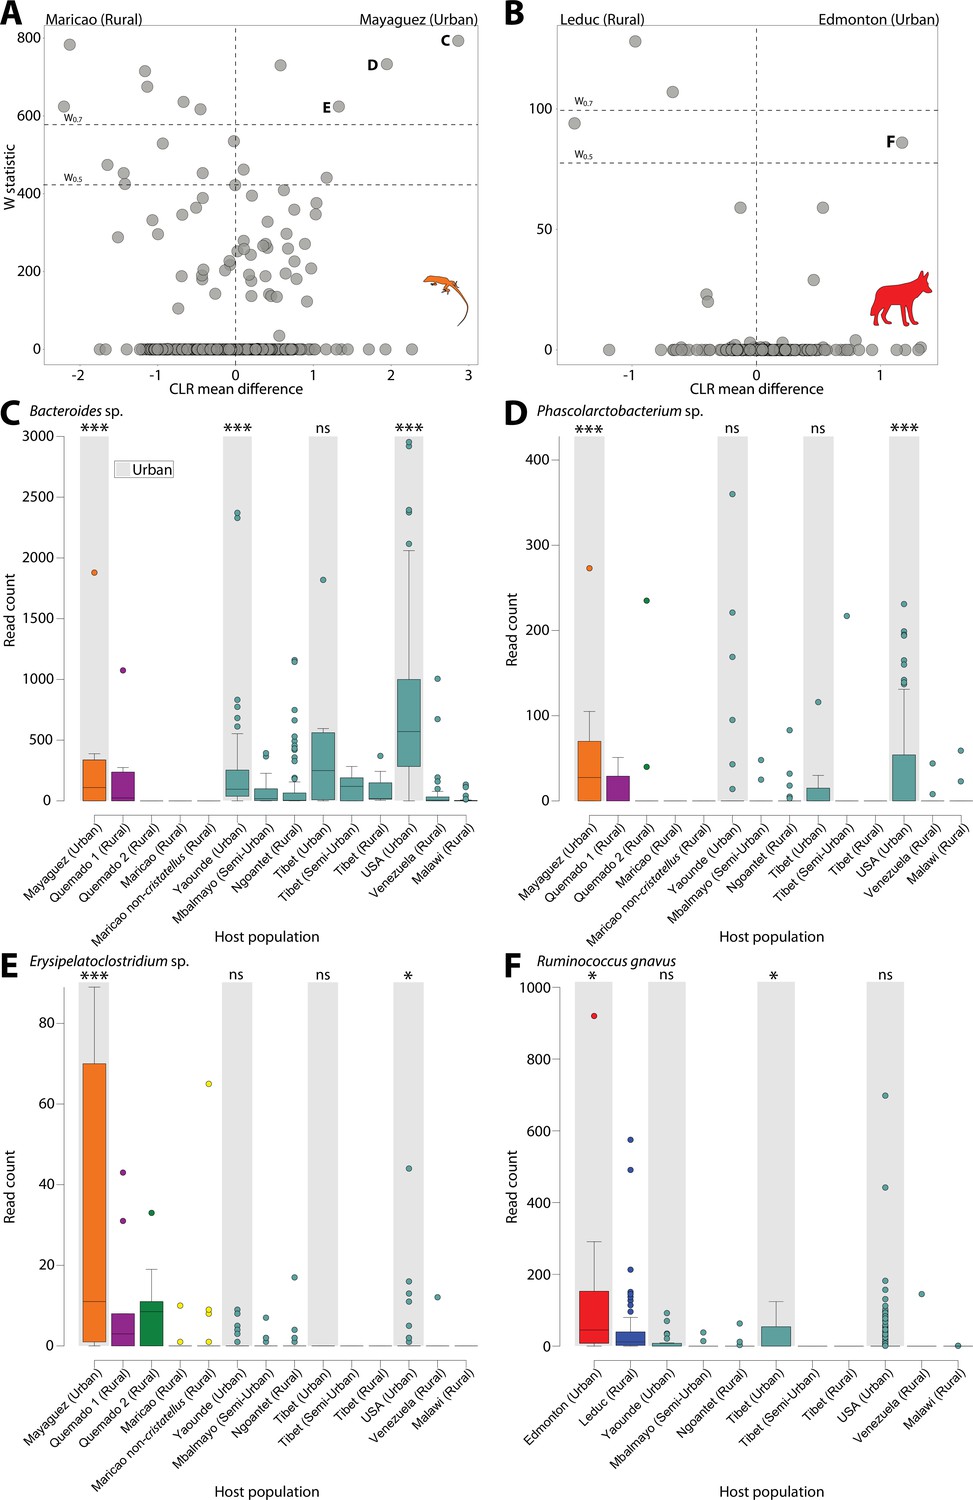
Differentially abundant Amplicon Sequence Variants (ASVs) between populations in urban and natural settings.
Volcano plots display the results of ANCOM tests for ASVs that were differentially abundant between urban and rural populations of anoles (A) and coyotes (B) and between urban and rural populations in at least one human dataset. ANCOM results from sparrows showed no significant overlap with human datasets and are presented in Figure 2—figure supplement 1. Each point represents an ASV, with the x-axis denoting the centered log ratio mean difference of the relative abundance of the ASV between urban and rural populations as calculated by ANCOM (Teyssier et al., 2020). The y-axis indicates the ANCOM test statistic (W), and horizontal dashed lines indicate the significance levels W = 0.7 and W = 0.5. Panel (A) displays results of ANCOM tests comparing Mayagüez and Maricao anoles. Results of ANCOM tests comparing Mayagüez anoles with anoles from the other two sampling locations are presented in Figure 2—figure supplement 2. Human ANCOM results are shown in Figure 2—figure supplement 3. Boxplots in (C) – (E) show the relative abundances of ASVs that were significantly overrepresented in Mayagüez (urban) anoles relative to Maricao anoles based on ANCOM analyses shown in (A) and differentially abundant in at least one human dataset. Boxplots in (F) show the relative abundances of the single ASV that was significantly overrepresented in Edmonton (urban) coyotes relative to Leduc coyotes based on ANCOM analyses shown in (B) and differentially abundant in at least one human dataset. Boxplots display median and interquartile range. Note that each ASV displays parallel shifts in relative abundance in urban wildlife populations and humans relative to rural populations. Significant differences between ASV relative abundance between urban and rural populations for each dataset are indicated by asterisks above the boxplot for each urban population; ns W < 0.5; *W > 0.5; ***W > 0.7.
Figure 2—figure supplement 1
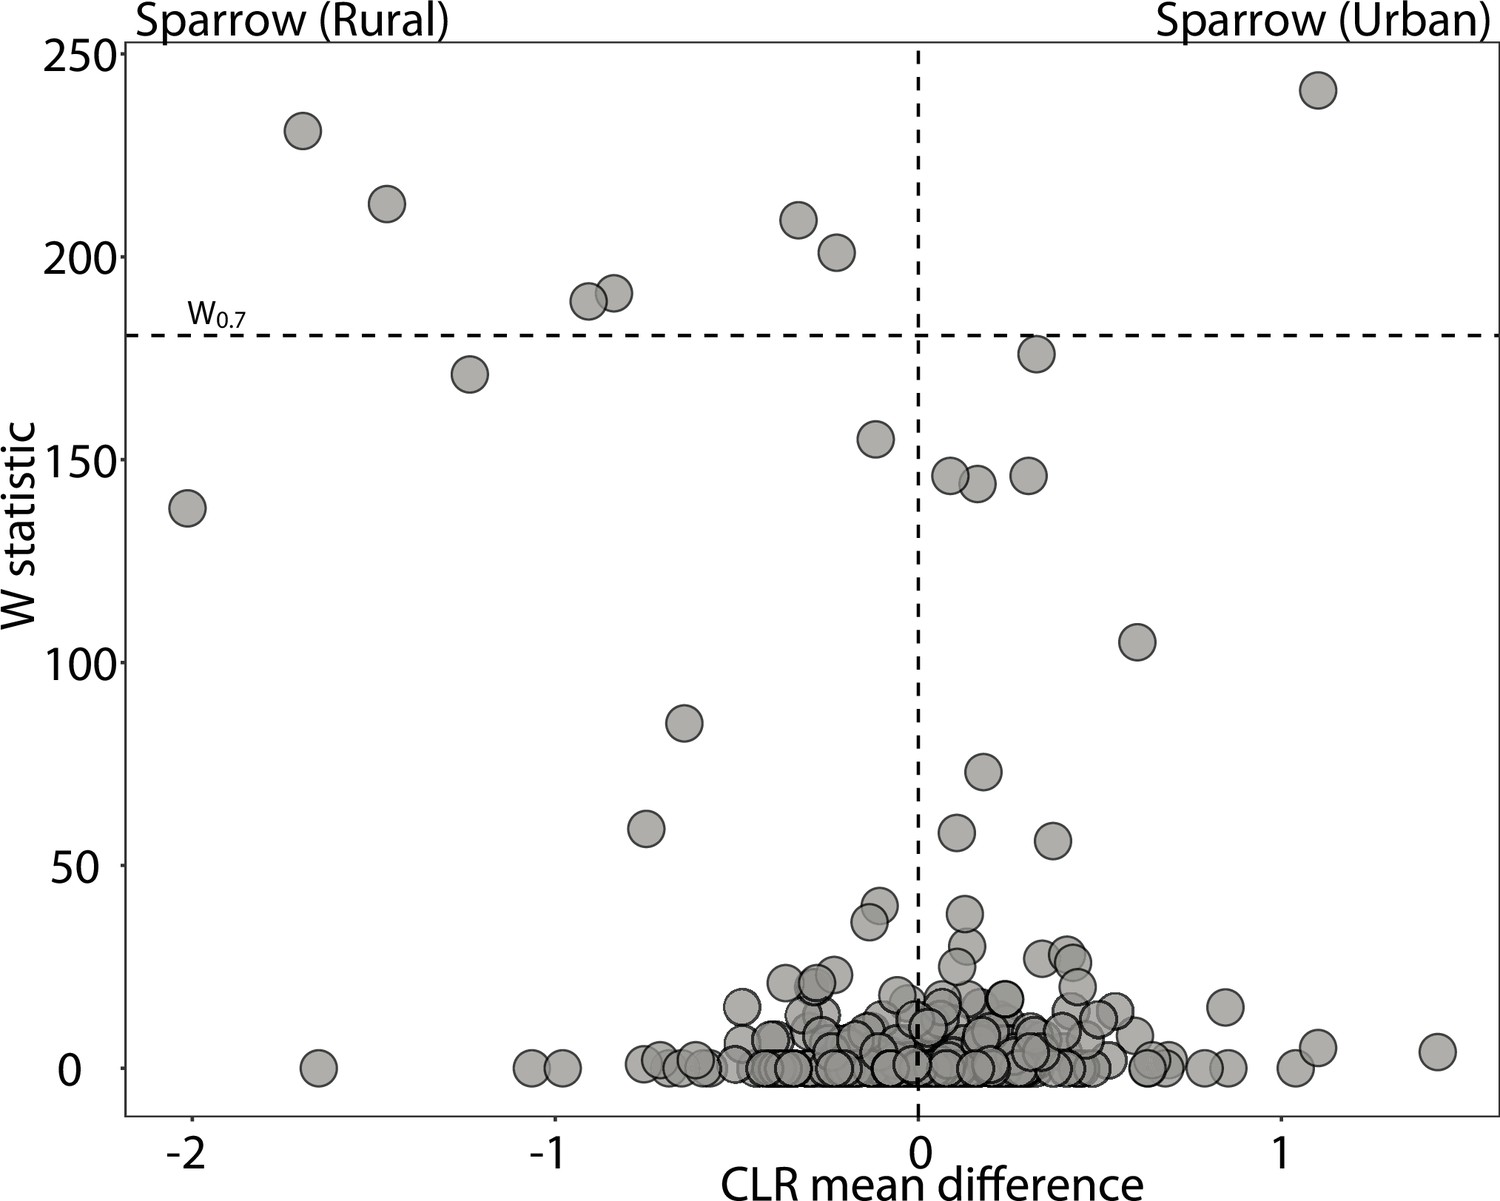
Differentially abundant Amplicon Sequence Variants (ASVs) between anole populations in urban and natural settings.
Volcano plots display the results of ANCOM tests for ASVs that were differentially abundant between urban and natural populations of sparrows. Each point represents an ASV, with the x-axis denoting the centered log ratio mean difference of the relative abundance of the ASV between urban and natural populations. The y-axis indicates the ANCOM test statistic (W), and horizontal dashed lines indicate the significance level W = 0.7.
Figure 2—figure supplement 2
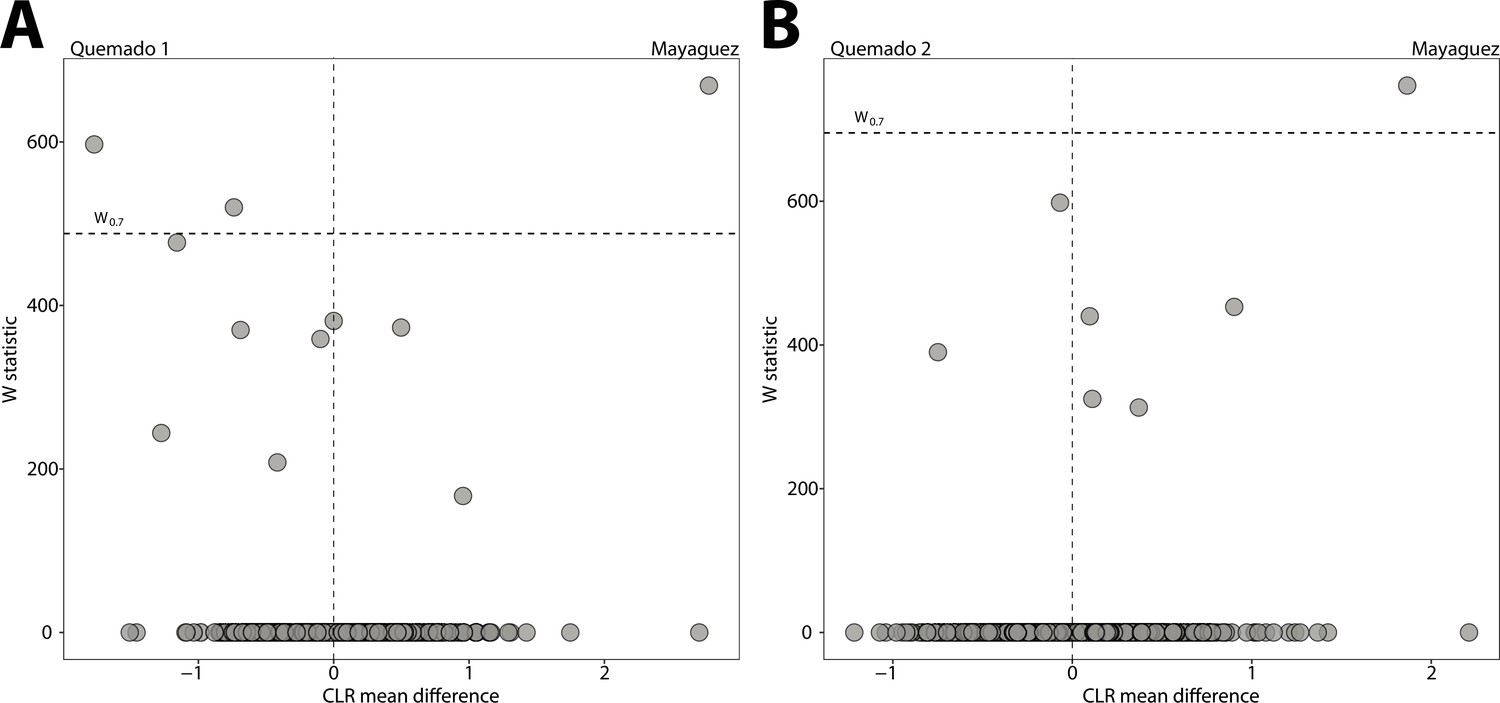
Differentially abundant Amplicon Sequence Variants (ASVs) between anole populations in urban and natural settings.
Volcano plots display the results of ANCOM tests for ASVs that were differentially abundant between urban and natural populations of anoles from (A) Mayaguez and Quemado 1 and (B) Mayaguez and Quemado 2. Each point represents an ASV, with the x-axis denoting the centered log ratio mean difference of the relative abundance of the ASV between urban and natural populations. The y-axis indicates the ANCOM test statistic (W), and horizontal dashed lines indicate the significance level W = 0.7.
Figure 2—figure supplement 3
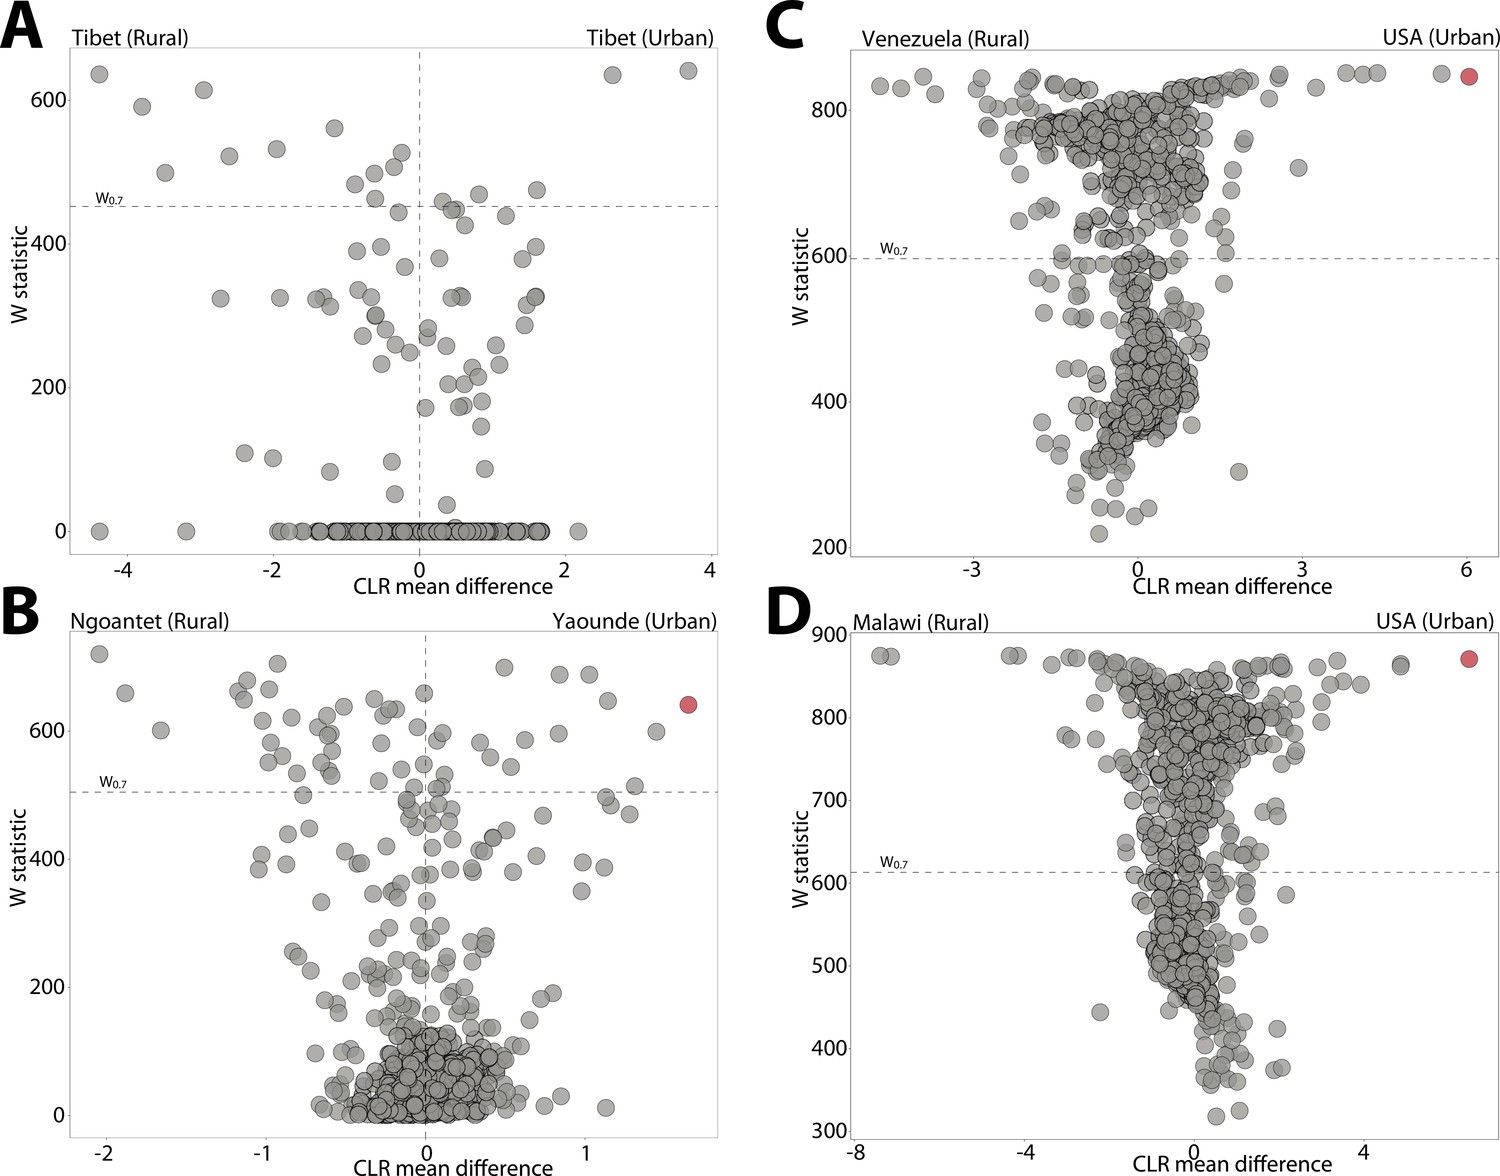
Differentially abundant Amplicon Sequence Variants (ASVs) between human populations.
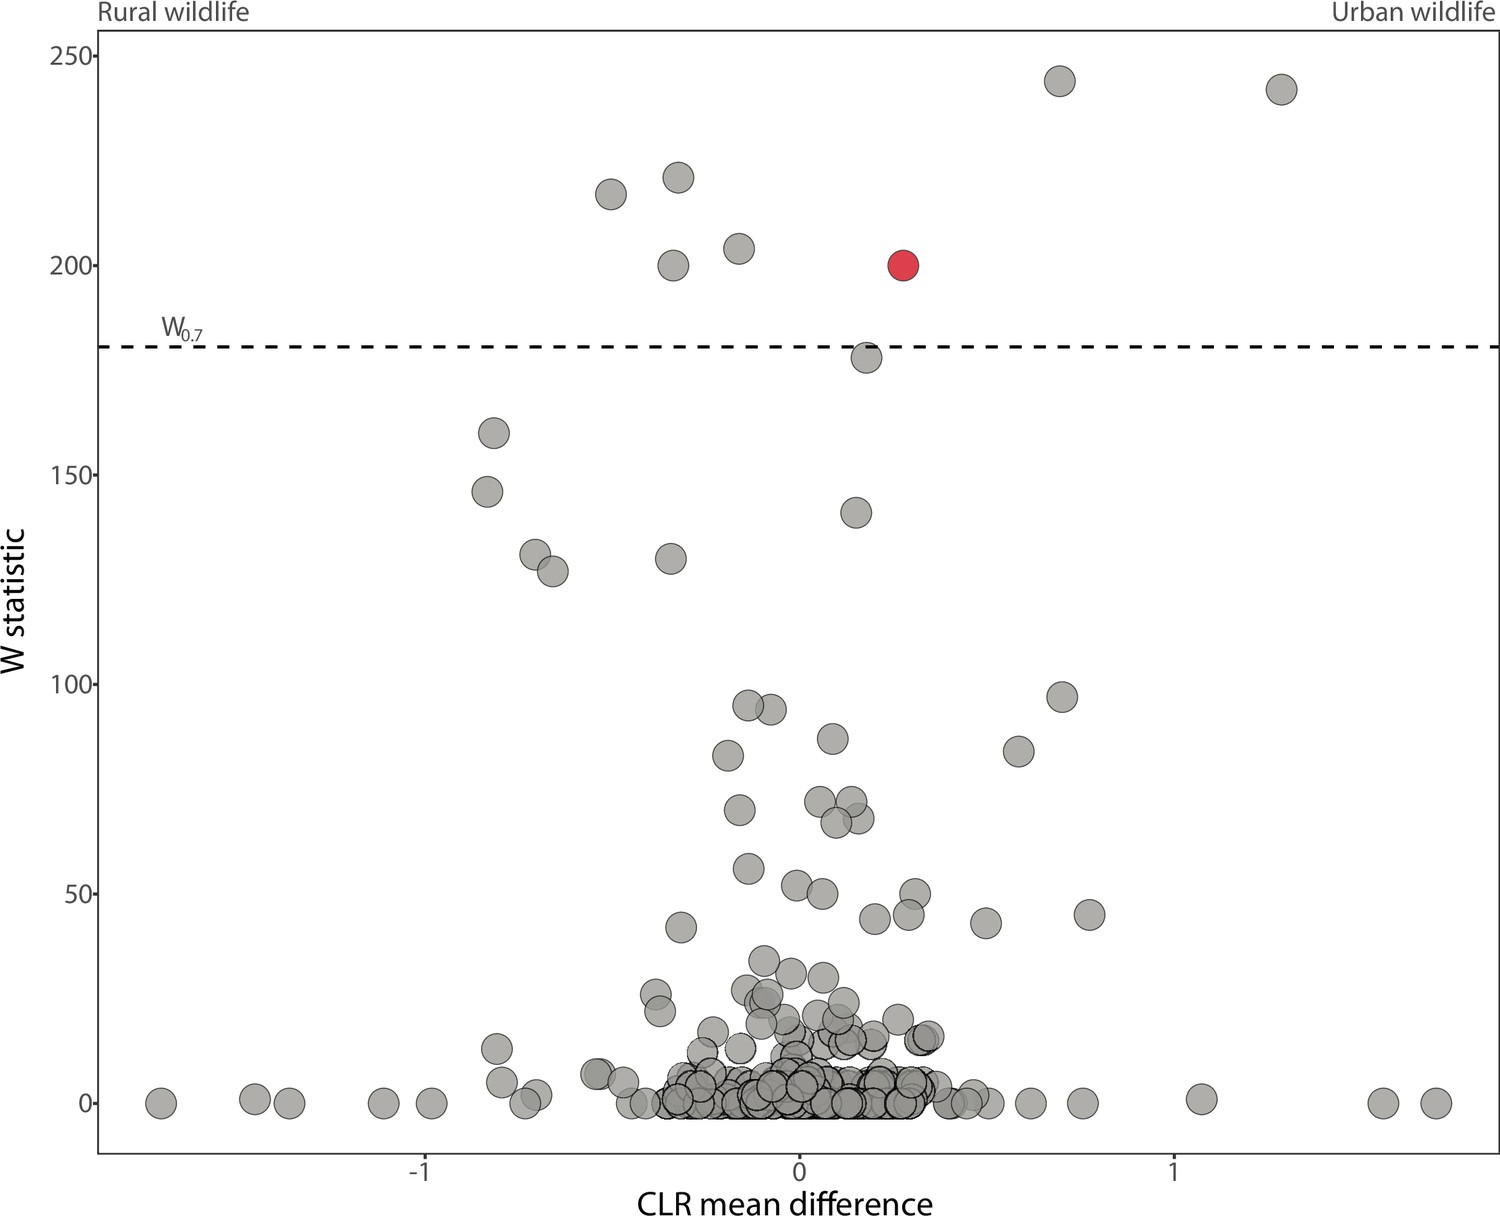
(A–D) Volcano plots display the results of ANCOM tests for ASVs that were differentially abundant between urban and rural human populations. Each point represents an ASV, with the x-axis denoting the centered log ratio mean difference of the relative abundance of the ASV between urban and natural populations. Red points indicate the Bacteroides ASV presented in Figure 2C. The y-axis indicates the ANCOM test statistic (W), and horizontal dashed lines indicate the significance level W = 0.7.
Figure 2—figure supplement 4
Differentially abundant Amplicon Sequence Variants (ASVs) between wildlife populations with host species as a covariate.
Volcano plots display the results of ANCOM tests for ASVs that were differentially abundant between the combined dataset of urban and rural wildlife populations with host species included as a covariate. Each point represents an ASV, with the x-axis denoting the centered log ratio mean difference of the relative abundance of the ASV between urban and natural populations. Red points indicate the Bacteroides ASV presented in Figure 2C. The y-axis indicates the ANCOM test statistic (W), and horizontal dashed lines indicate the significance level W = 0.7.
Additional files
-
Supplementary file 1
Metadata for all samples.
- https://cdn.elifesciences.org/articles/76381/elife-76381-supp1-v2.xlsx
-
Supplementary file 2
Amplicon Sequence Variant (ASV) relative abundances across all samples.
- https://cdn.elifesciences.org/articles/76381/elife-76381-supp2-v2.xlsx
-
Supplementary file 3
Taxonomic assignments of all Amplicon Sequence Variants (ASVs).
- https://cdn.elifesciences.org/articles/76381/elife-76381-supp3-v2.xlsx
-
Supplementary file 4
Statistics for pairwise beta diversity comparisons based on Sorensen–Dice.
- https://cdn.elifesciences.org/articles/76381/elife-76381-supp4-v2.xlsx
-
Supplementary file 5
Statistics for pairwise beta diversity comparisons based on Bray–Curtis.
- https://cdn.elifesciences.org/articles/76381/elife-76381-supp5-v2.xlsx
-
Supplementary file 6
Amplicon Sequence Variants (ASVs) shared by urban wildlife and humans but not by rural conspecific wildlife.
- https://cdn.elifesciences.org/articles/76381/elife-76381-supp6-v2.xlsx
-
Supplementary file 7
ANCOM statistics from comparisons of urban and rural populations.
- https://cdn.elifesciences.org/articles/76381/elife-76381-supp7-v2.xlsx
-
Transparent reporting form
- https://cdn.elifesciences.org/articles/76381/elife-76381-transrepform1-v2.docx
Download links
A two-part list of links to download the article, or parts of the article, in various formats.
Downloads (link to download the article as PDF)
Open citations (links to open the citations from this article in various online reference manager services)
Cite this article (links to download the citations from this article in formats compatible with various reference manager tools)
Humanization of wildlife gut microbiota in urban environments
eLife 11:e76381.
https://doi.org/10.7554/eLife.76381


