WhyD tailors surface polymers to prevent premature bacteriolysis and direct cell elongation in Streptococcus pneumoniae
- Department of Microbiology, Harvard Medical School, United States
- UMass Chan Medical School, United States
- Howard Hughes Medical Institute, United States
Figures
Figure 1
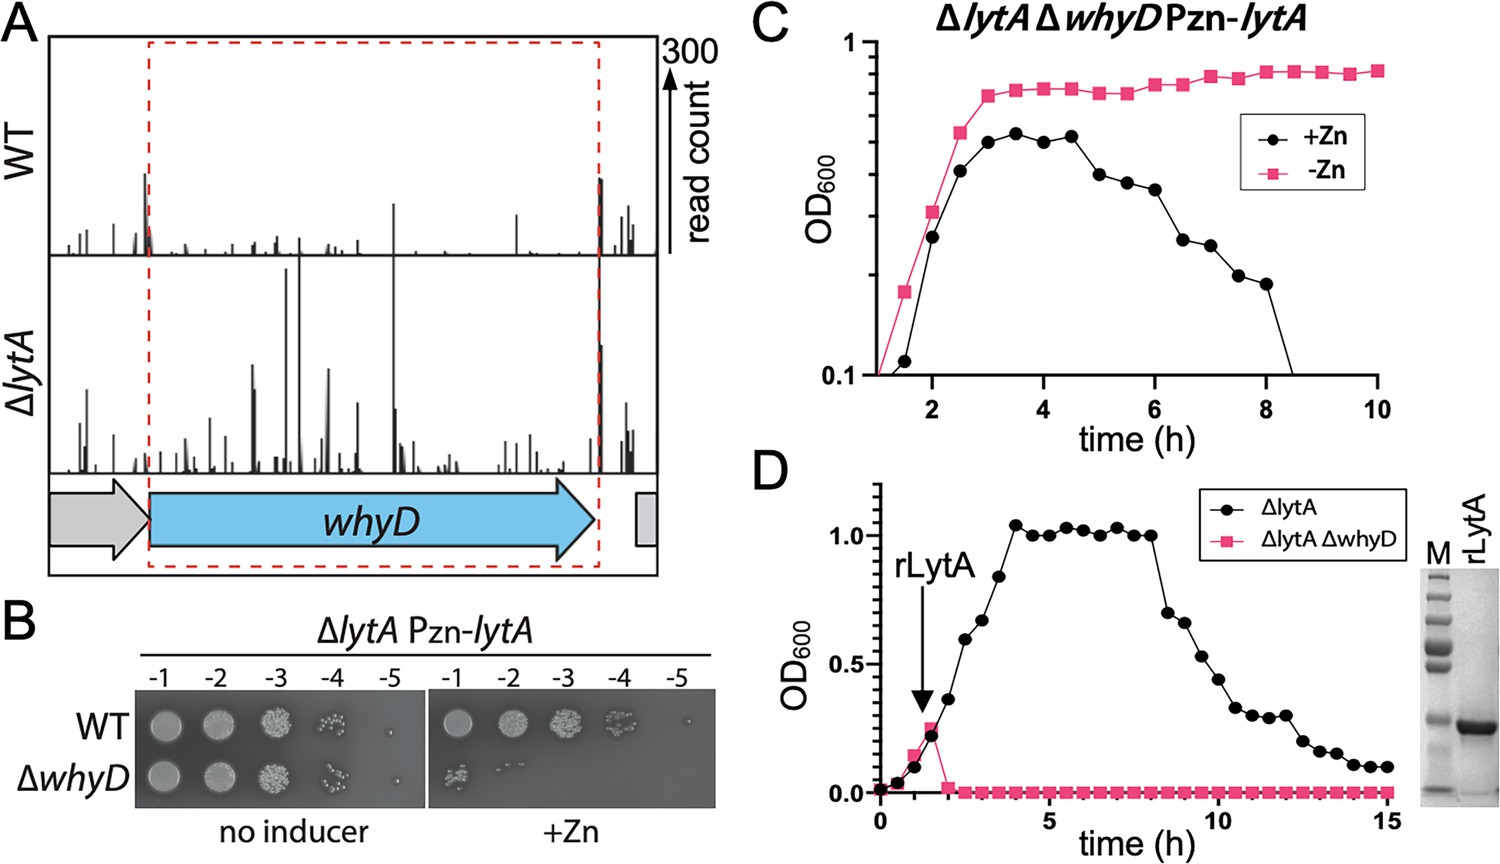
WhyD essentiality is lytA-dependent.
(A) Transposon insertion profiles in wild-type (WT) and the ∆lytA mutant. Separate Mariner transposon libraries were generated, and insertion sites and their abundance were mapped to the Streptococcus pneumoniae genome. A region including the whyD locus is shown. Each line indicates an insertion site, and its height reflects the number of sequencing reads. Transposon insertions in whyD were under-represented in WT compared to ∆lytA. (B) Serial dilutions of the indicated strains in the presence (+Zn) and absence of inducer. Cells were grown to exponential phase, normalized and tenfold serially diluted. Aliquots (5 μl) of each dilution were spotted onto TSAII 5% SB plates in the presence or absence of 200 µM ZnCl2. Plates were incubated at 37 °C in 5% CO2 and then imaged. (C) Expression of lytA in cells lacking whyD results in growth arrest and lysis in exponential phase. Strains containing a zinc-inducible lytA allele (Pzn-lytA) were grown in THY to mid-exponential phase. Cultures were diluted into fresh THY to an OD600 of 0.025 in the presence or absence of 200 µM ZnCl2 and grown at 37 °C in 5% CO2. Growth was monitored by OD600 measurements approximately every 30 min for 10 hr. (D) Cells lacking whyD are sensitive to exogenous LytA. Growth curves of the indicated strains before and after the addition of 1 µg/ml recombinant LytA (rLytA) at an OD600 of ~0.2. Growth was monitored by OD600 approximately every 30 min for 15 hr. The ∆whyD mutant rapidly lysed after rLytA addition. By contrast and as reported previously, the ΔlytA strain lysed in stationary phase in a manner similar to LytA+ cells. Right: Coomassie-stained gel of rLytA purified from Escherichia coli (E. coli). Molecular weight markers (M) are shown.
-
Figure 1—source data 1
Serial dilutions of WT and ∆whyD strains harboring an inducible copy of lytA in the presence (+Zn) and absence of inducer (Figure 1B).
- https://cdn.elifesciences.org/articles/76392/elife-76392-fig1-data1-v3.zip
-
Figure 1—source data 2
Coomassie-stained gel of rLytA purified from E. coli (Figure 1D).
- https://cdn.elifesciences.org/articles/76392/elife-76392-fig1-data2-v3.zip
Figure 2 with 2 supplements
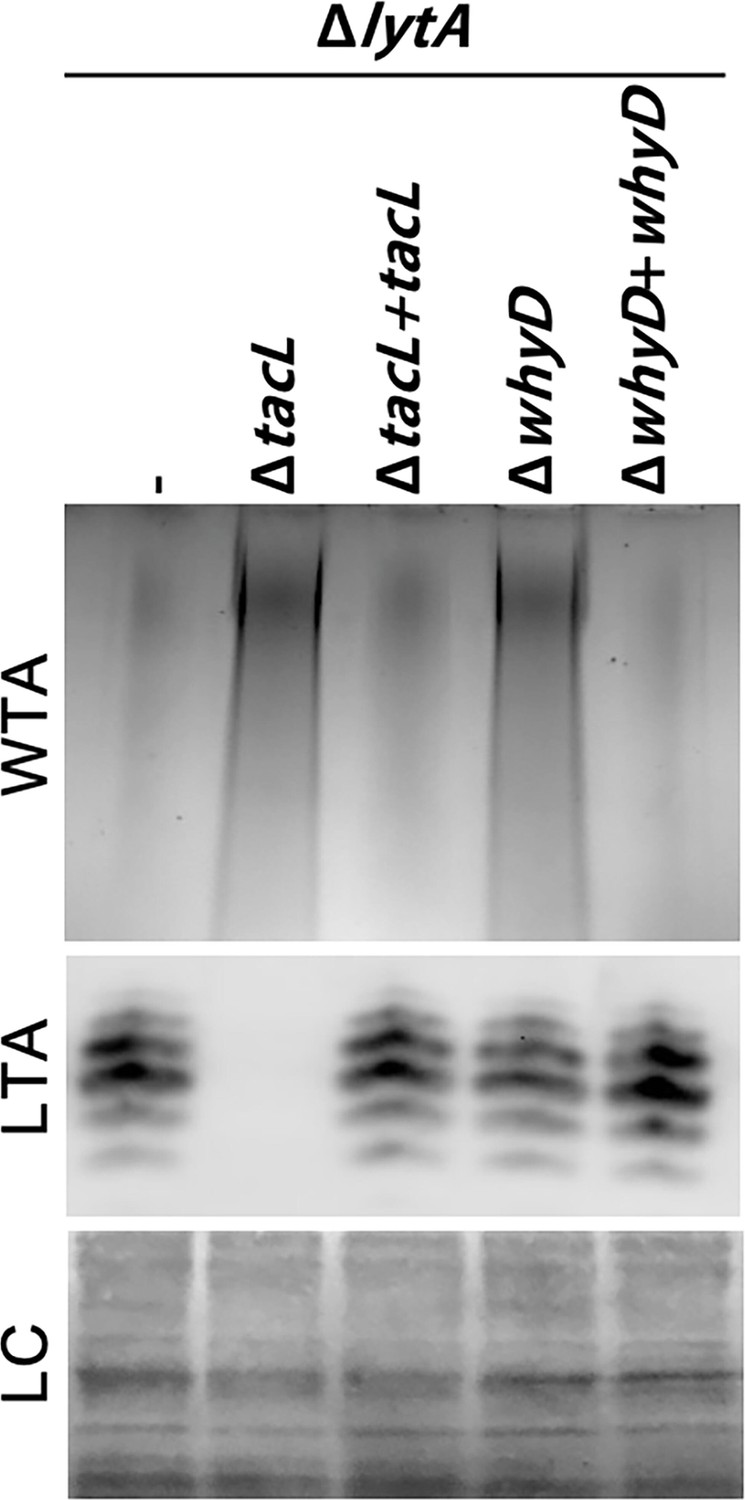
Cells lacking WhyD have elevated levels of wall teichoic acids (WTAs).
Analysis of WTA and lipoteichoic acids (LTA) levels in strains lacking WhyD or TacL. The indicated strains were grown to exponential phase and harvested. WTAs were released from purified cell wall sacculi and separated by SDS-PAGE followed by alcian blue-silver staining. Membrane-associated LTAs were resolved by 16% Tris-tricine SDS-PAGE, transferred to nitrocellulose and probed with an anti-phosphocholine monoclonal antibody. A region of the nitrocellulose membrane was stained with Ponceau S to control for loading (LC). Strains with complementing alleles of whyD or tacL under control of the Zn-inducible promoter were grown in the presence of 200 µM ZnCl2.
-
Figure 2—source data 1
Alcian blue-silver staining of SDS-PAGE separated WTAs, and an anti-phosphocholine blot for SDS-PAGE separated LTAs.
- https://cdn.elifesciences.org/articles/76392/elife-76392-fig2-data1-v3.zip
Figure 2—figure supplement 1
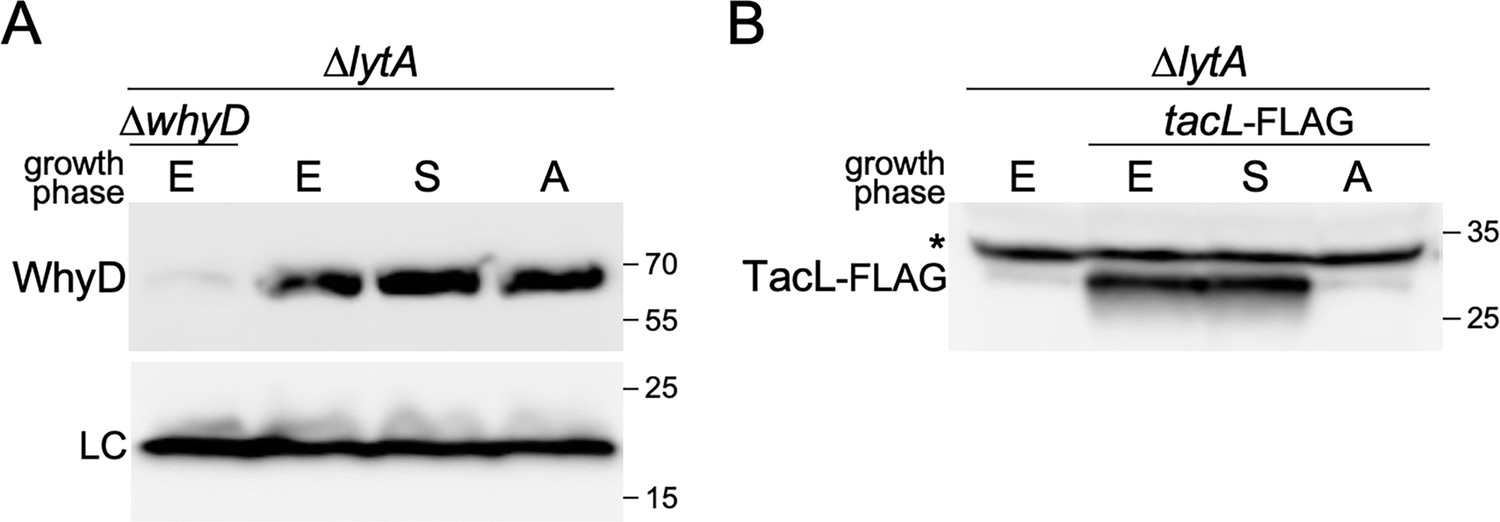
WhyD levels remain constant throughout growth and autolytic conditions.
(A) Immunoblot analysis of WhyD in the indicated strains. Cells were harvested in exponential (E) and stationary (S) phases, and at a time point when lytA + cells undergo autolysis (A). Samples were normalized to an OD600 of 0.5, lysed, and immediately resolved by SDS-PAGE followed by immunoblot analysis with anti-WhyD antibodies. (B) TacL-FLAG levels were analyzed by immunoblot under the same conditions. ∆lytA ∆whyD and ∆lytA lacking TacL-FLAG served as specificity controls for the anti-WhyD and anti-FLAG antibodies, respectively. A wild-type (lytA+) strain was grown in parallel to determine the timing of autolysis. A nonspecific protein recognized by the anti-FLAG antibody is indicated with an asterisk. LC, loading control; molecular weight markers in kDa are shown.
-
Figure 2—figure supplement 1—source data 1
Immunoblot analysis of WhyD and TacL-FLAG over the growth curve.
- https://cdn.elifesciences.org/articles/76392/elife-76392-fig2-figsupp1-data1-v3.zip
Figure 2—figure supplement 2
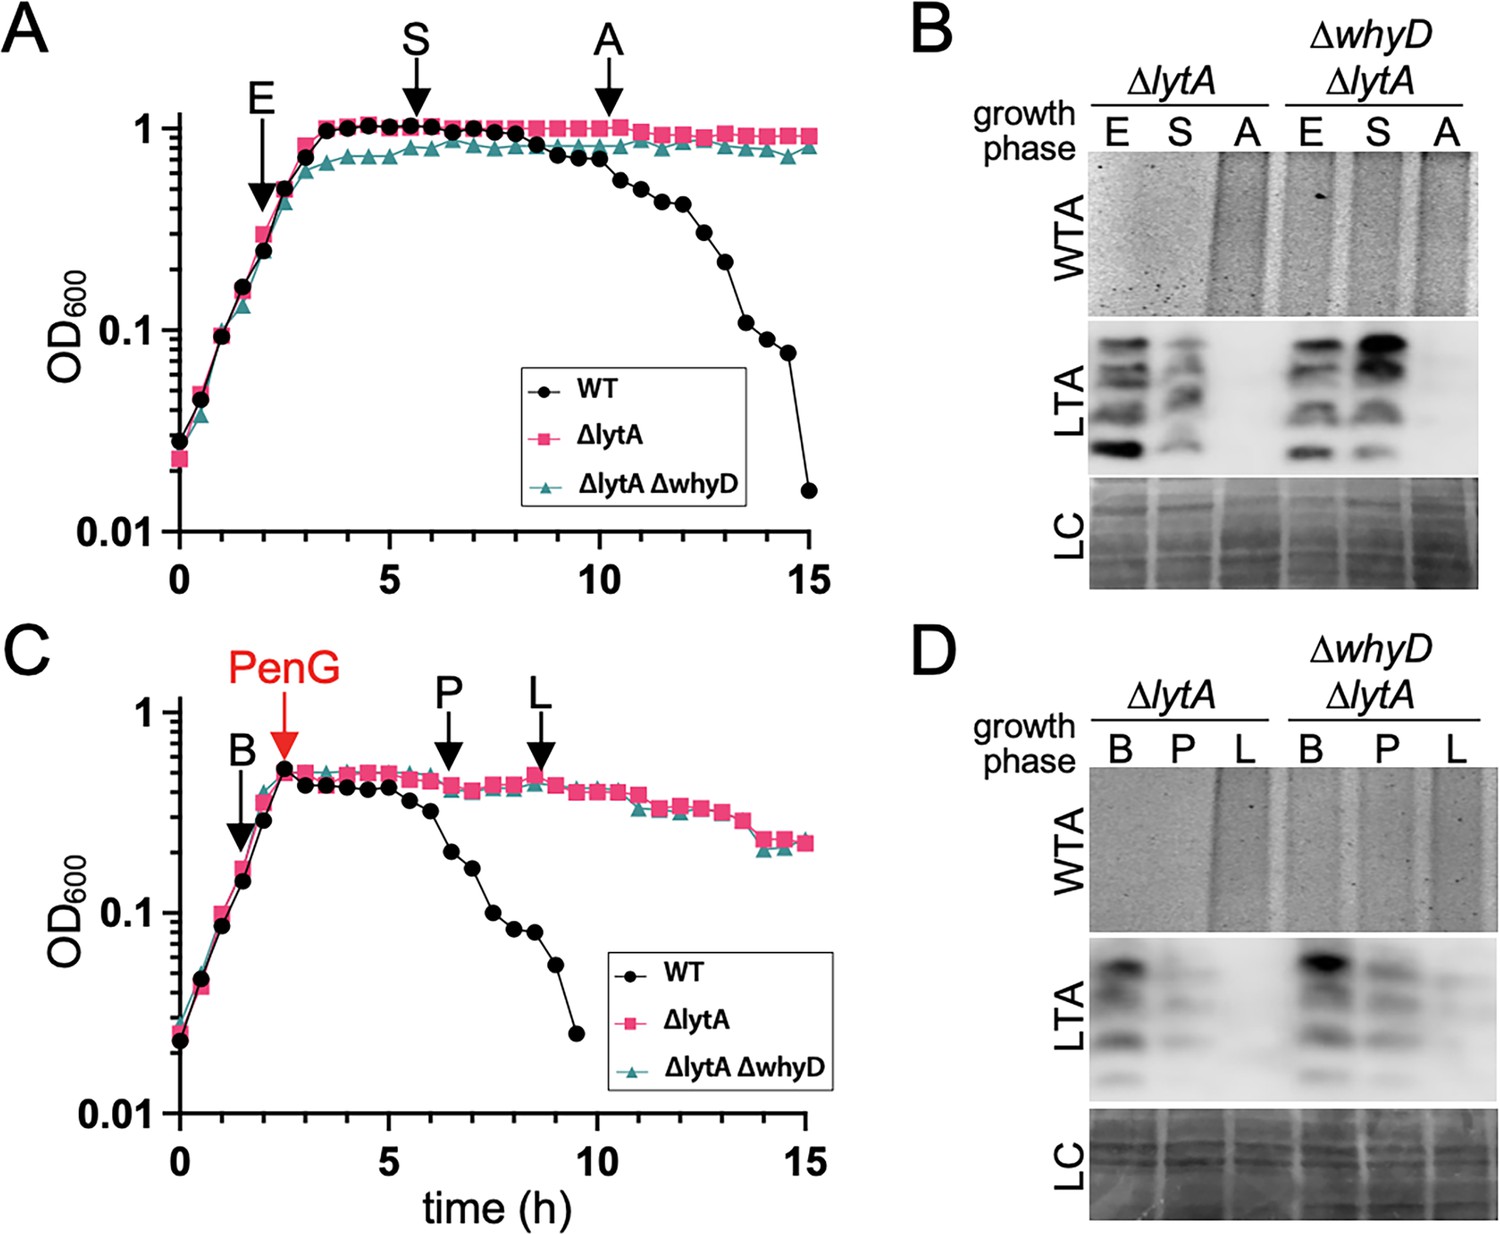
Cells lacking WhyD do not accumulate lipoteichoic acids (LTAs) under autolytic conditions.
(A) Growth curves of the indicated strains and the time points that were analyzed. Samples from the ∆lytA, and ∆lytA ∆whyD strains were collected in exponential (E) and stationary (S) phases and autolysis (A) and normalized to an OD600 of 0.5. The wild-type (WT) strain was used as reference for the timing of autolysis. (B) Analysis of wall teichoic acids (WTA) and LTA levels. Samples from (A) were processed as described in Materials and methods to detect WTAs released from purified sacculi and LTAs in membrane preparations. A region of the nitrocellulose membrane used for the anti-phosphocholine immunoblot was stained with Ponceau S to control for loading (LC). (C) Growth curves of the indicated strains and the time points that were analyzed. At an OD600 of ~0.5 the cultures were treated with penicillin G (PenG) (0.5 µg/ml final). Samples from ∆lytA and ∆lytA ∆whyD strains were collected before PenG addition (B), the plateau after addition (P); and during lysis (L) and normalized to an OD600 of 0.5. A WT strain treated with PenG was used as a reference for the timing of lysis. (D) Analysis of WTA and LTA levels. Harvested cells from (C) were processed as described in Materials and methods to detect LTAs and WTAs.
-
Figure 2—figure supplement 2—source data 1
Alcian blue-silver staining of SDS-PAGE separated WTAs and anti-phosphocholine blots for SDS-PAGE separated LTAs collected over the growth curve and post antibiotic treatment.
- https://cdn.elifesciences.org/articles/76392/elife-76392-fig2-figsupp2-data1-v3.zip
Figure 3 with 1 supplement

WhyD releases wall teichoic acids (WTAs) from the pneumococcal cell wall.
(A) Schematic diagram of WhyD-dependent release of WTAs from the cell wall of Streptococcus pneumoniae. WTAs are attached to the MurNAc sugars of the cell wall peptidoglycan (PG) (grey) and lipoteichoic acids (LTAs) are anchored in the lipid bilayer. Teichoic acid (TA) polymers have the same chemical structure but differ in their linkages to PG or glycolipid anchor. WhyD is a polytopic membrane protein with a predicted C-terminal (CT) WTA-hydrolase domain. (B) The CT domain of WhyD releases WTAs from purified sacculi. Coomassie-stained gel of the recombinant CT domain of WhyD (WhyDCT) purified from Escherichia coli. M, Molecular weight markers. Alcian blue-silver stained gel of WTAs released from purified sacculi (top) and those that remain associated with the PG (bottom) after incubation with 10 µg/ml WhyDCT, 10 µg/ml WhyDCT +1 mM EDTA, or no WhyDCT. The reactions were incubated overnight at room temperature and then quenched with 1 mM EDTA and released WTAs collected after centrifugation. To release remaining WTAs associated with the sacculi, the sacculi pellets were treated with 0.1 M NaOH overnight at room temperature. The alkaline-hydrolyzed WTAs were then collected from the supernatant. (C) Immunoblot analysis of membrane preparations treated with WhyDCT to assess its ability to release LTAs. Membranes from ΔlytA ΔwhyD cells were treated with 10 µg/ml WhyDCT, 10 µg/ml WhyDCT +1 mM EDTA, or no WhyDCT. The reactions were incubated overnight at room temperature. Released and membrane-associated material were then resolved by 16% Tris-tricine SDS-PAGE, transferred to nitrocellulose, and probed with an anti-phophsocholine monoclonal antibody.
-
Figure 3—source data 1
Coomassie-stained gel of WhyDCT and alcian blue-silver stained gel of WTAs released or remaining with purified sacculi after treatment with WhyDCT (Figure 3B); anti-phosphocholine blots on membrane preparations treated with WhyDCT (Figure 3C).
- https://cdn.elifesciences.org/articles/76392/elife-76392-fig3-data1-v3.zip
Figure 3—figure supplement 1
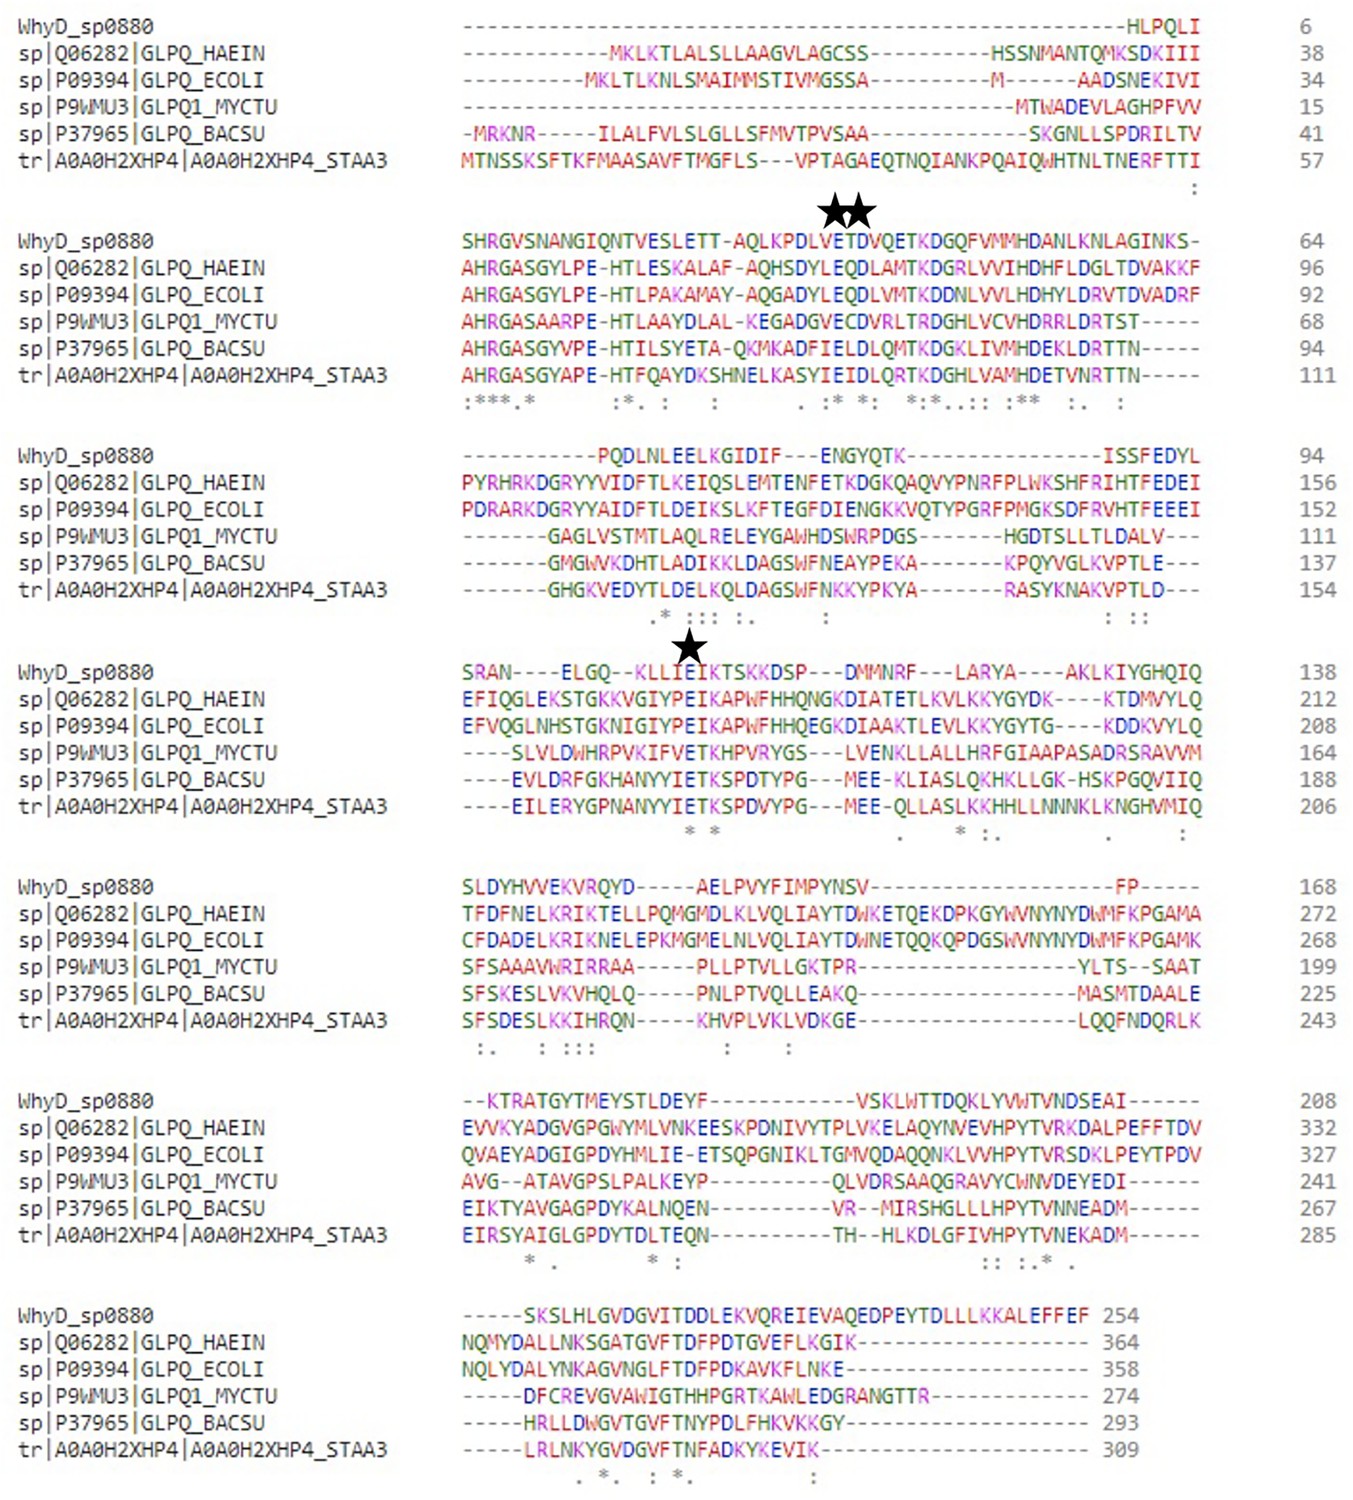
Multisequence alignment of representative GlpQ sequences.
Multisequence alignment was generated using Clustal Omega (Sievers et al., 2011). Sequences included are Haemophilus influenza GlpQ (strain ATCC 51907, Uniprot entry Q06282), Escherichia coli GlpQ (strain K12, Uniprot entry P09394), Bacillus subtilis GlpQ (strain 168, Uniprot entry P37965), Mycobacterium tuberculosis GlpQ1 (strain ATCC 25618, Uniprot entry P9WMU3), Staphylococcus aureus GlpQ (strain USA300, Uniprot entry A0A0H2XHP4), and WhyD (SP_0880) lacking its transmembrane domain (Δ1–333). The conserved metal-binding residues required for the catalytic activity are indicated by black stars.
Figure 4 with 3 supplements
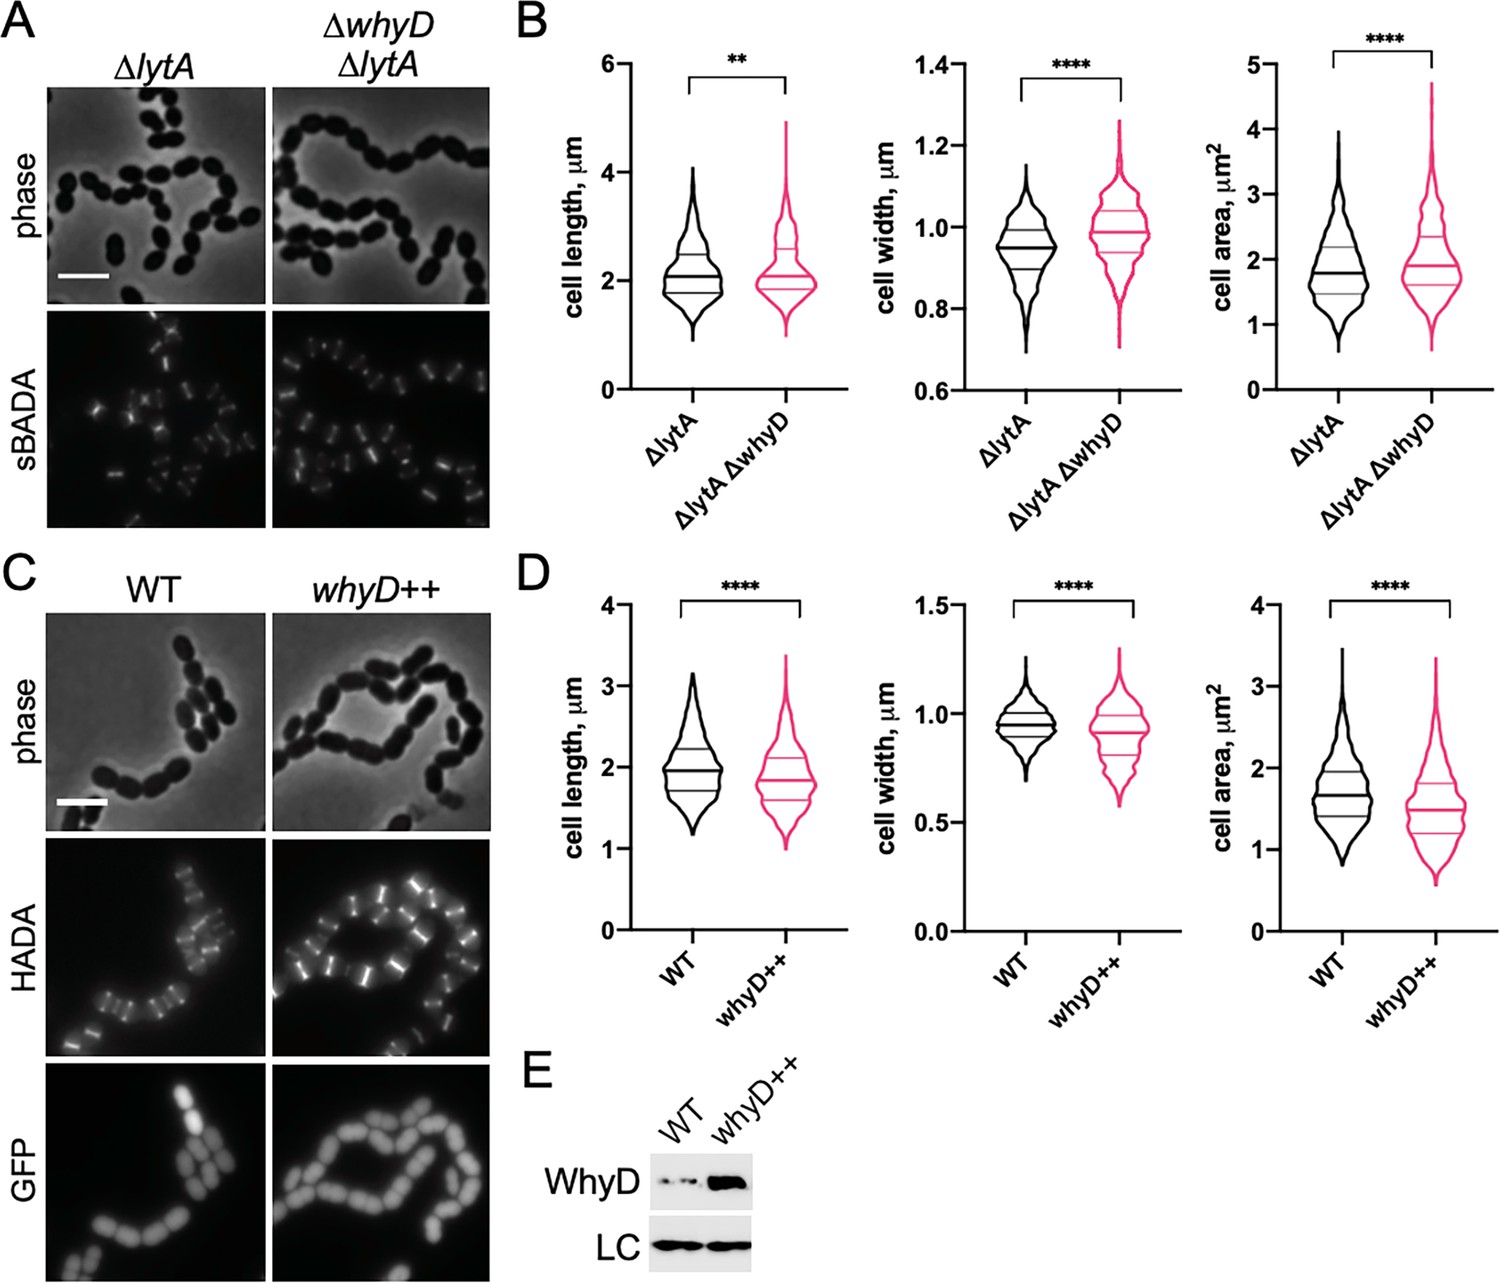
WhyD and wall teichoic acids (WTAs) are important for cell elongation.
(A) Cells lacking WhyD are longer and larger than wild-type (WT). Representative phase-contrast and fluorescent images of ΔlytA and ΔlytA ΔwhyD strains grown in THY at 37 °C in 5% CO2 to mid-exponential phase. Cells were labeled with sBADA for 5 min prior to imaging. Scale bar, 3 μm. (B) Quantitative analysis of cell length, width, and area for the strains shown in (A). The violin plots indicate the median (bold lines) and quartiles. p-values were obtained using a Welch’s t-test. p<0.01, **; p<0.0001, ****. (C) Cells overexpressing WhyD are shorter and smaller than WT. Representative phase-contrast and fluorescent images of WT and cells with a second copy of whyD under zinc-inducible control (whyD++). Strains were grown in THY to mid-exponential phase, diluted into fresh THY at an OD600 of 0.025 in the presence of 200 μM ZnCl2 and incubated at 37 °C with 5% CO2 for 2 hr. The cells were then labeled with HADA for 5 min prior to imaging. Both strains also contain cytoplasmic GFP. Scale bar, 3 μm. (D) Quantitative analysis of cell length, width, and area as in (B). (E) Immunoblot analysis to assess the levels of WhyD. Samples from (C) were collected and normalized to an OD600 of 0.5 and resolved by SDS-PAGE and analyzed by anti-WhyD immunoblot. LC: control for loading. WTA levels in these strains are shown in Figure 4—figure supplement 3.
-
Figure 4—source data 1
Raw data of the quantitative analysis of cell length, width, and area (Figure 4B).
- https://cdn.elifesciences.org/articles/76392/elife-76392-fig4-data1-v3.xlsx
-
Figure 4—source data 2
Raw data of the quantitative analysis of cell length, width, and area (Figure 4D).
- https://cdn.elifesciences.org/articles/76392/elife-76392-fig4-data2-v3.xlsx
-
Figure 4—source data 3
Anti-WhyD immunoblotting (Figure 4E).
- https://cdn.elifesciences.org/articles/76392/elife-76392-fig4-data3-v3.zip
Figure 4—figure supplement 1
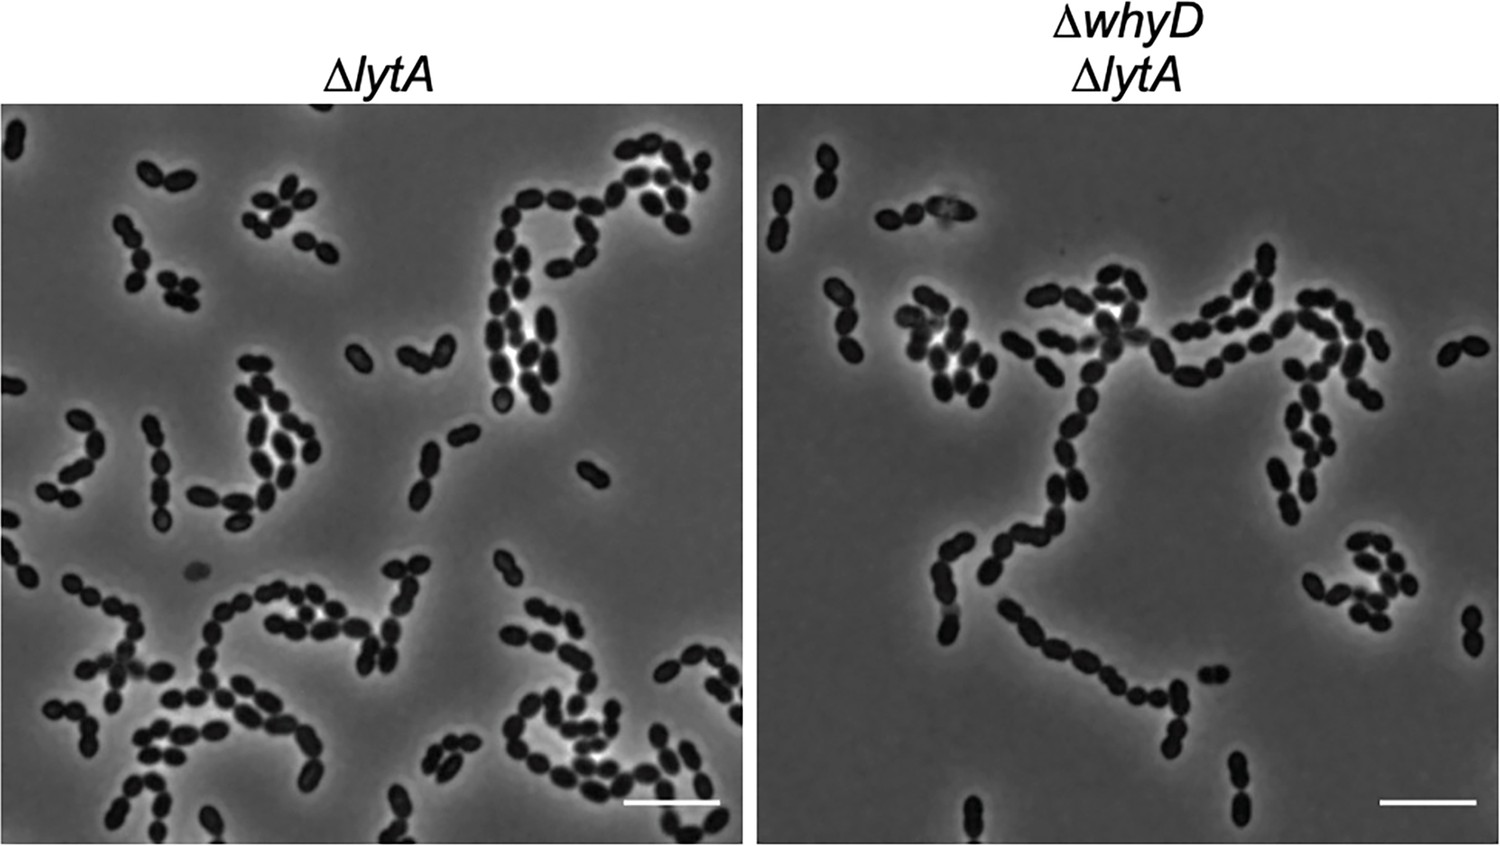
Cells lacking WhyD are longer and larger than wild-type (WT).
Representative phase-contrast images of ΔlytA and ΔlytA ΔwhyD strains grown in THY at 37 °C in 5% CO2 to mid-exponential phase. Scale bar, 5 μm. Cells lacking WhyD that have high levels of wall teichoic acids are longer and larger than WT but chain to a similar degree.
Figure 4—figure supplement 2
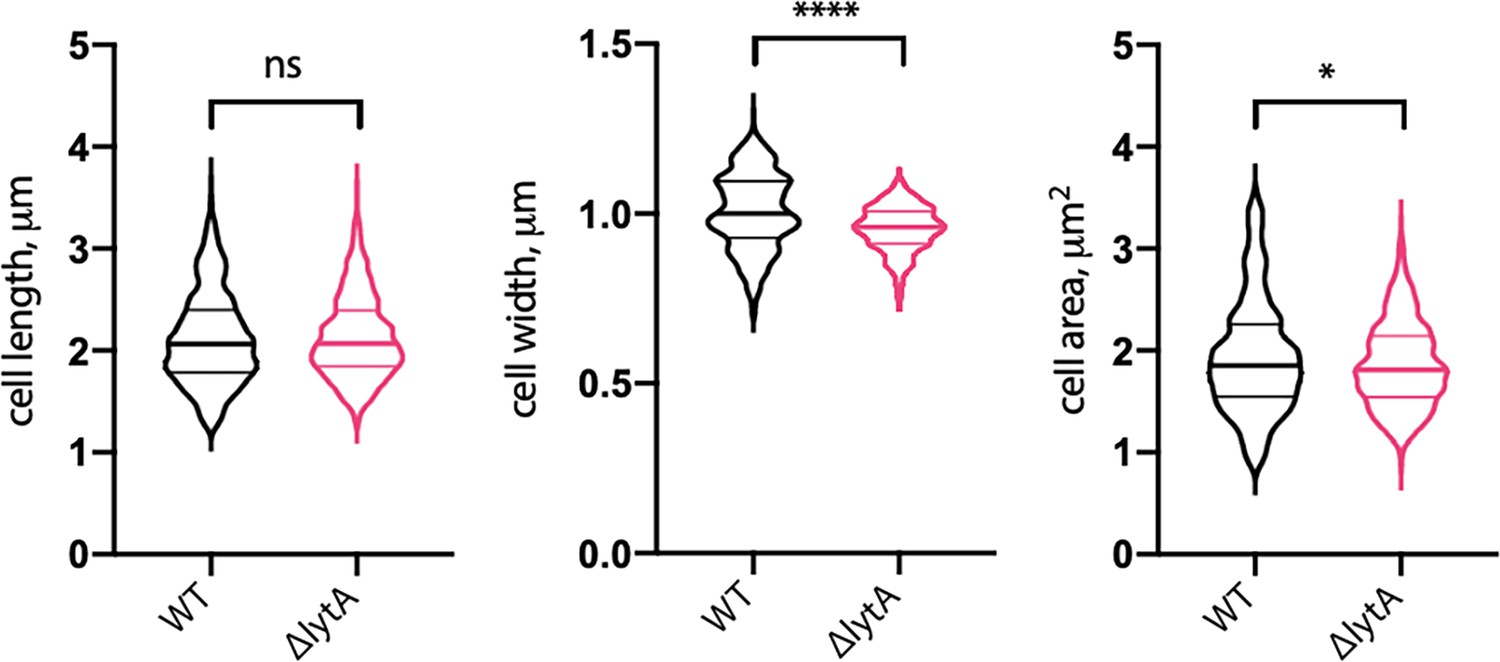
Cells lacking LytA are similar in size to wild-type (WT).
Quantitative analysis of cell length, width, and area of WT Sp and cells lacking LytA (ΔlytA). Violin plots indicate the median (bold lines) and quartiles. p-values were obtained using a Welch’s t-test. ns, not significant.
-
Figure 4—figure supplement 2—source data 1
Raw data of the quantitative analysis of cell length, width, and area.
- https://cdn.elifesciences.org/articles/76392/elife-76392-fig4-figsupp2-data1-v3.zip
Figure 4—figure supplement 3
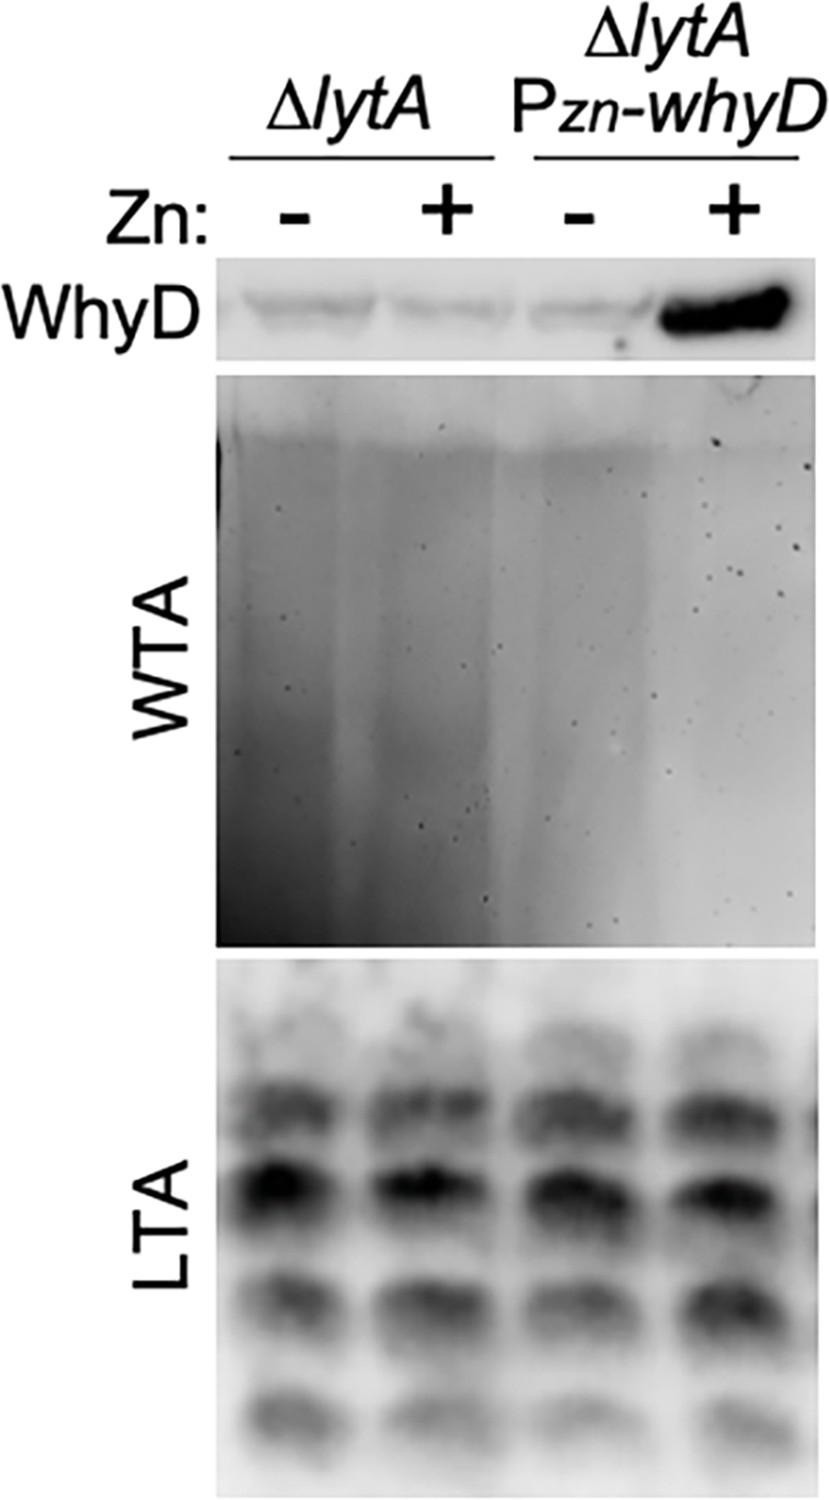
Analysis of wall teichoic acid (WTA), lipoteichoic acid (LTA), and WhyD levels in cells overexpressing WhyD.
The indicated strains were grown to mid-exponential phase in the presence or absence of 200 μM ZnCl2 and WhyD, WTA, and LTA levels were analyzed as described in Materials and methods. Top: anti-WhyD immunoblot. Middle: alcian blue-silver stained gel of WTAs released from purified sacculi and separated by SDS-PAGE. Bottom: immunoblot analysis of membrane-associated LTAs resolved by 16% Tris-tricine SDS-PAGE and probed with an anti-phosphocholine monoclonal antibody.
-
Figure 4—figure supplement 3—source data 1
Anti-WhyD immunoblot, alcian blue-silver stained gel of WTAs, and anti-phosphocholine immunoblot of membrane-associated LTAs.
- https://cdn.elifesciences.org/articles/76392/elife-76392-fig4-figsupp3-data1-v3.zip
Figure 5
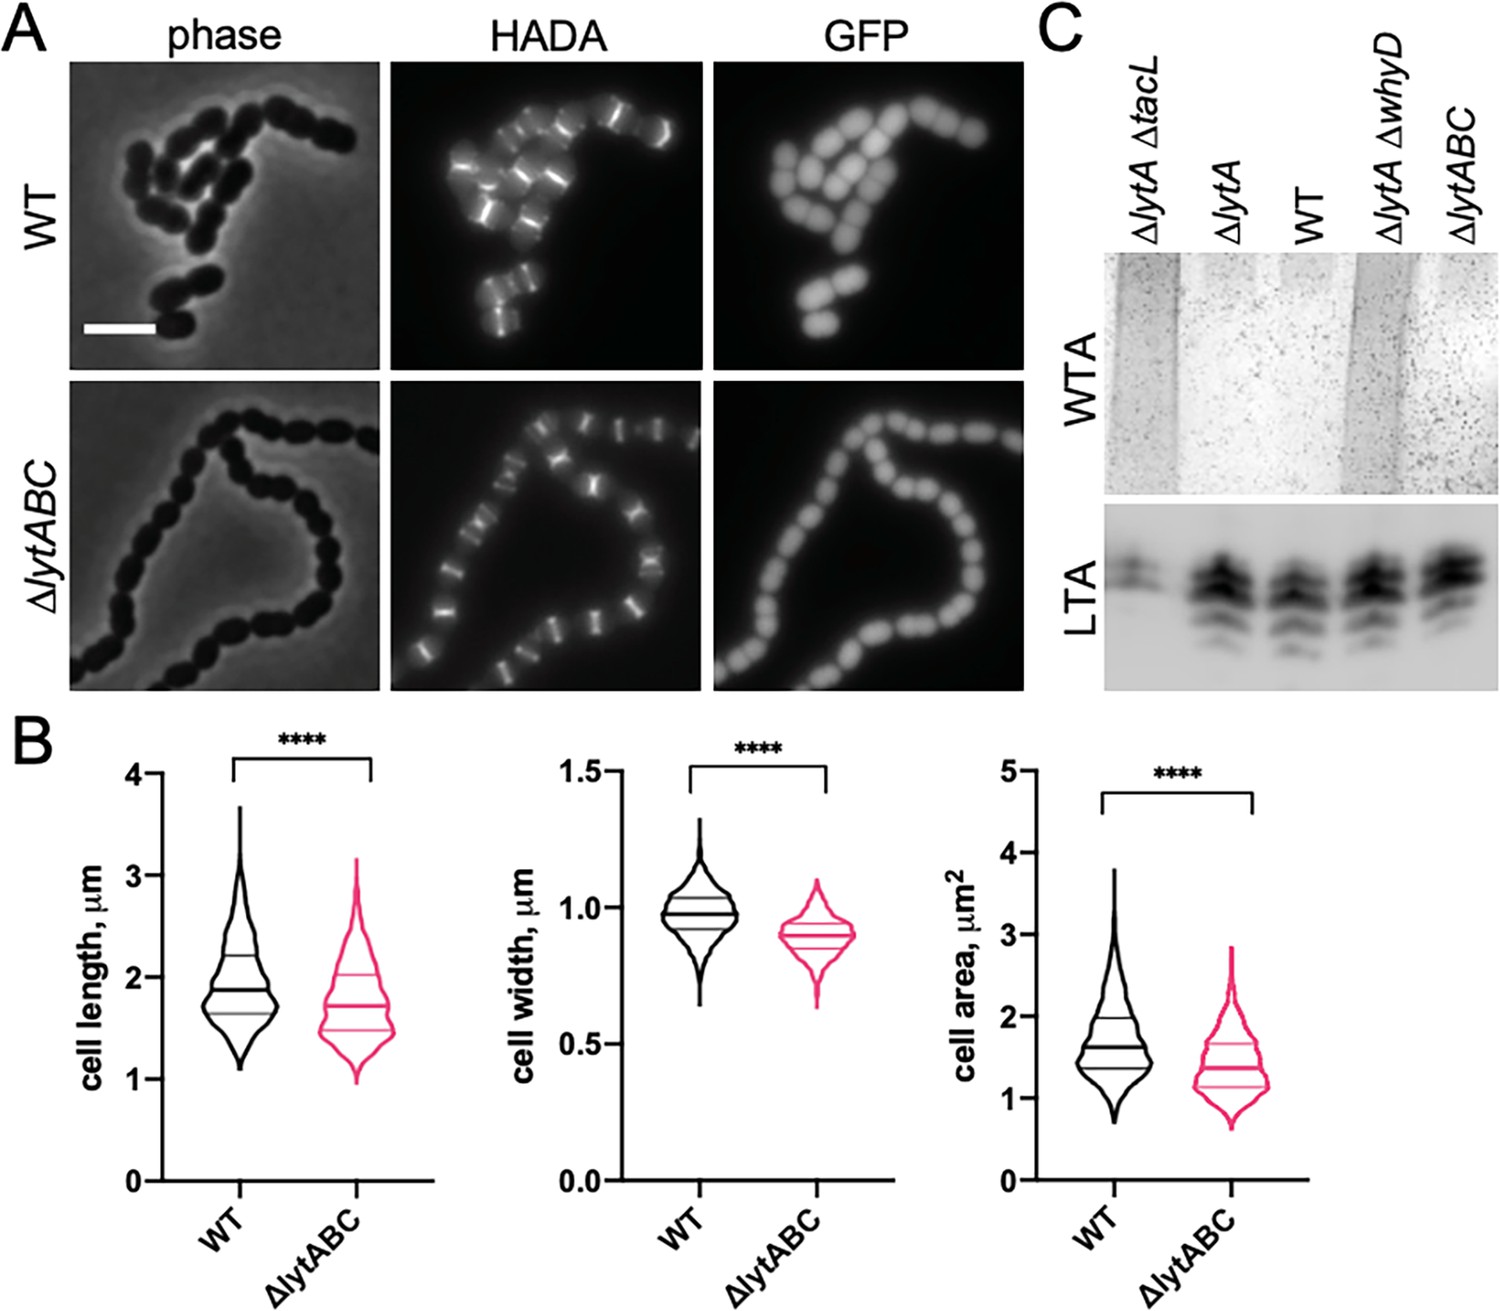
Mutants lacking wall teichoic acids (WTA)-bound cell wall hydrolases have a short cell phenotype.
(A) Cells lacking the cell wall hydrolases that bind WTAs are shorter and smaller than wild-type (WT). Representative phase-contrast and fluorescent images of WT and cells lacking LytA, LytB, and LytC (∆lytABC). Cells were grown in THY to mid-exponential phase and labeled with HADA for 5 min prior to imaging. Both strains also contain a cytoplasmic fluorescent marker (GFP). Scale bar, 3 μm. (B) Quantitative analysis of cell length, width, and area for the strains shown in (A). The violin plots indicate the median (bold lines) and quartiles. p-values were obtained using a Welch’s t-test. p<0.0001, ****. (C) Analysis of WTA and LTA levels in the ∆lytABC mutant. The indicated strains were grown to mid-exponential phase and their WTA and LTA levels were analyzed as described in Materials and methods.
-
Figure 5—source data 1
Raw data of the quantitative analysis of cell length, width, and area (Figure 5B).
- https://cdn.elifesciences.org/articles/76392/elife-76392-fig5-data1-v3.zip
-
Figure 5—source data 2
Alcian blue-stain of WTAst and anti-phosphocholine immunoblot of membrane-associated LTAs in the ∆lytABC mutant (Figure 5C).
- https://cdn.elifesciences.org/articles/76392/elife-76392-fig5-data2-v3.zip
Figure 6 with 1 supplement
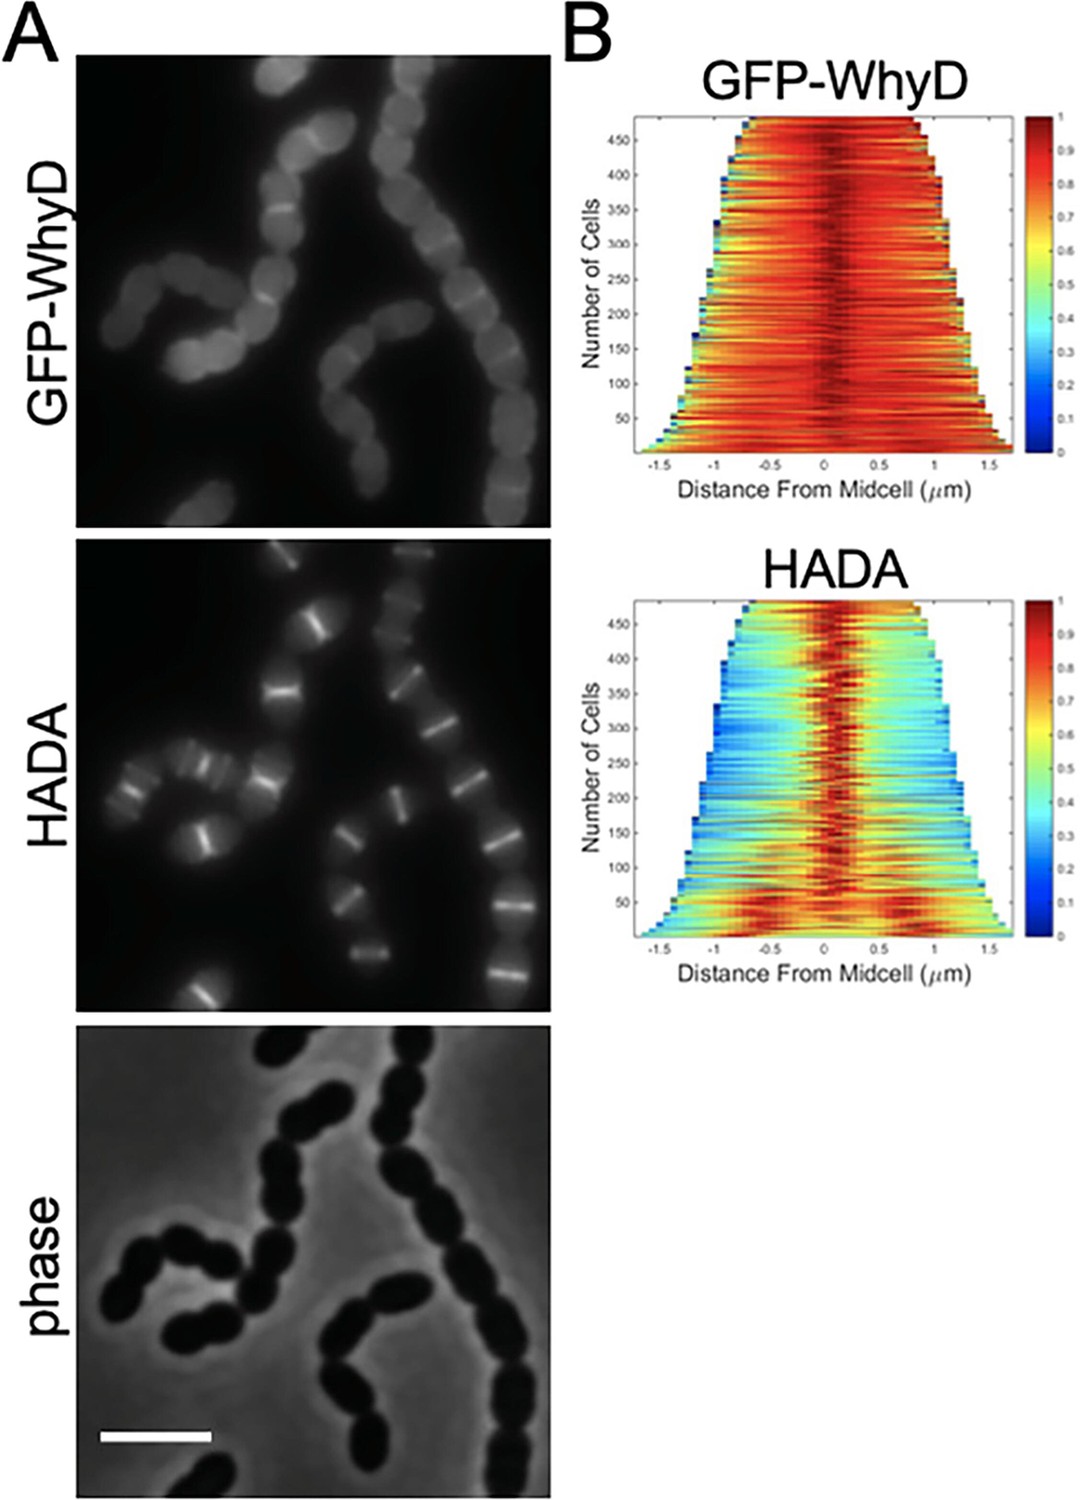
GFP-WhyD is enriched at midcell.
(A) Representative fluorescent and phase-contrast images of cells harboring a GFP-WhyD fusion. The fusion was expressed from a zinc-inducible promoter in a ΔwhyD background. Strains were grown in THY medium in the presence of 200 µM ZnCl2 at 37 °C in 5% CO2 to an OD600 of 0.5. Cells were labeled with HADA for 5 min prior to imaging. Scale bar, 3 μm. (B) Demographs showing GFP-WhyD and HADA localization in a population of cells. >450 cells were quantified and the resulting heat map of fluorescence intensity for each cell was then arranged according to cell length and stacked to generate the demograph. Demographs were constructed using the open-source software package Oufti.
Figure 6—figure supplement 1
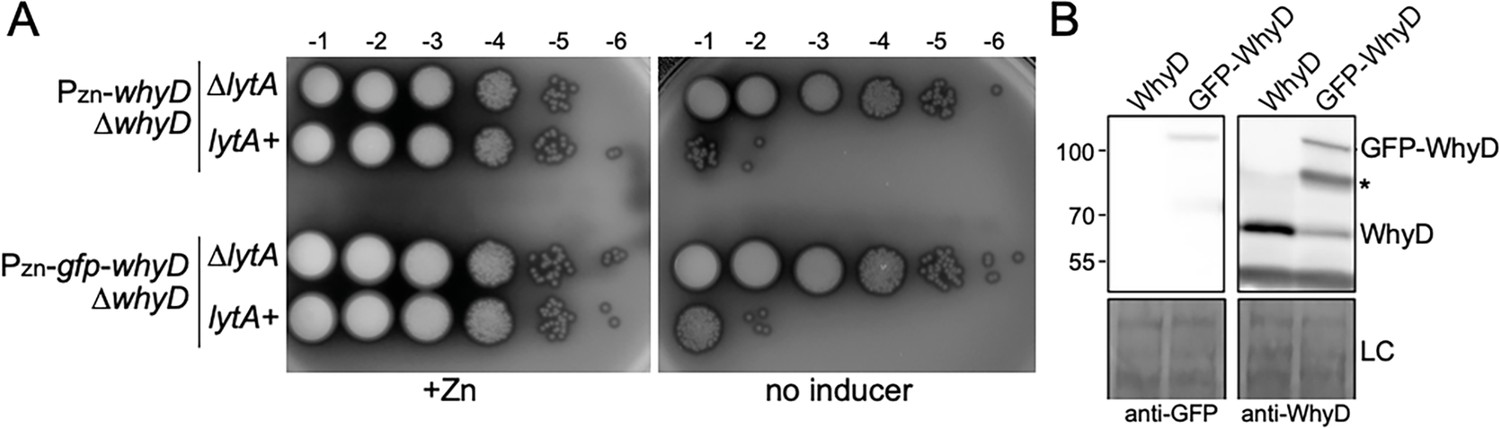
The GFP-WhyD fusion is functional in vivo.
(A) Spot-dilutions of the indicated strains in the presence or absence of 200 µM ZnCl2. The indicated strains harboring zinc-inducible promoter fusions to whyD or gfp-whyD as the sole source of the protein in the presence and absence of lytA were analyzed. Cells were grown in the presence of 200 µM ZnCl2 to exponential phase, normalized for OD600, and serially diluted. Aliquots (5 μl) of each dilution were spotted onto TSAII 5% SB plates with or without 200 µM ZnCl2. Plates were incubated at 37 °C in 5% CO2 and imaged. (B) Immunoblot analysis of WhyD and GFP-WhyD. Samples from Figure 3A were collected and normalized to an OD600 of 0.5 and resolved by SDS-PAGE followed by anti-WhyD or anti-GFP immunoblotting. A region of the nitrocellulose membrane used was stained with Ponceau S to control for loading (LC). A degradation product of the GFP-WhyD fusion protein detected with the anti-WhyD antiserum is indicated with an asterisk. Molecular weight markers in kDa are indicated.
-
Figure 6—figure supplement 1—source data 1
Serial dilutions of WT and DlytA strains harboring inducible copies of either whyD or gfp-whyD in the presence (+Zn) and absence of inducer.
- https://cdn.elifesciences.org/articles/76392/elife-76392-fig6-figsupp1-data1-v3.zip
-
Figure 6—figure supplement 1—source data 2
Immunoblots of anti-WhyD and anti-GFP.
- https://cdn.elifesciences.org/articles/76392/elife-76392-fig6-figsupp1-data2-v3.zip
Figure 7 with 6 supplements
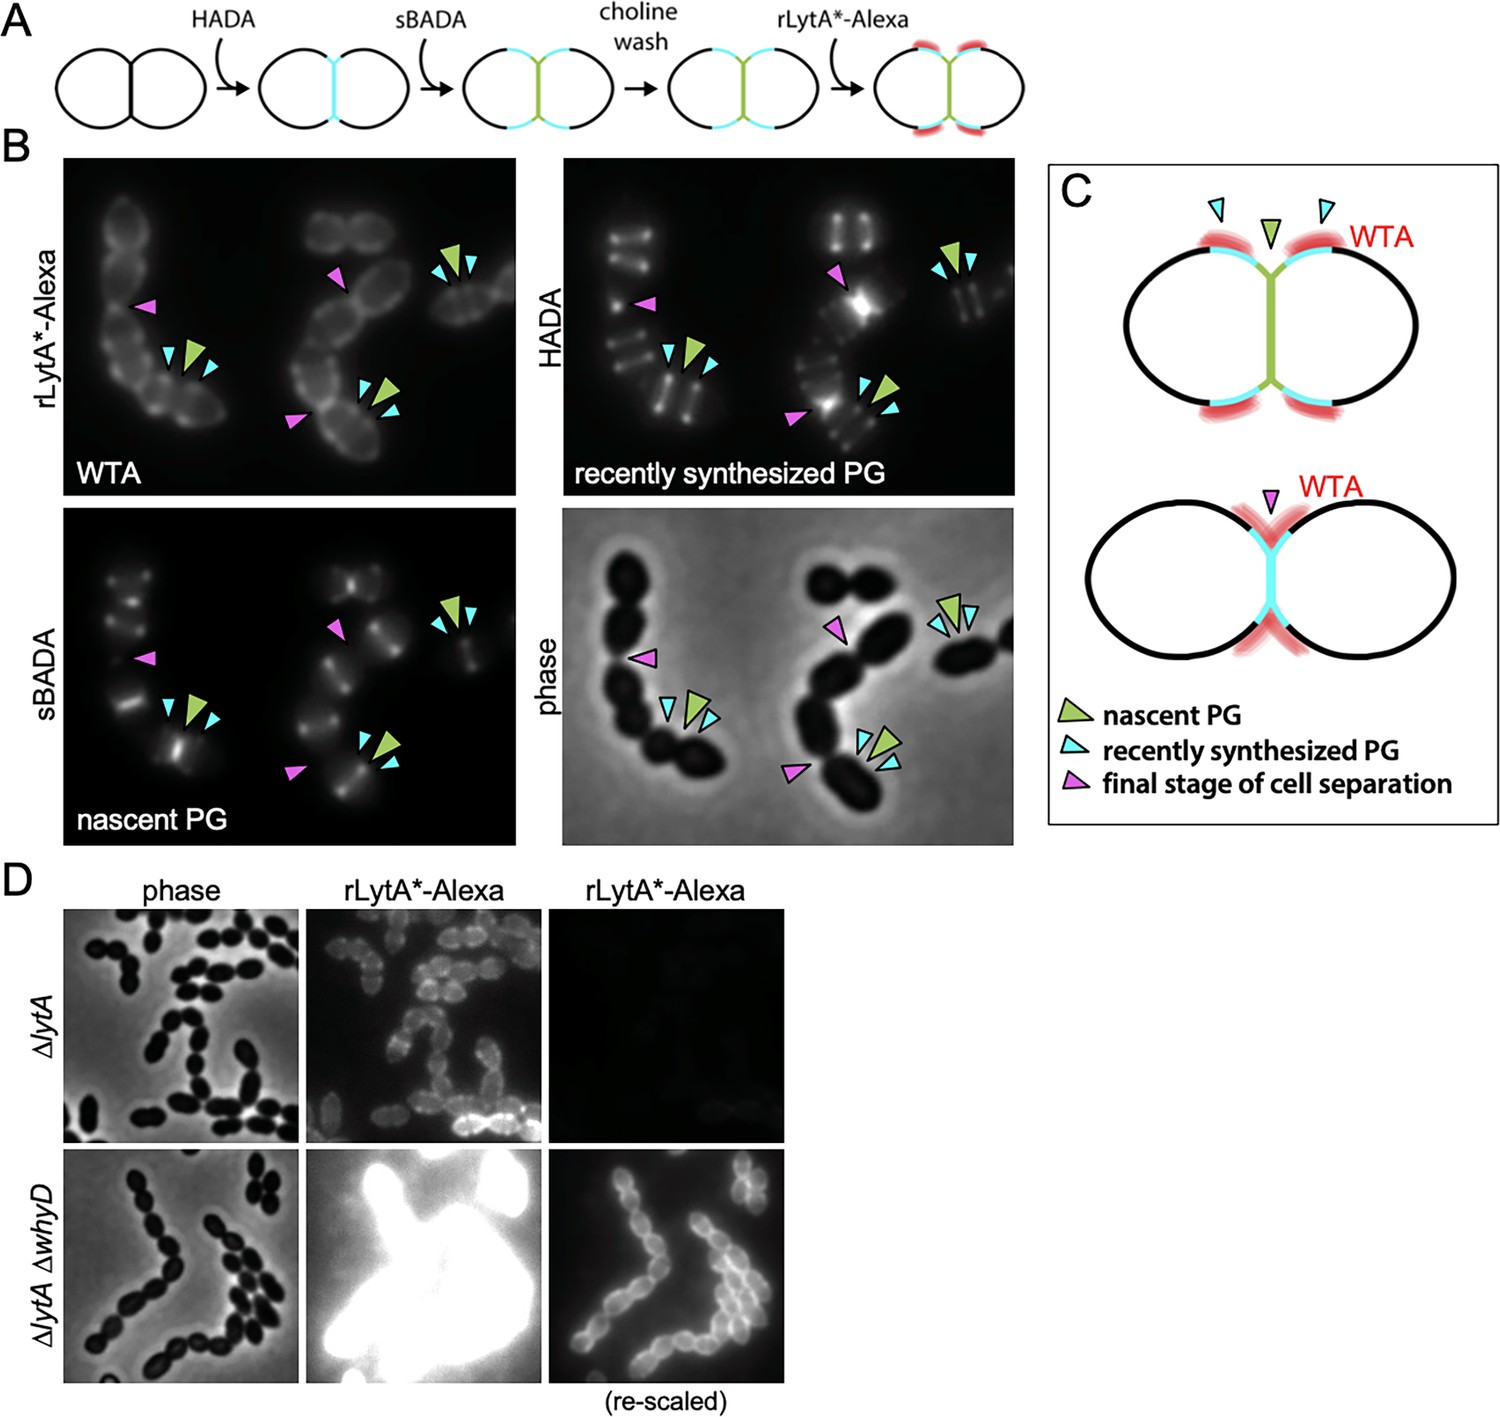
Wall teichoic acids (WTAs) accumulate adjacent to active zones of PG synthesis.
(A) Flow diagram of experiment. The ∆lytA mutant was grown in THY medium to mid-exponential phase, labeled with HADA for 5 min, washed with fresh THY, and then labeled with sBADA for 5 min. The sample was then collected, normalized to an OD600 of 0.5, washed with fresh medium containing 1% choline and incubated with 1 µg/ml recombinant LytA(H26A) coupled to Alexa Fluor 594 (rLytA*-Alexa) for 30 s with gentle shaking to label WTAs. Cells were then washed twice with 1× phosphate buffer saline (PBS) and analyzed by fluorescence microscopy. (B) Representative phase-contrast and fluorescent images of rLytA*-Alexa (WTAs), recently synthesized (HADA) and nascent (sBADA) peptidoglycan (PG). Carets indicate nascent PG (green), recently synthesized PG (light blue), and the final stage of cell separation (pink). (C) Cartoon depicting WTA localization (red) relative to PG synthesis observed in (B). (D) Representative images of WTA localization in ΔlytA and ΔlytA ΔwhyD strains. Exponentially growing cells were collected and incubated with rLytA*-Alexa as described above to label WTAs. The fluorescence intensity of the rLytA*-Alexa labeled cells was re-scaled in the right panels to visualize of WTA localization in the cells lacking WhyD.
Figure 7—figure supplement 1
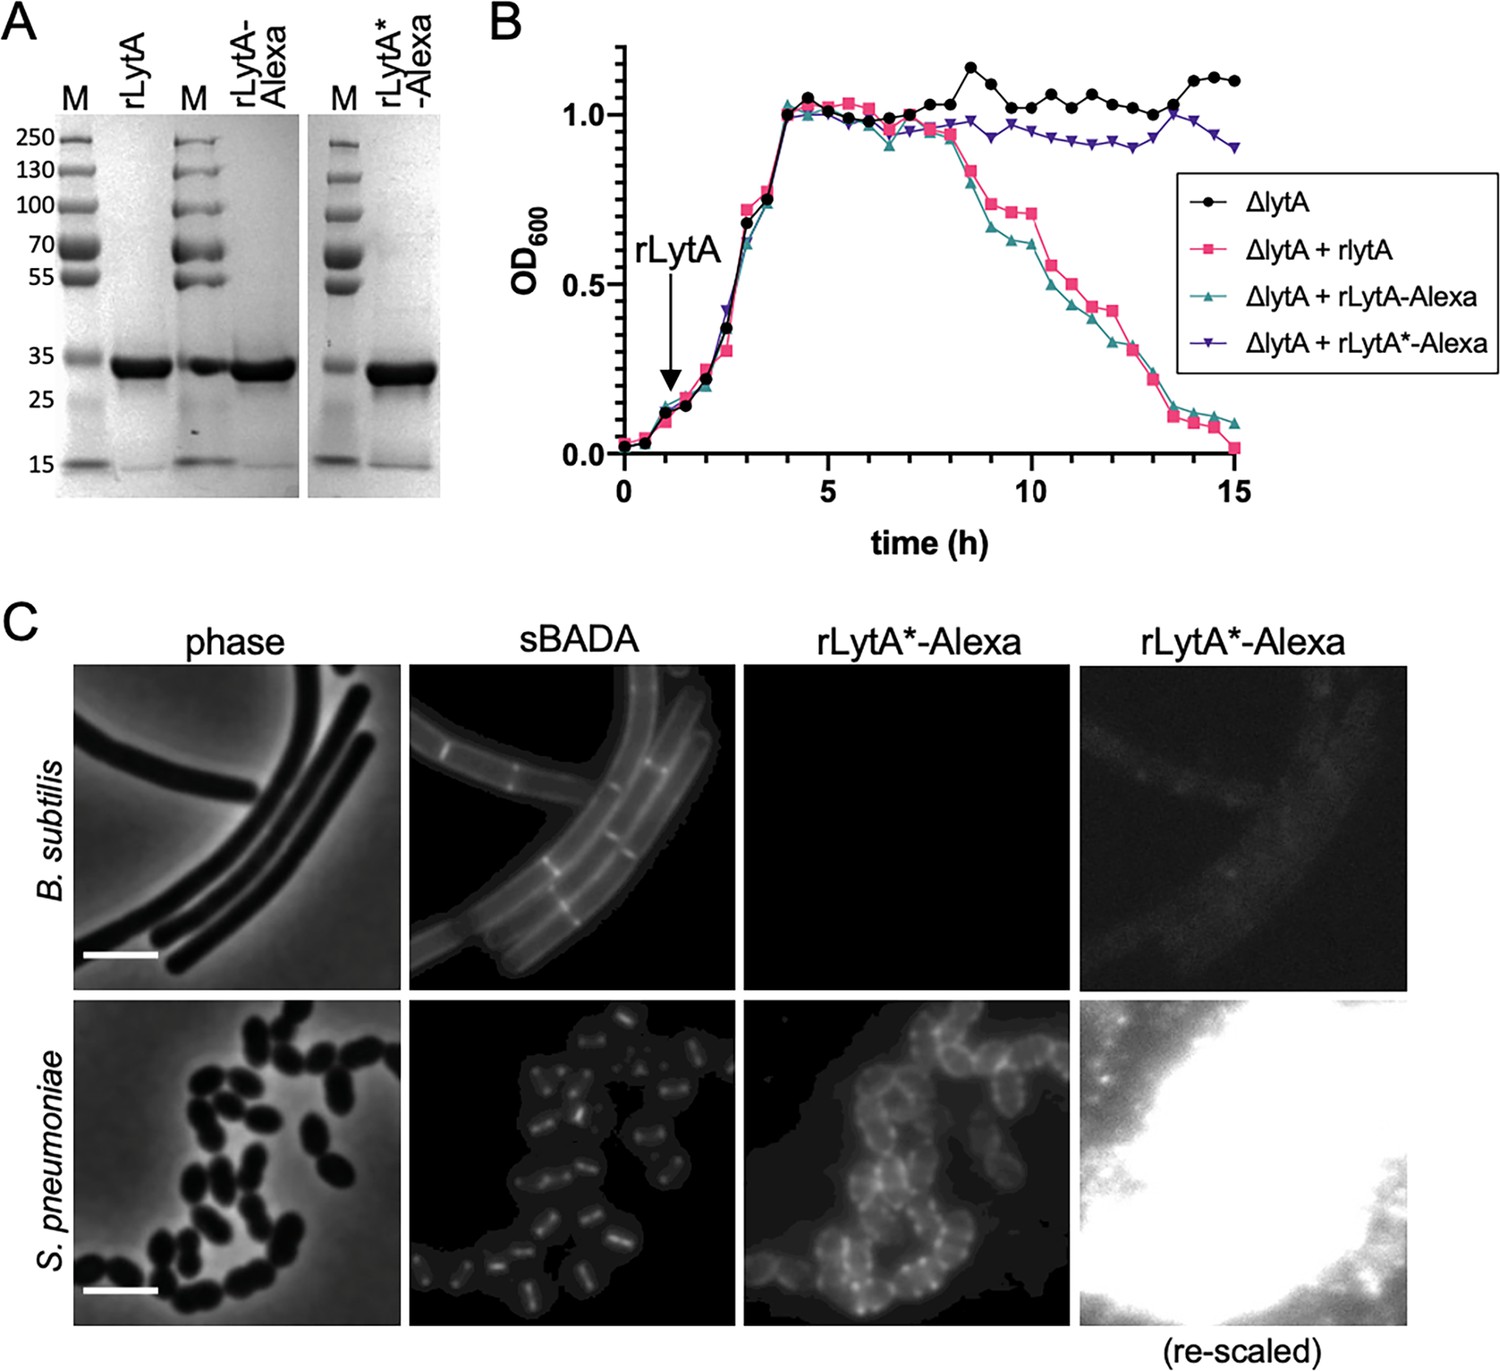
Validation of the wall teichoic acids-labeling assay.
(A) Coomassie-stained gels of purified recombinant LytA (rLytA) and Alexa594-labeled rLytA (rLytA-Alexa) and a catalytically inactive (rLytA*) mutant (rLytA*-Alexa). The first two lanes of the gel are also presented in Figure 1D. M, Molecular weight markers in kDa. (B) rLytA-Alexa is functional. Growth curves of the indicated strains before and after the addition of 1 µg/ml rLytA, rLytA-Alexa, or rLytA*-Alexa at an OD600 of ~0.2. The ΔlytA strain incubated with rLytA or rLytA-Alexa lysed in stationary phase in a manner similar to LytA+ cells. (C) LytA*-Alexa specifically labels Streptococcus pneumoniae cells. Wild-type Bacillus subtilis and S. pneumoniae cells were incubated with rLytA*-Alexa as described in the Materials and methods. Cells were labeled with sBADA for 5 min prior to imaging. Scale bar, 3 μm. The images of rLytA*-Alexa labeled cells were re-scaled in the right panels to highlight the absence of labeling of Bacillus subtilis cells.
Figure 7—figure supplement 2
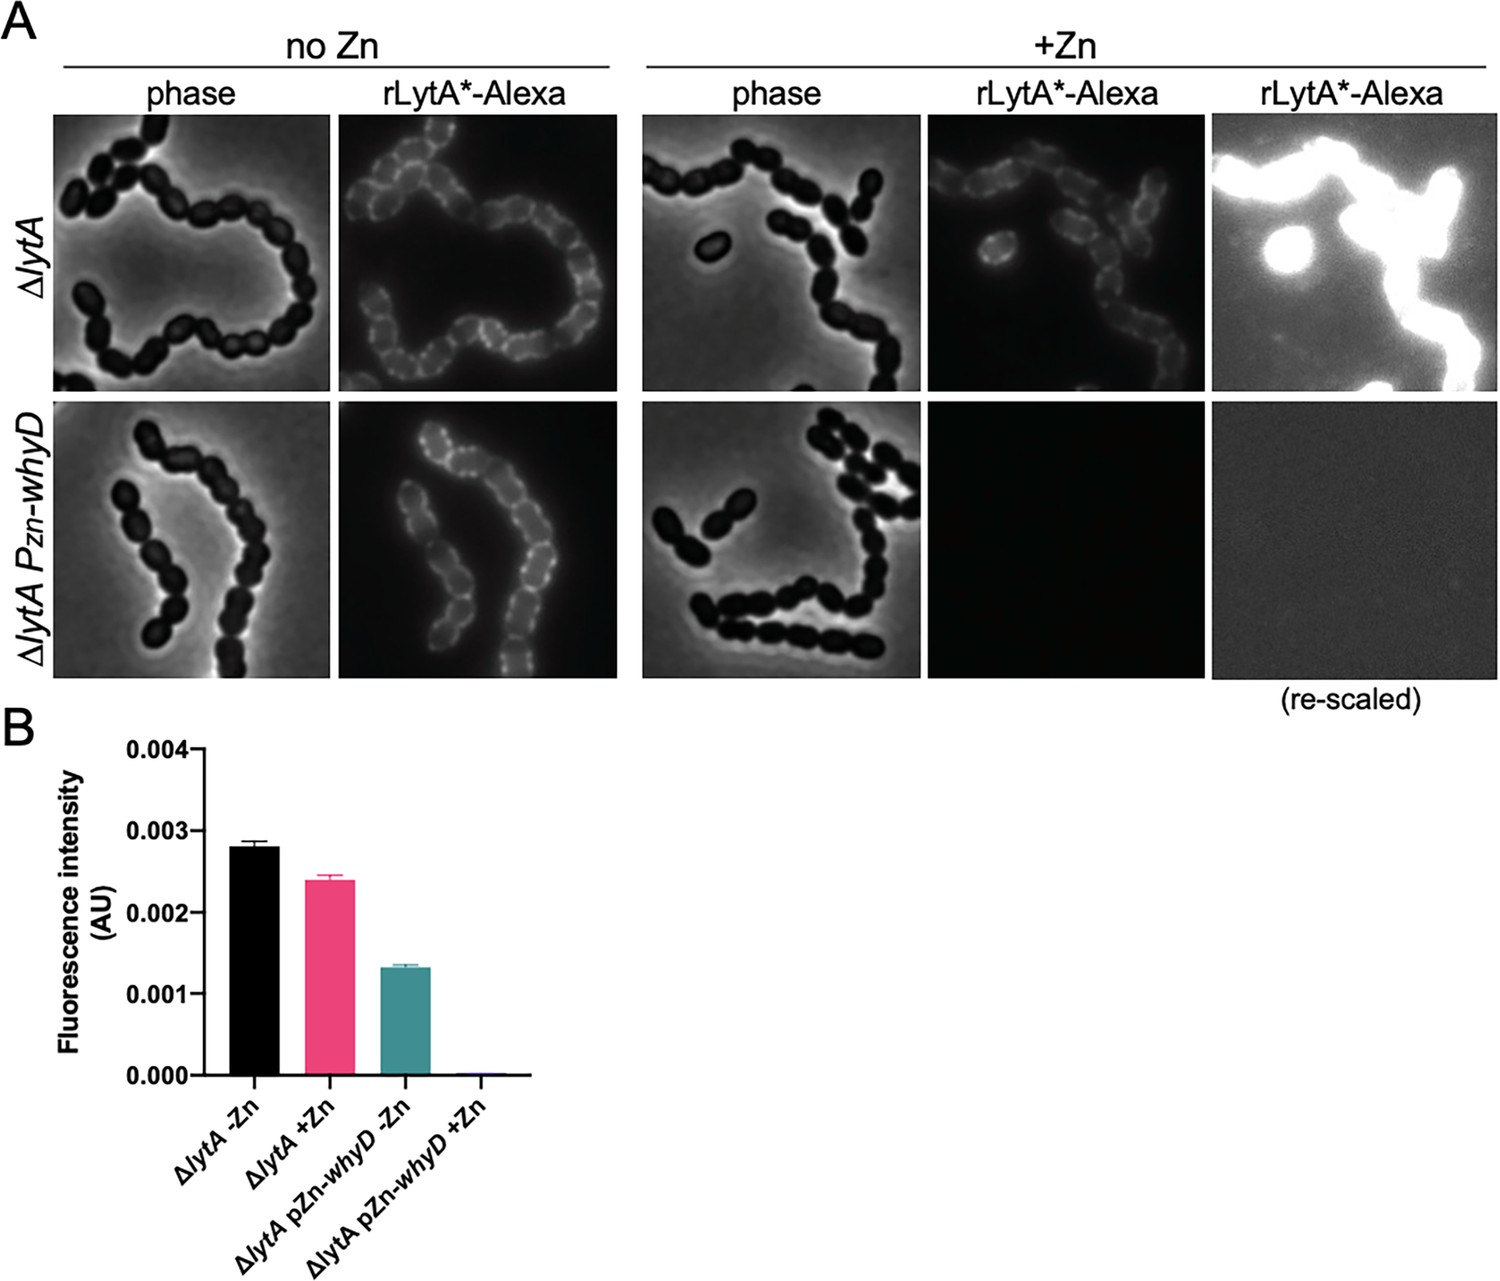
rLytA*-Alexa specifically labels wall teichoic acids.
(A) Overexpression of WhyD decreases rLytA*-Alexa labeling. Representative phase-contrast and fluorescent images of the indicated strains grown in THY medium in the presence or absence of 200 µM ZnCl2 to mid-exponential phase and labeled with rLytA*-Alexa as described in the Material and methods. Cells were imaged on 2% agarose pads. The images of rLytA*-Alexa labeled cells were re-scaled in the right panels to highlight the absence of labeling in cells overexpressing whyD. (B) Quantitative analysis of rLytA*-Alexa fluorescence intensity in the indicated strains using images from (A). Bar graphs show the standard deviation in each sample. AU, arbitrary units.
-
Figure 7—figure supplement 2—source data 1
Raw data of the quantitative analysis of cell length, width, and area.
- https://cdn.elifesciences.org/articles/76392/elife-76392-fig7-figsupp2-data1-v3.zip
Figure 7—figure supplement 3
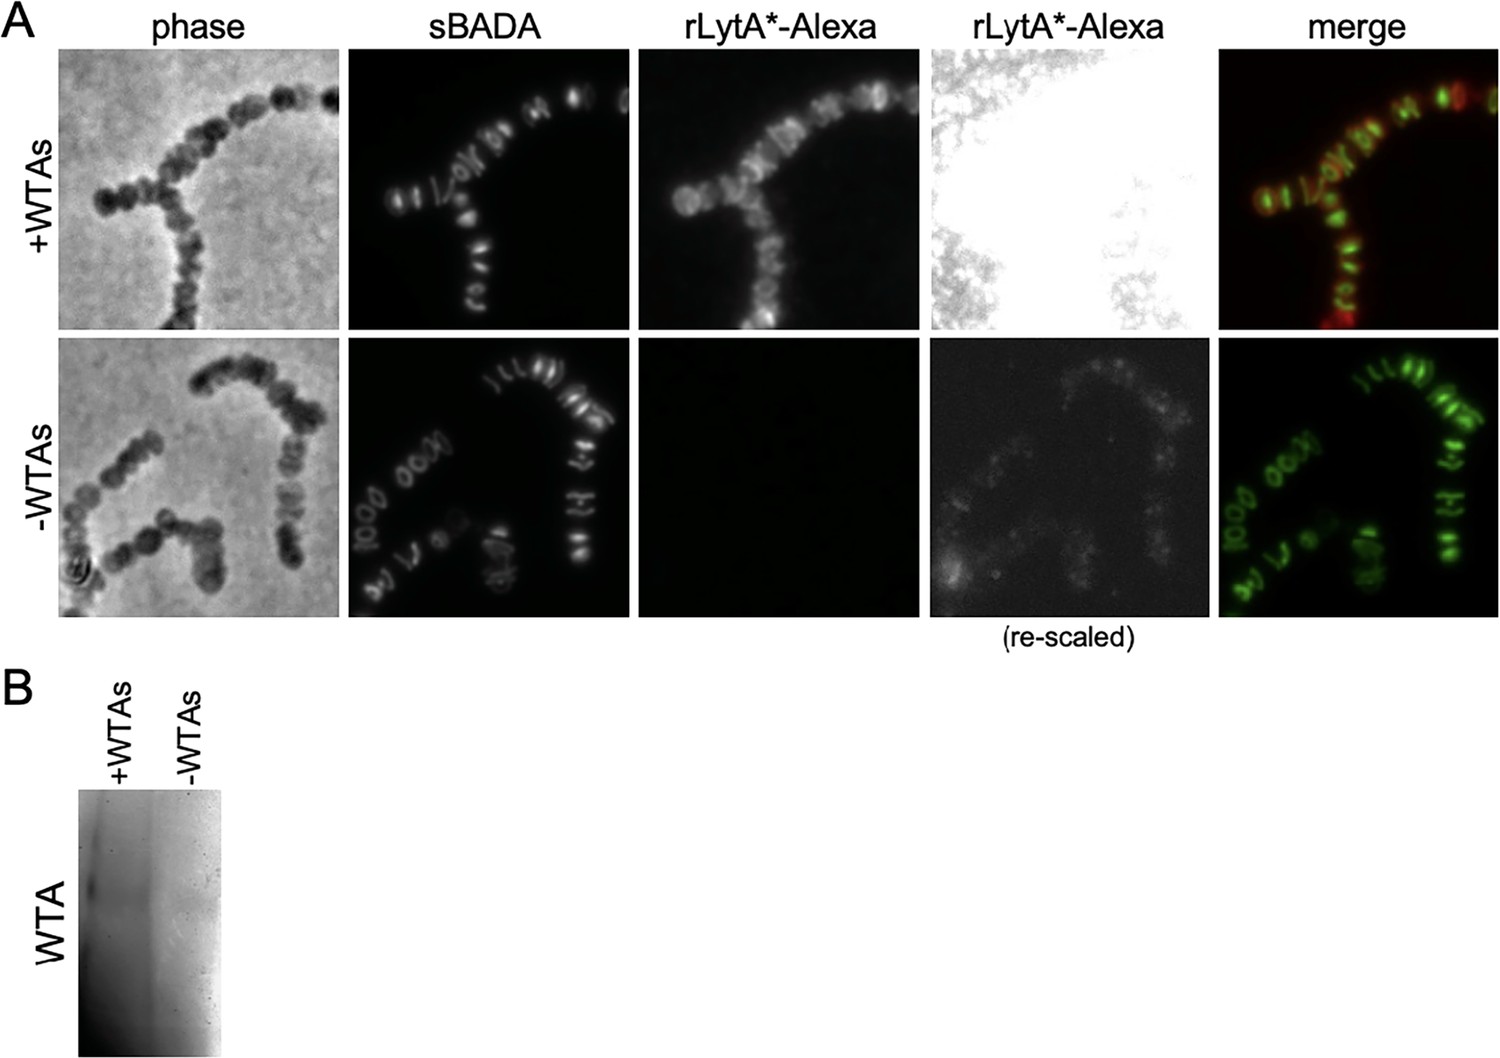
rLytA*-Alexa specifically labels sacculi that contain wall teichoic acids (WTAs).
(A) Representative phase-contrast and fluorescent images of purified saculli derived from cells lacking LytA that were labeled with rLytA*-Alexa. The ∆lytA mutant was grown in THY to mid-exponential phase and labeled with sBADA for 5 m prior to harvest. Sacculi were purified with their WTAs intact (+WTAs) or with their WTAs removed (−WTAs) as described in the Materials and methods. Sacculi from the equivalent of 1 ml of cells at OD600 of 0.5 were labeled with rLytA*-Alexa as described in the Materials and methods and imaged on 2% agarose pads. The images of rLytA*-Alexa labeled sacculi were re-scaled in the right panels to highlight the loss of labeling in sacculi lacking WTAs. (B) Alcian blue-silver stained gel of WTAs present in the samples in (A).
-
Figure 7—figure supplement 3—source data 1
Alcian blue-silver stained gel of WTAs from purified sacculi.
- https://cdn.elifesciences.org/articles/76392/elife-76392-fig7-figsupp3-data1-v3.zip
Figure 7—figure supplement 4
Localization of WhyD and wall teichoic acids (WTAs).
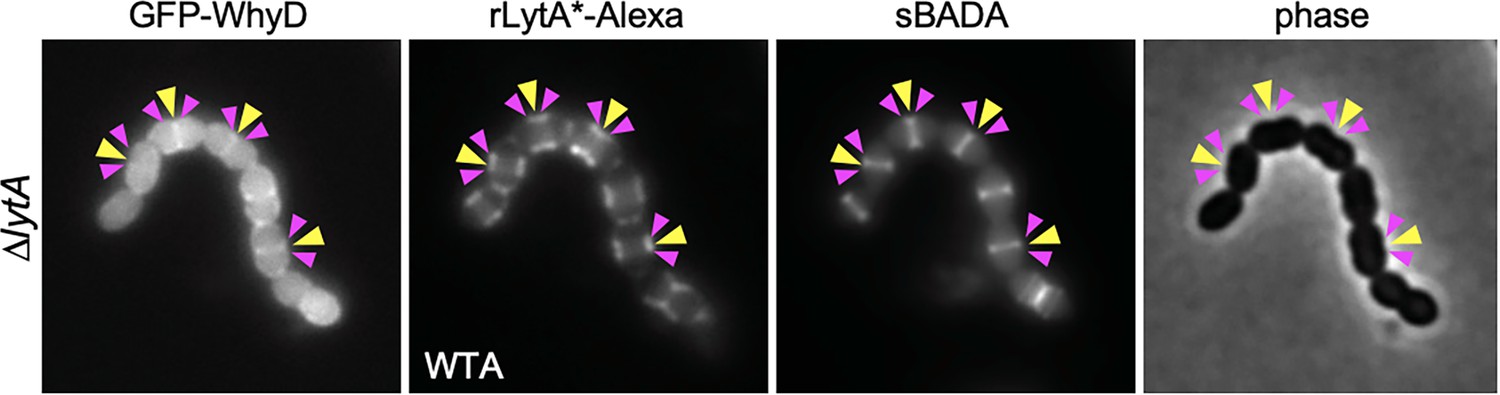
Representative phase-contrast and fluorescent images of cells expressing GFP-WhyD and labeled with LytA*-Alexa (WTA) and sBADA (nascent PG). The ∆lytA mutant was grown in THY medium to mid-exponential phase and labeled with sBADA for 5 min. A sample was collected, normalized to an OD600 of 0.5, washed with fresh medium containing 1% choline and then incubated with 1 µg/ml rLytA*-Alexa for 30 s with gentle shaking to label WTAs. Cells were then washed twice with 1× phosphate buffer saline (PBS) and analyzed by fluorescence microscopy. Midcell localization of nascent PG and GFP-WhyD (yellow carets) and LytA*-Alexa (WTA) enrichment (pink carets) are highlighted.
Figure 7—figure supplement 5
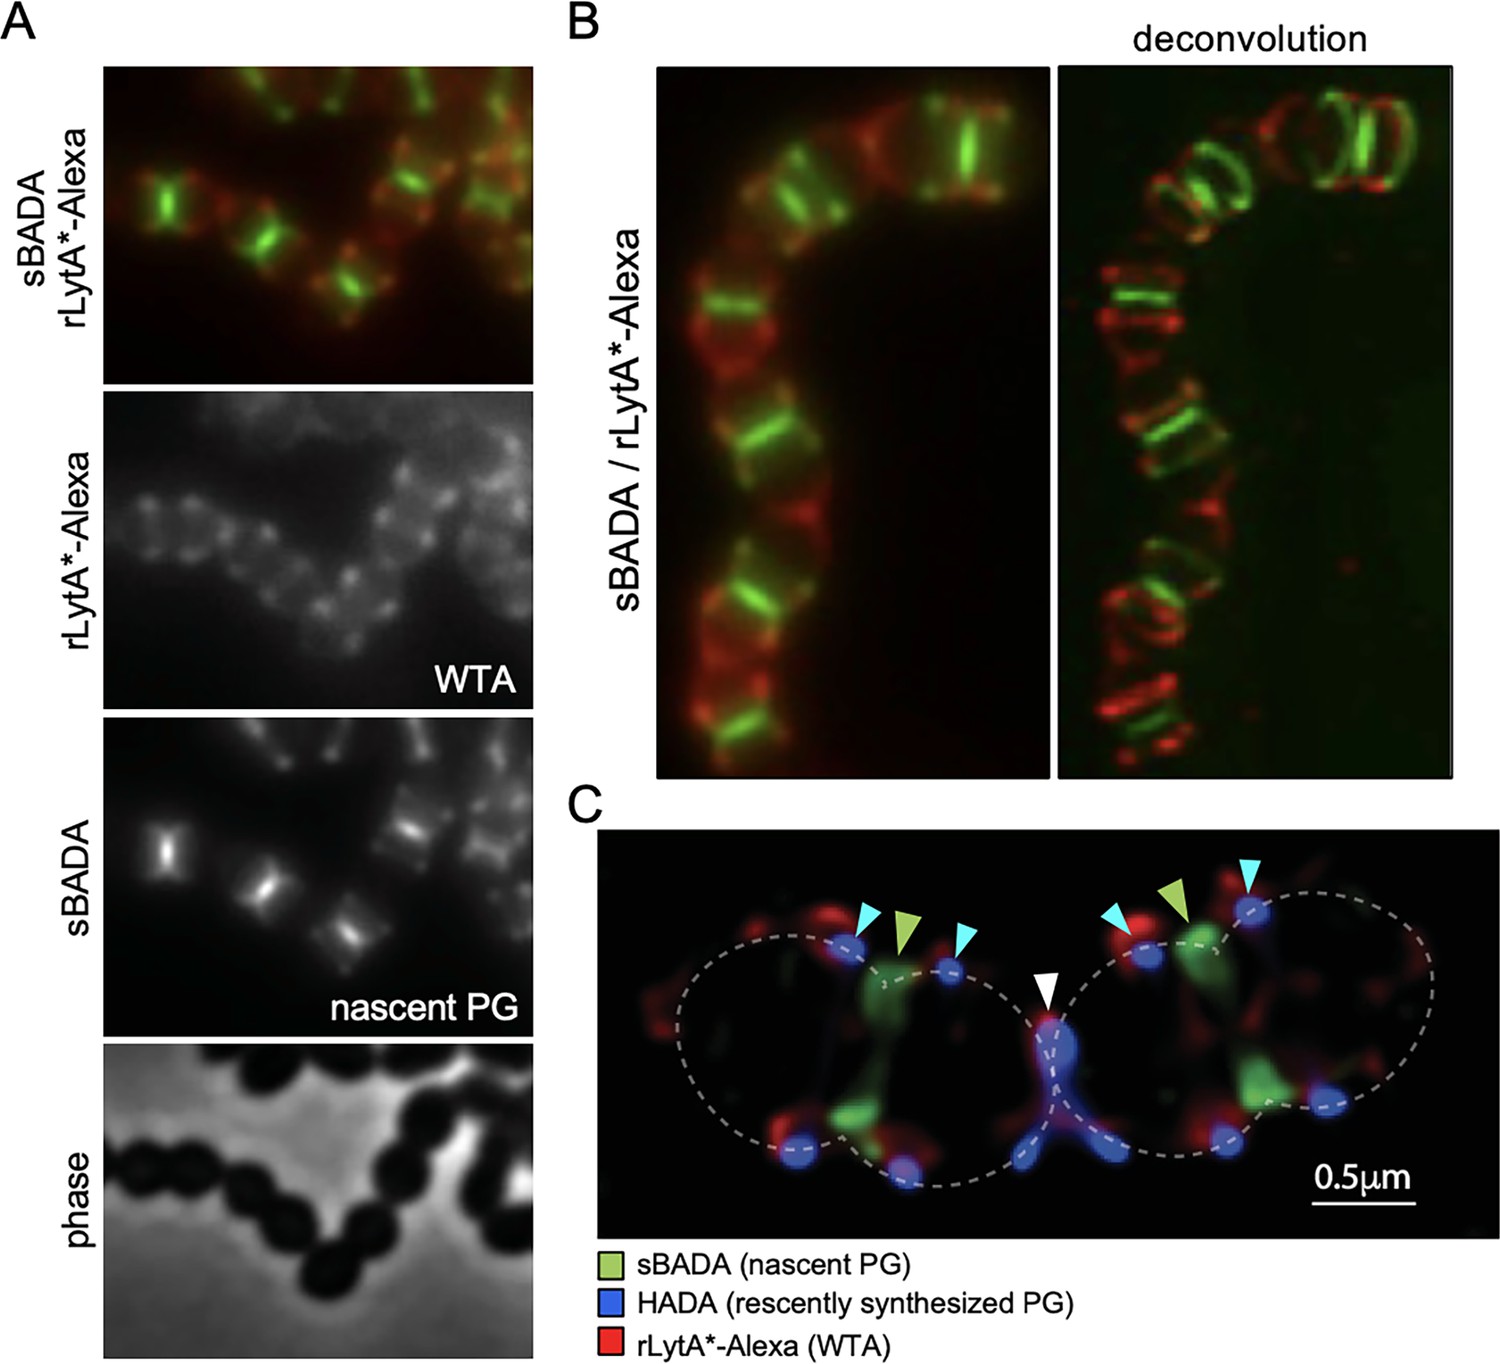
Wall teichoic acids (WTAs) are enriched at the edge of zonal PG synthesis.
(A) Representative phase-contrast and fluorescent images of cells labeled with LytA*-Alexa (WTAs) and sBADA (nascent PG). The ∆lytA mutant was grown in THY medium to mid-exponential phase, labeled with sBADA for 5 min. The sample was collected and normalized to an OD600 of 0.5 before incubation with rLytA*-Alexa to label WTAs as described in the Material and methods. The cells were then imaged on 2% agarose pads. (B) Representative wide-field and deconvolved images of the ∆lytA mutant labeled with rLytA*-Alexa and sBADA as described in (A). Z-stack images were taken every 100 nm from 1.5 µm above and below the focused image plane. Deconvolution was performed using Hyugens Widefield Deconvolution Software. (C) Representative Structured illumination microscopy image of a ∆lytA mutant grown in THY medium to mid-exponential phase, labeled with HADA for 5 min, washed with fresh THY, and then labeled with sBADA for 5 min. The sample was then collected, normalized to an OD600 of 0.5, washed with fresh medium containing 1% choline and incubated with 1 µg/ml rLytA*-Alexa for 30 s with gentle shaking to label WTAs. Cells were then washed twice with 1× phosphate buffer saline (PBS) and analyzed by fluorescence microscopy. Cells were imaged using an Elyra 7 system with SIM2 as described in Materials and methods. Nascent PG (green carets), recently synthesized PG (light blue carets), and the final stage of cell separation (white caret) are highlighted. WTAs labeled with rLytA*-Alexa are red and are enriched at the edge of zonal PG synthesis and at the septum in the final stage of separation.
Figure 7—figure supplement 6

Wall teichoic acids (WTA) localization at different stages in the cell cycle.
(A) Representative phase-contrast and fluorescence images of cells labeled with LytA*-Alexa (WTAs) and HADA (nascent PG) and sBADA (recently synthesized PG). The ∆lytA mutant was grown in THY medium to mid-exponential phase, labeled with HADA for 5 min, washed with fresh THY medium, and then labeled with sBADA for 5 min. A sample was collected and normalized to an OD600 of 0.5 prior to incubation with LytA*-Alexa to label WTAs as described in the Materials and methods. The images are not normalized and were adjusted to best highlight the LytA*-Alexa distribution along the cell envelope. Each image is representative of a distinct stage in the pneumococcal cell cycle: (i) early division/elongation, (ii) mid-division/elongation, (iii) early constriction, (iv) late constriction/separation. Scale bars indicate 1 µm. (B) Quantitative analysis of LytA*-Alexa, HADA, and sBADA fluorescence intensities in the cells shown in (A). The graphs depict fluorescence intensities as a function of position along the cell length.
Figure 8 with 1 supplement
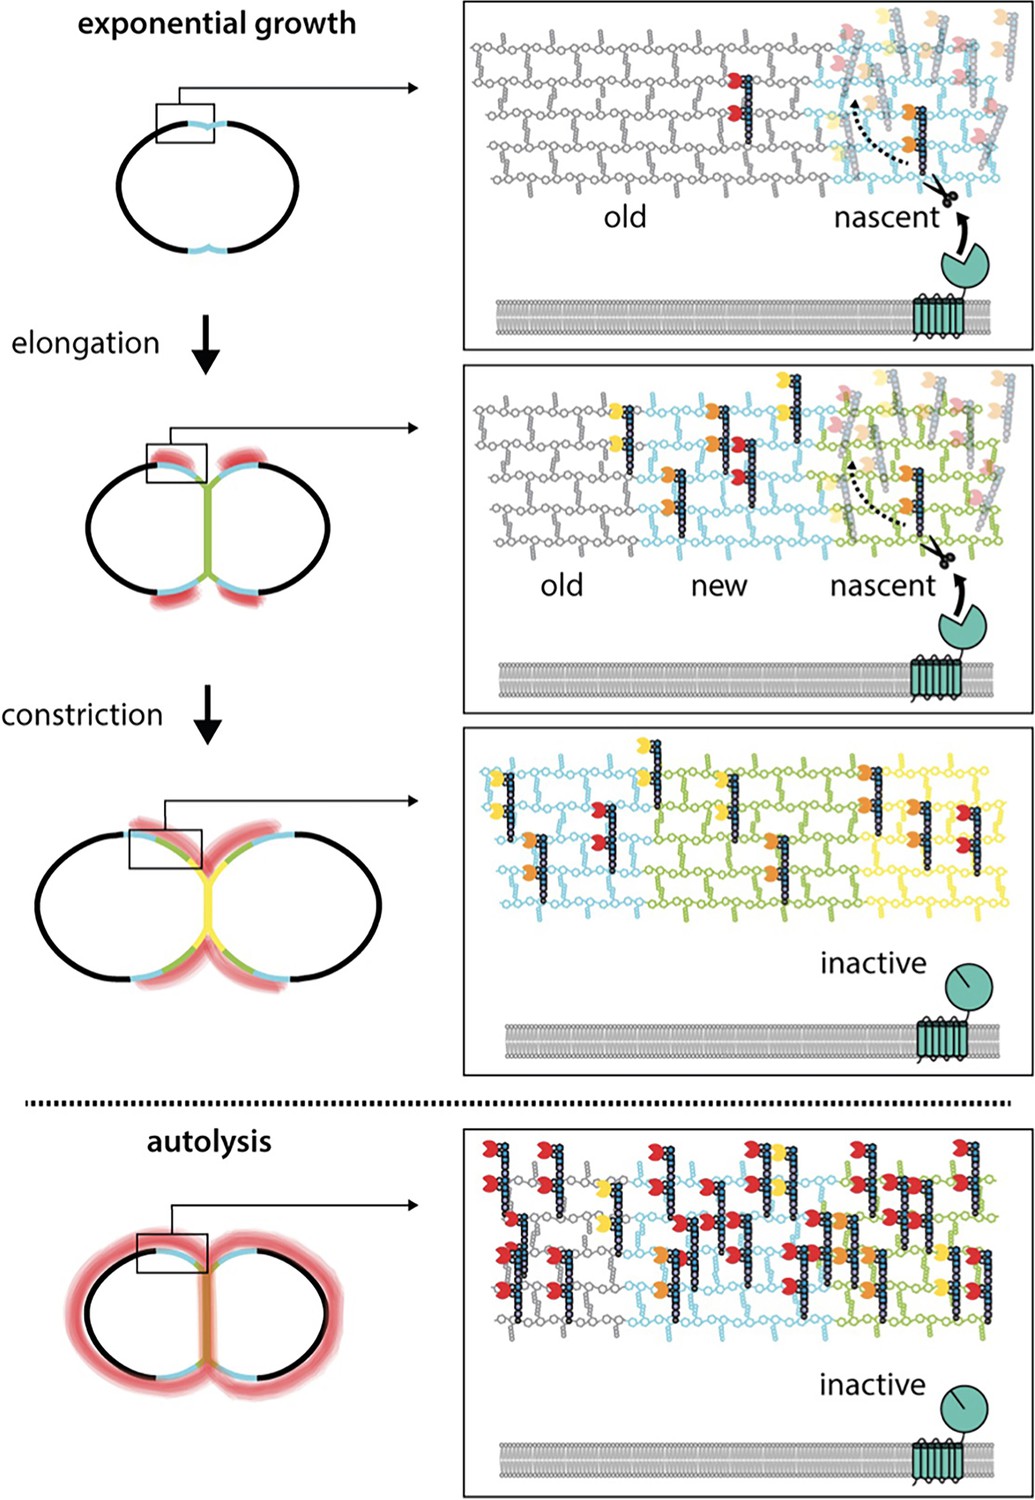
WhyD tailors wall teichoic acids (WTAs) to direct cell elongation.
Schematic model of WhyD function. WhyD releases the majority WTAs attached to the cell wall during nascent PG synthesis at midcell. A subset of the WTAs remain intact and as the cell elongates these polymers recruit PG hydrolases with choline-binding domains (yellow, orange, red Pac-Men) to the zone of peripheral PG synthesis, promoting expansion of the cell wall meshwork and cell elongation. At a late stage of cell constriction, WTAs accumulate at midcell (yellow) where they recruit PG hydrolases that promote cell separation. At this stage, WhyD might not be localized at midcell or its activity could be inhibited. Upon entry into stationary phase or exposure to cell wall targeting antibiotics (autolysis), WhyD is unable to keep pace with the increase in WTA synthesis and/or is actively inhibited, leading to an increase in WTAs throughout the sacculus. Recruitment of LytA and other PG hydrolases leads to cell wall cleavage and lysis.
Figure 8—figure supplement 1
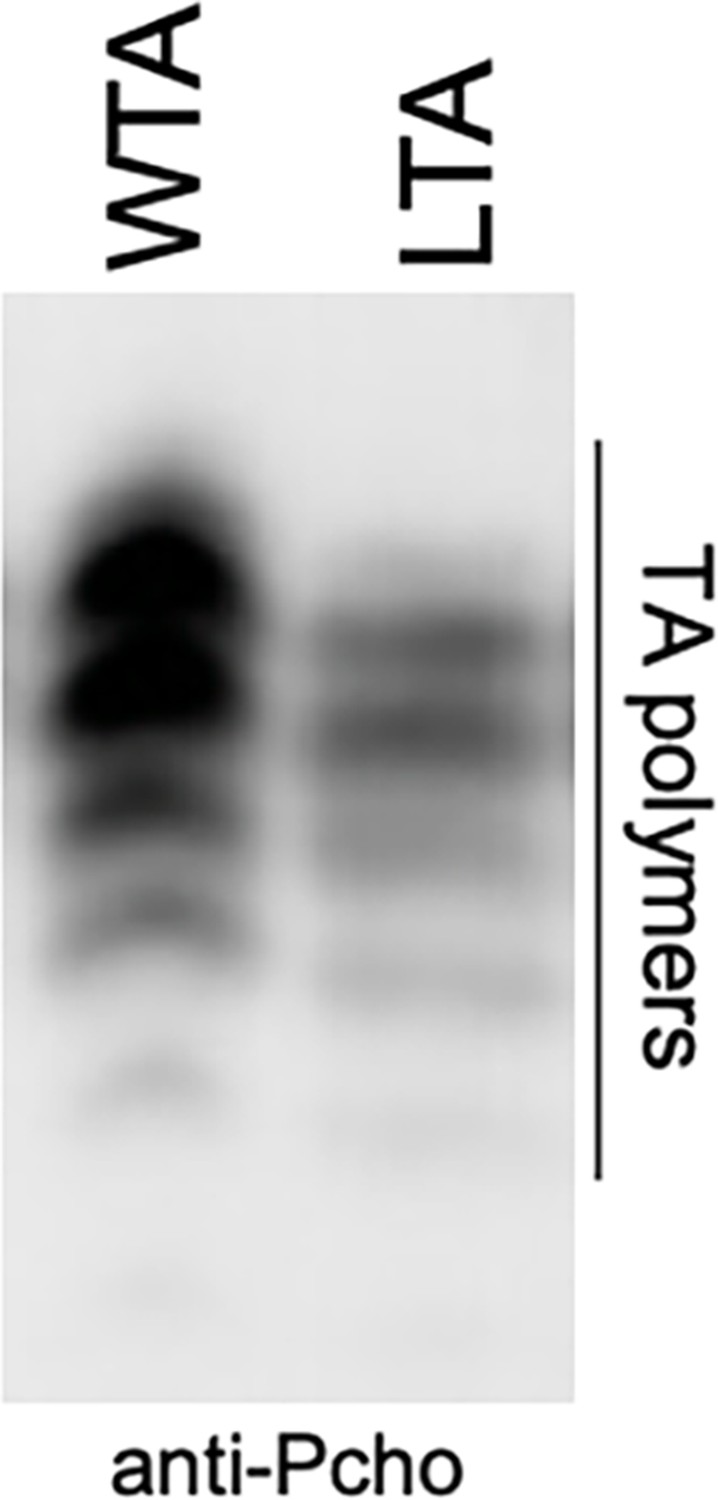
WhyD releases TA polymers from the cell wall with a length distribution that mirrors that of LTAs.
Immunoblot analysis of TA polymers released from purified sacculi by WhyD and membrane-associated LTAs. TA polymers were resolved by 16% Tris-tricine SDS-PAGE, transferred to nitrocellulose and probed with an anti-phosphocholine monoclonal antibody.
-
Figure 8—figure supplement 1—source data 1
Anti-phosphocholine immunoblot of TAs released from purified sacculi and membrane-associated LTAs.
- https://cdn.elifesciences.org/articles/76392/elife-76392-fig8-figsupp1-data1-v3.zip
Tables
Key resources table
| Reagent type (species) or resource | Designation | Source or reference | Identifiers | Additional information |
|---|---|---|---|---|
| Strain, strain background (Streptococcus pneumoniae [Sp]) | WT (Sp D39 Δcps) | Lanie et al., 2007 | WT (Sp D39 Δcps) | Wild-type S. pneumoniae D39 Δcps |
| Strain, strain background (Sp) | Sp (D39 Δcps) | Fenton et al., 2016 | AKF_Spn001 | ΔbgaA::kan |
| Strain, strain background (Sp) | Sp (D39 Δcps) | Fenton et al., 2016 | AKF_Spn002 | ΔbgaA::add9(spec) |
| Strain, strain background (Sp) | Sp (D39 Δcps) | Fenton et al., 2016 | AKF_Spn003 | ΔbgaA::tetM(tet) |
| Strain, strain background (Sp) | Sp (D39 Δcps) | Fenton et al., 2016 | AKF_Spn004 | ΔbgaA::cat |
| Strain, strain background (Sp) | Sp (D39 Δcps) | Fenton et al., 2016 | AKF_Spn005 | ΔbgaA::erm |
| Strain, strain background (Sp) | Sp (D39 Δcps) | Fenton et al., 2016 | AKF_Spn351 | ΔlytA::cat |
| Strain, strain background (Sp) | Sp (D39 Δcps) | Flores-Kim et al., 2019 | AKF_Spn704 | ΔlytA::erm |
| Strain, strain background (Sp) | Sp (D39 Δcps) | Flores-Kim et al., 2019 | JFK_SPN001 | ΔlytA::erm ΔtacL::cat |
| Strain, strain background (Sp) | Sp (D39 Δcps) | Flores-Kim et al., 2019 | JFK_SPN004 | lytA(H26A), erm |
| Strain, strain background (Sp) | Sp (D39 Δcps) | Flores-Kim et al., 2019 | JFK_SPN006 | tacL-FLAG, spec |
| Strain, strain background (Sp) | Sp (D39 Δcps) | Flores-Kim et al., 2019 | JFK_SPN008 | tacL-FLAG, spec ΔlytA::erm |
| Strain, strain background (Sp) | Sp (D39 Δcps) | Flores-Kim et al., 2019 | JFK_SPN013 | ΔbgaA::(PZn-tacL, tet) ΔtacL::cat ΔlytA::erm |
| Strain, strain background (Sp) | Sp (D39 Δcps) | This study | JFK_SPN014 | ΔbgaA::(PZn-lytA, tet) ΔlytA::erm |
| Strain, strain background (Sp) | Sp (D39 Δcps) | This study | JFK_SPN015 | ΔbgaA::(PZn-lytA, tet) ΔlytA::erm ΔwhyD::spec |
| Strain, strain background (Sp) | Sp (D39 Δcps) | This study | JFK_SPN016 | ΔlytA::erm ΔwhyD::spec |
| Strain, strain background (Sp) | Sp (D39 Δcps) | This study | JFK_SPN017 | ΔbgaA::(PZn-whyD, tet) |
| Strain, strain background (Sp) | Sp (D39 Δcps) | This study | JFK_SPN018 | ΔbgaA::(PZn-whyD, tet) ΔwhyD::spec |
| Strain, strain background (Sp) | Sp (D39 Δcps) | This study | JFK_SPN019 | ΔbgaA::(PZn-whyD, tet) ΔwhyD::spec ΔlytA::erm |
| Strain, strain background (Sp) | Sp (D39 Δcps) | This study | JFK_SPN020 | ΔbgaA::(PZn-gfp-whyD, tet) |
| Strain, strain background (Sp) | Sp (D39 Δcps) | This study | JFK_SPN021 | ΔbgaA::(PZn-gfp-whyD, tet) ΔwhyD::spec |
| Strain, strain background (Sp) | Sp (D39 Δcps) | This study | JFK_SPN022 | ΔbgaA::(PZn-gfp-whyD, tet) ΔlytA::erm ΔwhyD::spec |
| Strain, strain background (Sp) | Sp (D39 Δcps) | This study | JFK_SPN023 | ΔbgaA::(PZn-gfp-whyD, tet) ΔwhyD::spec |
| Strain, strain background (Sp) | Sp (D39 Δcps) | This study | JFK_SPN024 | ΔbgaA::(PZn-whyD, tet) spd1526-1527::PF6-optRBS-gfp, kan |
| Strain, strain background (Sp) | Sp (D39 Δcps) | This study | JFK_SPN025 | ΔlytA::erm ΔlytC::tet ΔlytB::spec |
| Strain, strain background (Sp) | Sp (D39 Δcps) | This study | JFK_SPN026 | spd1526-1527::PF6-optRBS-gfp, kan |
| Strain, strain background (Sp) | Sp (D39 Δcps) | This study | JFK_SPN027 | ΔlytA::erm ΔlytC::tet ΔlytB::spec spd1526-1527::PF6-optRBS-gfp, kan |
| Strain (Bacillus subtilis) | PY79 | Youngman et al., 1983 | PY79 – wild-type strain | PY79 – wild-type strain |
| Strain (Escherichia coli) | DH5a | Gibco BRL | DH5a | F-hsdR17 Δ(argF-lacZ)U169 phoA glnV44 Φ80dlacZ Δ M15 gyrA96 recA1 endA1 thi-1 supE44 deoR |
| Strain (E. coli) | BL21(DE3) | New England Biolabs | BL21(DE3) | E. coli B F– ompT gal dcm lon hsdSB(rB–mB–) [malB+]K-12(λS) ΔfhuA |
| Recombinant DNA reagent | plasmid | Fenton et al., 2016 | pLEM023 | bgaA’::Pzn::MCS::tetM::bgaA’ bla |
| Recombinant DNA reagent | plasmid | Novagen | pET24 | PT7, lacIq; vector used for protein expression |
| Recombinant DNA reagent | plasmid | This study | pER111 | spd1526-1527::kan |
| Recombinant DNA reagent | plasmid | Flores-Kim et al., 2019 | pJFK001 | tacL in pLEM023 |
| Recombinant DNA reagent | plasmid | Flores-Kim et al., 2019 | pJFK002 | lytA in pet24 |
| Recombinant DNA reagent | plasmid | This study | pJFK003 | whyD in pLEM023 |
| Recombinant DNA reagent | plasmid | This study | pJFK004 | lytA* (H26A) in pET24 |
| Recombinant DNA reagent | plasmid | This study | pGD147 | gfp-whyD in pLEM023 |
| Recombinant DNA reagent | plasmid | Uehara et al., 2010 | pTD68 | PT7, lacIq; vector used for protein expression and for making 6xhis-SUMO fusions |
| Recombinant DNA reagent | plasmid | This study | pJFK005 | whyDCT in pTD68 |
| Recombinant DNA reagent | plasmid | This study | pGD160 | spd1526-1527::PF6-optRBS-gfp (kan) |
| Recombinant DNA reagent | plasmid | Wang et al., 2014 | pBB283 | yhdG::kan |
| Recombinant DNA reagent | plasmid | Liu et al., 2017 | pPEPY-Pf6-lacI | Pf6-lacI expression vector used for lacI integration and expression from Sp chromosome |
| Antibody | WhyD (rabbit polyclonal) | This study | anti-WhyD | WB (1:10000) |
| Antibody | FLAG (TacL-FLAG; rabbit polyclonal) | Sigma | RRID:AB_796202 | WB (1:5000) |
| Antibody | LTA/anti-Phosphocholine TEPC-15 (mouse monoclonal) | Sigma | RRID:AB_1163630 | WB (1:1000) |
Additional files
-
Supplementary file 1
Test of suppression of whyD essentiality by deletion of genes encoding choline binding cell wall hydrolases.
Transformations with indicated amplicons were performed as described in Materials and methods. Each transformation experiment was performed 3 times independently with similar results and the average number of colonies from the 3 experiments are shown. * Direct transformation of a ΔwhyD::spec amplicon into the indicated stains resulted in tiny colonies that were unable to grow in liquid media after 10 hr.
- https://cdn.elifesciences.org/articles/76392/elife-76392-supp1-v3.docx
-
Supplementary file 2
Oligonucleotides used in this study.
- https://cdn.elifesciences.org/articles/76392/elife-76392-supp2-v3.docx
-
Transparent reporting form
- https://cdn.elifesciences.org/articles/76392/elife-76392-transrepform1-v3.docx
Download links
A two-part list of links to download the article, or parts of the article, in various formats.
Downloads (link to download the article as PDF)
Open citations (links to open the citations from this article in various online reference manager services)
Cite this article (links to download the citations from this article in formats compatible with various reference manager tools)
WhyD tailors surface polymers to prevent premature bacteriolysis and direct cell elongation in Streptococcus pneumoniae
eLife 11:e76392.
https://doi.org/10.7554/eLife.76392


