The importance of intermediate filaments in the shape maintenance of myoblast model tissues
- Laboratoire Matière et Systèmes Complexes, UMR 7057, Université Paris Cité and CNRS, France
- Laboratoire Biologie Fonctionnelle et Adaptative, UMR 8251, Université Paris Cité and CNRS, France
Figures
Figure 1 with 4 supplements
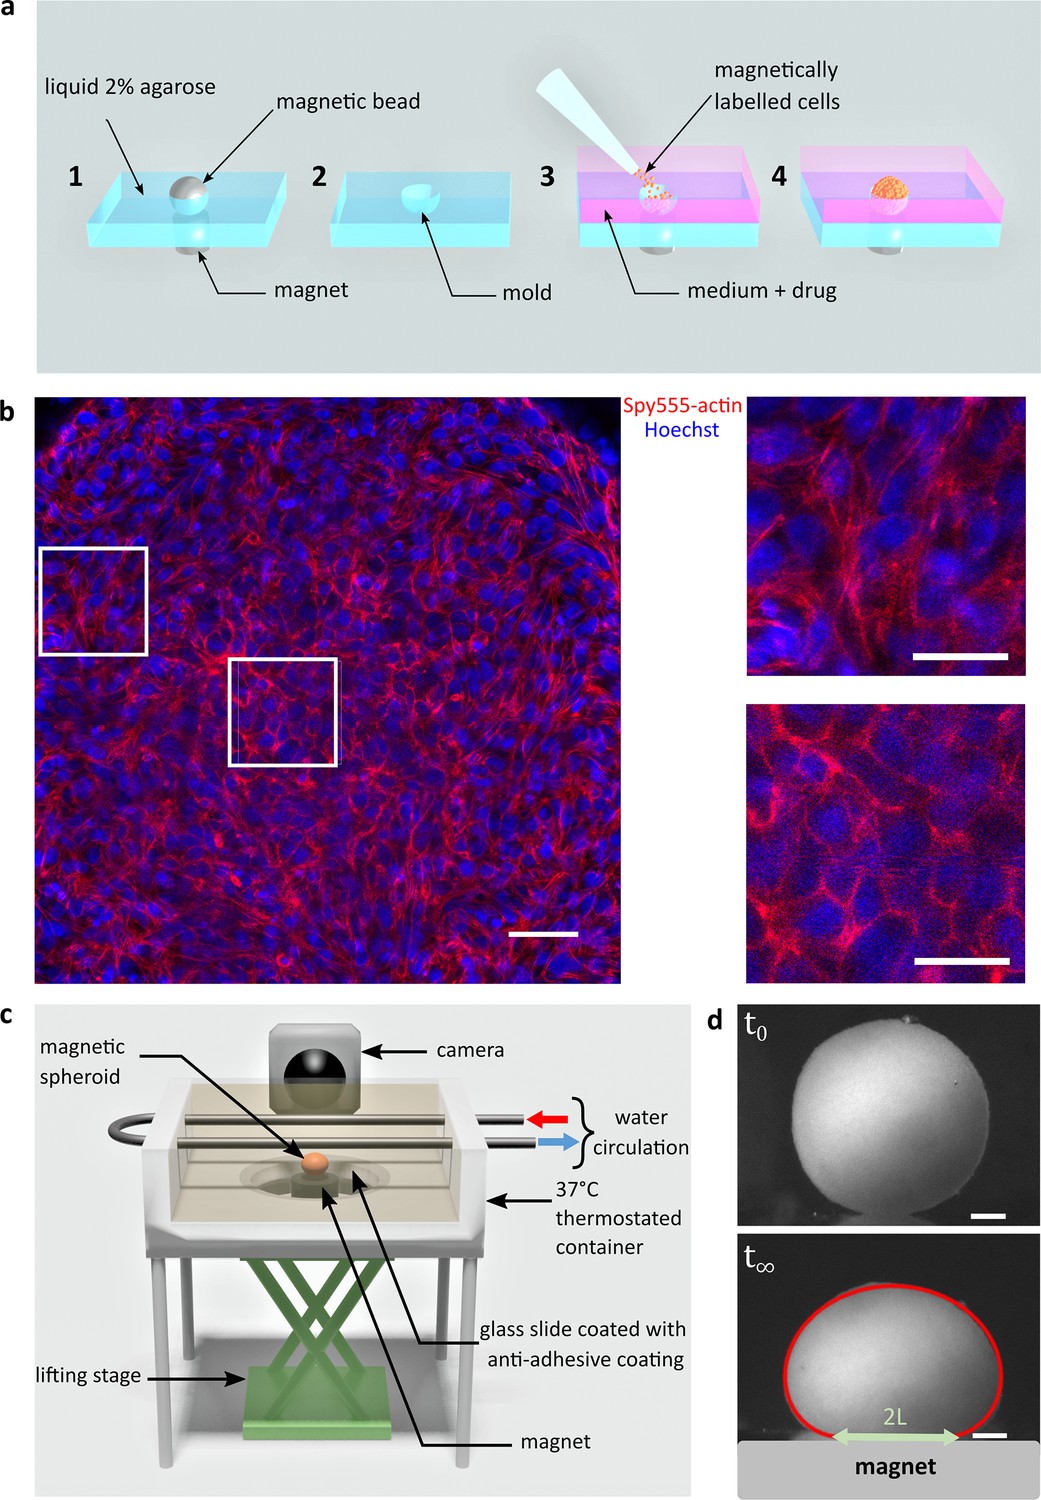
Magnetic tensiometer integrated measurement set-up.
(a) Schematic of the magnetic moulding process. A network of calibrated size steel beads deposited over cylindrical magnets is embedded in heated 2% liquid agarose (1). After agarose gelling, beads are removed creating a semi-spherical mould (2). Magnetically labelled cells are seeded in these non-adhesive-treated moulds. Magnets placed below each mould drive the cells inside the moulds (3). Due to high local cell density, cell–cell contacts develop to form cohesive multicellular aggregates within 12 hr (4). (b) Left panel: confocal image of a multicellular aggregate at 150 µm from the top of the aggregate. Actin (red) and nuclei (blue) are labelled. Scale bar: 50 µm. Right panels: 75-µm-long zooms for cells at the interface (up) or in the centre of the multicellular aggregate (down). The organization of actin depends on the location of the cell within the aggregate. While it is mainly cortical for cells in the centre, actin is contractile at the periphery of the aggregate to maintain its shape. Scale bar: 25 µm. (c) Schematic of the magnetic force tensiometer set-up. A temperature-regulated tank (37°C) is sealed with a non-adhesive glass slide to ensure non-wetting conditions for the multicellular spheroid formed by magnetic moulding (‘Methods’ and a). A cylindrical neodymium permanent magnet (6 mm diameter and height, 530 mT, ) is positioned underneath and approached with respect to a lifting stage. The tank is filled with a transparent culture medium, and the aggregate side profile is monitored with a camera. (d) Representative pictures of C2C12 spheroid profiles. Top and bottom pictures show, respectively, a C2C12 spheroid before the magnet approach (t0) and under magnetic flattening when the equilibrium shape is reached (). The dynamics is shown in Figure 1—figure supplement 4. The spheroid surface tension is measured by fitting the aggregate shape with Laplace profile (red line) while the elastic modulus is extracted from the radius of the contact zone (green arrow) using Hertz theory as described in Mazuel et al., 2015; Figure 1—figure supplement 3. In this picture, and . Scale bar: 200 µm.
Figure 1—figure supplement 1
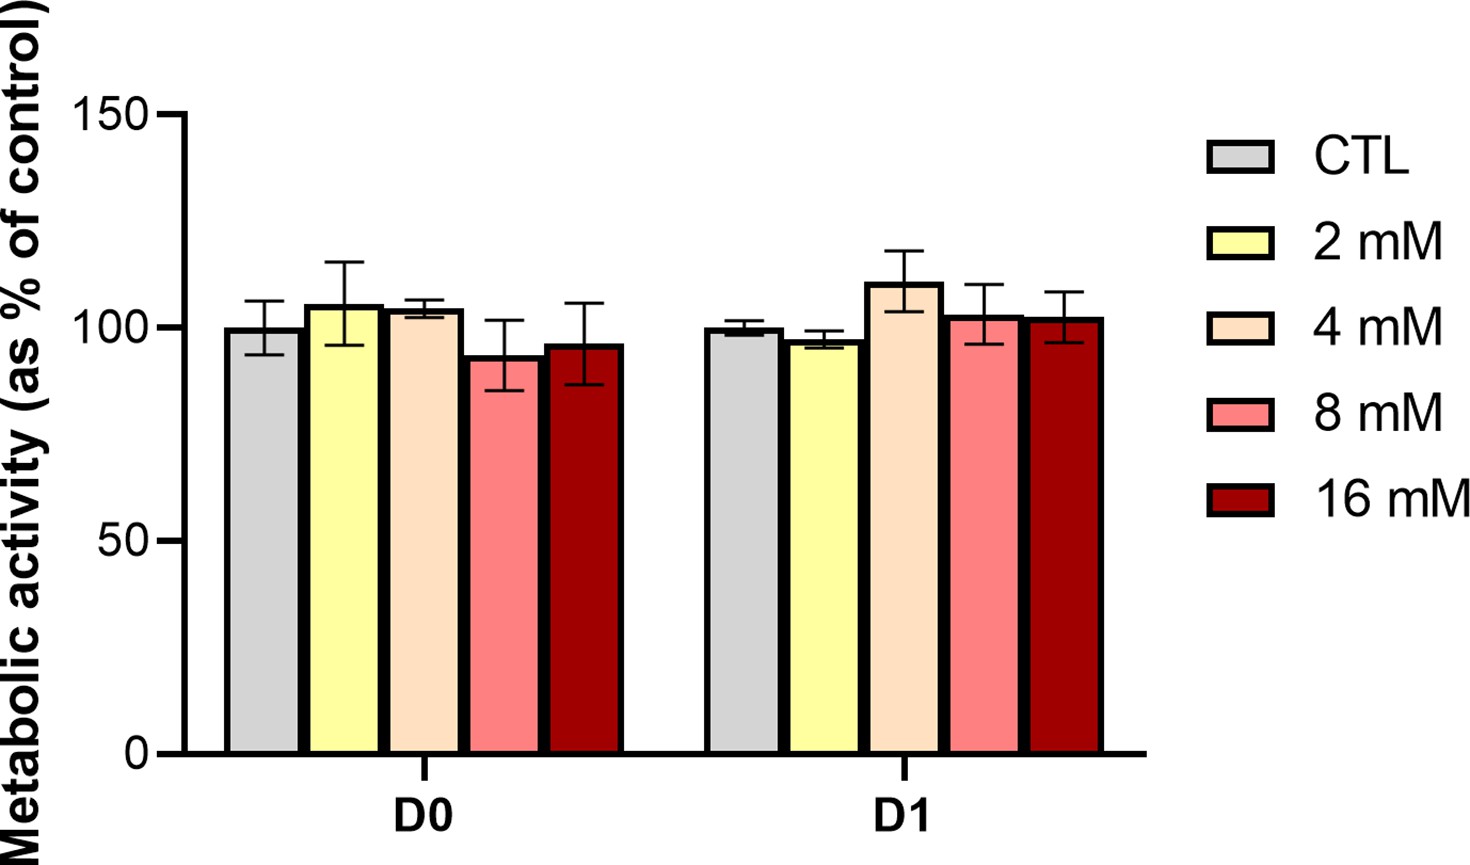
Metabolic activity for unlabelled (CTL) and labelled cells ([Fe] = 2–16 mM and 2 hr incubation time), 2 hr (D0), and 1 day (D1) after nanoparticle incorporation.
To assess metabolic activity, the metabolic test Alamar Blue was used. Fluorescence was measured at nm and nm. Values are interpreted relative to control values (unlabelled cells in complete medium, CTL) obtained under similar conditions. No influence of nanoparticle incorporation was observed on the metabolic activity and on the cell viability at D0 or D1 and for concentrations up to 16 mM.
-
Figure 1—figure supplement 1—source data 1
Source data of the Alamar-Blue test values for the different magnetic labelling conditions reported in Figure 1—figure supplement 1.
Measurement of the fluorescence ( nm and nm) after 1h30 incubation with the Alamar blue solution.
- https://cdn.elifesciences.org/articles/76409/elife-76409-fig1-figsupp1-data1-v2.xlsx
Figure 1—figure supplement 2
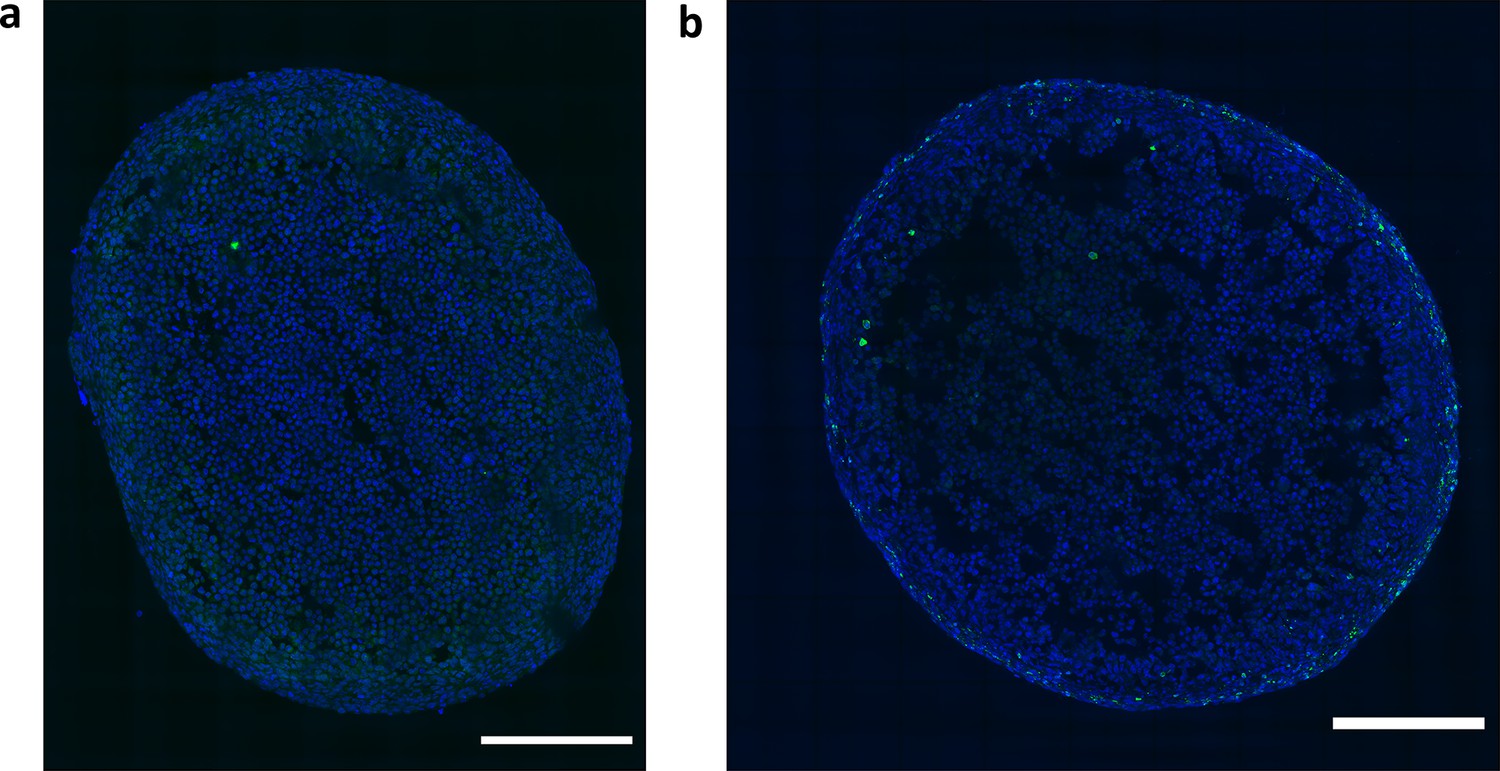
Immunofluorescence images of C2C12 spheroid cryosections to confirm non-hypoxic and non-apoptotic conditions in spheroids.
(a) DAPI is shown in blue and HIFα in green. HIFα is almost absent from the images. (b) DAPI is shown in blue and cleaved caspase-3 in green. Only 2% of cells show a positive signal to cleaved caspase-3. Scale bars: 200 µm.
Figure 1—figure supplement 3
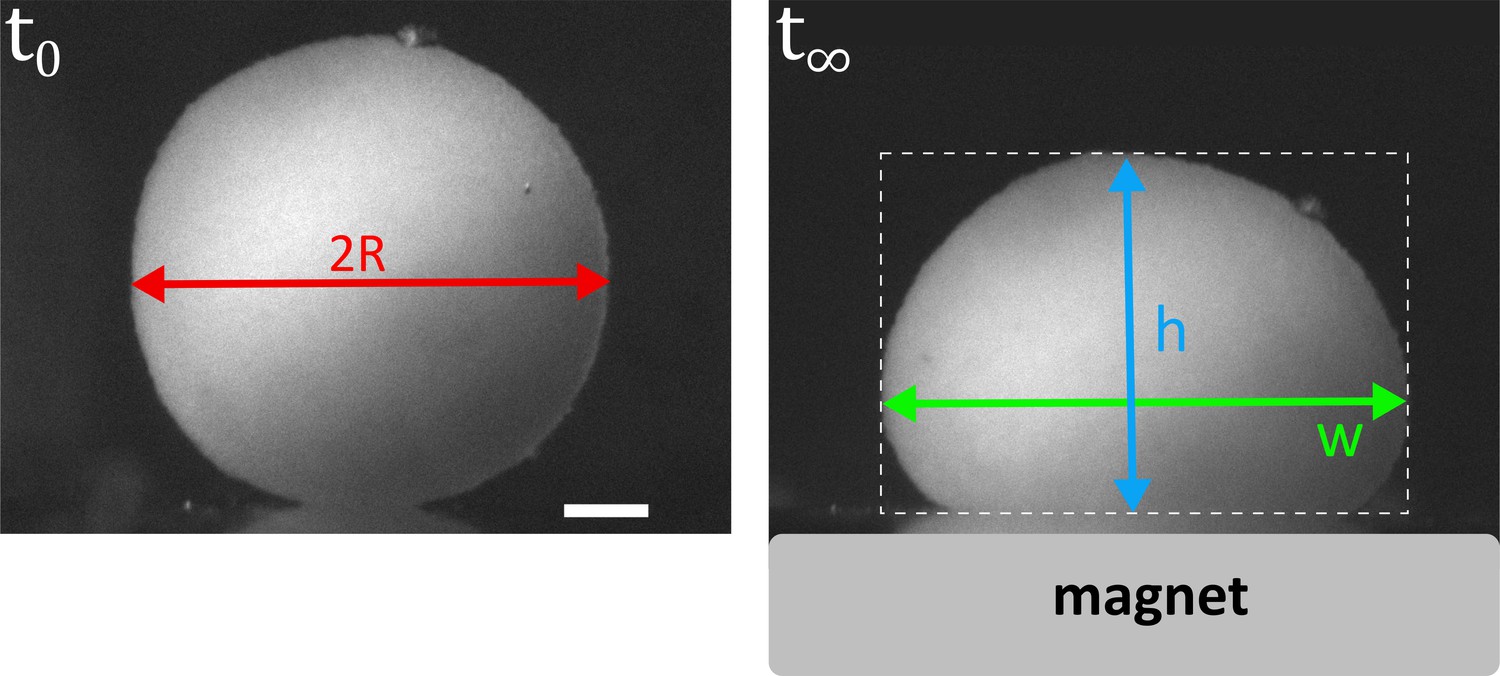
Extraction of experimental volume, width, and height of the spheroid.
The experimental volume V is calculated from the radius R of the spheroid at t0. The experimental width w (in green) and height h (in blue) are measured from the spheroid equilibrium profile. All these measurements are used in the minimization program of the Tensio application.
Figure 1—figure supplement 4
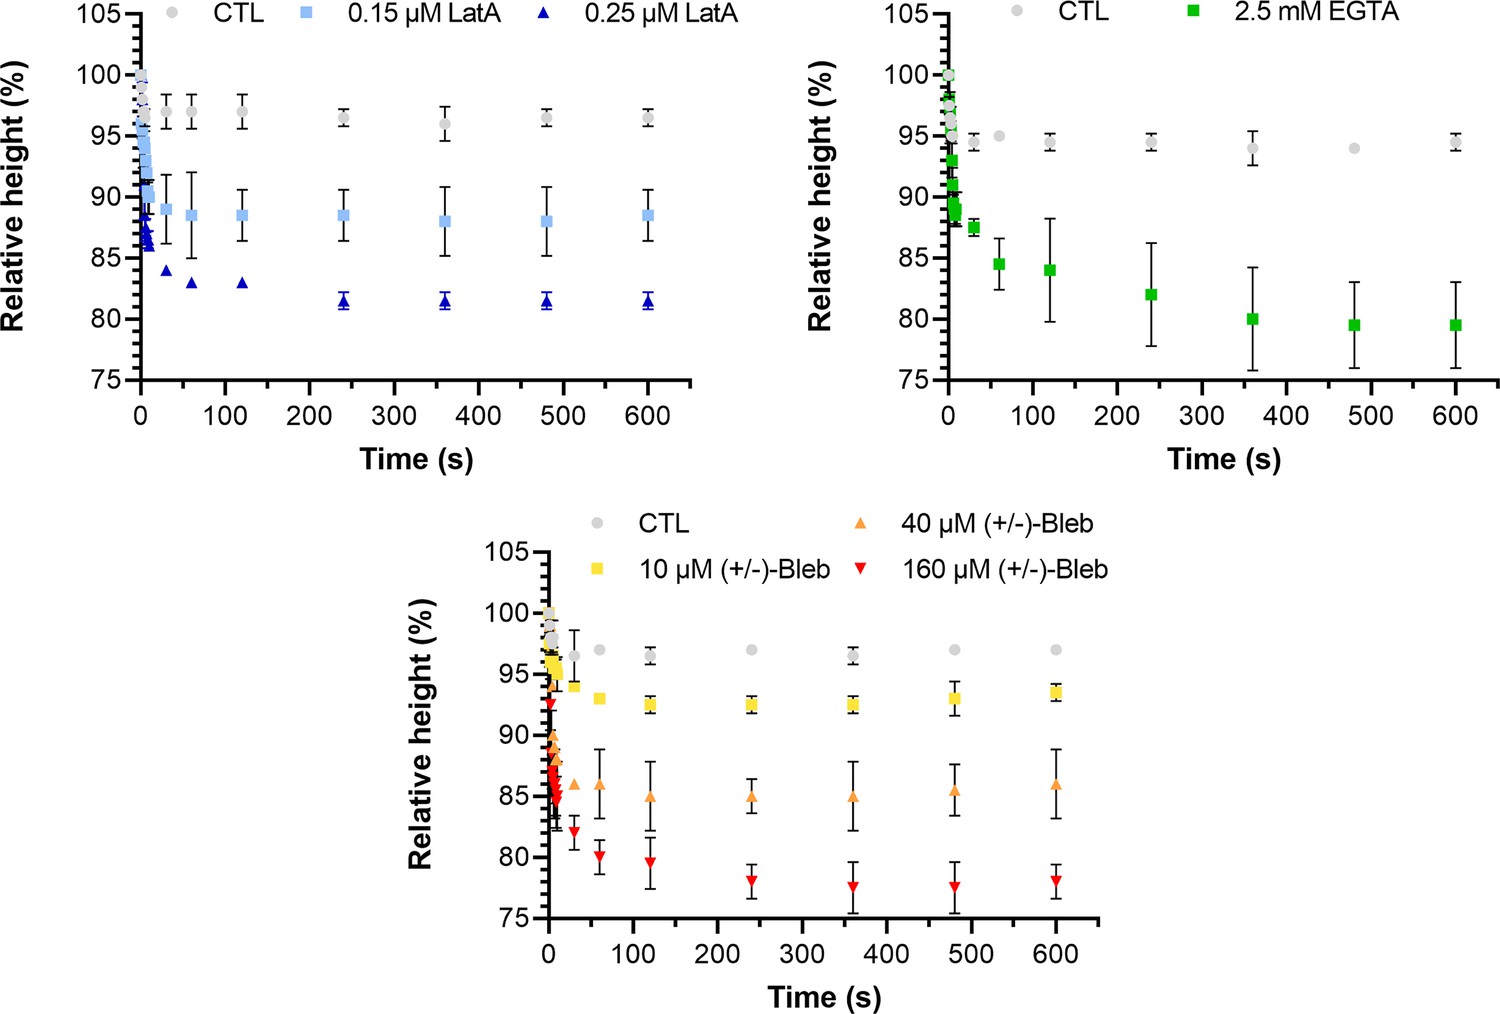
Relative height of the aggregate as a function of time for control, latrunculin A (LatA), EGTA, and (±)-blebbistatin ((±)-Bleb) conditions.
At s, the magnet is approached and the height of the spheroid is monitored over time. After 10 min of flattening, the equilibrium shape is reached and the height of the spheroid remains stable for each condition. Each curve corresponds to at least spheroids. Mean values are represented with respective standard deviations.
-
Figure 1—figure supplement 4—source data 1
Source data of the evolution of the height of multicellular aggregates presented on Figure 1—figure supplement 4.
The dynamic of flattening process is reported for 5 different aggregates.
- https://cdn.elifesciences.org/articles/76409/elife-76409-fig1-figsupp4-data1-v2.xlsx
Figure 2 with 3 supplements

Co-action of cortical tension and intercellular adhesions in multicellular spheroid surface tension and Young’s modulus.
(a, b) Variation of surface tension (a) and Young’s modulus (b) of C2C12 spheroids for 2.5 mM EGTA (calcium chelator), 0.15 µM and 0.25 µM latrunculin A (actin disruptor). Floating bars represent min to max variations, and the midline indicates the median. (c) Representative confocal images of acto-myosin organization for cells at the periphery of an untreated multicellular aggregate. Nuclei (blue), F-actin (red) and phospho-myosin (green) are labelled. Actin and myosin networks mostly colocalize and form a contractile radial organization. Scale bar: 20 µm. (d) Representative confocal image of acto-myosin organization for cells at the periphery of a multicellular aggregate treated with 160 µM (±)-blebbistatin. Nuclei (blue), F-actin (red), and phospho-myosin (green) are labelled. Myosin network is almost disrupted compared to actin network. Scale bar: 20 µm. (e) Representative pictures of C2C12 spheroids under magnetic flattening at equilibrium for (±)-blebbistatin concentration ranging from 0 to 160 µM are given for comparison. Scale bar: 200 µm. Variations of both surface tension (f) and Young’s modulus (g) with (±)-blebbistatin concentrations are reported. Inhibition curves are fitted for the surface tension (red curve) and the Young’s modulus (green curve) with a dose–response providing an value for the (±)-blebbistatin of 10 ± 3 µM and 7 ± 5 µM, respectively, corresponding to an for the (-) active enantiomer of blebbistatin around 6 ± 2 µM and 4 ±3 µM, respectively, as the ratio of the active/negative form is around 50–60%.
-
Figure 2—source data 1
Source data of surface tension and Young’s modulus measurements for control cell aggregates, EGTA, or latrunculin A-treated cell aggregates reported in Figure 2a and b.
Both surface tension and Young’s modulus were extracted from aggregate profiles using TensioX application. Means, medians. and standard deviations were extracted.
- https://cdn.elifesciences.org/articles/76409/elife-76409-fig2-data1-v2.xlsx
-
Figure 2—source data 2
Source data of the surface tension and Young’s modulus measurements for control cell aggregates and blebbistatin-treated cell aggregates reported in Figure 2f and g.
±-Blebbistatin was used at different concentrations. Both surface tension and Young’s modulus were extracted from the aggregates profiles using TensioX application. Means, medians, and standard deviations were extracted for each condition and compared.
- https://cdn.elifesciences.org/articles/76409/elife-76409-fig2-data2-v2.xlsx
Figure 2—figure supplement 1
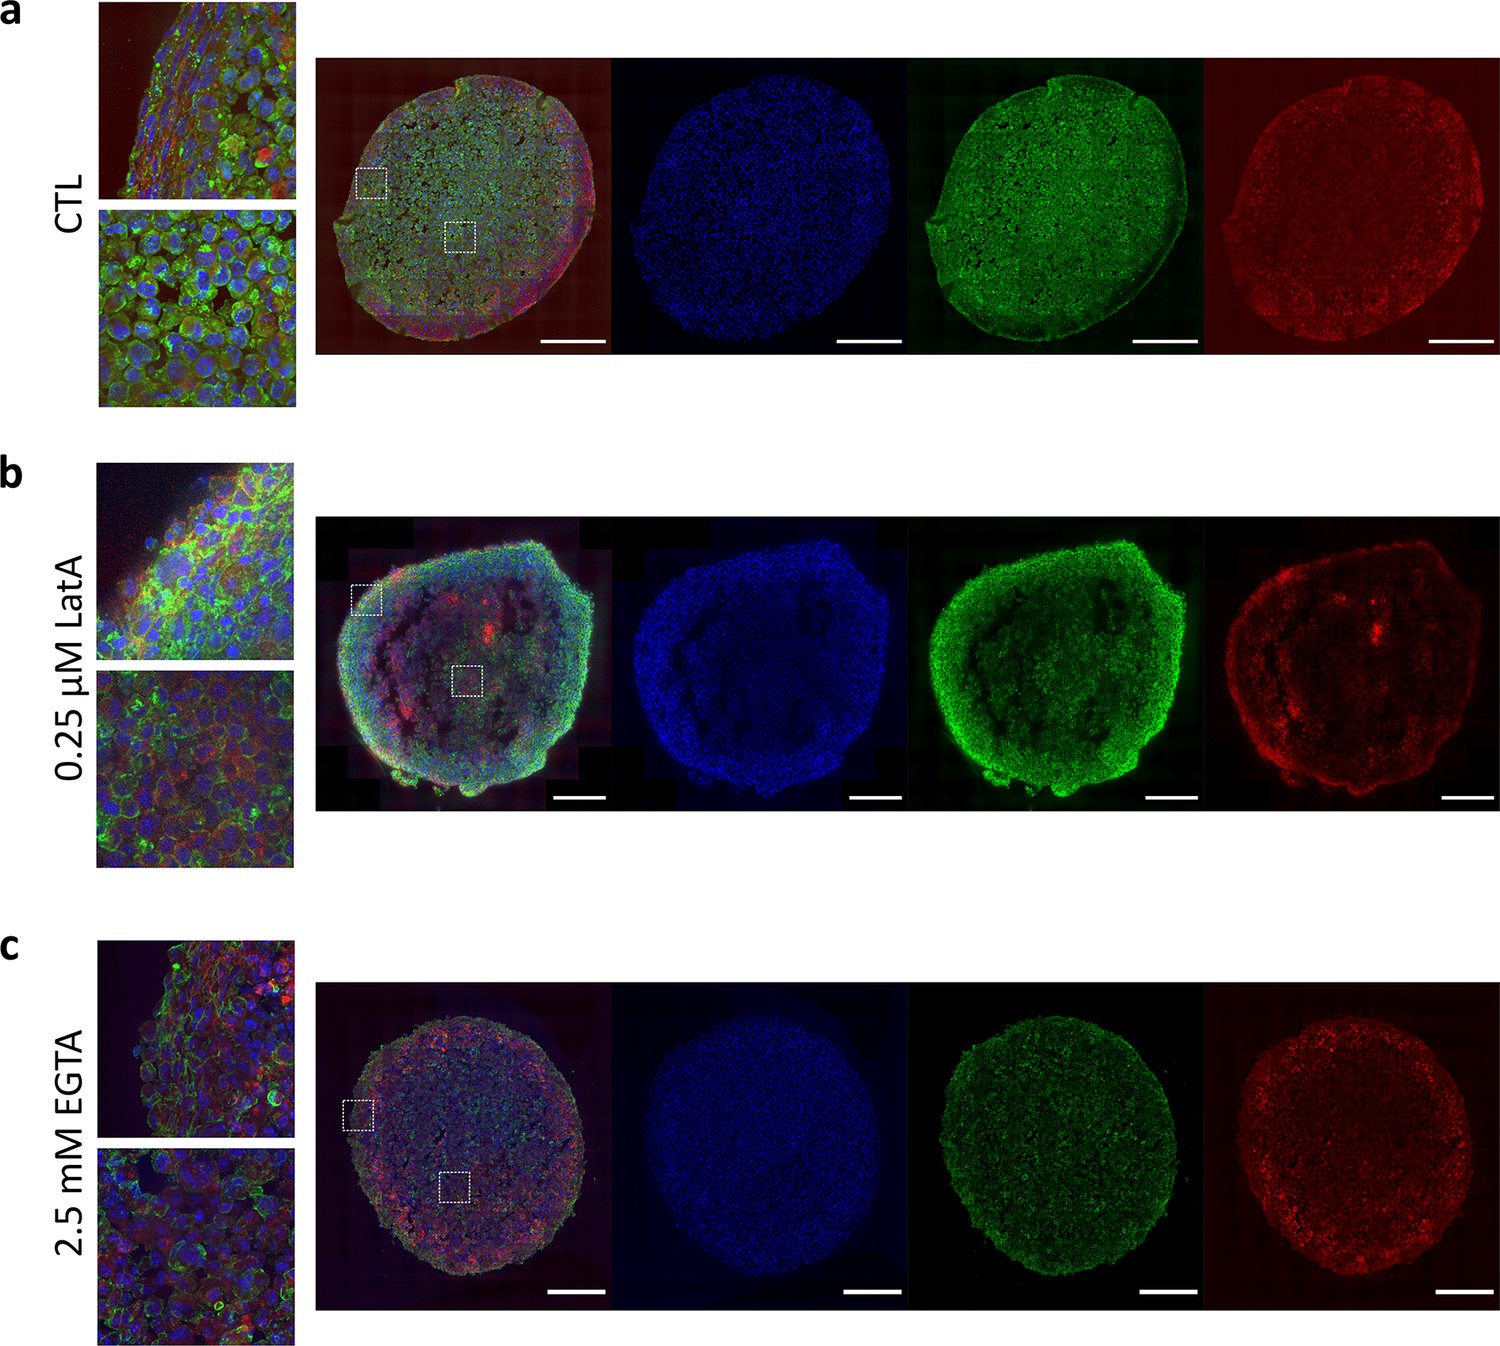
Immunofluorescence images of C2C12 spheroid cryosections for control conditions (a), 0.25 µM latrunculin A (b), and 2.5 mM EGTA (c).
DAPI is shown in blue, pan-cadherins are in green, and F-actin in red. Scale bars: 200 µm and 40 µm for zoomed images.
Figure 2—figure supplement 2
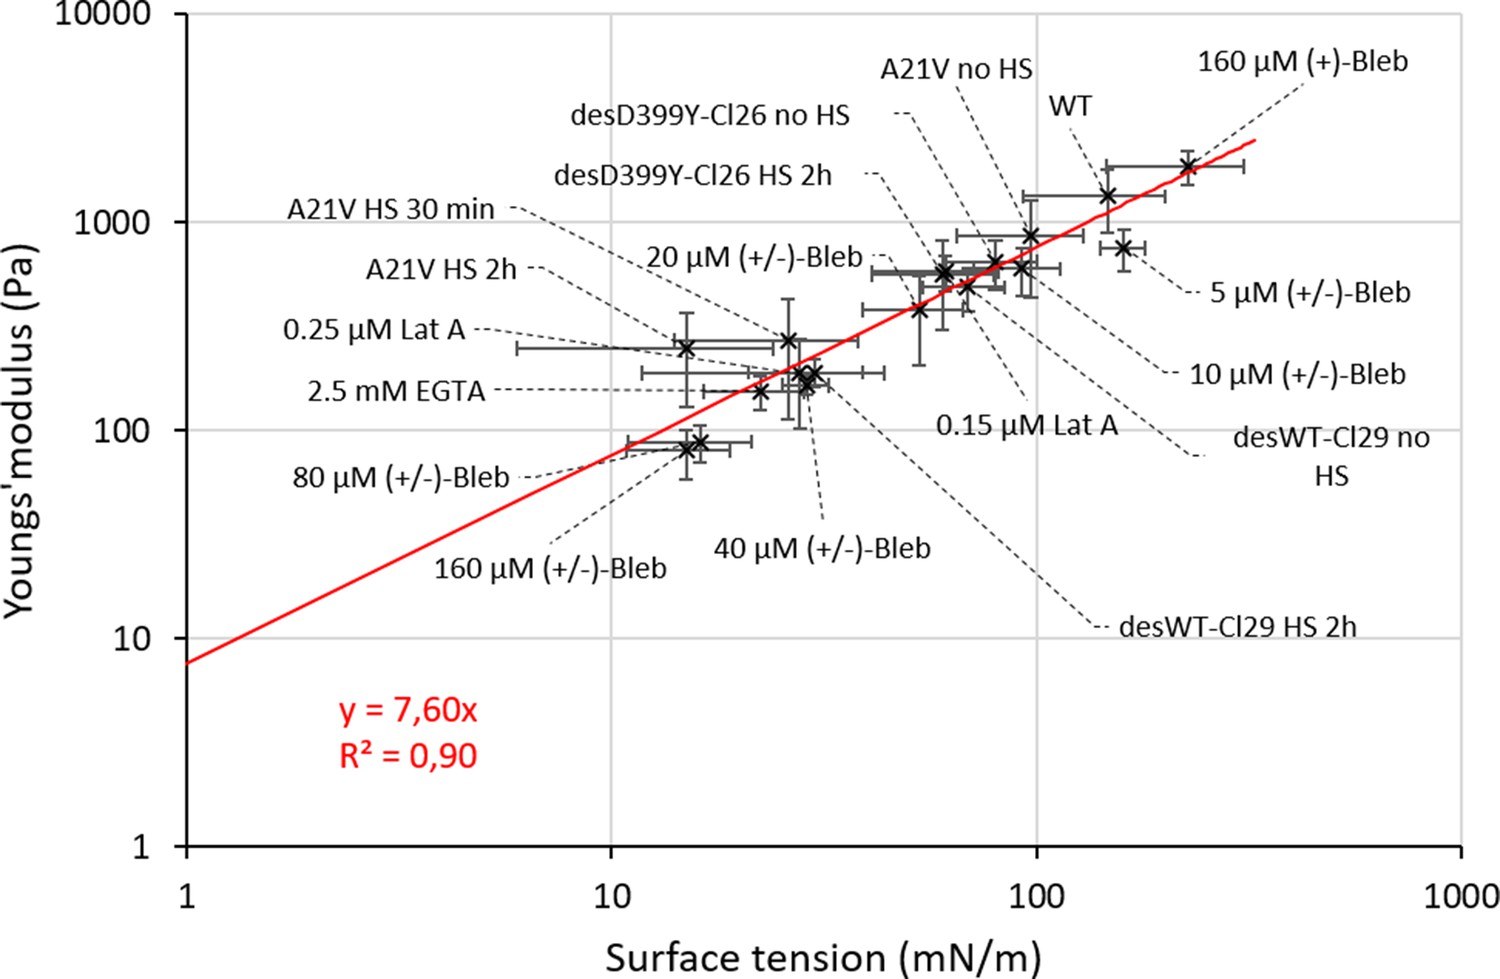
Young’s modulus of C2C12 spheroids as a function of their surface tension.
Young’s modulus and surface tension are proportional across all the conditions tested for C2C12 spheroids. Values are represented in logarithmic scale.
Figure 2—figure supplement 3
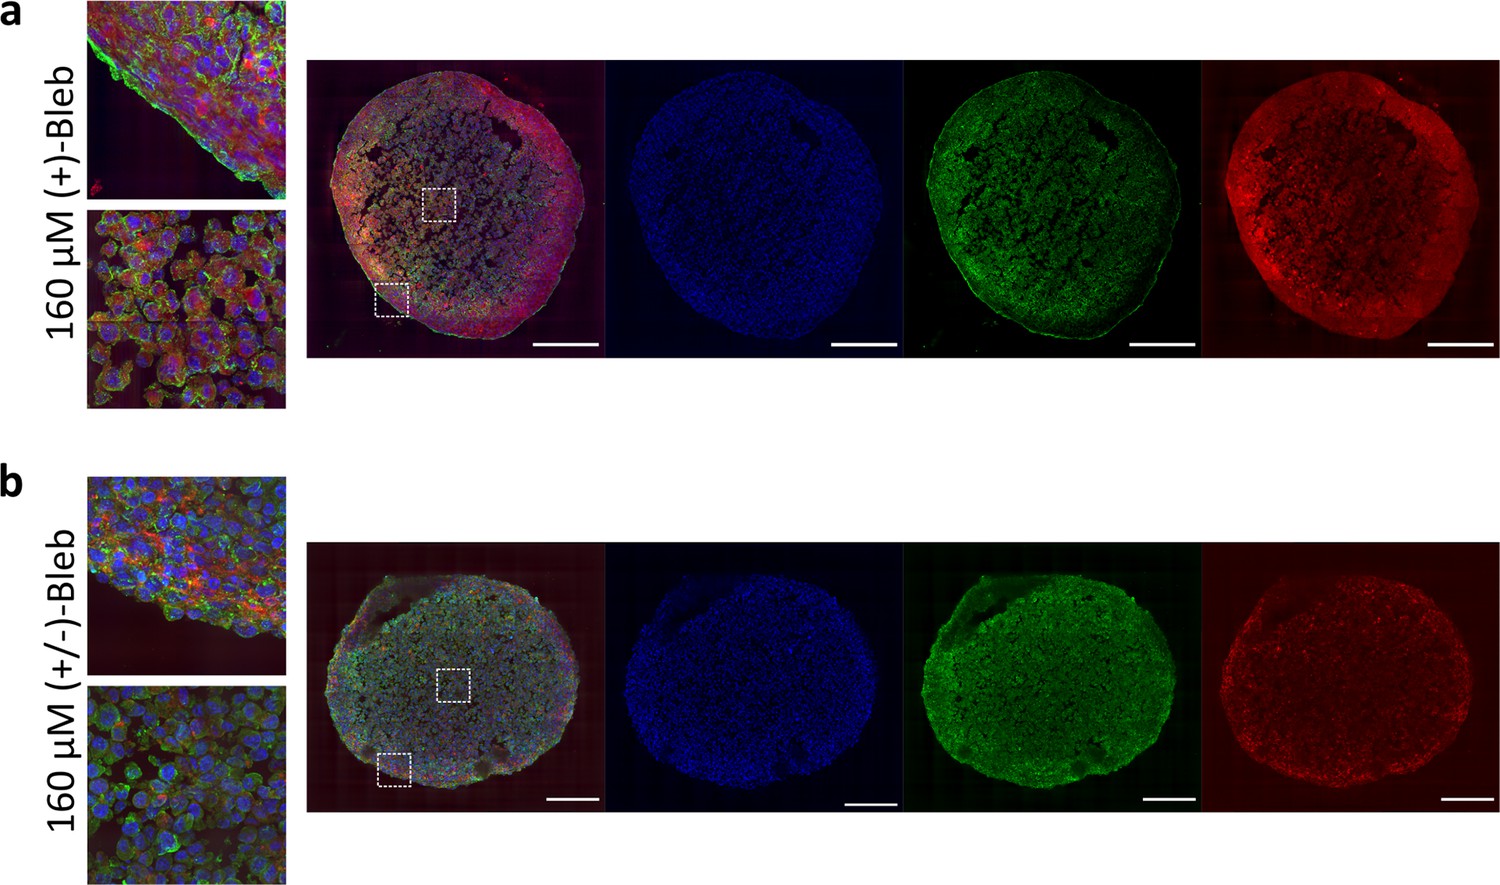
Immunofluorescence images of C2C12 spheroid cryosections for 160 µM (+)-blebbistatin (a) and 160 µM (±)-blebbistatin (b).
DAPI is shown in blue, pan-cadherins are in green, and F-actin in red. Scale bars: 200 µm and 40 µm for zoomed images.
Figure 3 with 1 supplement
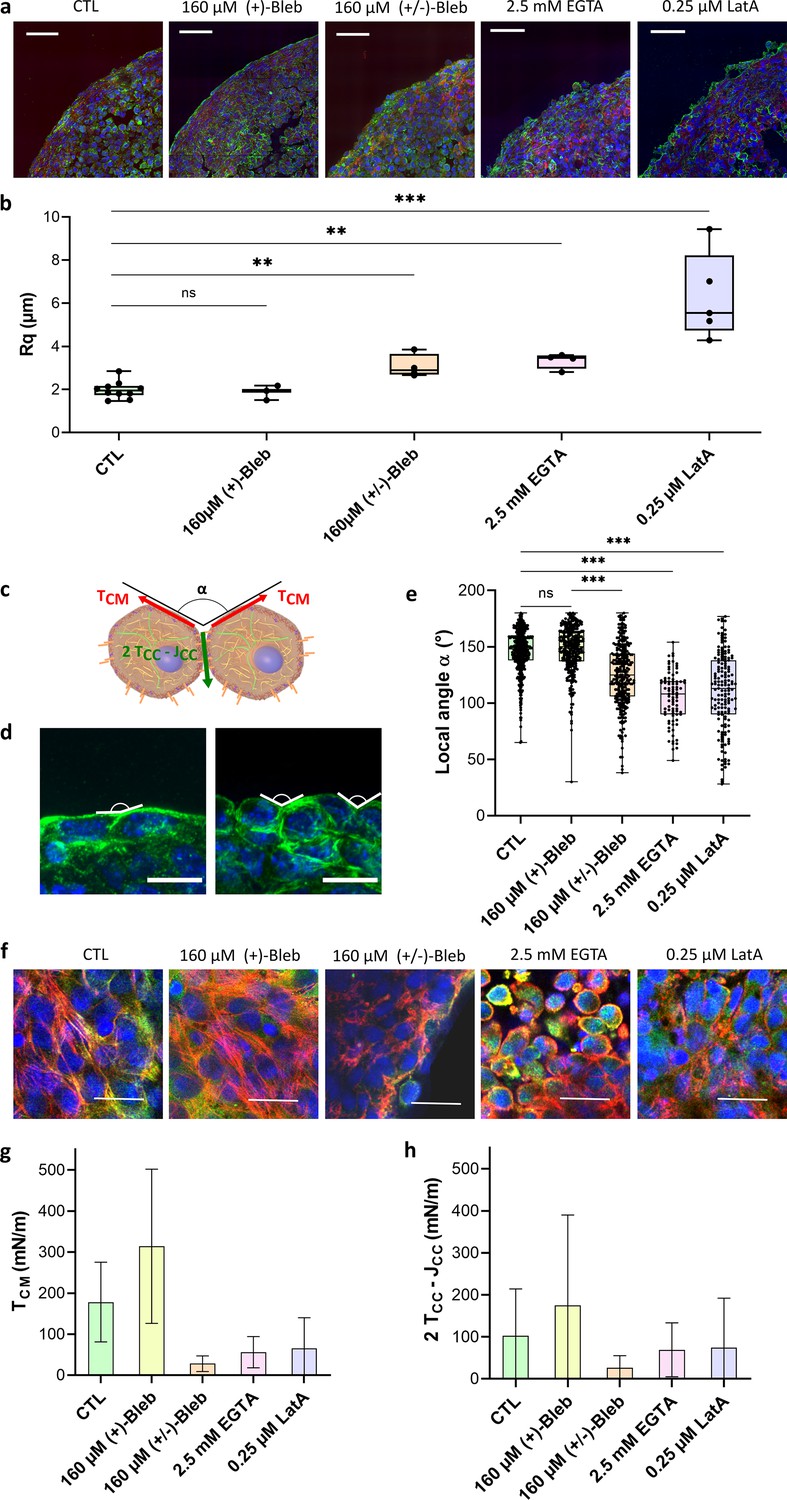
Geometrical analysis of cells at the aggregate surface.
(a) Immunofluorescence images of cryosections of multicellular aggregates obtained by magnetic moulding with different conditions. Control cells are compared to aggregates produced with 160 µM (+)-blebbistatin (inactive enantiomer), 160 µM (±)-blebbistatin (mixture of active and inactive enantiomers), 2.5 mM EGTA or 0.25 µM latrunculin A. DAPI is shown in blue, pan-cadherin in green, and F-actin in red. Scale bar: 50 µm. (b) Profile surface roughness parameter (root-mean-squared) in each condition for at least spheroids. (c) Schematic of two neighbouring cells with a local contact angle and the respective tension at the cell–medium interface and effective tension at the cell–cell contact . (d) Examples of immunofluorescence images of spheroids from which the local angles were measured. Nuclei are shown in blue and pan-cadherin in green. Scale bar: 10 µm. (e) Contact angle between cell surfaces measured in each condition for at least spheroids either on cryosections or 3D aggregates (Figure 3—figure supplement 1). (f) Examples of immunofluorescence images of the upper cells on spheroids obtained with different conditions. Nuclei are shown in blue, actin in red, and phospho-myosin in green. Colocalization of phospho-myosin and actin is in yellow. Scale bar: 25 µm. (g, h) Deduced values of the cell tension at the cell–medium interface (g) and of the effective adhesive tension at the cell–cell contact (h) in each condition.
-
Figure 3—source data 1
Source data of the roughness of imaged multicellular aggregates in various conditions presented in Figure 3a.
Roughness of the different multicellular aggregates was reported and compared. Aggregate contours were first extracted, then the roughness of the contour was calculated. Means, medians, and standard deviations are reported for each condition.
- https://cdn.elifesciences.org/articles/76409/elife-76409-fig3-data1-v2.xlsx
-
Figure 3—source data 2
Source data of the local contact angles and the tension at the cell–medium and the cell–cell interfaces measured on multicellular aggregates in various conditions reported in Figure 3e, g and h.
Local contact angles of cells within an aggregate are manually measured, and the distribution of the local contact angle is given. From the mean surface tension, both tension at the cell–medium and cell–cell medium are deduced.
- https://cdn.elifesciences.org/articles/76409/elife-76409-fig3-data2-v2.xlsx
Figure 3—figure supplement 1
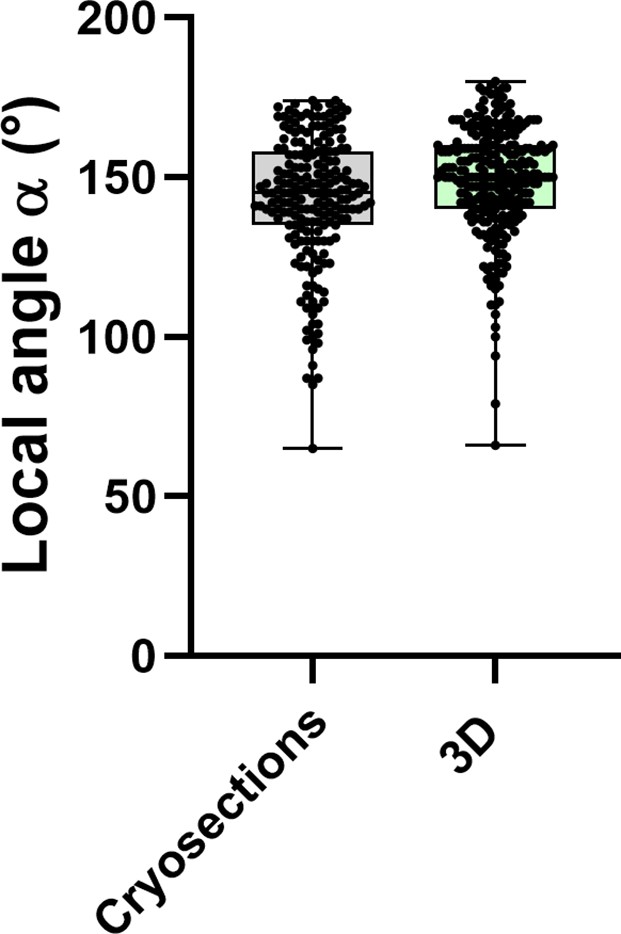
Comparison between local angles measured on spheroid cryosections or 3D images for C2C12 WT spheroids.
Local angles were measured on the surface of the spheroids for spheroids for each type of measurement. Measured angles on cryosections have a median of 145°, and measured angles in 3D images have a median of 150°. This 5° difference is below the measurement error on the local angles.
Figure 4 with 3 supplements
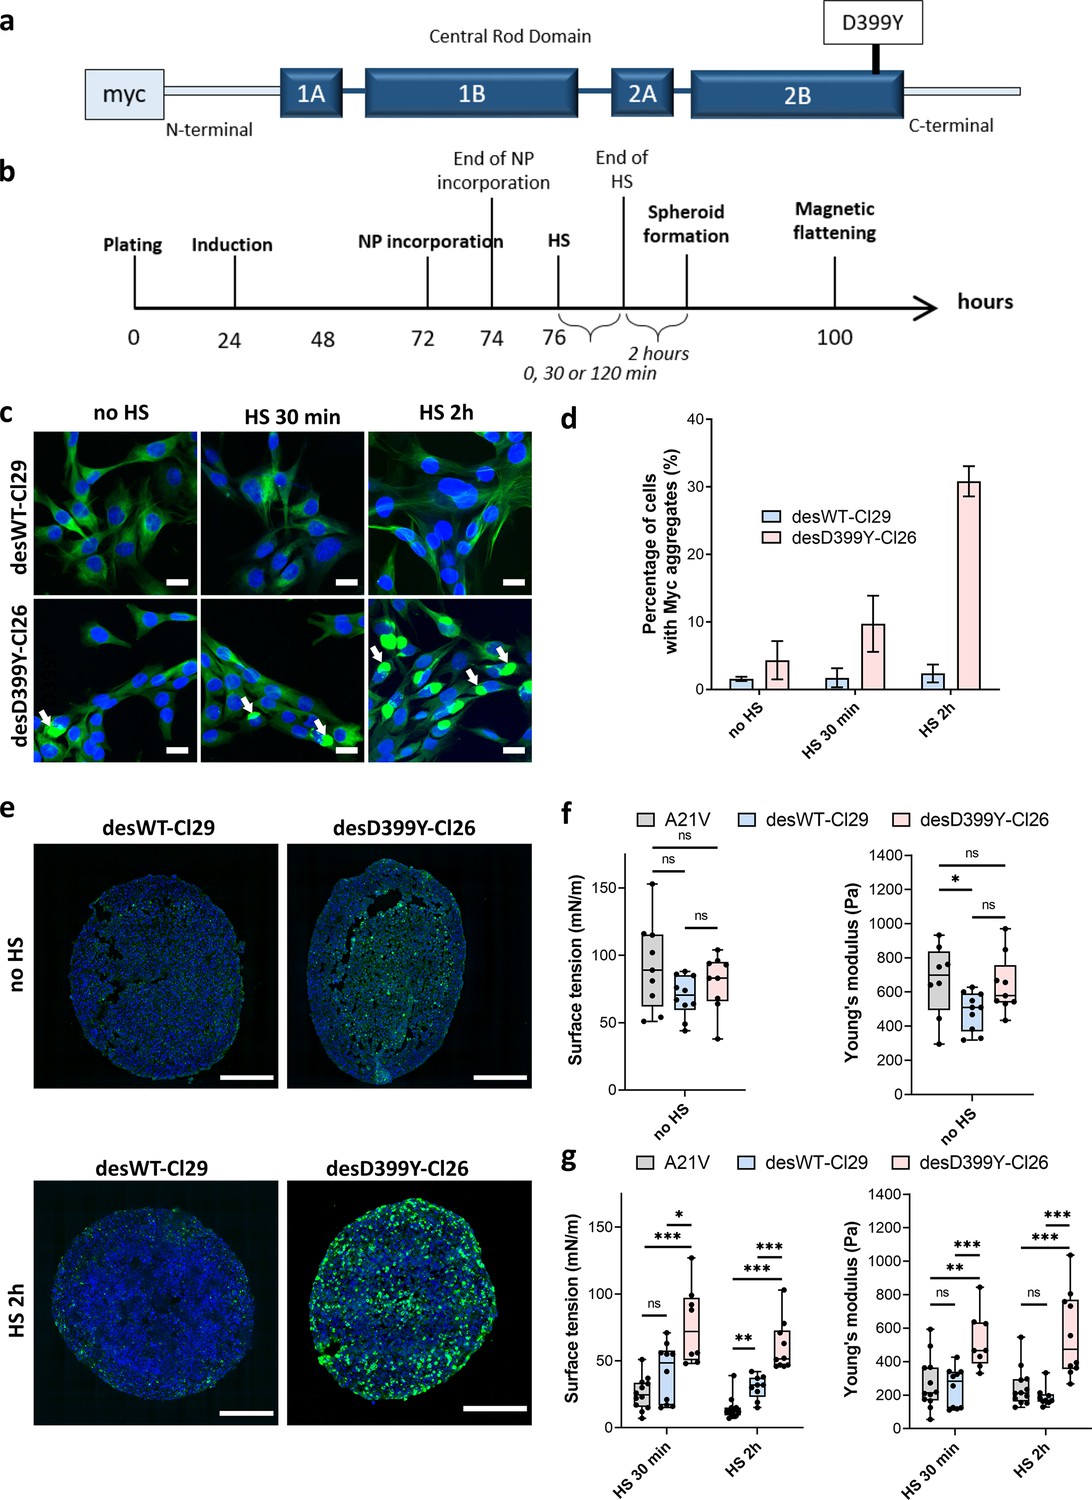
Effect of heat shock (HS) and protein aggregation of desmin on surface tension and Young’s modulus of C2C12 spheroids.
(a) Representation of desmin with the missense mutation D399Y located in Rod Domain. The expressed exogenous mutated desmin is Myc-tagged at the N-terminus (adapted from Figure 1 from Segard et al., 2013). (b) Experimental procedure. Desmin expression was induced 24 hr after cell plating with doxycycline for 48 hr. Magnetically labelled cells (see ‘Methods’) experienced an HS for 0, 30, or 120 min before spheroids were moulded. Spheroid surface tension and Young’s modulus were measured 3 days after expression induction. (c) Immunofluorescence images of desWT-Cl29 (cells stably expressing exogenous desmin WT) and desD399Y-Cl26 cells (cells stably expressing exogenous mutated desmin) in 2D after 0, 30, or 120 min HS. DAPI is shown in blue and the Myc-tag in green. Scale bar: 20 µm. (d) Percentage of cells with desmin protein aggregates for each condition. Desmin protein aggregation increases for desD399Y-Cl26 cells with the duration of the HS while it remains stable around 2% for desWT-Cl29 cells. Mean values represented with respective standard deviations and at least three independent experiments for each condition. (e) Immunofluorescence images of multicellular aggregate cryosections of desWT-Cl29 or desD399Y-Cl26 cells with or without HS. DAPI is visible in blue and the Myc-tag in green. The results are reminiscent of the ones in 2D. DesD399Y-Cl26 spheroids exhibit sparse aggregation without HS, enhanced by 2 hr HS. Scale bar: 200 µm. See Figure 4—figure supplement 2. (f) Surface tension and Young’s modulus of A21V cells (control cells stably transfected with empty vector) spheroids compared with desWT-Cl29 and desD399Y-Cl26 cells to test for the influence of desmin overexpression. (g) Surface tension and Young’s modulus of A21V cells, desWT-Cl29, and desD399Y-Cl26 spheroids with an HS of 0 (no HS), 30 or 120 min. (f, g) At least three independent experiments for each condition and spheroids. Floating bars represent min to max variations, and the midline indicates the median.
-
Figure 4—source data 1
Source data for the surface tension and Young’s modulus measurements of aggregates shown in Figure 4d, f and g.
Both surface tension and Young’s modulus were extracted from the profile of aggregates made of either control A21V, desWT-Cl29, or desD399Y-Cl26 cells using TensioX application. Means, medians, and standard deviations were extracted for each cell type and compared.
- https://cdn.elifesciences.org/articles/76409/elife-76409-fig4-data1-v2.xlsx
Figure 4—figure supplement 1
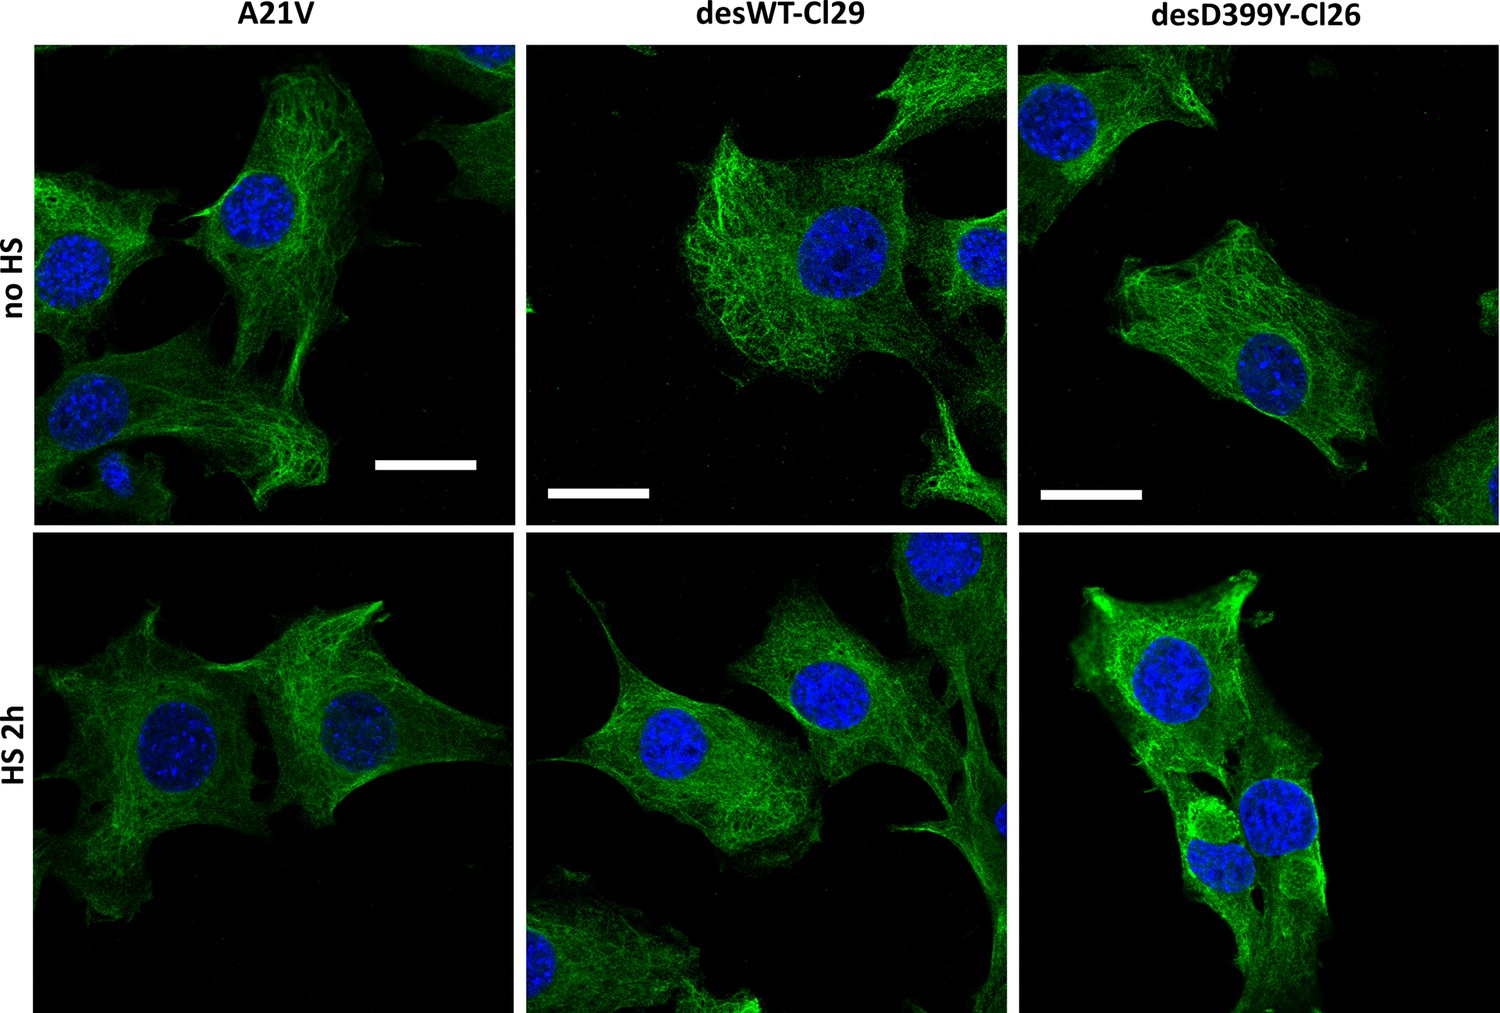
Desmin organization Immunofluorescence images of desmin on adherent cells of control A21V, desWT-Cl29, and desD399Y-Cl26 cell lines for no heat shock (HS) or 2 hr HS.
Hoechst signal (nuclei) is shown in blue, and desmin is shown in green. Scale bar: 20 µm.
Figure 4—figure supplement 2
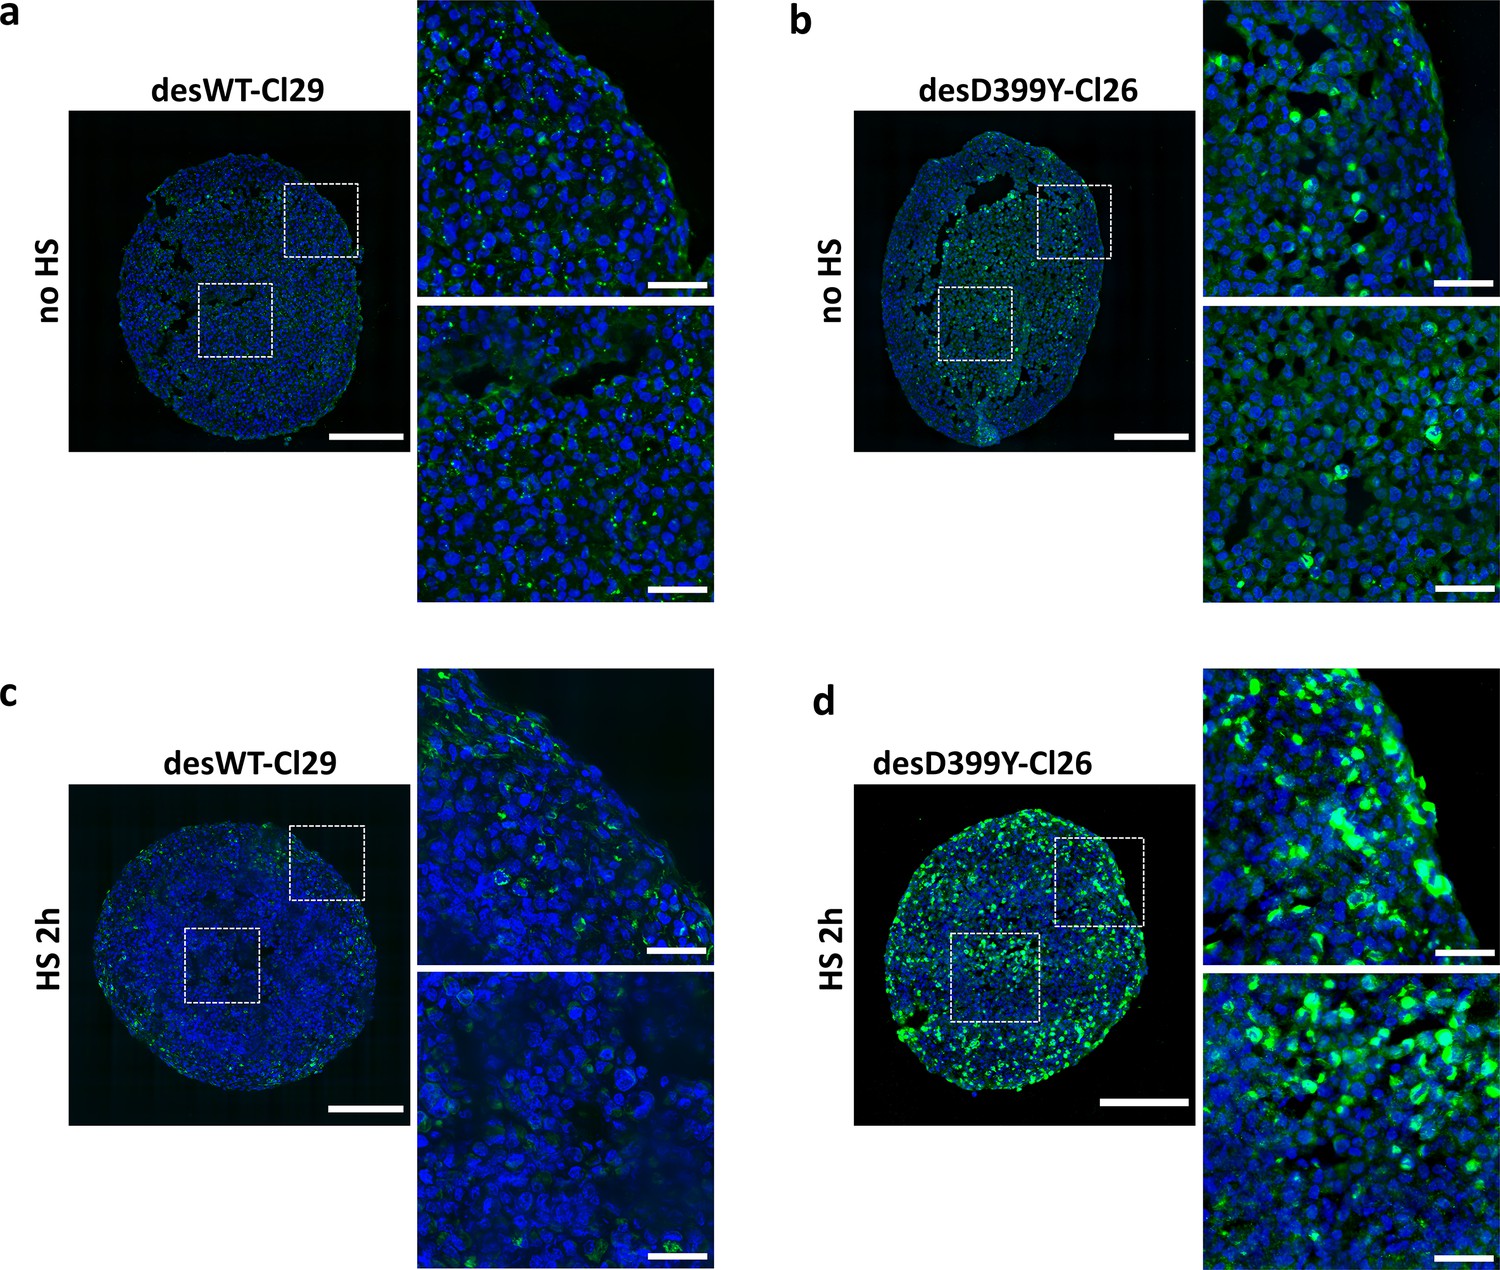
Immunofluorescence images of C2C12 spheroid cryosections of desWT-Cl29 (a, c) and desD399Y-Cl26 cells (b, d) for no heat shock (HS) (a, b) or 2 hr HS (c, d).
DAPI is shown in blue, and Myc is shown in green. Scale bars: 200 µm and 40 µm for zoomed images.
Figure 4—figure supplement 3
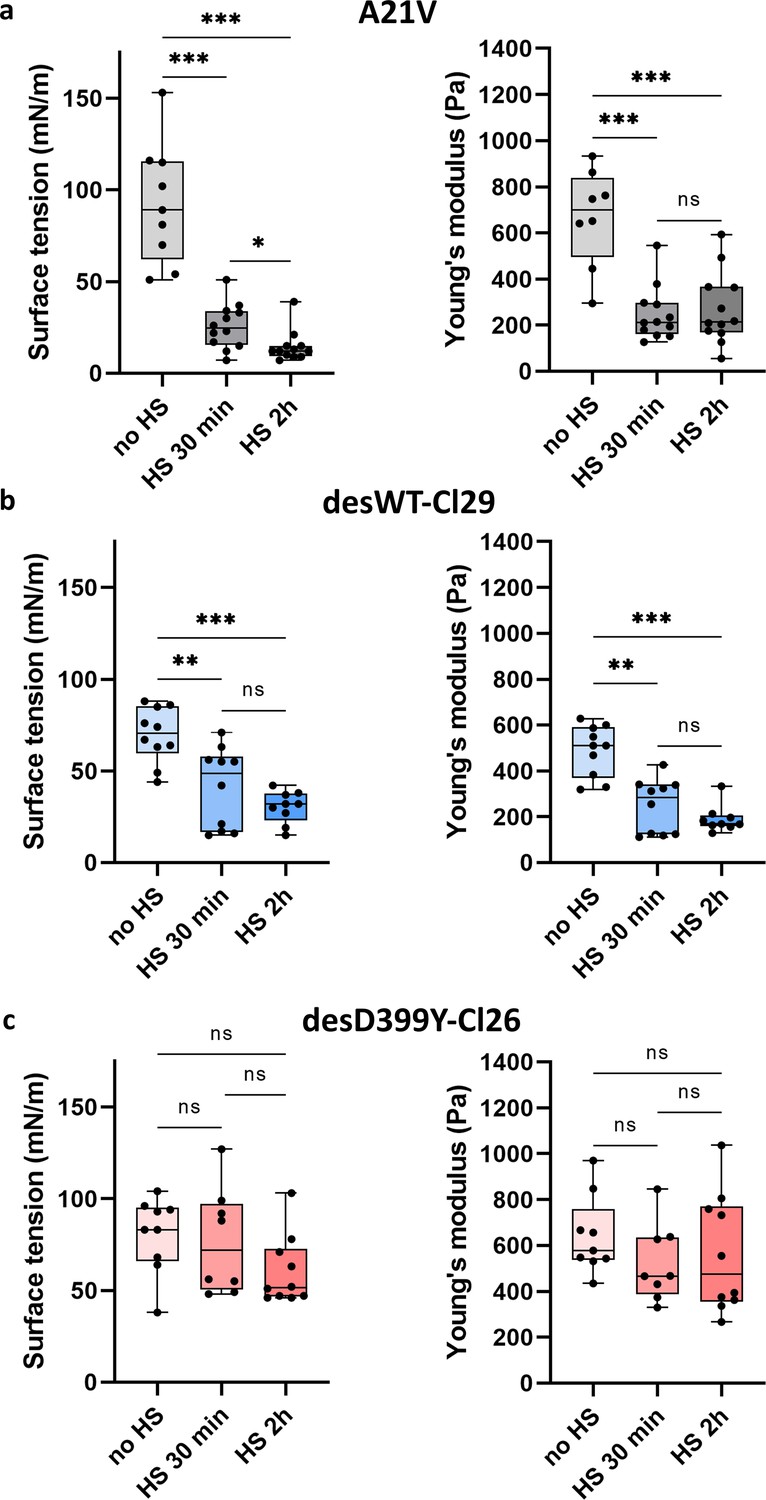
Surface tension and Young’s modulus of A21V spheroids (a), of desWTCl29 spheroids (b) and desD399Y-Cl26 (c) with no heat shock (HS), HS 30 min or HS 2 hr.
Figure 5 with 1 supplement

Geometrical analysis of cells at the aggregate surface for C2C12 A21V, desWT-Cl29, and desD399Y-Cl26 spheroids.
(a) Profile surface roughness parameter Rq (root-mean-squared) in each condition for at least spheroids. (b) Local contact angle between cells at the surface measured in each condition for at least spheroids. (c) Representative confocal images of actin network for the A21V cells at the surface of the multicellular aggregate with or without HS. Nuclei are labelled in blue and F-actin in red. Scale bar: 25 µm. (d) Representative confocal images of phospho-myosin and desmin aggregates distribution for cells at the surface of multicellular aggregates. A21V cells are compared to cells overexpressing desmin (desWT-Cl29 and desD399Y-Cl26) after 2 hr heat shock. Nuclei are labelled in blue, phospho-myosin in green, and desmin aggregates in red. Scale bar: 25 µm. (e, f) Deduced values of the cell tension at the cell–medium interface (f) or of the effective tension at the cell–cell contact (g) in each condition.
-
Figure 5—source data 1
Source data of the roughness of multicellular aggregates for control A21V, desWT-Cl29, and desD399Y-Cl26 cells presented in Figure 5a.
Roughness of the different multicellular aggregates was reported and compared. Aggregate contours were first extracted, then the roughness of the contour was calculated. Means, medians, and standard deviations are reported for each condition.
- https://cdn.elifesciences.org/articles/76409/elife-76409-fig5-data1-v2.xlsx
-
Figure 5—source data 2
Source data of the local contact angles measured for control A21V, desWT-Cl29, and desD399Y-Cl26 cells presented in Figure 5b, e and f.
Local contact angles of cells within an aggregate are manually measured, and the distribution of the measured local contact angles is given. From the mean surface tension, both tension at the cell–medium and cell–cell medium are deduced for each cell type.
- https://cdn.elifesciences.org/articles/76409/elife-76409-fig5-data2-v2.xlsx
Figure 5—figure supplement 1
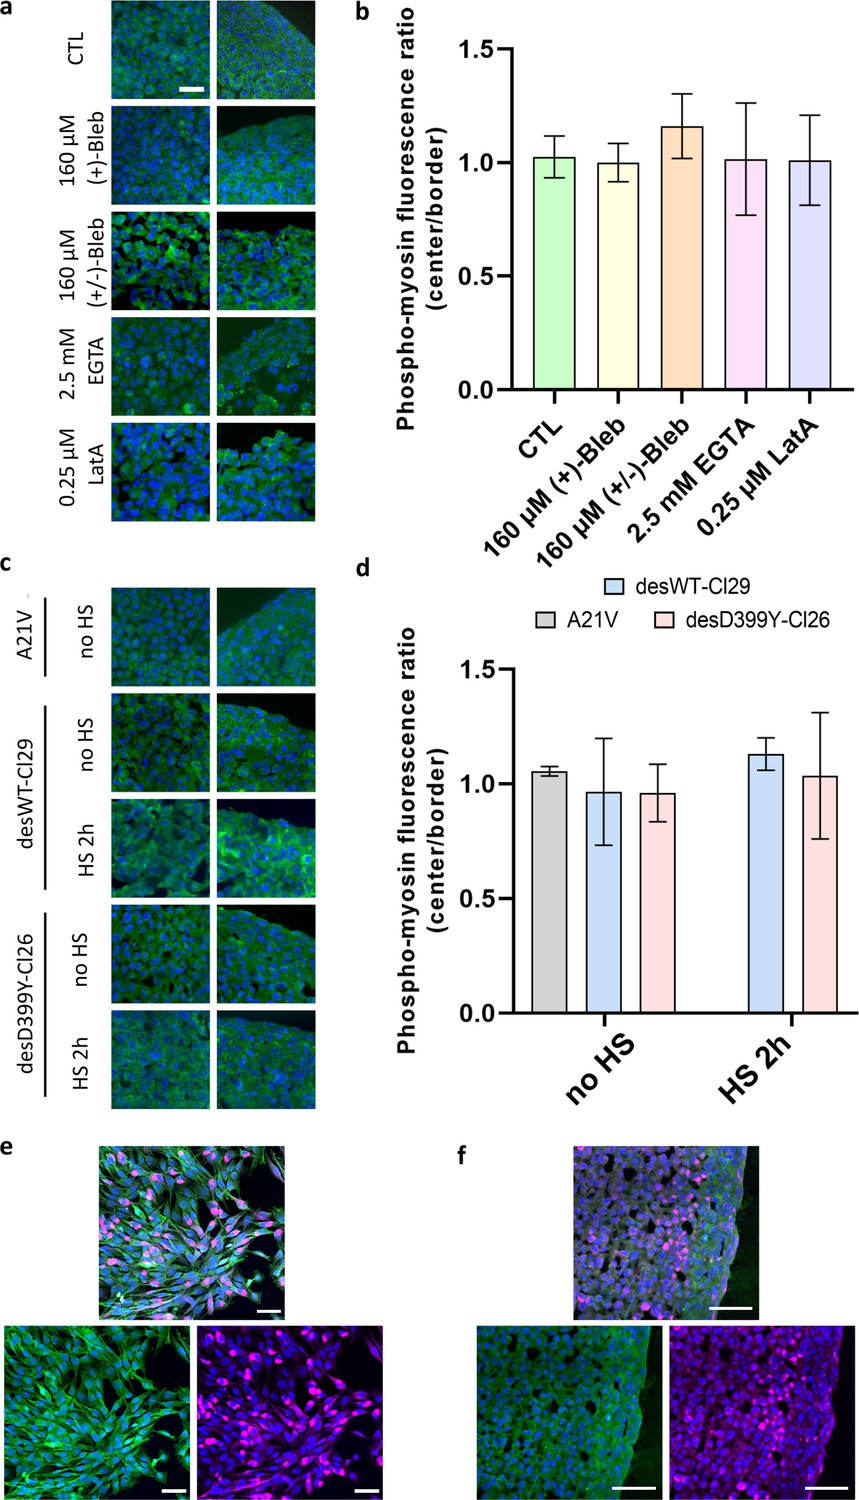
Quantification of phospho-myosin distribution in the spheroids.
(a–c) Immunofluorescence images of C2C12 WT (a) or A21V, desWT-Cl29, and desD399Y-Cl26 (c) spheroid cryosections in the different experimental conditions. Nuclei are shown in blue, and phospho-myosin is shown in green. Scale bar: 25 µm. (b–d) Quantification of phospho-myosin distribution between the centre and border of the spheroids. Ratio between the phospho-myosin fluorescence normalized by the number of nuclei at the centre and border of the spheroid for C2C12 WT (b) or A21V, desWT-Cl29, and desD399Y-Cl26 (d). For all experimental conditions, the ratio is around 1 evidencing a uniform distribution of phospho-myosin across the spheroid. (e, f) Immunofluorescence images of desCl26-D399Y after 2 hr heat shock (HS) in 2D (e) or in 3D (spheroid cryosection) (f). Nuclei, phospho-myosin, and exogenous desmin (Myc) are labelled in blue, green, and magenta, respectively. No increase in phospho-myosin fluorescence intensity is observed in 2D or 3D at the location of the desmin aggregates. Scale bars: 50 µm.
Figure 6
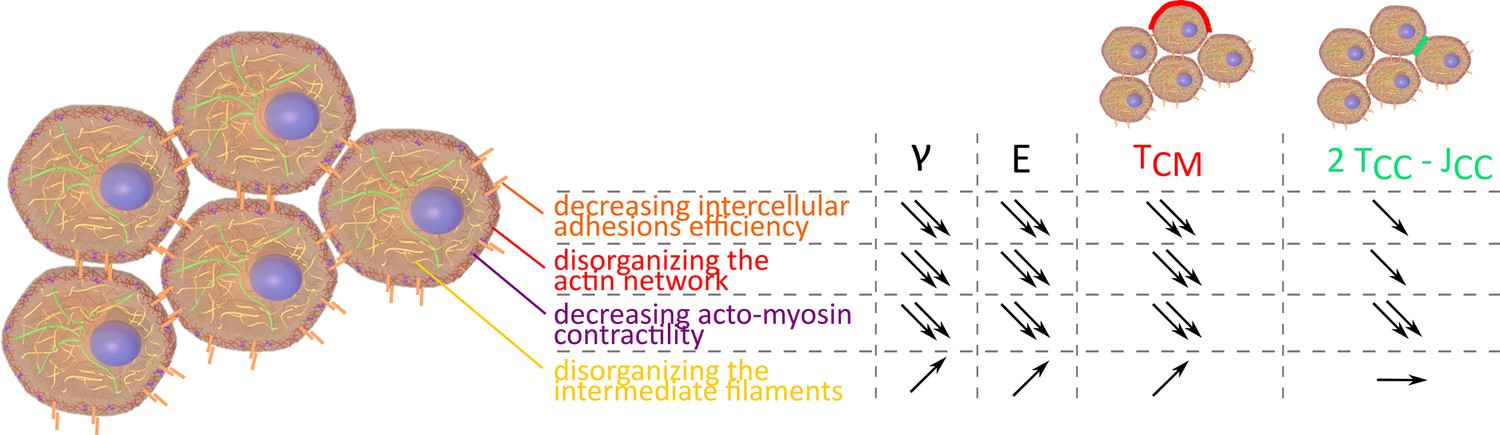
Evolution of , E, , and 2 depending on intercellular adhesions, actin network, acto-myosin contractility, and intermediate filaments.
Additional files
Download links
A two-part list of links to download the article, or parts of the article, in various formats.
Downloads (link to download the article as PDF)
Open citations (links to open the citations from this article in various online reference manager services)
Cite this article (links to download the citations from this article in formats compatible with various reference manager tools)
The importance of intermediate filaments in the shape maintenance of myoblast model tissues
eLife 11:e76409.
https://doi.org/10.7554/eLife.76409


