Probe-free optical chromatin deformation and measurement of differential mechanical properties in the nucleus
- Max Planck Institute of Molecular Cell Biology and Genetics, Germany
- Centre for Systems Biology, Germany
- Institute of Biological and Chemical Systems-Biological Information Processing, Karlsruhe Institute of Technology, Germany
Figures
Figure 1 with 3 supplements
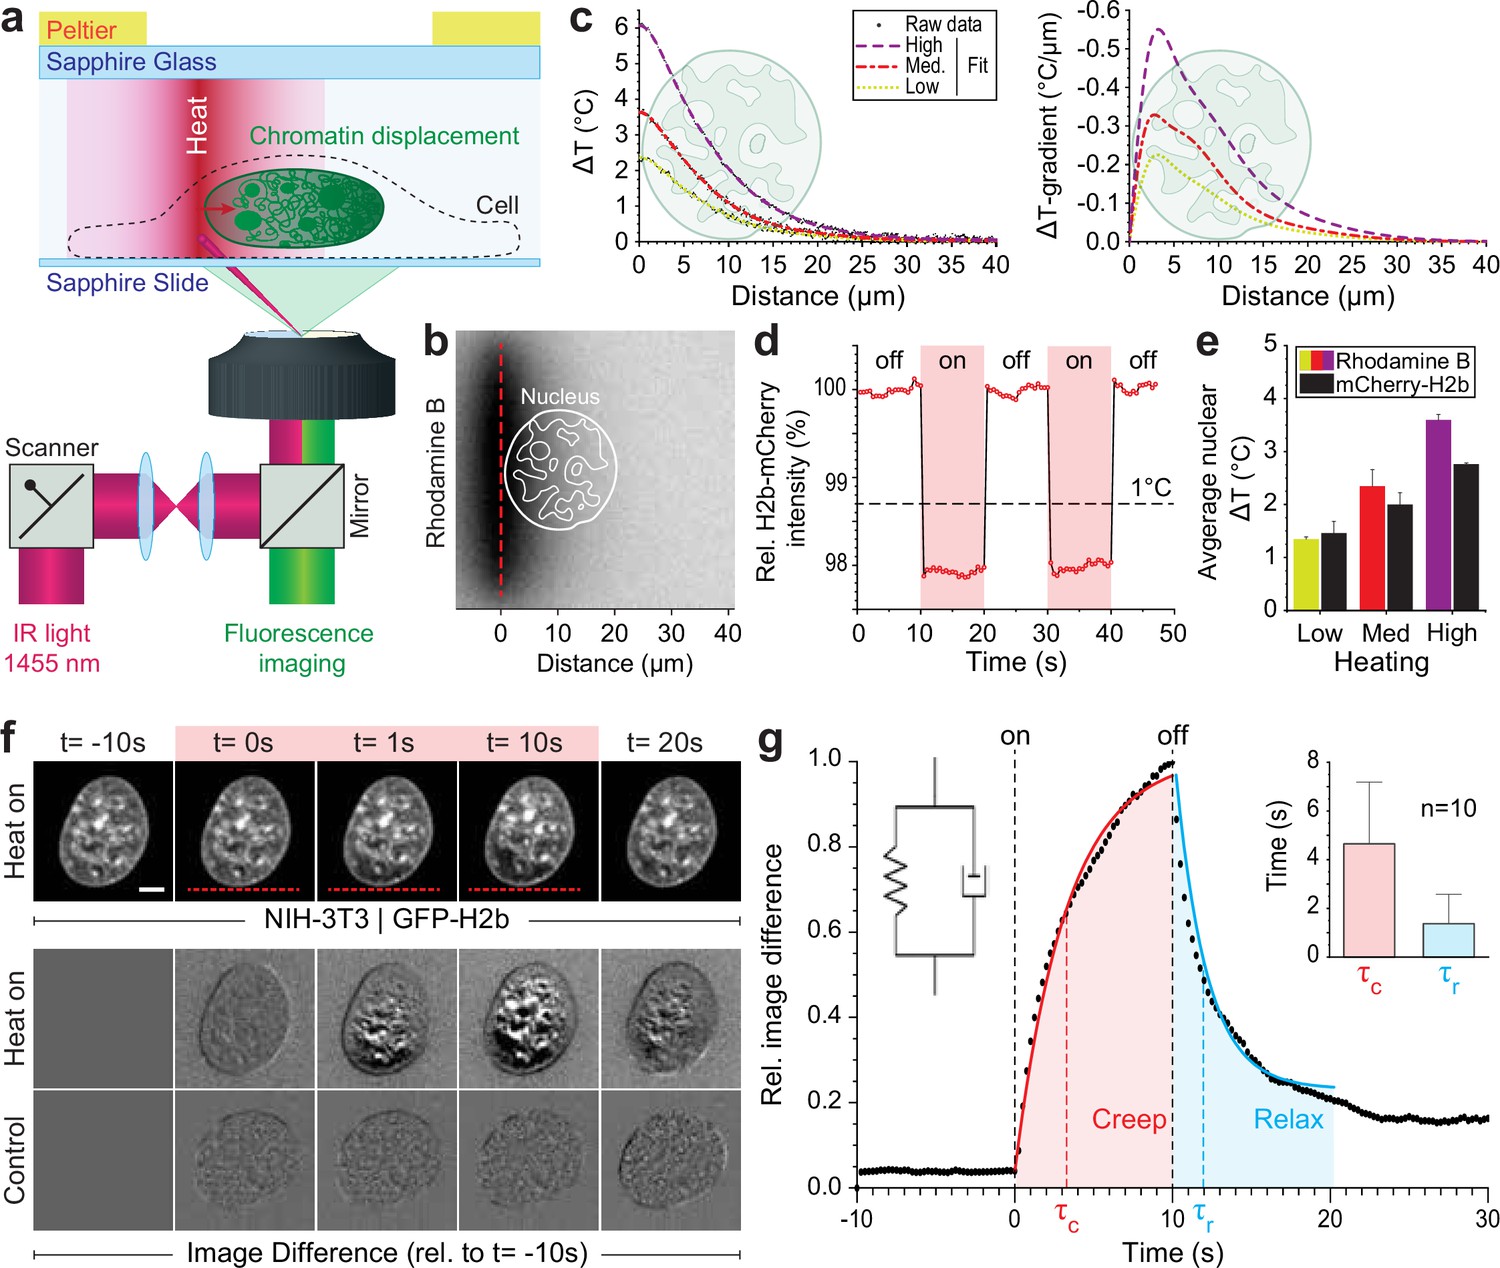
Engineered temperature gradients facilitate controlled chromatin deformation in living cells.
(a) Overview of the microscopy setup. An IR laser is scanned along a line to generate a temperature gradient perpendicular to the scanning line. Cells are cultured in temperature chambers that maintain a reservoir temperature of 36°C via Peltier elements. Sapphire, rather than glass, was used due to its high heat transfer coefficient. Shown is the side view of chamber. (b) The temperature-sensitive dye rhodamine B can be used to visualize temperature gradients during laser scanning. The red dotted line indicates the laser scan path and outlines of an average size nucleus are superimposed in white. (c) Temperature profile and gradient were quantified perpendicular to the laser scan path via rhodamine B for three different laser intensities (low, medium, and high). Raw data of temperature measurements were fitted and differentiated to achieve noise-robust estimates of the temperature gradients. See Figure 1—figure supplement 1 for dye calibration. (d) Confirmation of instantaneous temperature changes inside the nucleus, at low laser intensity, via relative quantum efficiency measurements of mCherry-H2b, which reduces ~1.3% for each 1°C heating. See Figure 1—figure supplement 1 for calibration. (e) Comparison of thermometry results measured inside the nucleus via mCherry-H2b and inside the chamber via rhodamine B. Chamber temperature was averaged along 20 μm, reflecting the average size of a nucleus, to compare both measurements directly; n=5, error = STD. (f) Top: Response of NIH-3T3 nuclei to an applied temperature gradient at medium laser intensity. Bottom: Image difference analysis of the same data and controls, indicating mesoscopic, partially reversible chromatin displacements due to temperature stimulation; scale = 5 µm. See also Figure 1—videos 1; 2. (g) Temporal analysis of image differences shows that chromatin rearrangements follow a simple viscoelastic material model by Kelvin-Voigt (inset), and have characteristic times (τc - creep or retardation time, τr - relaxation time) on the time scale of seconds; n=10, error = STD. The Kelvin-Voigt model consists of a purely elastic spring and a purely viscous dashpot arranged in parallel, with uniform distribution of strain. There is no possibility for the spring and dashpot to expand independently leading to a typical creep-recovery response.
Figure 1—figure supplement 1
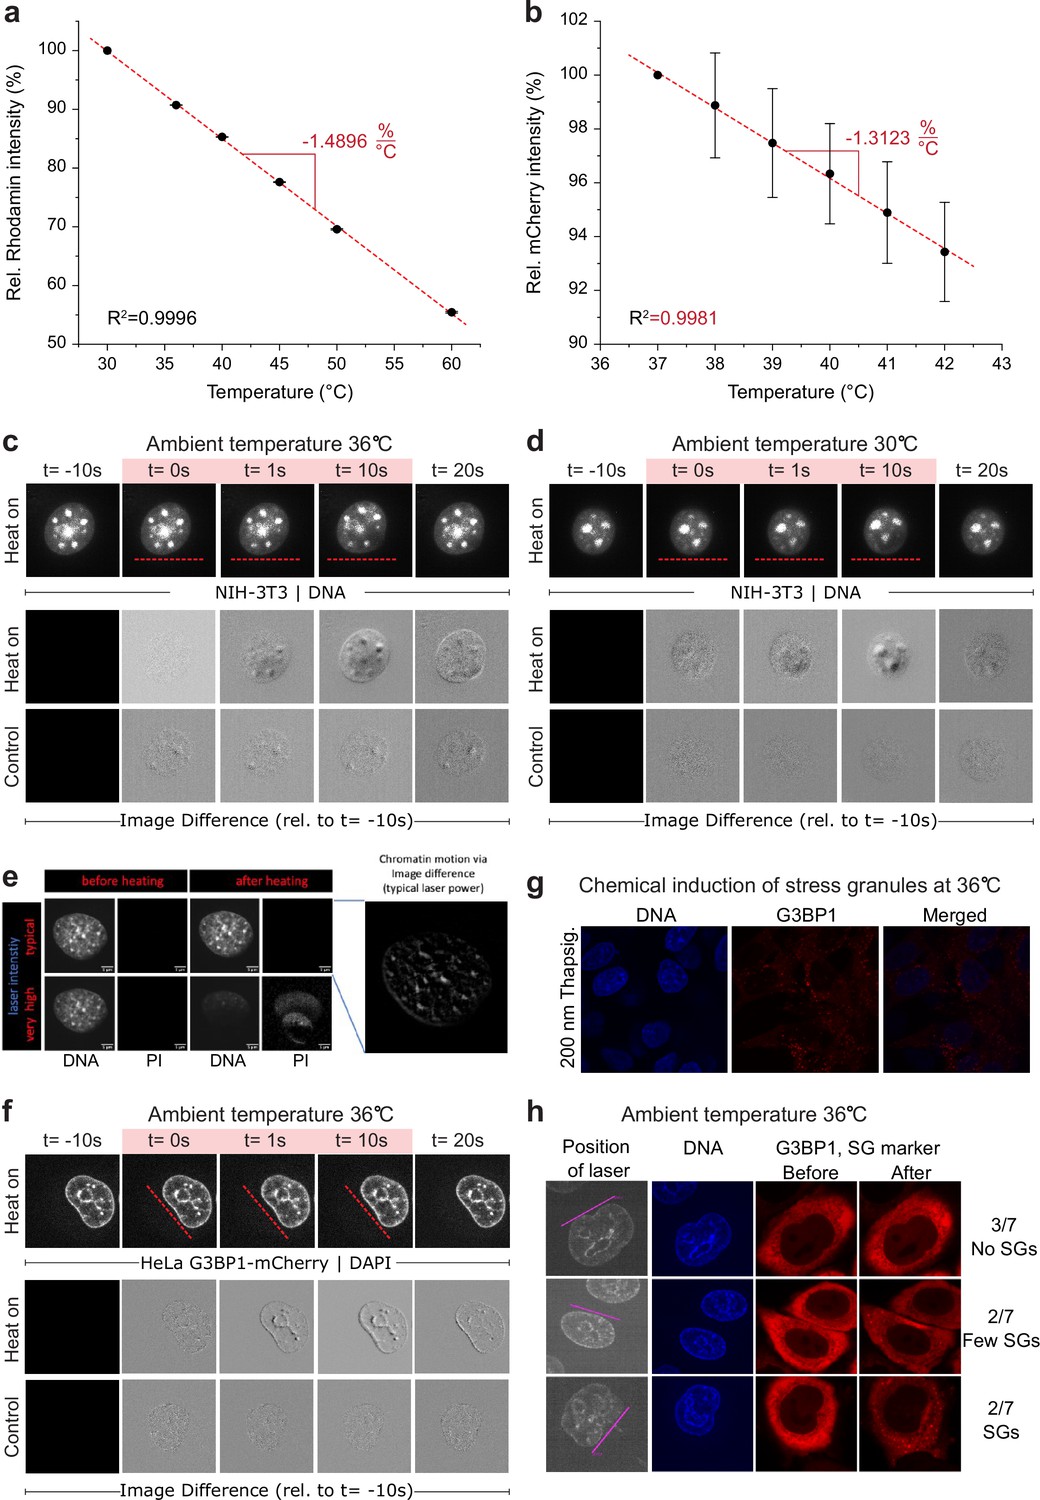
Calibration of dyes for temperature measurements, temperature impact, cell viability, and stress response.
(a and b) Quantum efficiency (relative intensity) of (a) rhodamine and (b) mCherry was measured at different temperatures via the same temperature incubation chamber used for live cell experiments; n=5, error = STD. (c and d) Chromatin displacement is induced by the temperature gradient, not by elevated temperatures above 36°C. Response of NIH-3T3 nuclei to an applied temperature gradient at medium laser intensity, performed at an ambient temperature of (c) 36°C and (d) 30°C. Usual chromatin displacements were seen at both temperatures. As routinely performed and described in Figure 1 and Materials and methods, with the difference that, in order to visualize chromatin, cells were not transfected with labeled H2b, but stained with Hoechst33342, 15 min before the experiment. Top: Recorded image frames. Bottom: Image difference analysis of laser (red line) induced chromatin movement and control without laser. (e) Impact of laser heating on propidium iodide (PI) uptake of NIH-3T3 cells. At typical laser powers, sufficient to cause chromatin deformation (right hand side), no PI uptake is visible (upper row). At very high laser powers, approximately four times higher, which were used as positive control, PI uptake starts to be visible (lower row). DNA was stained with Hoechst33342 which was given to the cells 15 min before the experiment. (f) As (c) but with HeLa cells stably expressing G3BP1-mCherry. Chromatin displacement after laser stimulus similar to NIH-3T3 cells. (g) Chemical induction of stress granules (SGs) in HeLa cells stably expressing G3BP1-mCherry. Before mounting, cells were treated with 200 nM thapsigargin for 45 min. Cells were imaged immediately after mounting with no laser stimulus. DNA was stained with Hoechst33342 which was given to the cells 15 min before mounting. (h) Varying SG formation 15 min after laser stimulus. Near half of the cells did not form SGs after laser stimulus, suggesting that the occasional appearance of SGs after the laser stimulus is a consequence of combined stresses, e.g., from mounting and imaging in addition to the laser stimulus.
Figure 1—video 1
Video microscopy of temperature stimulated and control nuclei, corresponding to image difference analysis in Figure 1.
GFP-H2b transfected NIH-3T3 cells were recorded during stimulation with a temperature gradient, placed along the bottom of the nucleus (Figure 1—video 1), or without stimulation (Figure 1—video 2). Recorded at 4 fps, shown at 4× real time (16 fps). Stimulation for 10 s.
Figure 1—video 2
Video microscopy of temperature stimulated and control nuclei, corresponding to image difference analysis in Figure 1.
GFP-H2b transfected NIH-3T3 cells were recorded during stimulation with a temperature gradient, placed along the bottom of the nucleus (Figure 1—video 1), or without stimulation (Figure 1—video 2). Recorded at 4 fps, shown at 4× real time (16 fps). Stimulation for 10 s.
Figure 2 with 1 supplement

Quantification of intra-nuclear chromatins displacement and absence of changes in nuclear shape during temperature stimulation.
(a) Chromatin displacement over time during 10 s temperature stimulation experiments in NIH-3T3 nuclei expressing H2b-GFP; scale = 5 µm. (b–c) Detailed view of one chromatin void feature. Kymograph analysis quantifying time and length scale shows largely reversible motion on the order of microns; scale = 5 µm. (d–e) Segmentation and tracking of intra-nuclear features show their gradual, heterogenous displacements of up to 2 µm, while nuclear area remains largely constant. See also Figure 2—video 1; scale = 5 µm. (f) Close-up view of the linearized nuclear border of the nucleus shown in (d) further indicates that the border remains static during and after temperature stimulation; scale = 5 µm. (g) Quantification of the distance of the nuclear border, with respect to the nuclear center at t=0 s, of the nucleus shown in (d) reveals that the distortions of the nuclear shape are less than 200 nm during temperature stimulation.
Figure 2—video 1
Video microscopy of temperature stimulated nuclei, corresponding to feature tracking analysis in Figure 2.
A GFP-H2b transfected NIH-3T3 cell was recorded during stimulation with a temperature gradient placed along the bottom of the nucleus. Recorded at 4 fps, shown at 4× real time (16 fps). Stimulation for 10 s.
Figure 3 with 1 supplement
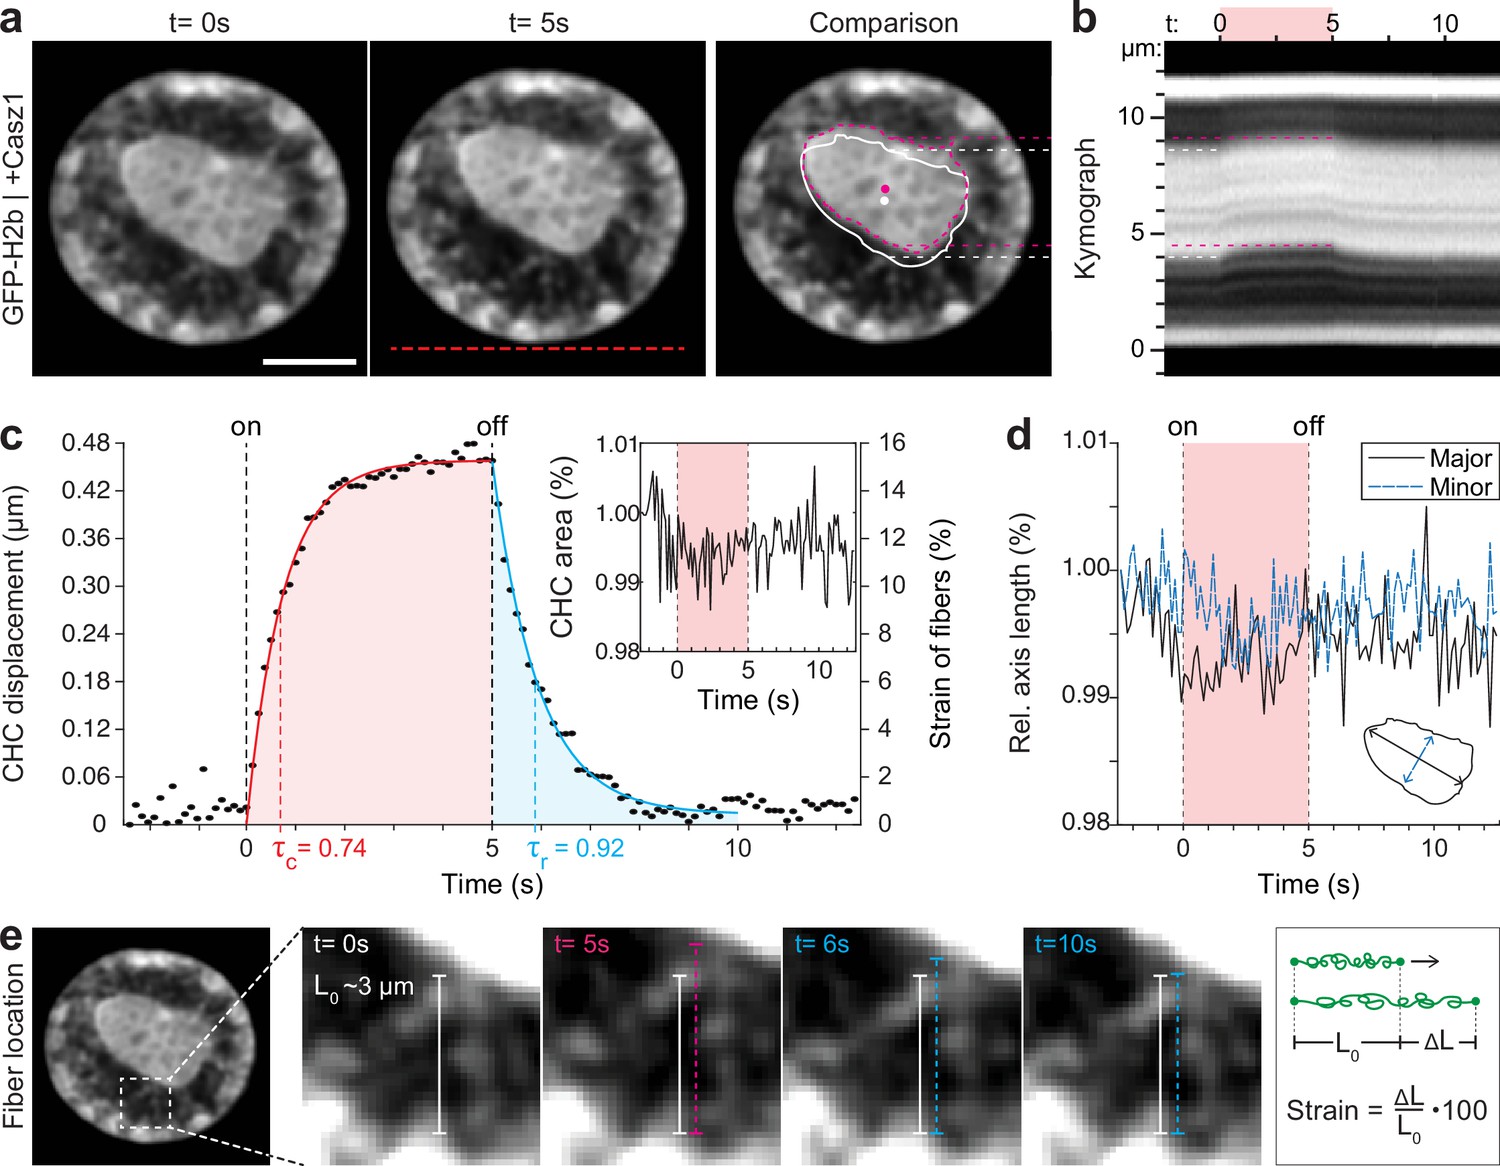
Quantification of movement and shape changes of centrally compacted chromatin during temperature stimulation in a genetically induced nuclear inversion model.
(a) NIH-3T3 cells expressing H2b-GFP displayed an inverted chromatin organization after transfection with Casz1. The resulting central heterochromatin cluster (CHC) shows a significant displacement during temperature stimulation. See also Figure 3—video 1; scale = 5 µm. (b) Kymograph analysis quantifying time and length scale shows reversible submicron scale motion of the CHC. (c–d) Detailed analysis of the CHC centroid verifies that its motion is characterized by a fast and reversible displacement during temperature stimulation. However, the CHC appears resistant to deformation as it shows little change in area and major and minor axis length. (e) Close-up view of H2b-positive chromatin fibers straining during temperature stimulation. The cartoon on the right depicts the concept of strain. Based on their initial length L0 ~3 µm, the estimated fiber strain is indicated in (c) on the right axis.
Figure 3—video 1
Video microscopy of temperature stimulated inverted nuclei, corresponding to analysis in Figure 3.
A Casz1 and GFP-H2b double-transfected NIH-3T3 cell that formed a centrally compacted heterochromatin feature was stimulated with a temperature gradient placed along the bottom of the nucleus. Recorded at 8 fps, shown at 2× real time (16 fps). Stimulation for 5 s.
Figure 4 with 2 supplements
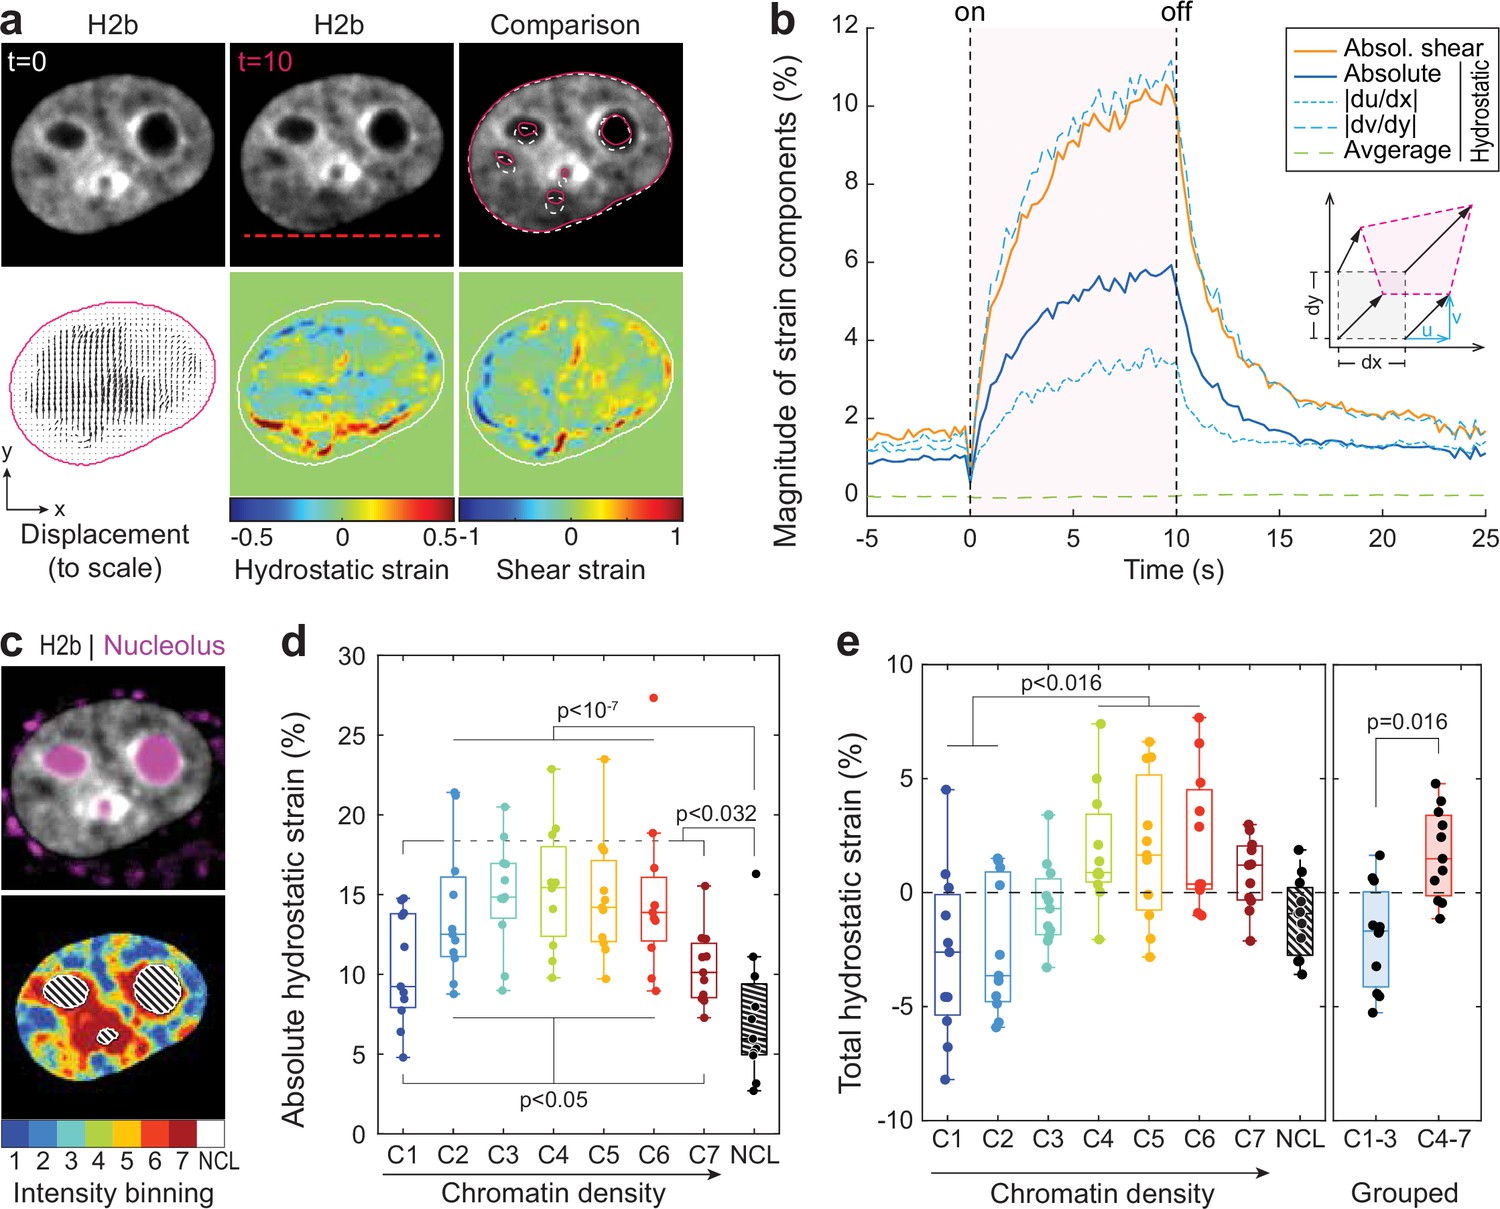
Differential strain measurement within chromatin compartments during temperature stimulation using spatially resolved strain maps.
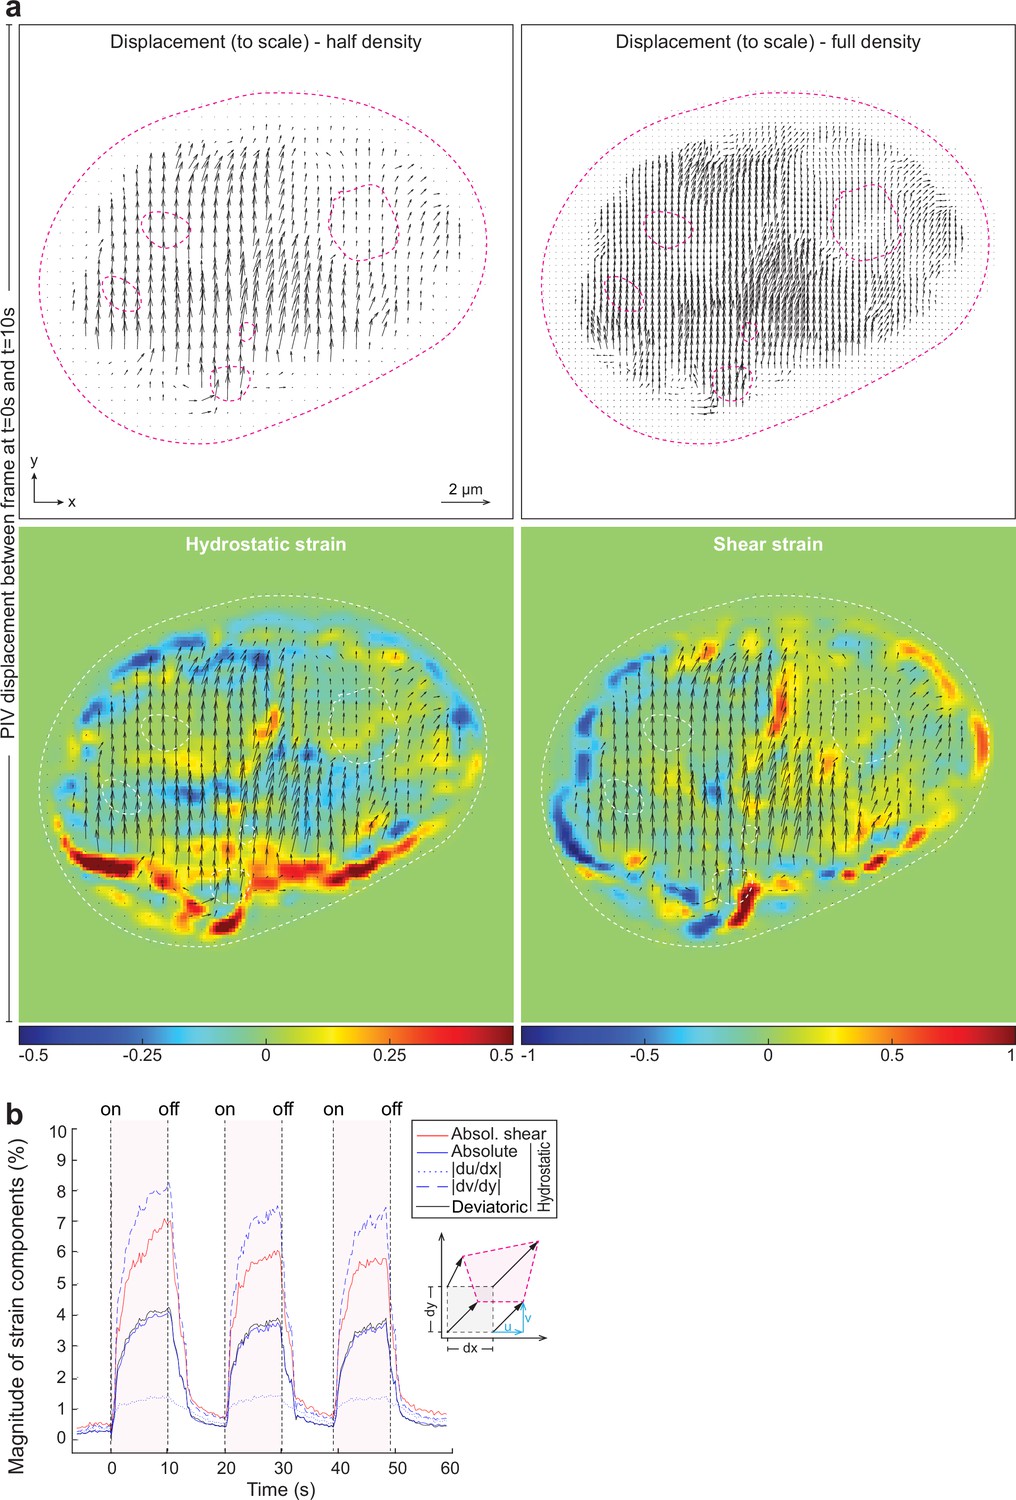
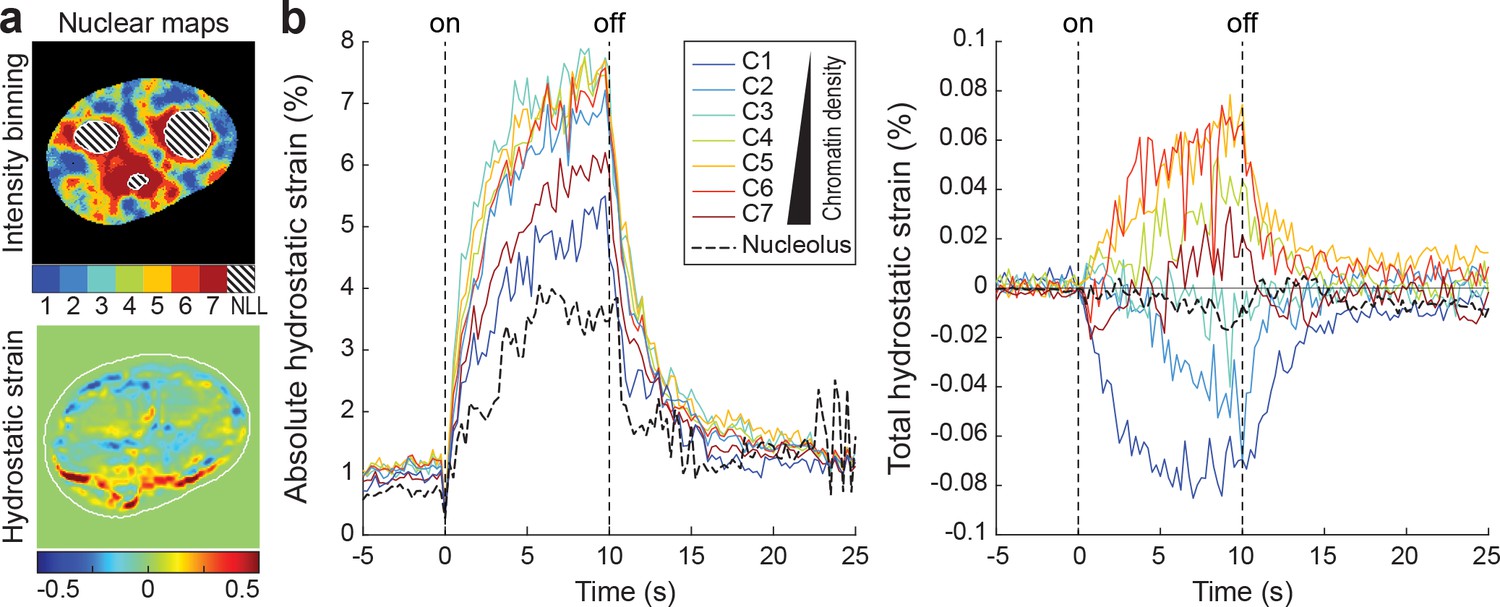
(a) NIH-3T3 cells expressing mCherry-H2b were recorded during temperature stimulation. Spatially resolved displacement maps were generated from image stacks via particle image velocimetry (PIV), using t=0 s as undeformed reference frame. From this, hydrostatic and shear strain maps were further calculated. Strains are shown here as relative values (1=100%). Displacement map is shown at half density, see Figure 4—figure supplement 1 for full density and large-scale strain maps; scale = 5 µm. (b) Magnitude and temporal evolution of strain components. The inset cartoon depicts the concept of different strain types as a measure of local deformation. (c) Nuclei were segmented into seven equi-volumetric chromatin compartments of different density inferred by mCherry-H2b intensity. Nucleoli were further detected using Cytopainter live stains. A region of 6 pixels (~0.74 µm) away from the nuclear border was cut off to exclude low displacements close to the nuclear lamina. (d) Magnitudes of absolute hydrostatic strains (the sign of the strain is not considered, meaning positive values [extension] and negative values [compression] are added up) were locally evaluated for different chromatin densities by combining strain maps with compartment maps. Shown is the averaged absolute hydrostatic strain for each compartment measured at peak deformation (t=10 s) for n=11 nuclei. Boxplots depict the 25–75 percentile with whiskers spanning the full data range excluding outliers (>3× STD). Statistics via one-way ANOVA with Tukey HSD. (e) Local analysis of averaged total hydrostatic strains (the sign of the strain is considered meaning positive values [extension] and negative values [compression] cancel each other) of n=11 nuclei showing that lightly packed chromatin bins (C1–3) are preferentially compressed while densely packed chromatin bins are extended. Statistics via one-way ANOVA with Tukey HSD for all groups and two-tailed t-test for binned groups.
Figure 4—figure supplement 1
Displacement and strain maps and slight stiffening of the chromatin after temperature stimulation-induced chromatin displacement.
(a) Large-scale images of displacement maps, generated via particle image velocimetry (PIV), and derived strain maps between rest (t=0 s) and peak displacement (t=10 s) corresponding to Figure 4a. (b) NIH-3T3 cells expressing H2b-GFP with inverted chromatin organization after transfection with Casz1 were recorded during repeated temperature stimulations. Spatially resolved displacement maps were generated from image stacks via PIV, using t=0 s as undeformed reference frame. From this, hydrostatic and shear strain maps were further calculated. The magnitude and temporal evolution of strain components is shown. The inset cartoon depicts the concept of different strain types as a measure of local deformation. The amplitude of the strain decreases slightly after the first perturbation.
Figure 4—figure supplement 2
Hydrostatic strain over time for different nuclear compartments of a single nucleus.
(a) Top: Nuclear compartments with different chromatin densities as well as nucleoli were mapped via mCherry-H2b and a nuclear live stain. Bottom: Intra-nuclear strain maps were calculated from chromatin displacements, derived via particle image velocimetry (PIV). (b) Compartment and strain maps were combined to analyze mechanical identities of different chromatin compartments. Shown are absolute and total hydrostatic strains of different nuclear compartments (C1–7) and the nucleolus (NLL) over time.
Figure 5 with 2 supplements

Measurement of chromatin displacements around static nucleoli reveal robust binding of perinuclear chromatin to the nucleolus as well as chromatin network effects.
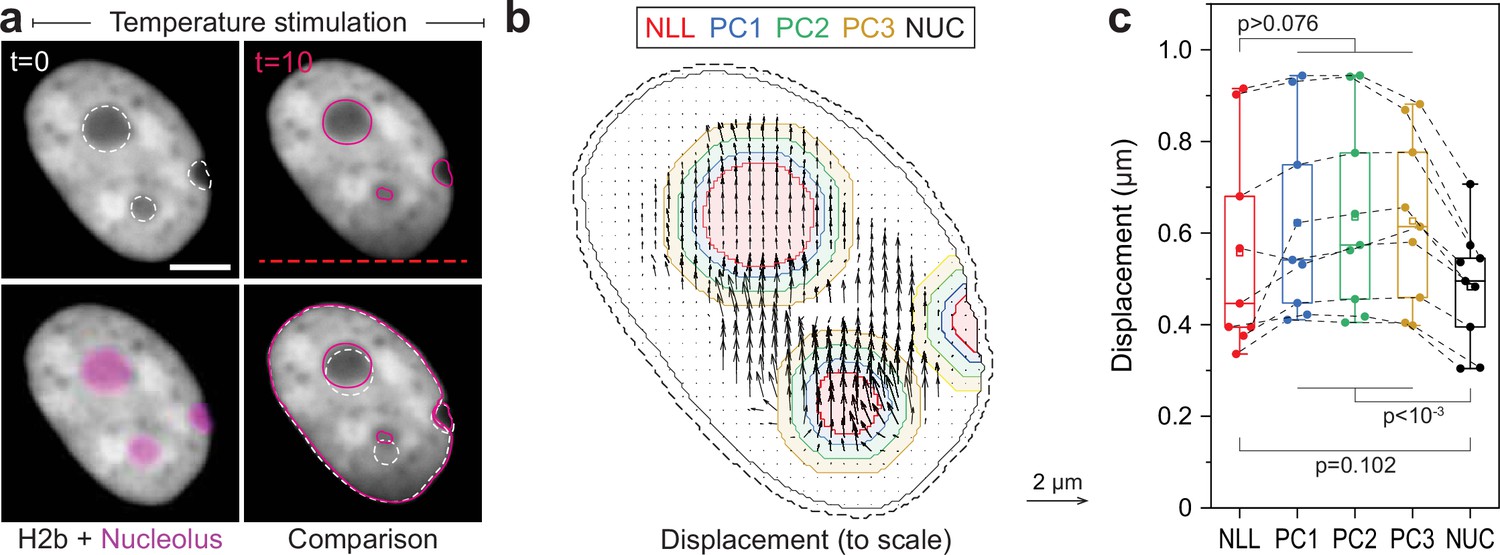
(a) NIH-3T3 cells expressing H2b-GFP were stained with a nucleoli live stain and recorded during temperature-induced chromatin displacement. Outlines represent detected nucleoli. Shown is an example in which nucleoli displayed little displacement, with chromatin flowing around the nucleoli like an obstacle. Red dotted line indicates position of laser scan path. See also Figure 5—video 1; scale = 5 µm. (b) Displacement maps, derived via particle image velocimetry (PIV), show chromatin motion around an immobile nucleolus. Indicated are the outlines of the nucleolus (NLL) and perinucleolar chromatin shells with a distance of 0–0.5 µm (PC1), 0.5–1 µm (PC2), and 1–1.5 µm (PC3) as well as the nuclear border (NUC). Low displacements close to the nuclear lamina (6 pixels ~0.74 µm, dotted line) were excluded to better reflect internal chromatin motion. Displacement maps are shown at half density. (c) Displacements for the nucleolus (NLL), perinuclear chromatin shells (PC1–3), and the nucleus as a whole (NUC) were quantified for n=9 different nuclei that displayed static nucleoli. See also Figure 5—figure supplement 1 for the cases of moving nucleoli as a comparison. Statistics via one-way ANOVA with Tukey HSD.
Figure 5—figure supplement 1
Displacement analysis of moving nucleoli as comparison for static nucleoli. (a) NIH-3T3 cells expressing H2b-GFP were stained with a nucleoli live stain and recorded during temperature-induced chromatin displacement.
Outlines represent detected nucleoli. Shown is an example in which nucleoli showed displacements similar to surrounding chromatin; scale = 5 µm. (b) Displacement maps were derived via particle image velocimetry (PIV). Indicated are the outlines of the nucleolus (NLL) and perinucleolar chromatin shells with a distance of 0–0.5 µm (PC1), 0.5–1 µm (PC2), and 1–1.5 µm (PC3) as well as the nuclear border (NUC). Low displacements close to the nuclear lamina (6 pixels ~0.74 µm, dotted line) were excluded to better reflect internal chromatin motion. Displacement map is shown at half density. (c) Displacements for the nucleolus (NLL), perinuclear chromatin shells (PC1–3), and the nucleus as a whole (NUC) were quantified for n=9 different nuclei that displayed moving nucleoli. Statistics via one-way ANOVA with Tukey HSD.
Figure 5—video 1
Video microscopy of temperature stimulated nuclei, showing a case of static nucleoli and corresponding to analysis in Figure 5.
A GFP-H2b transfected NIH-3T3 was stained with a nucleoli-specific dye and was recorded during stimulation with a temperature gradient placed along the bottom of the nucleus. H2b (white) and nucleoli (magenta) channels were recorded sequentially at 2 fps, shown at 8× real time (16 fps). Stimulation for 10 s.
Author response image 1

Chromatin displacement to both sides away from the laser scan line is induced when the scan line is placed across the nucleus.
Response of NIH-3T3 nuclei to an applied temperature gradient at medium laser intensity, performed at an ambient temperature of 36°C. As routinely performed and described in Figure 1 and Materials and methods, with the difference that cells were not transfected with labeled H2b, but stained with Hoechst and that the scan line (red dotted line) was placed across the nucleus instead of next to the nucleus. An overlay of the displacement map and chromatin density is shown.
Additional files
-
Transparent reporting form
- https://cdn.elifesciences.org/articles/76421/elife-76421-transrepform1-v1.pdf
-
Source code 1
Custom MATLAB code to calculate spatial displacements and strain maps from image stacks.
- https://cdn.elifesciences.org/articles/76421/elife-76421-code1-v1.zip
Download links
A two-part list of links to download the article, or parts of the article, in various formats.
Downloads (link to download the article as PDF)
Open citations (links to open the citations from this article in various online reference manager services)
Cite this article (links to download the citations from this article in formats compatible with various reference manager tools)
Probe-free optical chromatin deformation and measurement of differential mechanical properties in the nucleus
eLife 13:e76421.
https://doi.org/10.7554/eLife.76421


