Lactate receptor HCAR1 regulates neurogenesis and microglia activation after neonatal hypoxia-ischemia
- Department of Microbiology, Oslo University Hospital and University of Oslo, Norway
- Division of Physiology, Institute of Basic Medical Sciences, University of Oslo, Norway
- Department of Clinical and Molecular Medicine, Norwegian University of Science and Technology, Norway
- The Brain and Muscle Energy Group, Institute of Oral Biology, Faculty of Dentistry, University of Oslo, Norway
- Center for Healthy Aging, Department of Neuroscience and Pharmacology, Faculty of Health Sciences, University of Copenhagen, Denmark
Figures
Figure 1
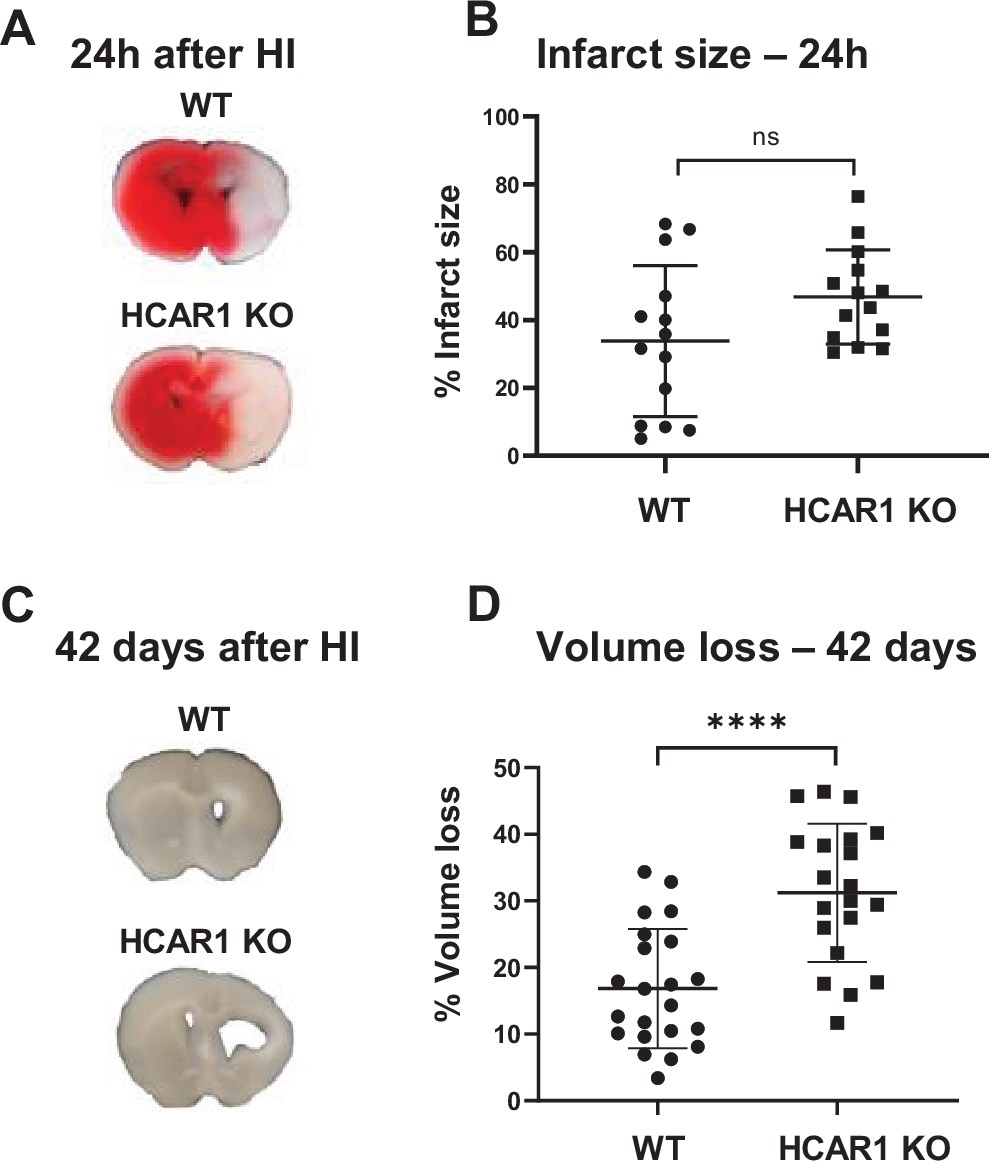
HCAR1 does not protect the brain from acute tissue damage following cerebral HI, but promotes brain tissue regeneration.
(A) Representative images of TTC-stained brain sections from WT and HCAR1 KO mice 24 hr after HI. TTC turns red upon reacting with mitochondrial respiratory enzymes in viable tissue, whereas infarcted tissue remains white. (B) Brain infarct size (TTC-negative tissue as percentage of total quantified tissue volume) 24 hr after HI. p=0.19, n=14 mice/genotype. (C) Representative images of coronal brain sections from WT and HCAR1 KO mice 42 days after HI. (D) Brain tissue loss (% of total quantified tissue volume) 42 days after HI. p=2.2*10–5, WT n=22, KO n=20. Error bars indicate SD. Statistical significance was calculated using a two-tailed t-test.
Figure 2 with 1 supplement
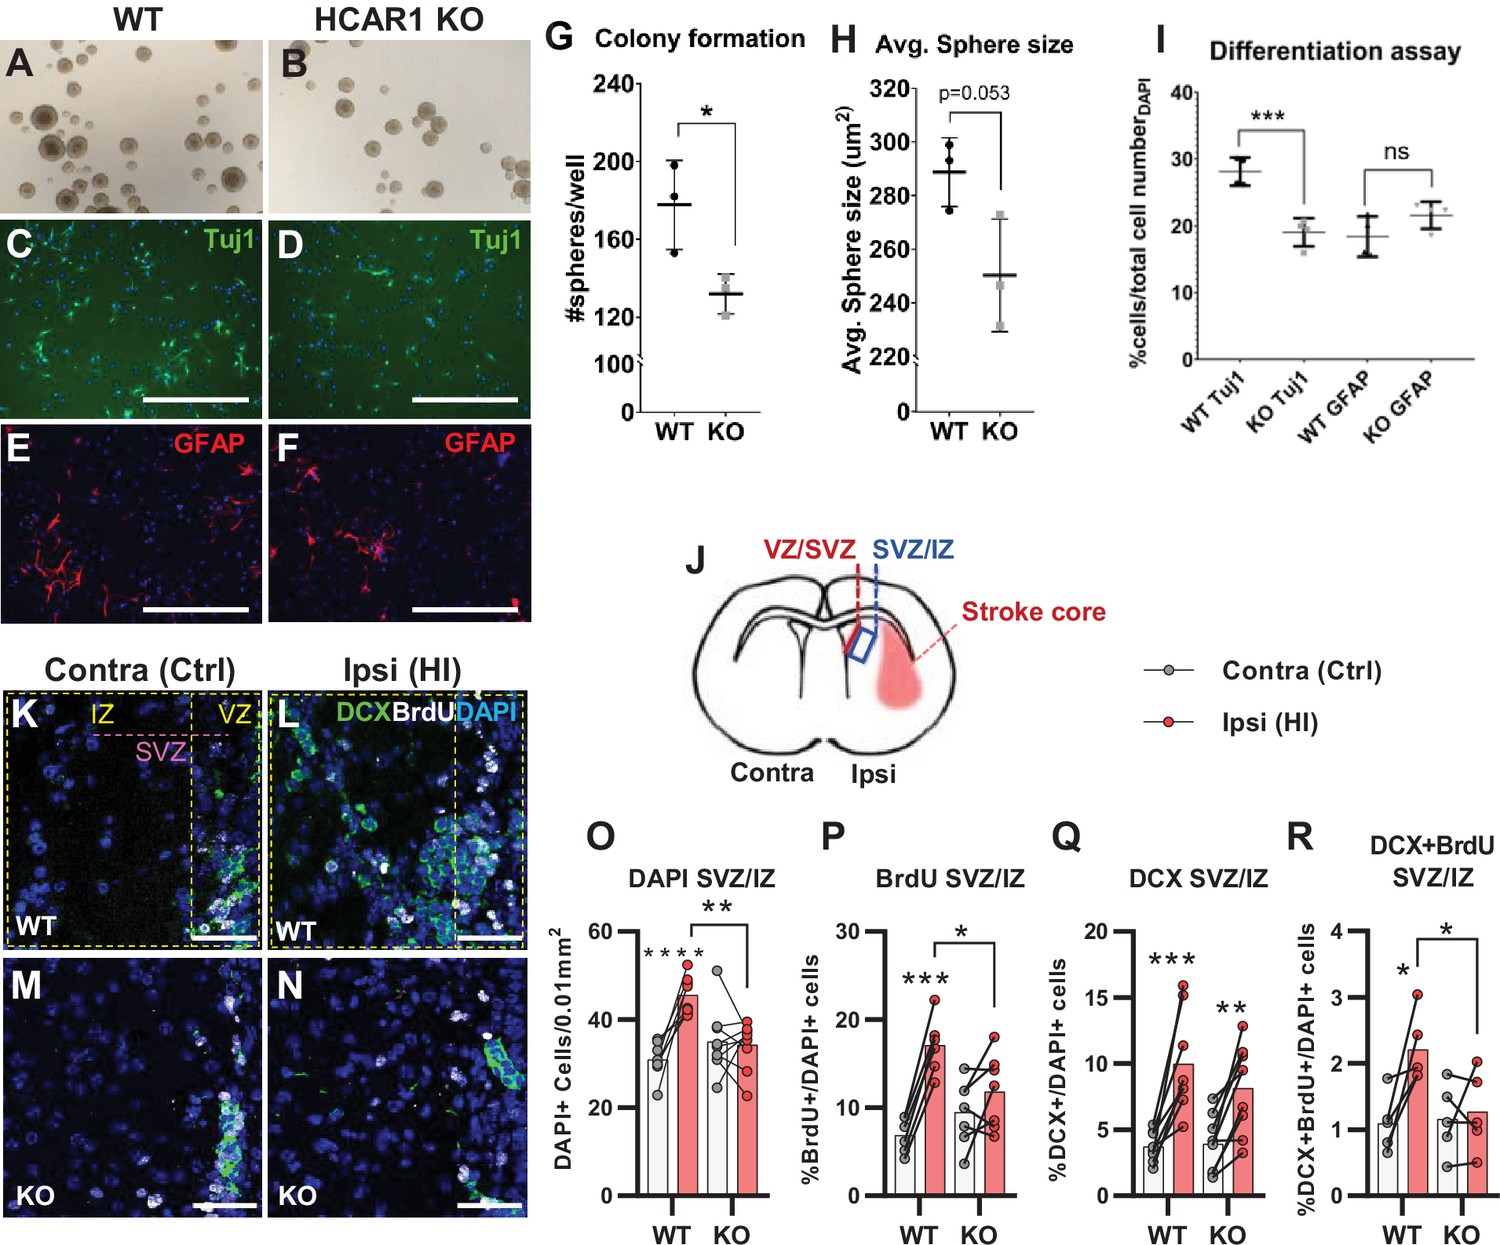
HCAR1 regulates neural progenitor cell proliferation.
A-I Neurosphere formation from HCAR1 KO and WT cells. (A–B) Images of neurospheres from WT (A) and HCAR1 KO (B) mice. (C–F) Fluorescence images from WT (C, E) and HCAR1 KO (D, F) dissociated neurospheres after induced differentiation. Scale bar: 400 µm. (C–D) are stained with the neuronal marker Tuj1 and (E–F) with the astrocyte and neural progenitor marker GFAP. (G) Number of colonies formed per well, p=0.034, df 4, n=3 clones/genotype. (H) Size of neurospheres (um2), p=0.053, df 4, n=3. (I) Percentage of cells positive for Tuj1 or GFAP after induced differentiation. Tuj1 KO vs WT p=0.0009; GFAP KO vs WT p=0.08, df 12, n=4 clones/genotype. Data in (G–I) are shown as mean ± SD and p-values were calculated with two-tailed t-test. (J–R) Quantification of proliferated cells and neuronal progenitors after HI. (J) Illustration of a coronal mouse brain section indicating the core of the infarct in the ipsilateral hemisphere (Ipsi), the contralateral hemisphere (contra, used as control) as well as the ventricular-subventricular sone (V-SVZ) and subventricular-intermediate zone (SVZ-IZ). (K–N) Confocal images from coronal mouse brain sections labelled for DAPI (blue), doublecortin (DCX, marker of neuronal progenitor cells, green) and BrdU (injected proliferation marker, white). The images show the V-SVZ (VZ) and SVZ-IZ (IZ) zones in the contralateral (K, M) and ipsilateral (L, N) hemispheres in WT (K–L) and KO (M–N) mice. The purple line indicates the SVZ. Scale bars: 50 μm. (O–R) Density (O) or ratio (P–R) of cells in the SVZ-IZ zones of the ipsi- (pink bars) and contralateral (white bars) hemispheres of WT and KO mice. (O) DAPI +nuclei (i.e. all cells), WT contra vs ipsi p<0.001, df 15, n=8. KO contra vs ipsi p=0.95, df 15, n=9. (P) Ratio of BrdU + cells (i.e. proliferated cells / DAPI), WT contra vs ipsi p<0.001, df 11, n=6. KO contra vs ipsi p=0.15, df 7, n=11. (Q) DCX + cells (neuronall progenitor cells/ DAPI), WT contra vs ipsi p<0.001, df 15, n=8. KO contra vs ipsi, p=0.002, df 15, n=9. (R) Ratio of proliferated neuronal progenitor cells (DCX +and BrdU+ / DAPI). WT contra vs ipsi p=0.01, df 11, n=6. KO contra vs ipsi p=0.92, df 11, n=7. Each point represents one sample/mouse. In (O–R) ipsi- and contralateral samples from the same mouse are indicated with a line. p-Values were calculated with Šídak method for multiple comparisons of selected groups after significant one-way ANOVA test.
Figure 2—figure supplement 1
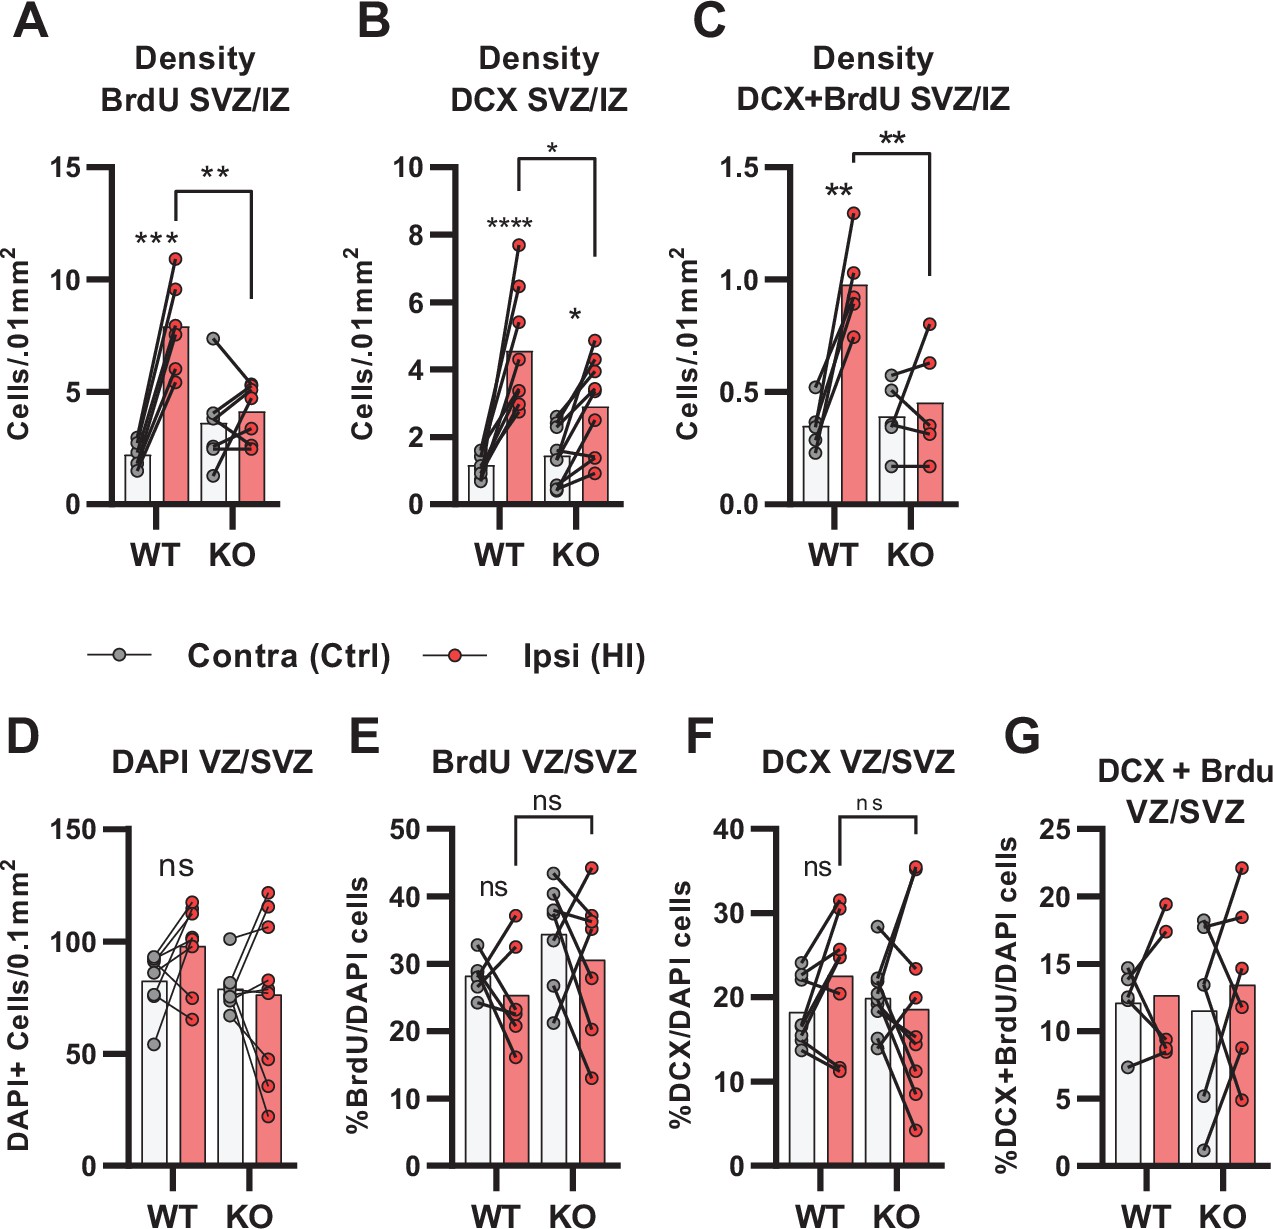
Density data from subventricular-intermediate zone (SVZ/IZ) and quantification proliferated cells and neuroblasts in the ventricular-subventricular zone (VZ/SVZ) after HI.
(A) Density of BrdU + cells within the SVZ/IZ. WT contra vs ipsi, p<0.001, df 11, n=6. KO contra vs ipsi, p=0.95, df 11, n=7. (B) SVZ/IZ density of DCX + cells. WT contra vs ipsi, p<0.001, df 15, n=8. KO contra vs ipsi, p=0.02, df 15, n=9. (C) SVZ/IZ density of BrdU +DCX + cells. WT contra vs ipsi, p=0.02, df 11, n=6. KO contra vs ipsi, p=0.97, df 11, n=7. (D) Density of DAPI +nuclei (i.e. all cells) in the VZ/SVZ of the ipsi- (pink bars) and contralateral (white bars). Not significant one-way ANOVA. (E) Ratio of BrdU + cells. Not significant one-way ANOVA. (F) Ratio of DCX + cells. Not significant one-way ANOVA. (G) Ratio of proliferated neural progenitor cells (i.e. cells that were both DCX +and BrdU+). Non-significant one-way ANOVA. Each point represents one sample/mouse. Ipsi- and contralateral samples from the same mouse are indicated with a line. p-Values were calculated with Šídak method for multiple comparisons of selected groups.
Figure 3 with 1 supplement
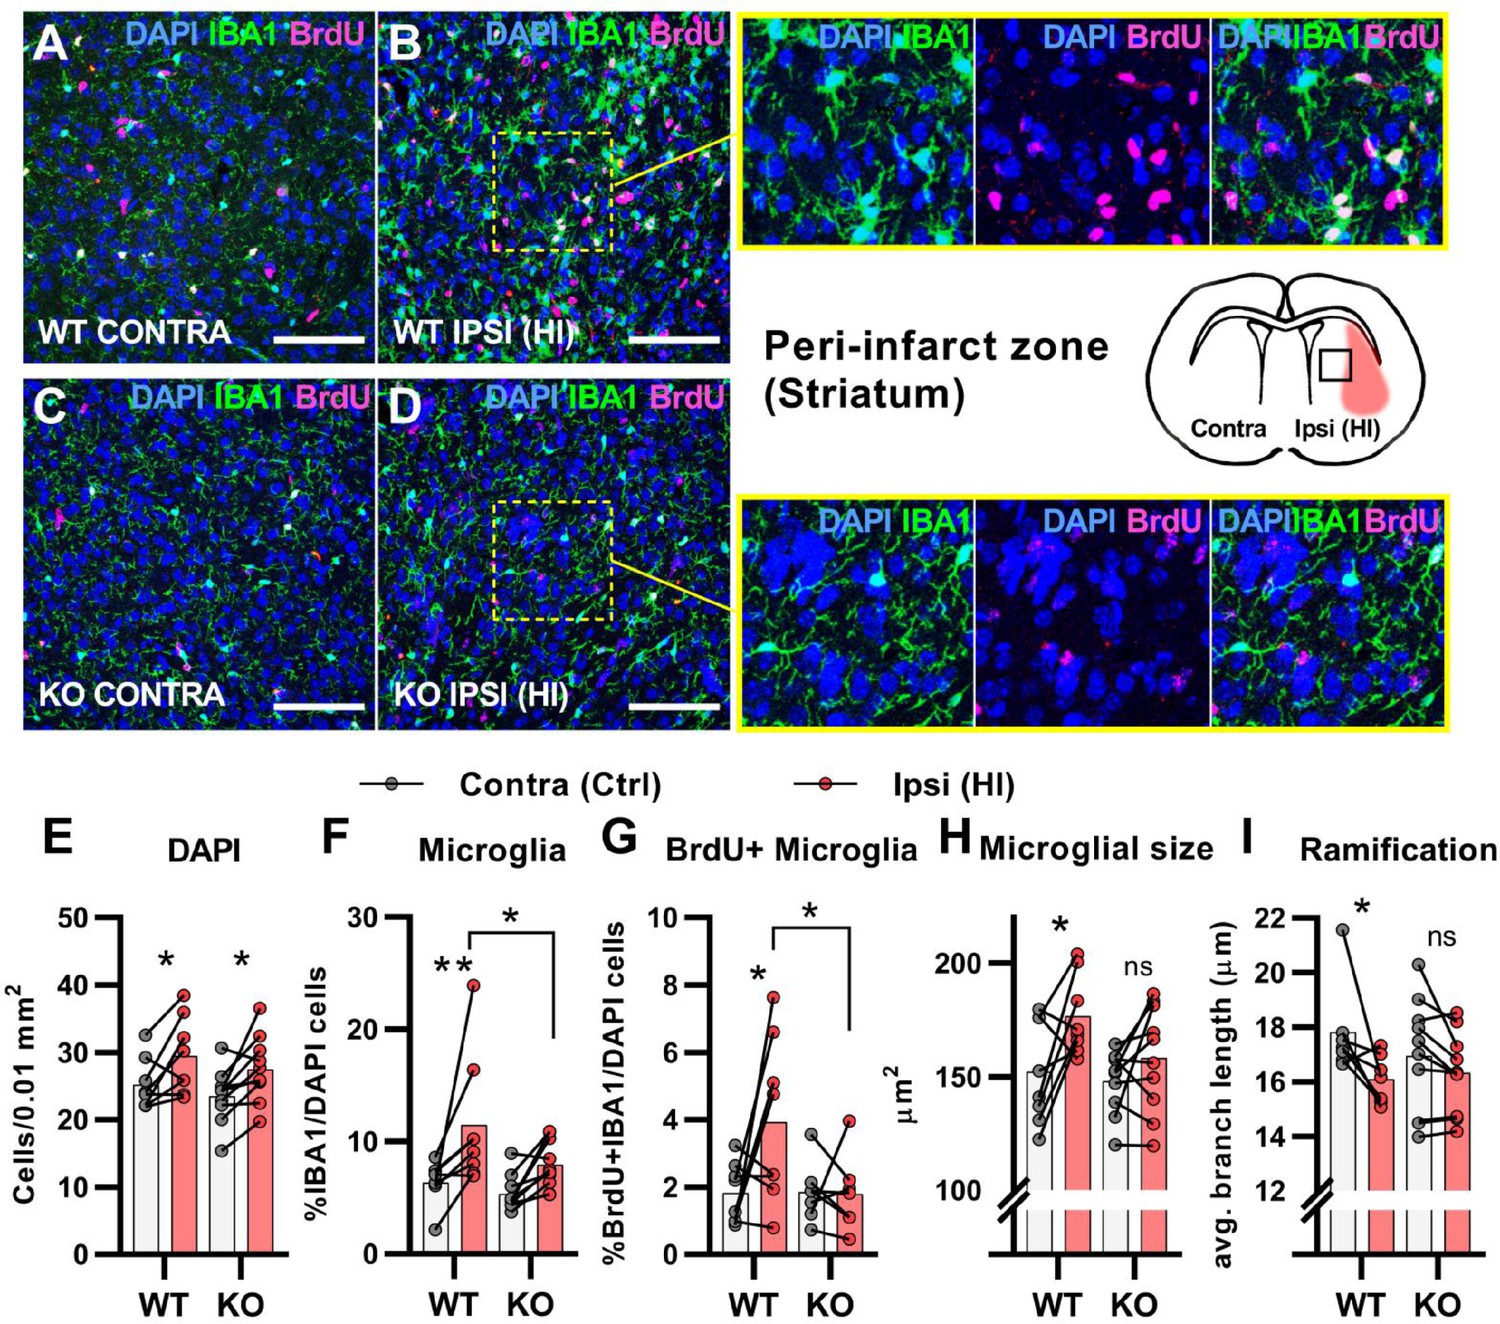
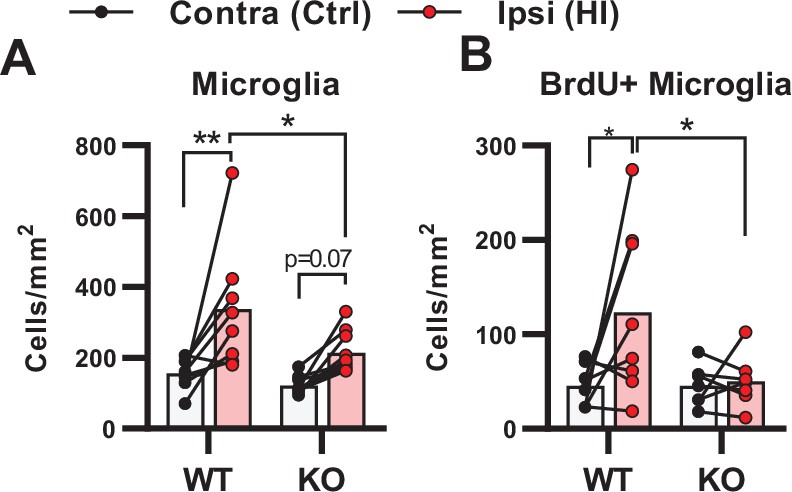
HCAR1 KO mice have deficient activation and proliferation of microglia after HI.
(A-D) Confocal images from the peri-infarct zone (b, d, indicated as square in cartoon) and corresponding contralateral area (A, C) of coronal mouse brain sections from WT (A–B) and KO (C–D) labelled for BrdU (proliferating cells, magenta), Iba1 (microglia, green), and DAPI (blue nuclei). Scale bars: 100 μm (E) Density of all cells (DAPI+/0.01 mm2) in the peri-infarct zone (pink bars) and contralateral striatum (white bars) of WT and KO mice. WT contra vs ipsi p=0.03, df 16, n=8. KO contra vs ipsi p=0.02, df 16, n=10. (F) Ratio of microglia (IBA1+/DAPI + cells) in the peri-infarct zone. WT contra vs ipsi p=0.005, df 16, n=8. KO contra vs ipsi p=0.12, df 16, n=10. (G) Ratio of proliferating microglia (i.e. cells that were both IBA1 +and BrdU+). WT contra vs ipsi p=0.02, df 26, n=8. KO contra vs ipsi p=0.99, df 26, n=7. (H–I) Assessment of microglia activation by morphology. When activated, microglia somata increase in size and get shorter and fewer branches. (H) Average size of microglia somata. WT contra vs ipsi p=0.02, df 16, n=8. KO contra vs ipsi p=0.37, df 16, n=10. (I) Average maximum branch length. WT contra vs ipsi p=0.01, df 15. n=7. KO contra vs ipsi p=0.36, df 15, n=10. Each point represents one sample/mouse. Ipsi- and contralateral samples from the same mouse are indicated with a line. p-Values were calculated with Šídak method for multiple comparisons of selected groups.
-
Figure 3—source code 1
BrdU WEKA.
Algorithms used for WEKA segmentation for BrdU-staining.
- https://cdn.elifesciences.org/articles/76451/elife-76451-fig3-code1-v1.zip
-
Figure 3—source code 2
DAPI WEKA.
Algorithms used for WEKA segmentation for DAPI-staining.
- https://cdn.elifesciences.org/articles/76451/elife-76451-fig3-code2-v1.zip
-
Figure 3—source code 3
IBA1 WEKA.
Algorithms used for WEKA segmentation for IBA1-staining.
- https://cdn.elifesciences.org/articles/76451/elife-76451-fig3-code3-v1.zip
-
Figure 3—source code 4
Script Microglia analysis.
Script for analysis of immunostaining of microglia.
- https://cdn.elifesciences.org/articles/76451/elife-76451-fig3-code4-v1.zip
Figure 3—figure supplement 1
Density measurements of microglia in the peri-infarct zone.
(A) Density of microglia (IBA1 + cells/mm2) in the peri-infarct zone. WT contra vs ipsi p=0.002, df 16, n=8. KO contra vs ipsi p=0.07, df 16, n=10. (B) Density of proliferating microglia (i.e. cells that were both IBA1 +and BrdU+). WT contra vs ipsi p=0.02, df 26, n=8. KO contra vs ipsi p=0.98, df 26, n=7. Each point represents one sample/mouse. Ipsi- and contralateral samples from the same mouse are indicated with a line. p-Values were calculated with Šídak method for multiple comparisons of selected groups.
Figure 4 with 1 supplement
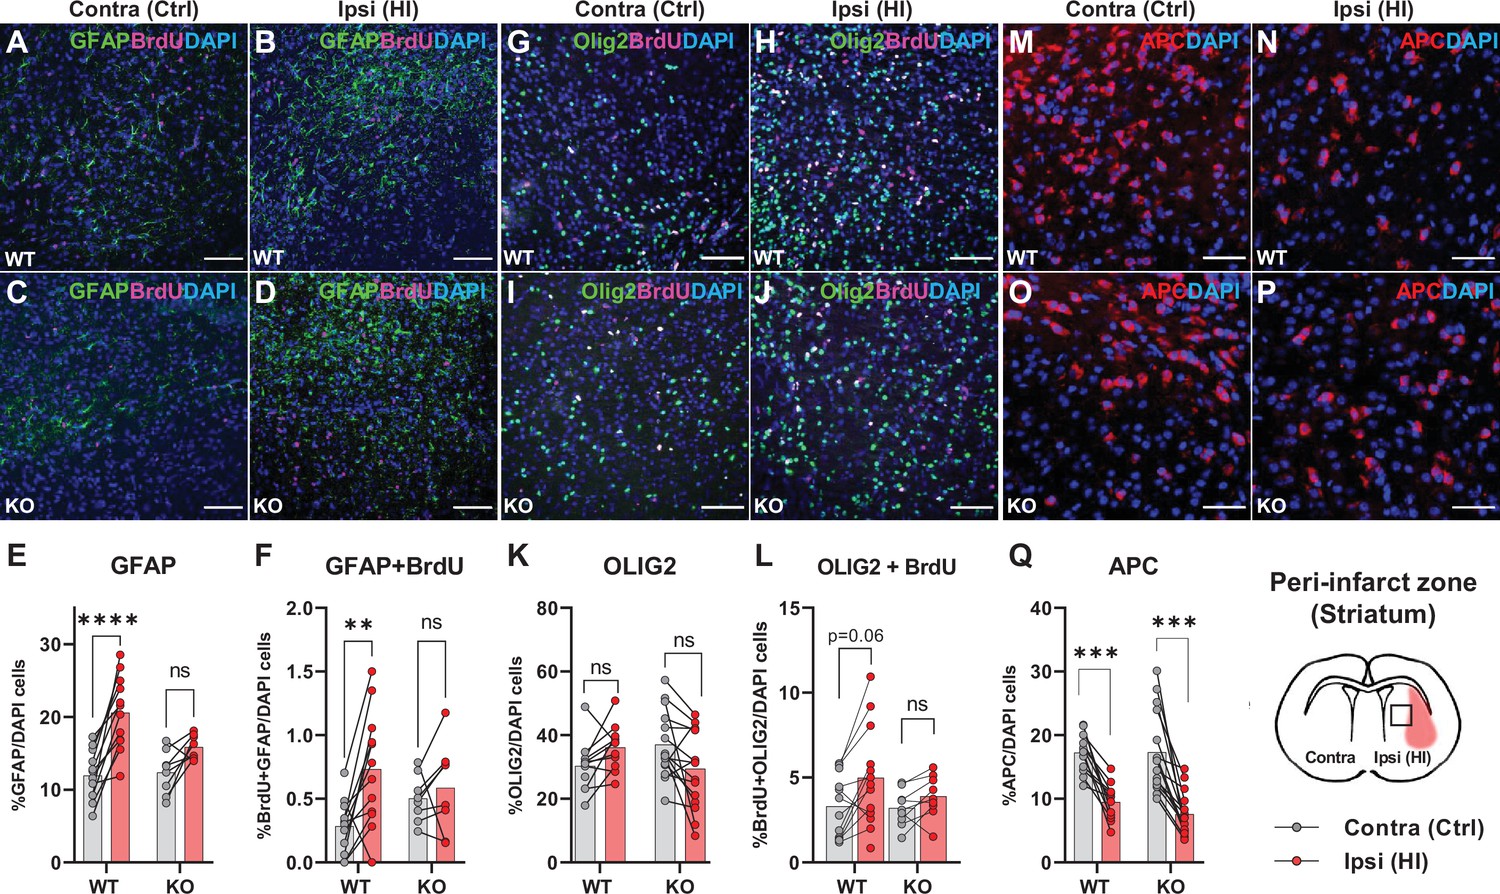
Astrocyte and oligodendrocyte proliferation after HI.
(A-D) Confocal images showing immunolabelling of GFAP +Astrocytes (green) and proliferated BrdU + cells (magenta) in striatal peri-infarct area from contralateral (control, ctrl) and ipsilateral hemisphere (hypoxic ischemia, HI) (see illustration at the bottom right). (E) Striatal GFAP + cells. WT contra vs ipsi, p=0.001, df 18, n=12. KO contra vs ipsi, p=0.07, df 18, n=8. (F) Proliferated GFAP + cells. WT contra vs ipsi, p=0.002, df 18, n=12. KO contra vs ipsi, p=0.81, df 18, n=8. (G–J) Images of striatal Olig2 +oligondendrocytes (whole oligodendrocyte lineage) and BrdU + cells. (K) Olig2 +oligodendrocytes, WT contra vs ipsi, not tested due to insignificant one-way ANOVA, df 50, n=12. KO contra vs ipsi, not tested, df 50, n=15. (L) Olig2 +and BrdU + cells, WT contra vs ipsi, p=0.06, df 38, n=12. KO contra vs ipsi, p=0.92, df 38, n=9. (M–Q) Striatal mature oligodendrocytes (APC). WT contra vs ipsi, p<0.001, df 50, n=12. KO contra vs ipsi, p<0.001, df 50, n=15. Each point represents one sample/mouse. Ipsi- and contralateral samples from the same mouse are indicated with a line. p-Values were calculated with Šídak method for multiple comparisons of selected groups.
-
Figure 4—source code 1
Script GFAP analysis.
Script for analysis of immunostaining of GFAP + cells.
- https://cdn.elifesciences.org/articles/76451/elife-76451-fig4-code1-v1.zip
Figure 4—figure supplement 1
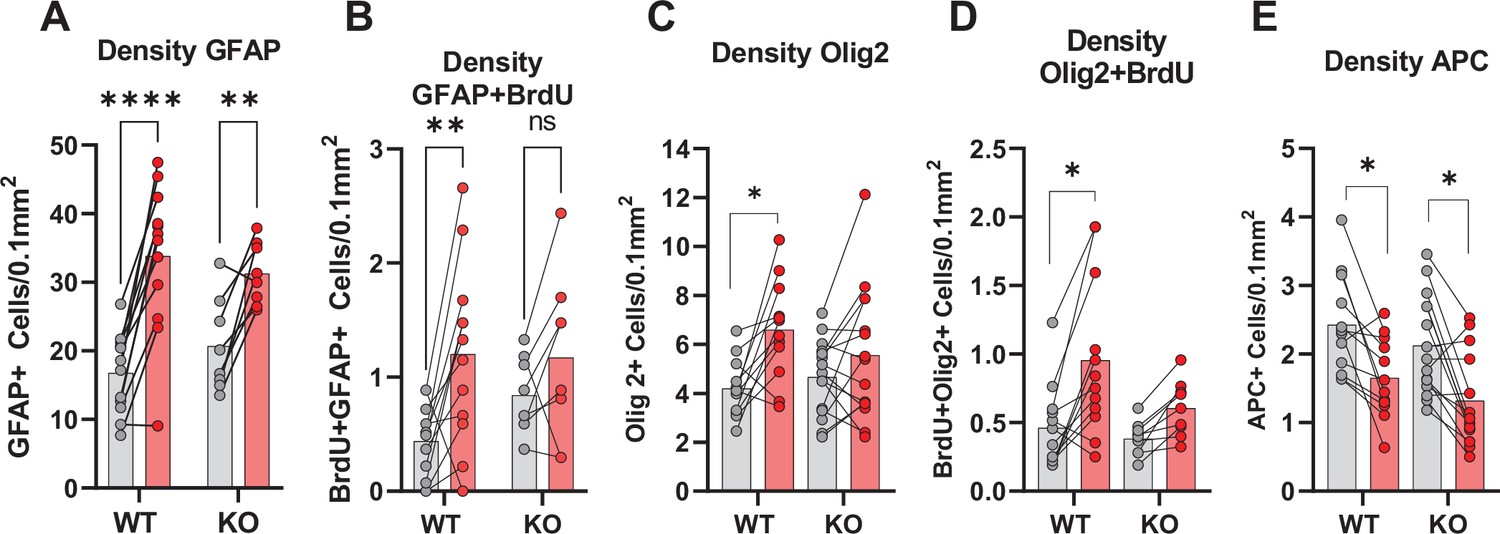
Density measurements of GFAP, Olig2, and APC in the peri-infarct zone.
(A) Density of peri-infarct zone (striatal) GFAP +astrocytes. WT contra vs ipsi, p<0.001, df 18, n=12. KO contra vs ipsi, p=0.002, df 18, n=8. (B) Proliferated astrocytes. WT contra vs ipsi, p=0.004, df 18, n=12. KO contra vs ipsi, p=0.37, df 18, n=8. (C) Olig2 +oligodendrocytes, WT contra vs ipsi, p=0.02, df 50, n=12. KO contra vs ipsi, p=0.63, df 50, n=15.( D) Olig2 +and BrdU + cells, WT contra vs ipsi, p=0.008, df 38, n=12. KO contra vs ipsi, p=0.61, df 38, n=9. (E) Mature oligodendrocytes (APC). WT contra vs ipsi, p=0.03, df 50, n=12. KO contra vs ipsi, p=0.01, df 50, n=15. Each point represents one sample/mouse. Ipsi- and contralateral samples from the same mouse are indicated with a line. p-Values were calculated with Šídak method for multiple comparisons of selected groups.
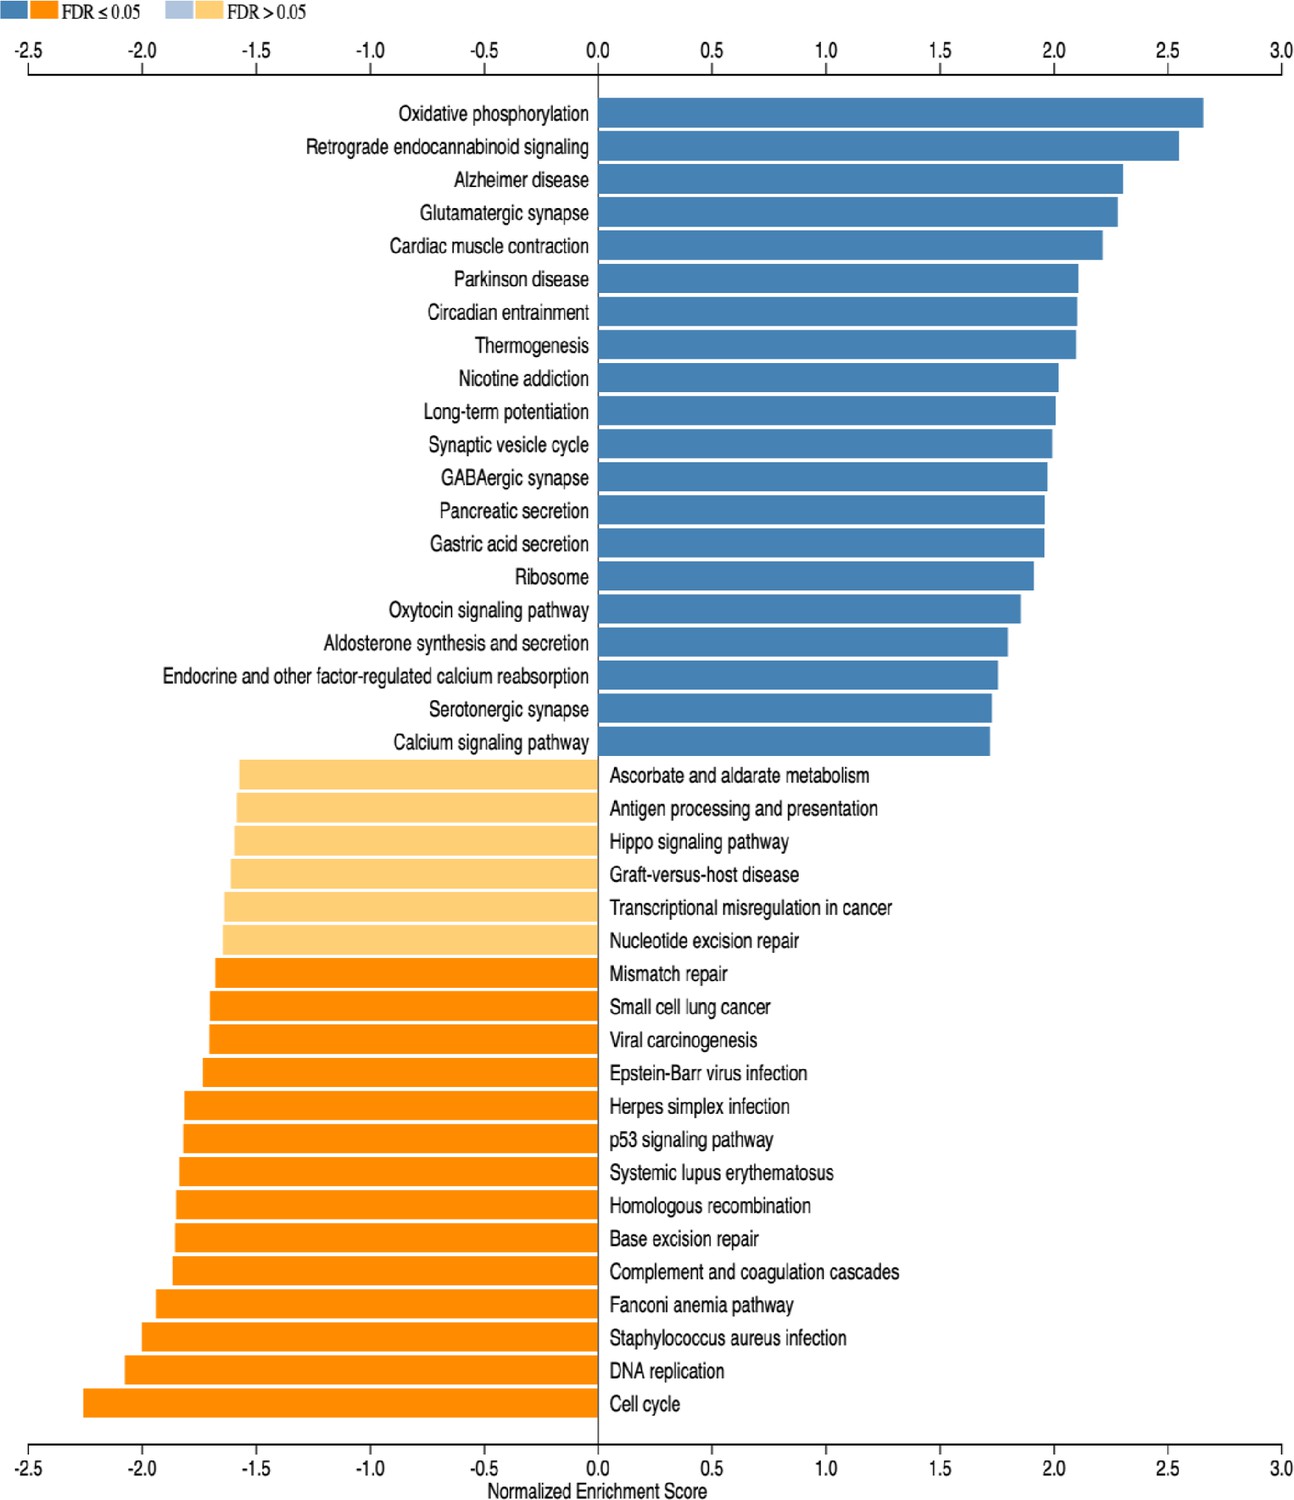
Figure 5 with 4 supplements

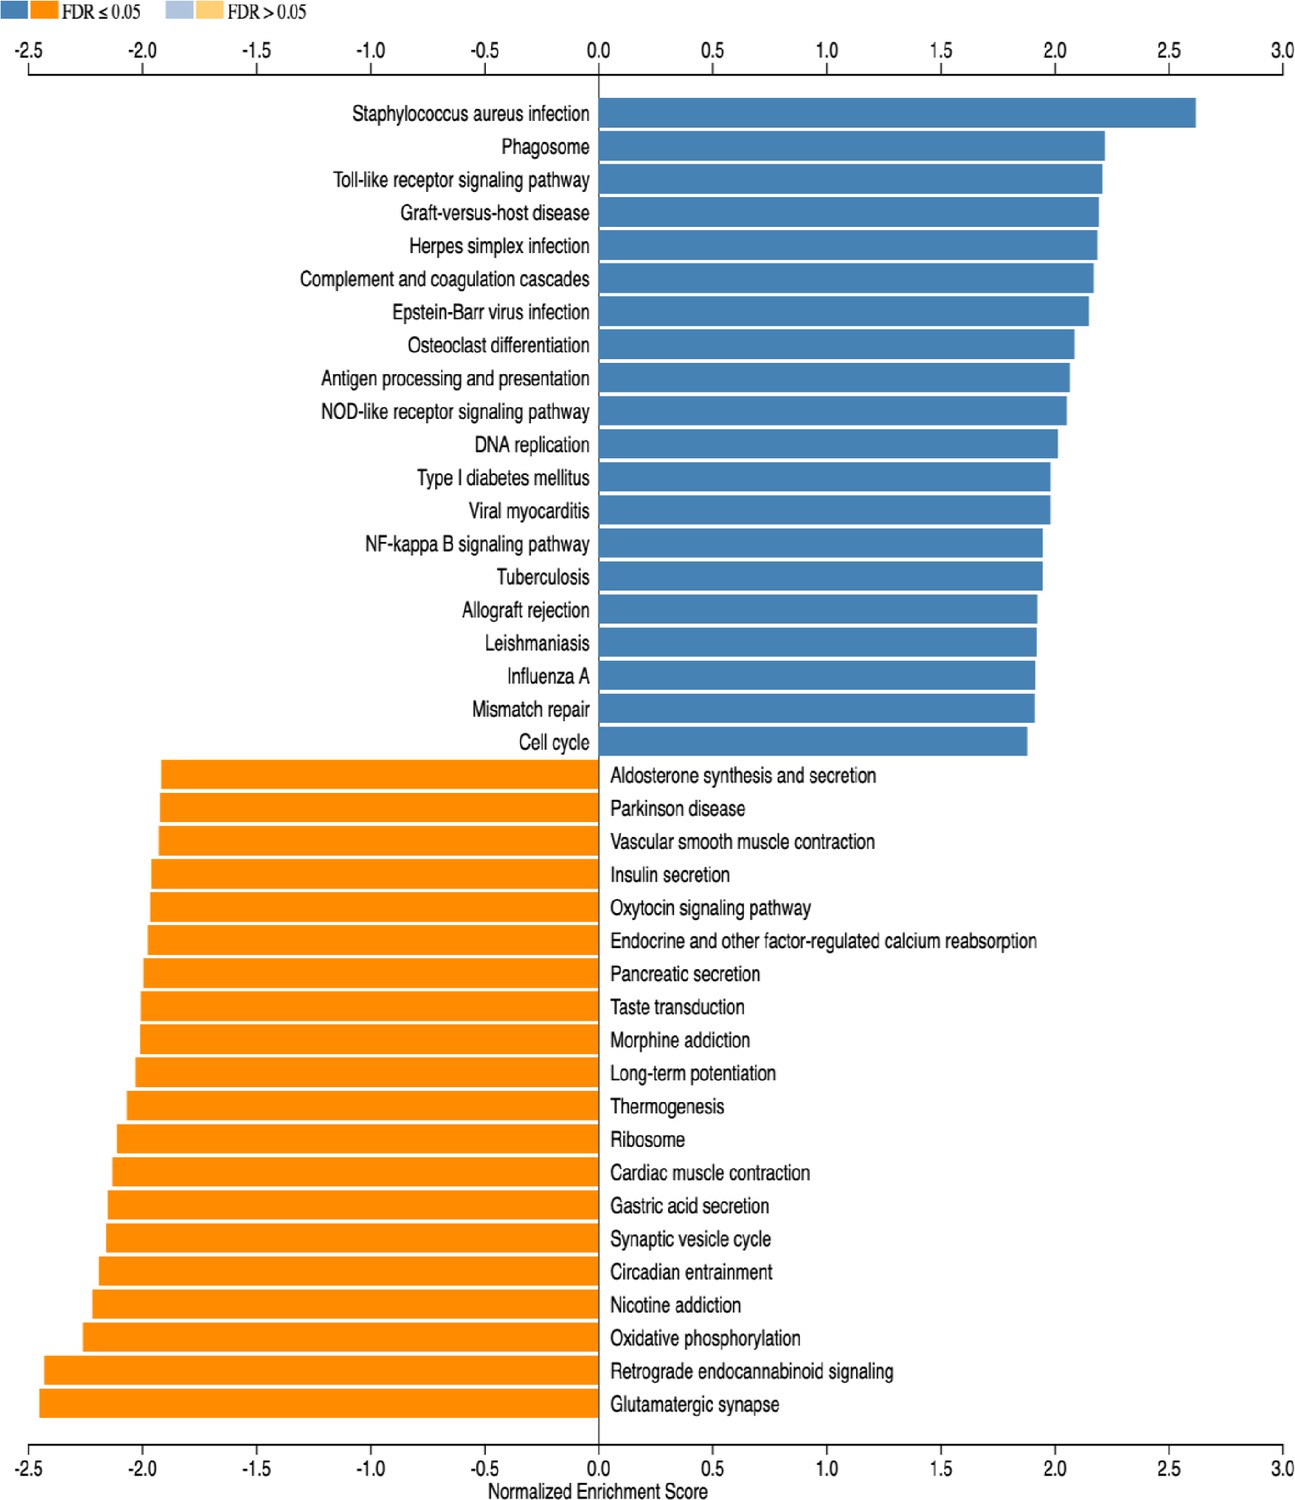
HCAR1 regulates transcriptional response to ischemia including cell cycle and complement pathway.
(A) PCA plot of transcriptome data from subventricular zone tissue samples from the ipsilateral (HI-damaged) and contralateral (control, ctrl) hemisphere in HCAR1 KO and WT mice. Each point represents one sample/mouse. Each colour represents a group. (B) Gene set enrichment analysis (GSEA) of HCAR1 KO HI versus WT HI showing the ten most up- or downregulated pathways (FDR <0.05). (C) Heatmap showing relative expression of a subset of differentially expressed genes (DEGs) enriched in the cell cycle. (D) DEGs related to complement and coagulation cascades (immune system response involved in activation of microglia). (E) DEGs that are markers of microglia activation (based on DePaula-Silva et al., 2019). Genes shown in (C–E) were significantly differentially expressed in HCAR1 KO HI versus WT HI. (F–H) Protein expression of Cyclin D2 and Cyclin B1 in the ipsilateral striatum of WT and HCAR1 KO mice after HI. (F–G) Graphs presenting relative intensity of striatal Cyclin D2 and B1 from the western blots shown in H. (F) Cyclin D2 HCAR1 KO HI vs WT HI, p<0.001, df 4, n=3. (G) Cyclin B1 HCAR1 KO HI vs WT HI, p=0.057, df 4, n=3. Data in F-G are shown as mean ± SD and p-values were calculated with two-tailed t-test.
-
Figure 5—source data 1
Raw images of western blots in Figure 5.
- https://cdn.elifesciences.org/articles/76451/elife-76451-fig5-data1-v1.zip
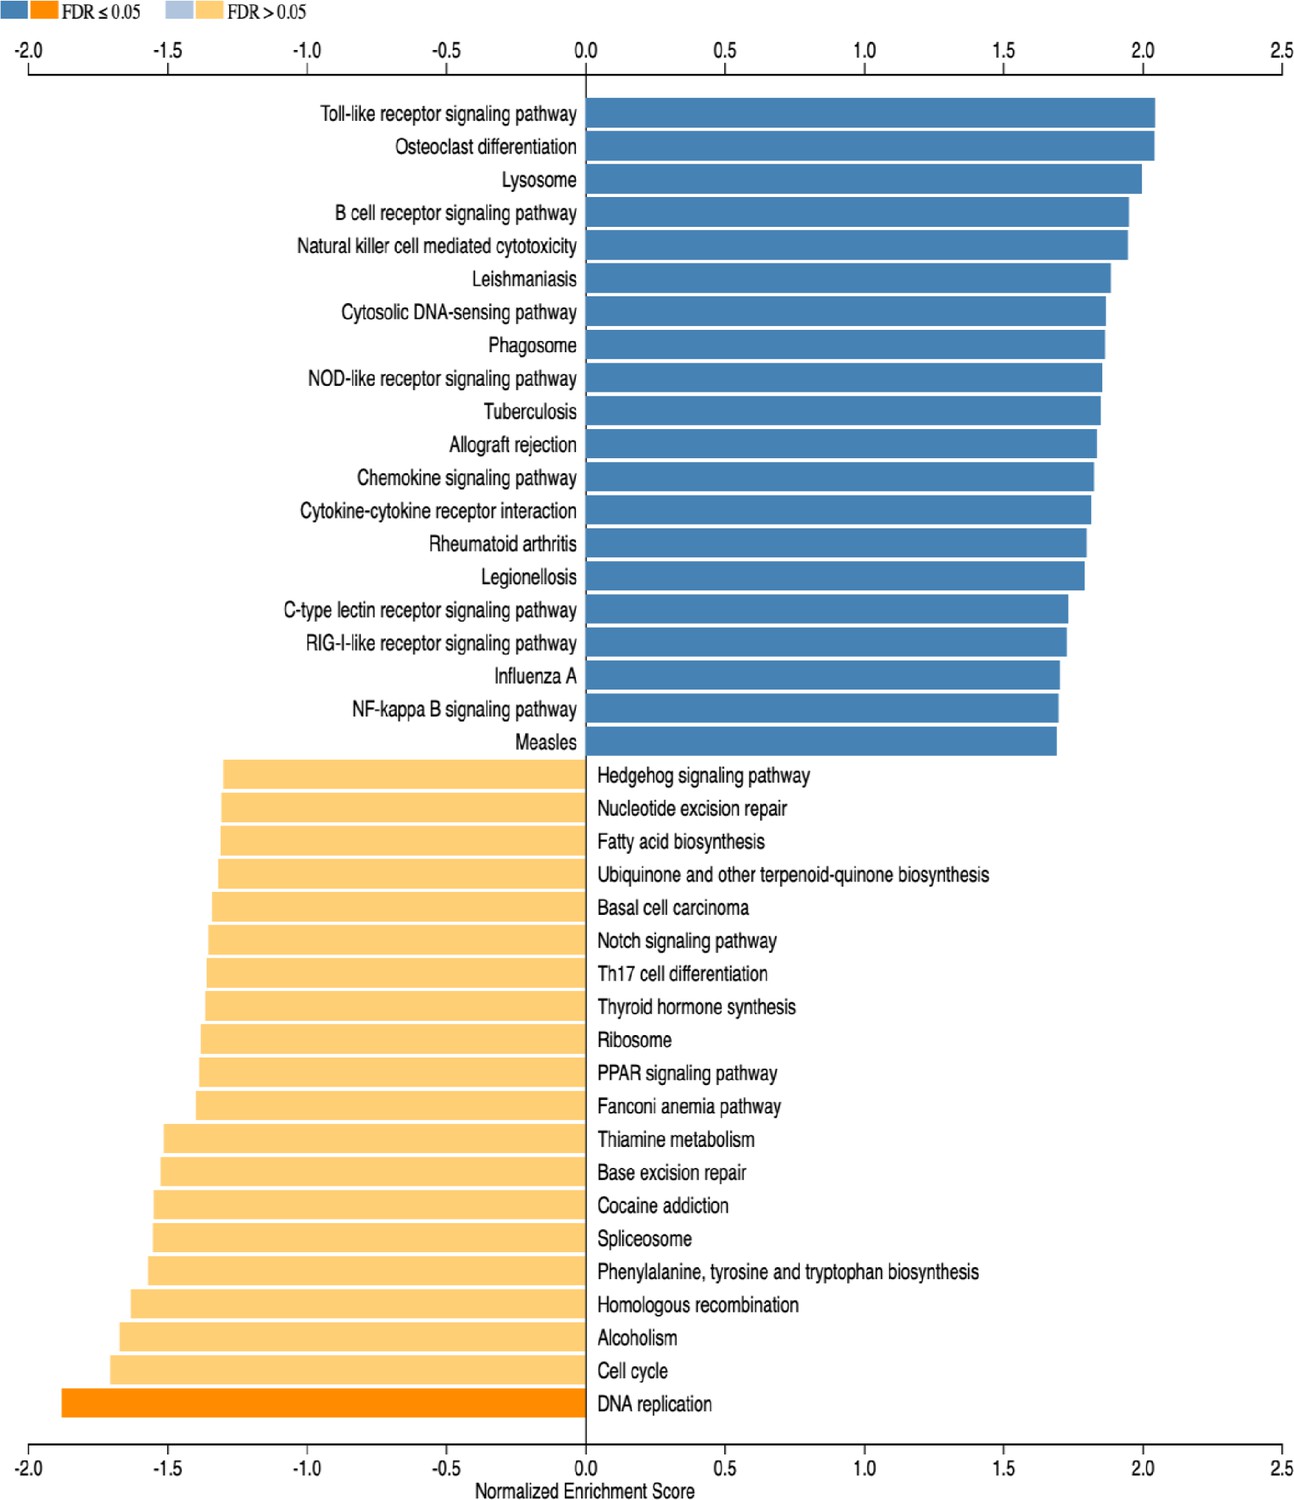
Figure 5—figure supplement 1
Gene set enrichment analysis (GSEA) of subventricular zone from HCAR1 KO ipsi versus WT ipsi.
The 20 most up- or downregulated pathways are included.
Figure 5—figure supplement 2
Gene set enrichment analysis (GSEA) of subventricular zone from WT ipsi (HI) versus WT contra (control).
The 20 most up- or downregulated pathways are included.
Figure 5—figure supplement 3

Gene set enrichment analysis (GSEA) of subventricular zone from HCAR1 KO contra versus WT contra.
The 20 most up- or downregulated pathways are included. Note that only one pathway has FDR ≤0.05.
Figure 5—figure supplement 4
Gene set enrichment analysis (GSEA) of subventricular zone from HCAR1 KO ipsi (HI) versus HCAR1 KO contra (control).
The 20 most up- or downregulated pathways are included.
Figure 6
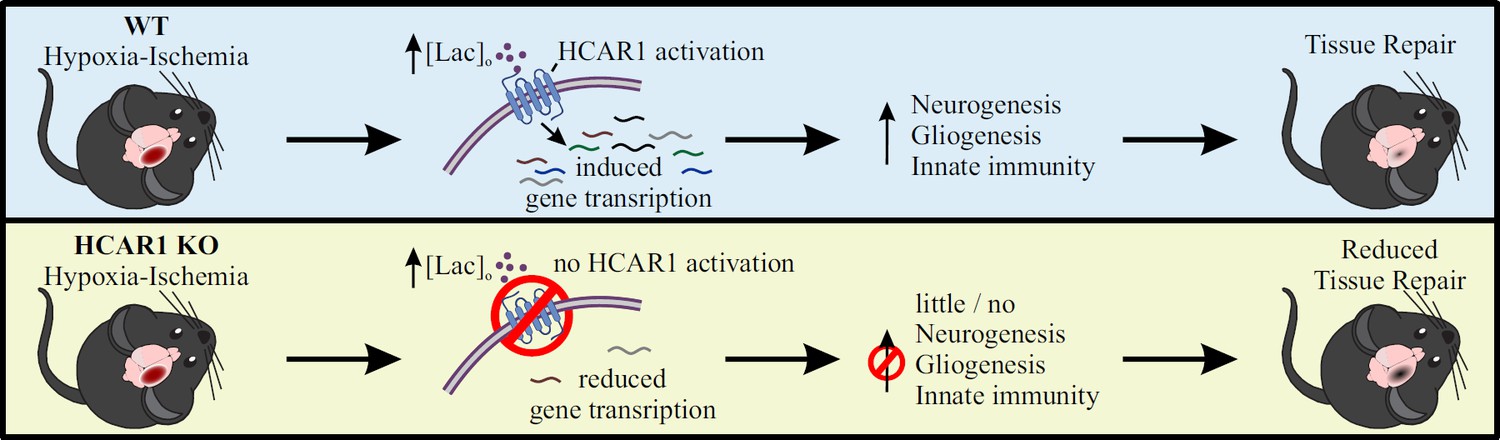
Proposed model for the role of HCAR1 in neonatal HI.
During and after HI, the extracellular concentration of lactate ([lac]o) is elevated. Top panel: In WT mice, the elevated lactate causes HCAR1 activation, which induces transcription of genes involved in tissue response to ischemia. This includes genes responsible for neurogenesis, proliferation of glial cells and innate immunity, thereby promoting tissue repair. Bottom panel: In HCAR1 KO mice, the transcriptional response to ischemia is severely reduced. Without the HCAR1-induced gene transcription, there is little cell proliferation and innate immune response, which in turn gives an impaired tissue repair.
Additional files
-
Supplementary file 1
Number of differentially expressed genes (DEGs) between the different experimental groups.
Thresholds ->logFC ≥ 0.5 (UP DEGs) and ≤–0.5 (DOWN DEGs); all of them significant at adjusted P-value <0.05. SVZ, subventricular zone; hc, hippocampus.
- https://cdn.elifesciences.org/articles/76451/elife-76451-supp1-v1.docx
-
Transparent reporting form
- https://cdn.elifesciences.org/articles/76451/elife-76451-transrepform1-v1.pdf
Download links
A two-part list of links to download the article, or parts of the article, in various formats.
Downloads (link to download the article as PDF)
Open citations (links to open the citations from this article in various online reference manager services)
Cite this article (links to download the citations from this article in formats compatible with various reference manager tools)
Lactate receptor HCAR1 regulates neurogenesis and microglia activation after neonatal hypoxia-ischemia
eLife 11:e76451.
https://doi.org/10.7554/eLife.76451


