SMAD4 and TGFβ are architects of inverse genetic programs during fate determination of antiviral CTLs
- Department of Immunology, University of Connecticut Health Center, United States
- Department of Microbiology and Immunology, Emory Vaccine Center, Emory University, United States
- Department of Immunobiology, Yale University School of Medicine, United States
- NOMIS Center for Immunobiology and Microbial Pathogenesis, Salk Institute for Biological Studies, United States
Figures
Figure 1 with 4 supplements
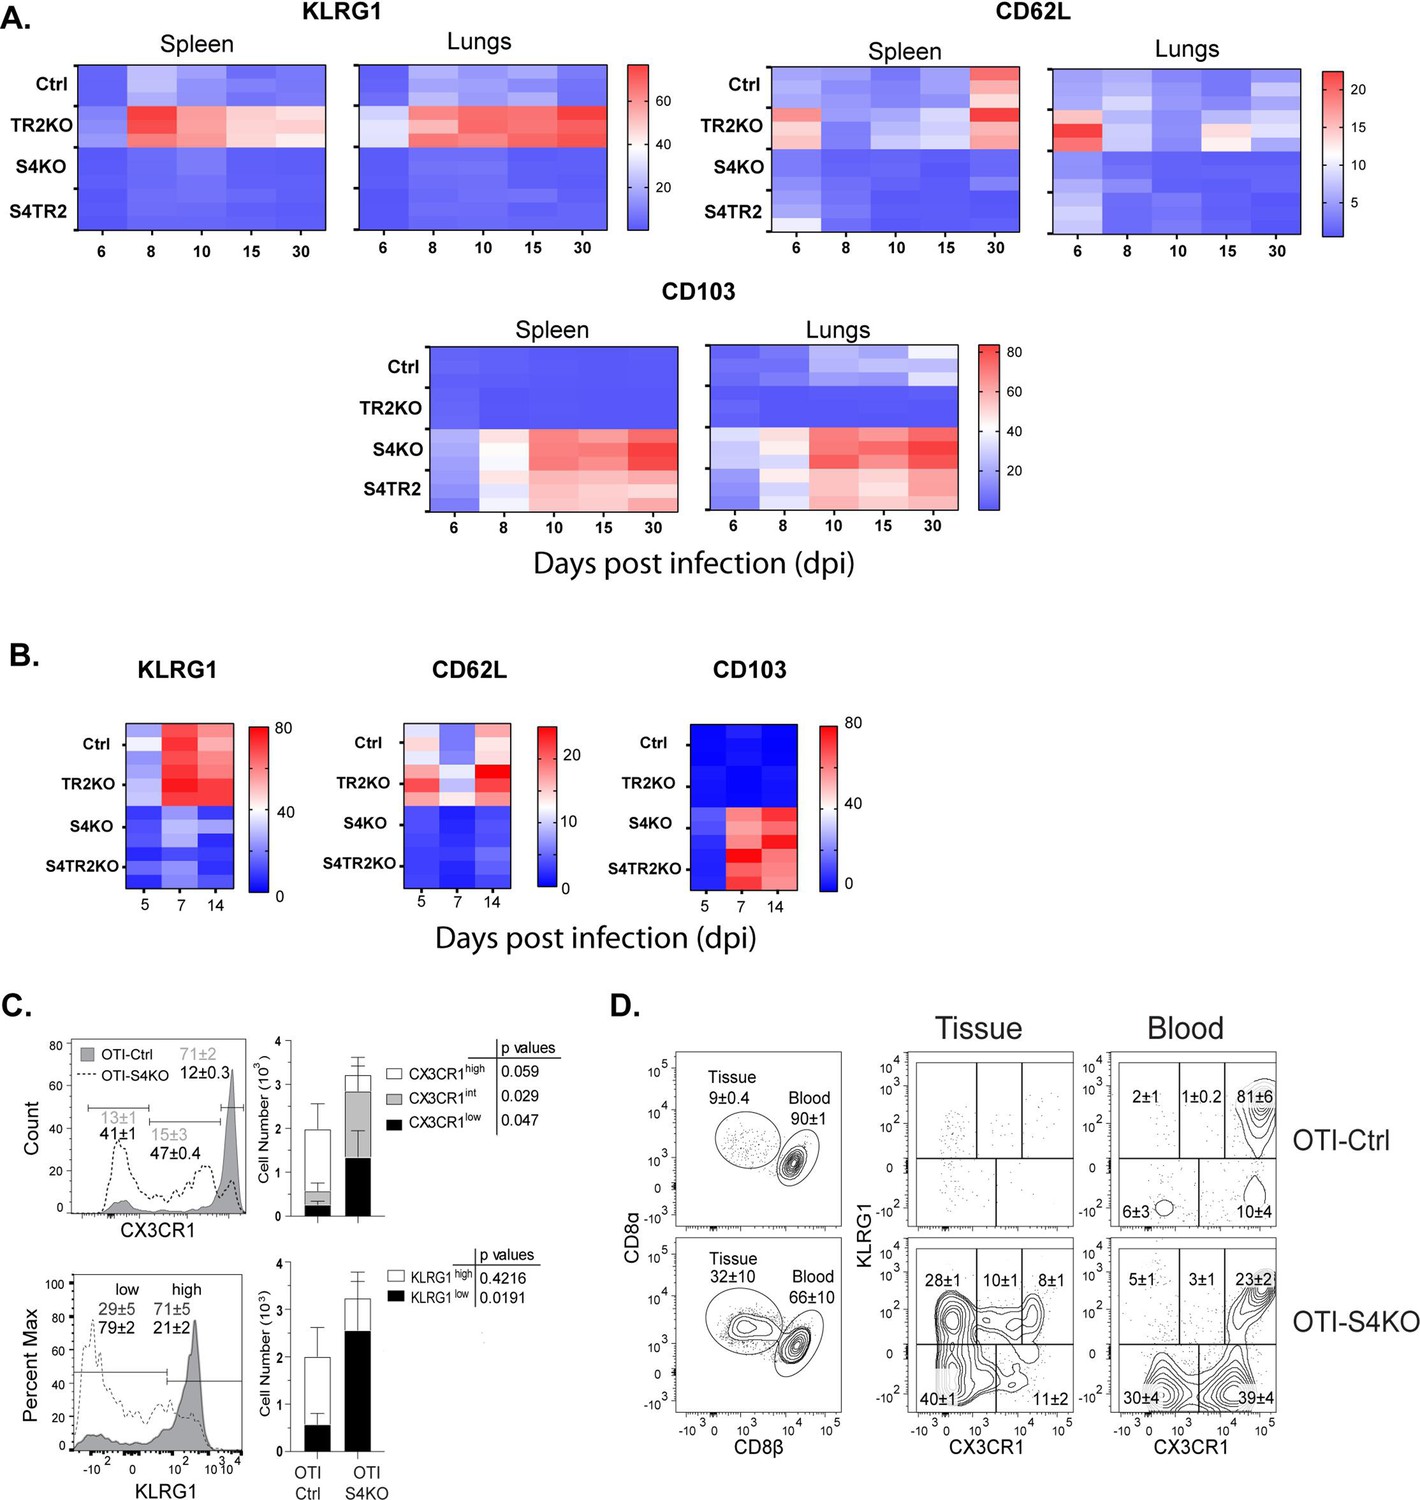
SMAD4 ablation alters homing-receptor expression without transforming growth factor β (TGFβ) receptor II.
(A, B) Naive donor cells from OTI-Ctrl, OTI-TR2KO, OTI-S4KO, and OTI-S4TR2-DKO were transferred to B6 mice before infection. Heatmaps show percentages of donor cells that expressed KLRG1, CD103, CD62L, and CD127 on different day post infection. Data are means ± standard deviation (SD) (n = 3/group). Two independent experiments gave similar results. p values were calculated using two-way ANOVA and statistical comparisons were made using Tukey’s multiple comparisons test. (A) Donor cells in the lungs and spleens after i.n. infection with X31-OVA. (B) Donor cells in the spleens after i.v. infection with LM-OVA. (C, D) IV staining shows OTI-S4KO and OTI-S4Ctrl cells in the lungs at 34 dpi with LM-OVA given by i.n. inoculation. Data are means ± standard deviation (SD) (n = 3-4/group). Two independent experiments gave similar results. p values were calculated using Student’s t tests (C) Histograms (percentages) and bar graphs (cell numbers) show all donor cells from OTI-S4KO (dashed) and OTI-S4Ctrl mice (continuous line). (D) Contour plots show donor cells in the bloodstream (right panel) and lung tissue (left panel).
Figure 1—figure supplement 1
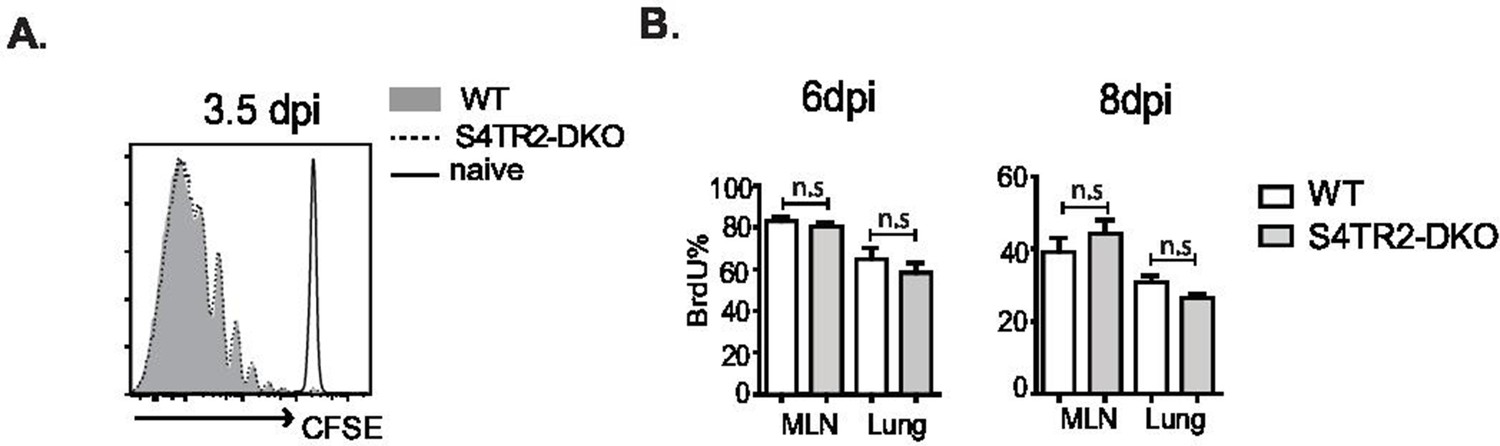
Naive OTI-S4TR2Ctrl (gray shading) and OTI-S4TR2KO cells (dotted line) were labeled with carboxyfluorescein succinimidyl ester (CFSE) and transferred to C57BL/6 mice before infection with X31-OVA.
(A) Histograms show CFSE dilution at 3.5 dpi. (B) OTI-S4TR2Ctrl (white fill) and OTI-S4TR2KO cells (gray fill) were transferred to C57BL/6 mice before infection with X31-OVA. 5-Bromo-2-deoxyuridine (BrdU) was administered by IP injection 3 hr before sacrifice. Bar graphs show percentages of BrdU+ donor cells at 6 dpi and 8 dpi. Data are means ± standard deviation (SD) (n = 3/group). Two independent experiments gave similar results. p values were calculated using Student’s t tests.
Figure 1—figure supplement 2
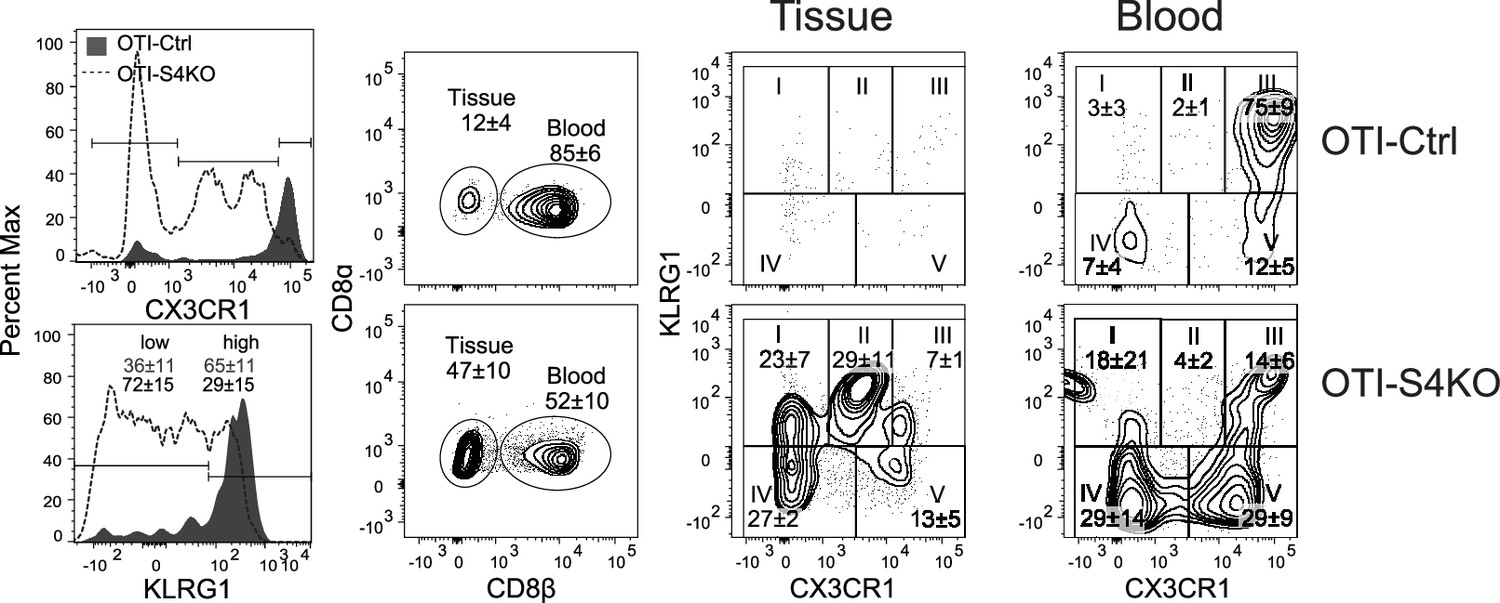
Mixed donor cells (OTI-S4KO and OTI-S4Ctrl) were transferred to C57BL/6 mice before infection with LM-OVA.
Antibodies (CD8β) were injected 3 min before sacrifice. Donor cells in spleens were analyzed for KLRG1 and GFP (CX3CR1) expression at 34 dpi. Histograms show total donor cells from OTI-S4KO (dashed line) and OTI-S4Ctrl mice (continuous line). Contour plots show donor cells in the white (left) and red (right) pulp of the spleen. Data are means ± standard deviation (SD) (n = 3-4/group). Two independent experiments gave similar results. p values were calculated using Student’s t tests.
Figure 1—figure supplement 3
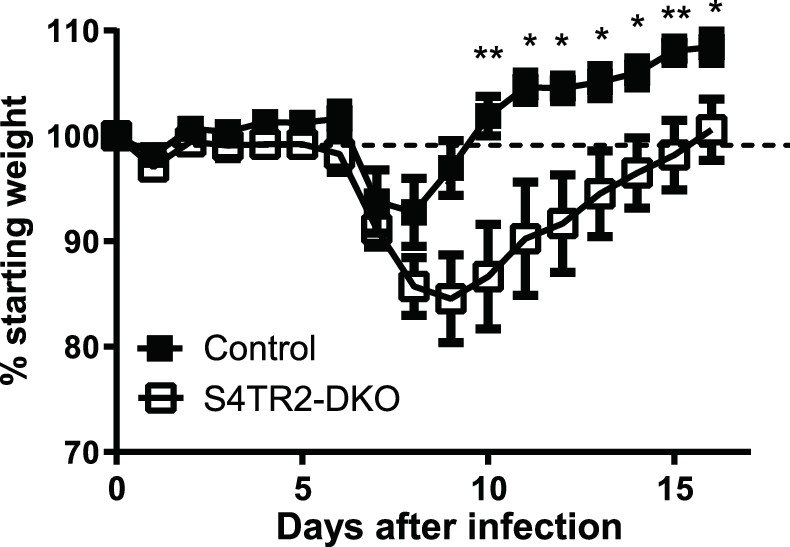
Weight changes in S4TR2-Ctrl (filled squares) and S4TR2-DKO mice (open squares) after primary infection with X31-OVA (H3N2 serotype).
Weight loss is shown as % change from baseline (day 0). Symbols indicate statistical comparisons with controls *p < 0.05, **p < 0.01. Combined data from two experiments are shown (n=7-9). Data are means ± S.D. p values were calculated using Student’s t tests.
Figure 1—figure supplement 4
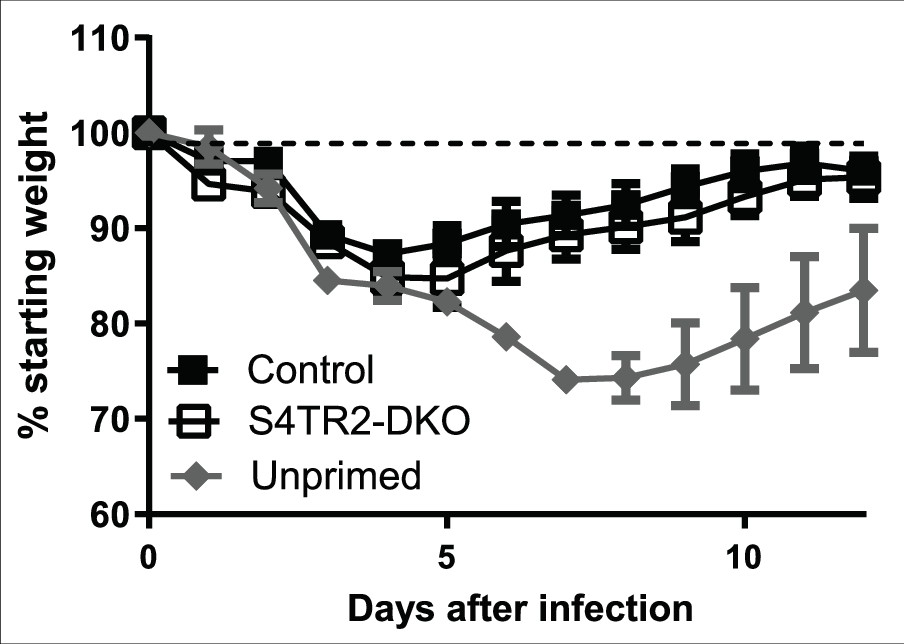
Weight changes in S4TR2-Ctrl (filled squares) and S4TR2-DKO mice (open squares) after secondary infection with WSN-OVAI (H1N1 serotype).
UP = unprimed mice. Combined data from two experiments are shown (n=7-9). Data are means ± S.D. p values were calculated using Student’s t tests.
Figure 2 with 2 supplements
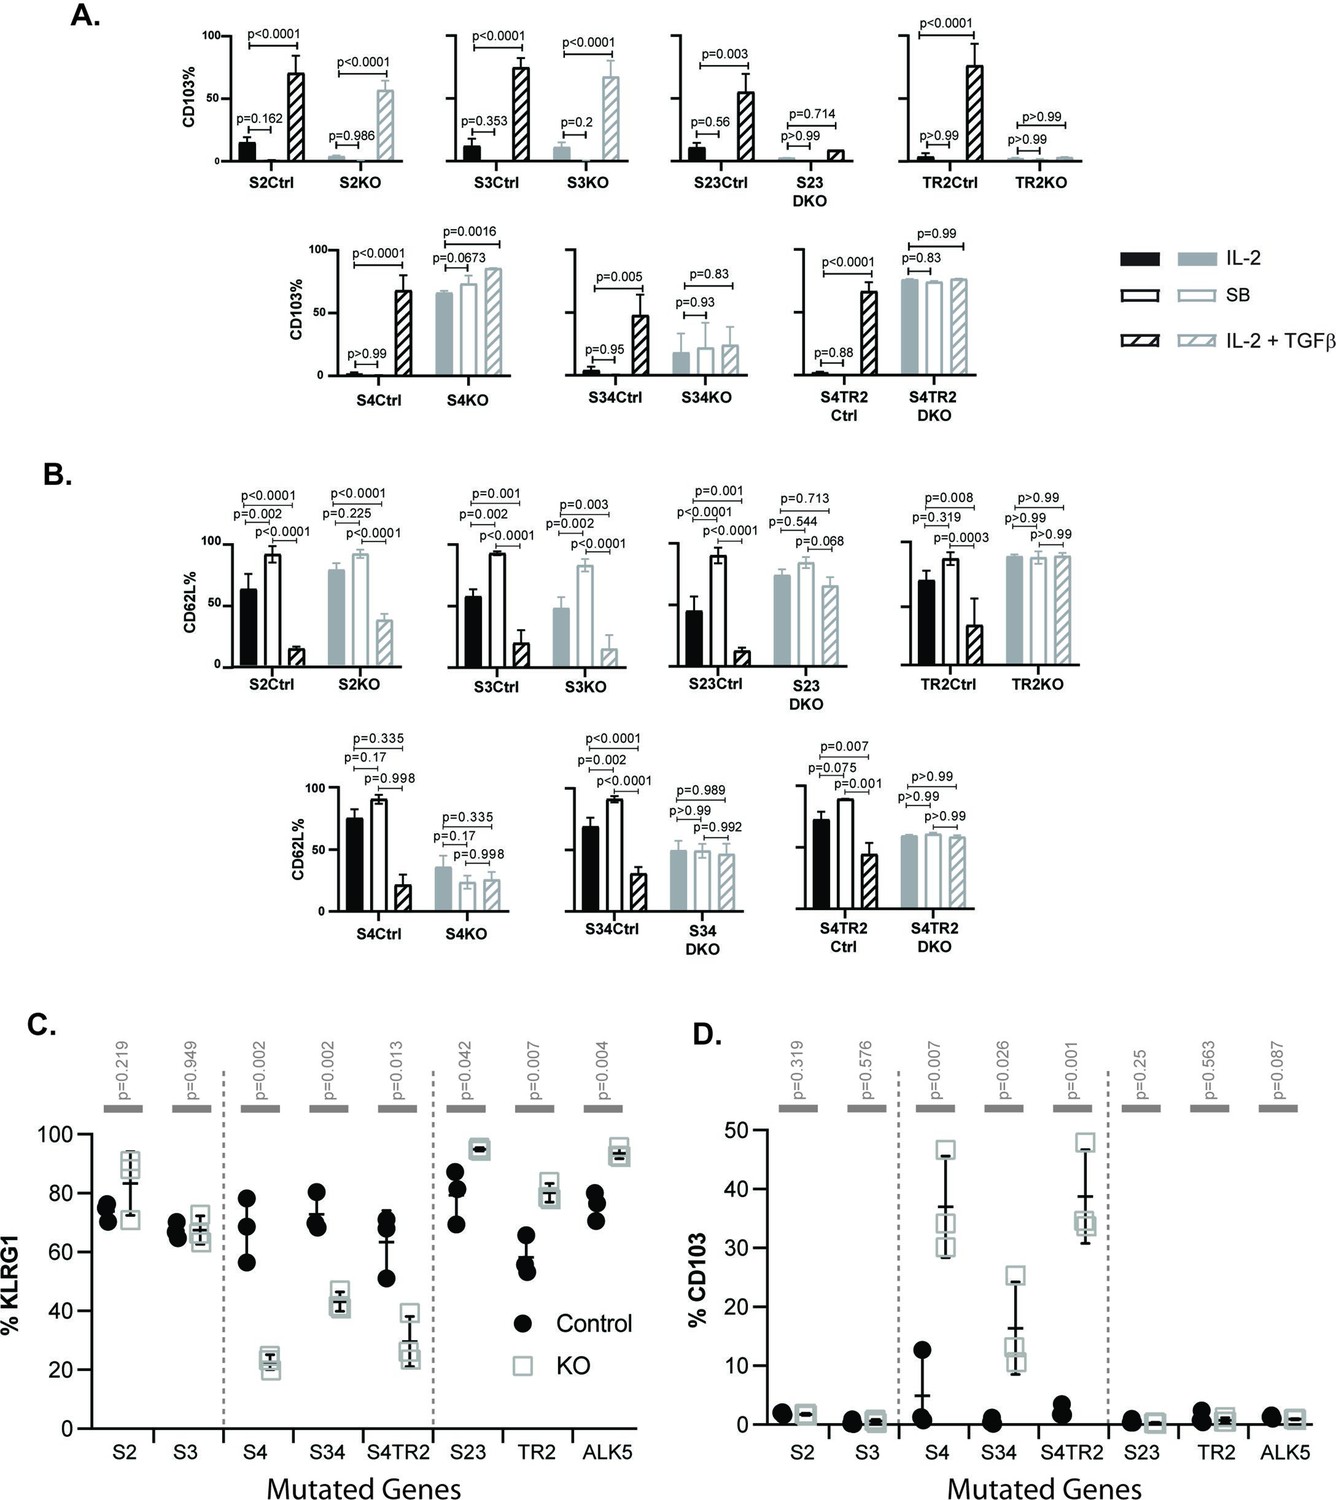
SMAD4 influences the fate decisions of pathogen-specific cytotoxic T lymphocytes (CTLs) independently of R-SMAD2/3.
(A, B) Naive CD8 T cells from genetically modified mice were activated in vitro and stimulated with cytokines. Selected wells were supplemented with SB431542 (10 μM). Bars show CTLs stimulated with rIL-2 alone (no fill), rIL-2 plus SB431542 (gray fill), and rIL-2 plus transforming growth factor β (TGFβ) (hatched). Data are means ± standard deviation (SD) (3 mice per group). p values were calculated using Student’s t tests. Two independent experiments produced similar results. (A) Percentages of CTLs that expressed CD103 at 96 hr after T cell receptor (TcR) stimulation. (B) Percentages of CTLs that expressed CD62L at 96 hr after TcR stimulation. (C, D) Different strains of genetically modified (empty squares) and control mice (filled circles) were infected (i.v.) with LM-OVA and at 8 dpi OVA-specific CTLs in the spleen were analyzed with MHCI tetramers. Data are means ± SD (n=3 per group). p values were calculated using two-way ANOVA and statistical comparisons were made using Tukey’s multiple comparisons test. Two independent experiments produced similar results. (C) Scatter plot shows tetramer+ CTLs analyzed for KLRG1 expression. (D) Scatter plot shows tetramer+ CTLs analyzed for CD103 expression.
Figure 2—figure supplement 1
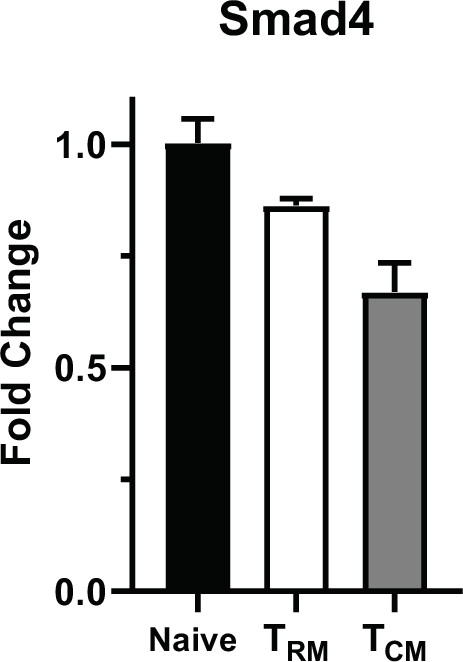
C57BL/6 mice were infected with X31-OVA TRM and TCM cells were isolated from the lungs and spleens at 60 dpi.
qPCR was used to measure Smad4 transcripts. The data are means ± standard deviation (SD) (n = 3).
Figure 2—figure supplement 2
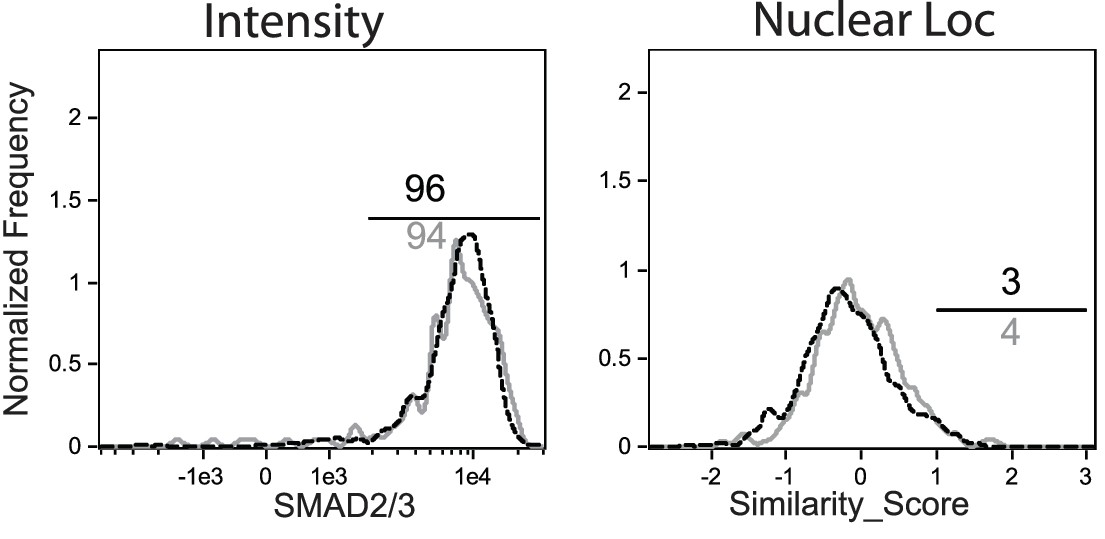
OTI-S4Ctrl and OTI-S4KO were transferred to C57BL/6 mice before infection with LM-OVA.
Donor cells were analyzed for R-SMAD2/3 expression at 8 dpi. Overlaid histograms show similar R-SMAD2/3 intensity (left) and nuclear localization (right) for OTI-S4Ctrl (gray line) and OTI-S4KO (dashed line) cells.
Figure 3

The transcriptional profile of SMAD4-deficient cytotoxic T lymphocytes (CTLs) resembles a TRM phenotype.
(A–C) OTI-S4Ctrl and OTI-S4KO were transferred to B6 mice before infection with X31-OVA. Early effector (EE) cells were analyzed 6 dpi, using RNA isolated from pools of three spleens. Samples were analyzed in triplicate (total n = 9/group). (A) Differentially expressed genes are ranked according to fold change in OTI-S4KO cells. (B) OTI-S4KO cells expressed Eomes and Sell at reduced levels while Itgae was induced. (C, D) The transcriptional profile of OTI-S4KO cells was compared with published datasets. (C) Comparison with IEL analyzed 7 dpi (GSE107395). (D) Comparisons with TRM cells in brain (GSE39152), TRM, and TEM cells in liver (GSE70813), TCM cells in spleen (GSE70813), and in vitro activated CTLs (GSE125471). Color scale indicates normalized enrichment scores (NESs) and circles indicate false discovery rates (FDRs). (E) S4Ctrl (top graph) and S4KO cells (bottom graph) were analyzed for Itgae transcripts at 72 and 96 hr after T cell receptor (TcR) stimulation. Bars are cells stimulated with rIL-2 alone (filled bars) and rIL-2 plus transforming growth factor β (TGFβ) (hatched bars). Samples were analyzed in triplicate. Two independent experiments gave similar results. (F) Cultured CTLs were analyzed for Hobit transcripts at 96 hr after TcR stimulation. Bars show cells stimulated with rIL-2 alone (filled bars), and rIL-2 plus ALK5 inhibitor (white bars). Samples were analyzed in triplicate. Two independent experiments gave similar results. (G) qPCR was used to measure Klrg1 transcripts in OTI-S4KO and OTI-S4Ctrl cells at 8dpi with LM-OVA. Samples were analyzed in triplicate. Two independent experiments gave similar results. (H) Cultured CTLs were analyzed for Sell transcripts at 96 hr after TcR stimulation. Bars show CTLs stimulated with rIL-2 alone (filled bars) and rIL-2 plus TGFβ (hatched bars). Samples were analyzed in triplicate. Two independent experiments gave similar results. p values were calculated using Student’s t tests.
-
Figure 3—source data 1
Source data for RNA-sequencing from EE cells (OTI-S4KO and OTI-S4Ctrl) analyzed 6 dpi with X31-OVA.
- https://cdn.elifesciences.org/articles/76457/elife-76457-fig3-data1-v3.xlsx
Figure 4 with 1 supplement
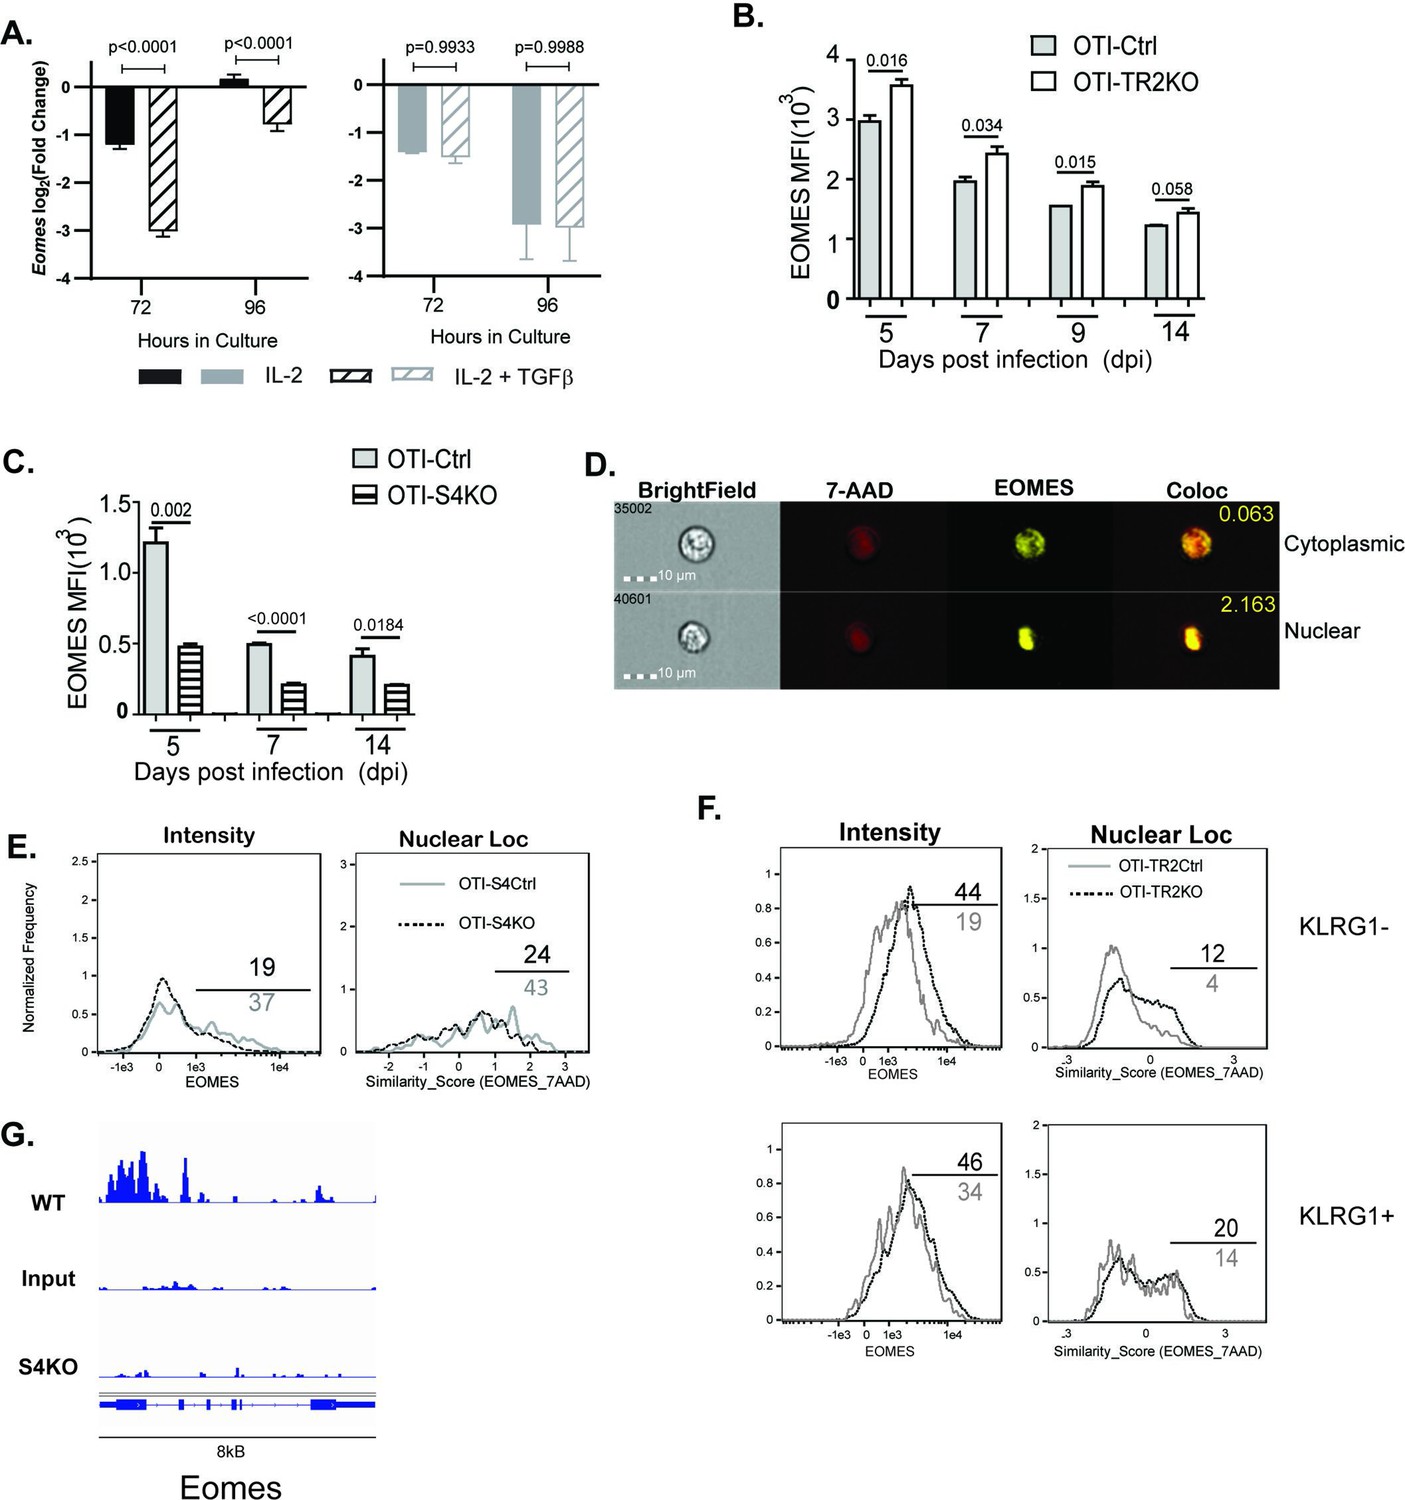
EOMES expression is induced via SMAD4 and downregulated by transforming growth factor β (TGFβ).
(A) S4Ctrl (left) and S4KO (right) cells were analyzed for Eomes transcripts at 96 hr after T cell receptor (TcR) stimulation. Bars show cytotoxic T lymphocytes (CTLs) stimulated with rIL-2 alone (filled bars) and rIL-2 plus TGFβ (hatched bars). Samples were analyzed in triplicate. Two independent experiments gave similar results. p values were calculated using Student’s t tests. (B, C) OTI-S4KO, OTI-S4Ctrl, OTI-S4TR2TKO, and OTI-S4TR2Ctrl cells were transferred to B6 mice before infection with LM-OVA. On different days after infection, donor cells in the spleens were analyzed for EOMES expression by intracellular staining. Data are mean ± standard deviation (SD) (n = 4/group). Two independent experiments gave similar results. p values were calculated using Student’s t tests. (B) EOMES expression (MFI) in OTI-TR2KO (no fill) and OTI-TR2Ctrl (gray fill). (C) EOMES expression (MFI) in OTI-S4KO (hatched) and OTI-S4Ctrl (gray fill). (D–F) Donor cell were transferred to B6 mice before i.n. infection with LM-OVA and analyzed by imaging flow cytometry at 8 dpi. Data are means ± SD, n = 3. (D) Representative staining for EOMES (yellow) and 7-AAD (red). (E) Histograms show EOMES intensity and similarity scores for OTI-S4Ctrl (gray line) and OTI-S4KO (dashed line) cells. (F) Histograms show EOMES intensity and similarity scores for OTI-TR2Ctrl (gray line) and OTI-TR2KO (dashed line) cells. (G) Published ChIP-Seq data from in vitro activated CTLs (GSE135533) were used to identify SMAD4-binding sites in the EOMES locus (8 kb).
Figure 4—figure supplement 1
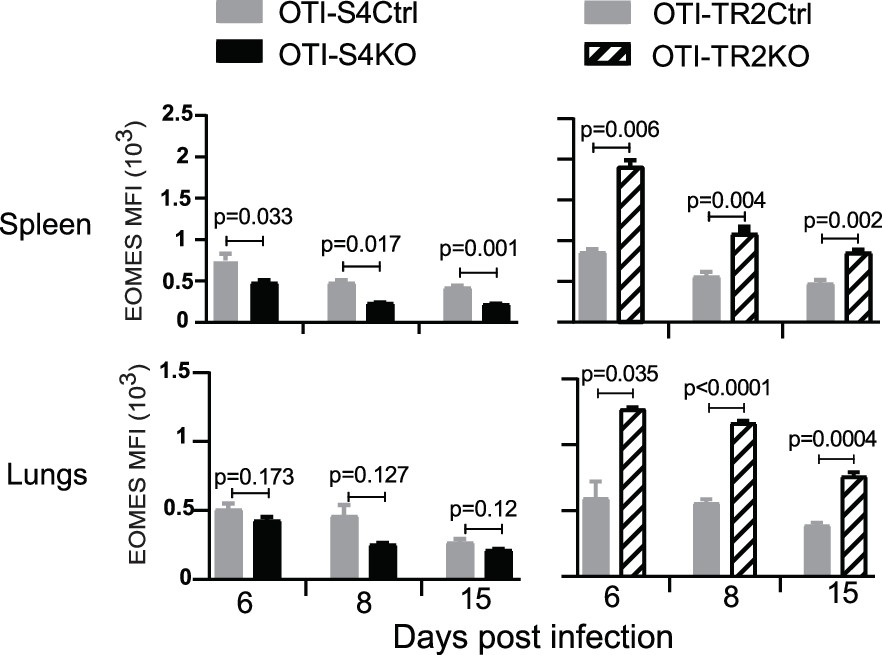
Naive CD8 T cells were transferred to C57BL/6 mice before infection with X31-OVA.
Graphs show EOMES expression (MFI) in OTI-S4KO (black fill) and OTI-TR2KO (cross hatch) cells, with the respective Cre-deficient controls (gray fill). Data are mean ± standard deviation (SD) (n = 4/group). p values were calculated using Student’s t tests.
Figure 5 with 5 supplements

Regulation of EOMES via SMAD4 alters homing-receptor expression.
(A, B) S4KO, EKO, ES4KO (gray), and control mice (black) were activated in vitro and stimulated with cytokines. Graphs show cytotoxic T lymphocytes (CTLs) analyzed 96 hr after T cell receptor (TcR) stimulation. Bars are CTLs stimulated with rIL-2 alone (filled bars), rIL-2 plus SB431542 (no fill), and rIL-2 plus transforming growth factor β (TGFβ) (hatched). Data are means ± standard deviation (SD) (3 mice per group). p values were calculated using Student’s t tests. Two independent experiments produced similar results. (A) Percentages of CD8 T cells that expressed CD103. (B) Percentages of CD8 T cells that expressed CD62L. (C) S4KO, EKO, and ES4KO mice were infected with X31-OVA and anti-viral CTLs were analyzed with MHCI tetramers at 33 dpi. Anti-CD8 antibodies were injected 5 min before sacrifice. Contour plots show OVA-specific CTLs analyzed for CD103 and CD62L expression. (D, E) S4KO and S4Ctrl cells were activated in vitro (48 hr) and transduced with a retroviral vector encoding EOMES (Eomes-IRES-GFP) or the empty vector control (EV-IRES-GFP). (D) GFP+ cells were analyzed for CD103 and CD62L expression after 6 days in culture. (E) S4KO and S4Ctrl cells were transferred to B6 mice that were previously infected (24 hr) with X31-OVA. GFP+ cells in the lungs were analyzed for CD62L and CD103 expression at 35 dpi. Data are means ± SD (3 mice per group). Two independent experiments produced similar results.
Figure 5—figure supplement 1
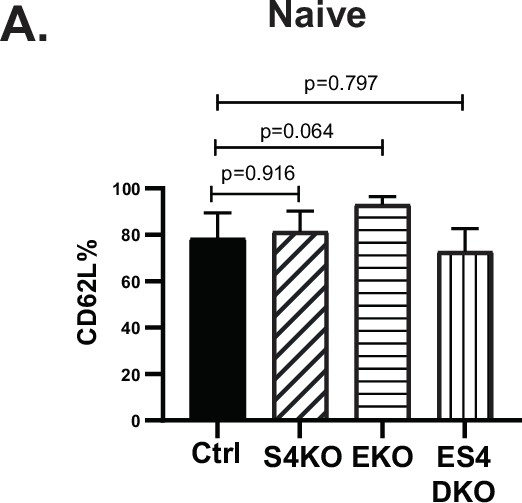
Naive CD8 T cells from gentically modified mice were analyzed for CD62L expression by flow cytometry.
Data are means ± SD (3 mice per group). Two independent experiments produced similar results. p values were calculated using Student’s t tests.
Figure 5—figure supplement 2
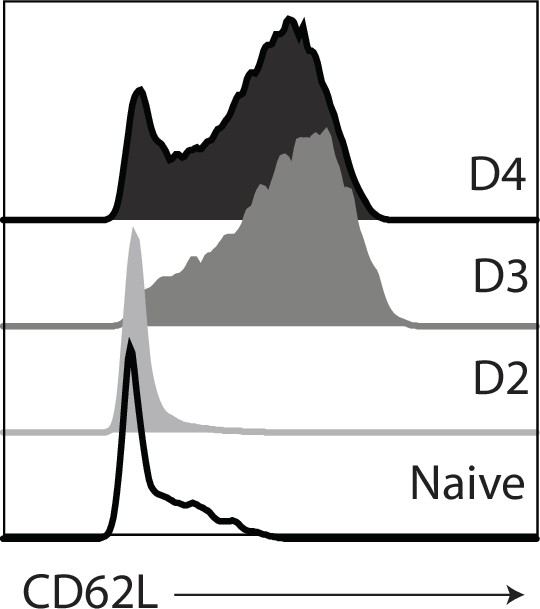
Naive CD8 T cells from the spleens of C57BL/6 mice were stimulated with anti-CD3/28 (plus IL-2).
Histograms show CD62L expression on different days after T cell receptor (TcR) stimulation.
Figure 5—figure supplement 3
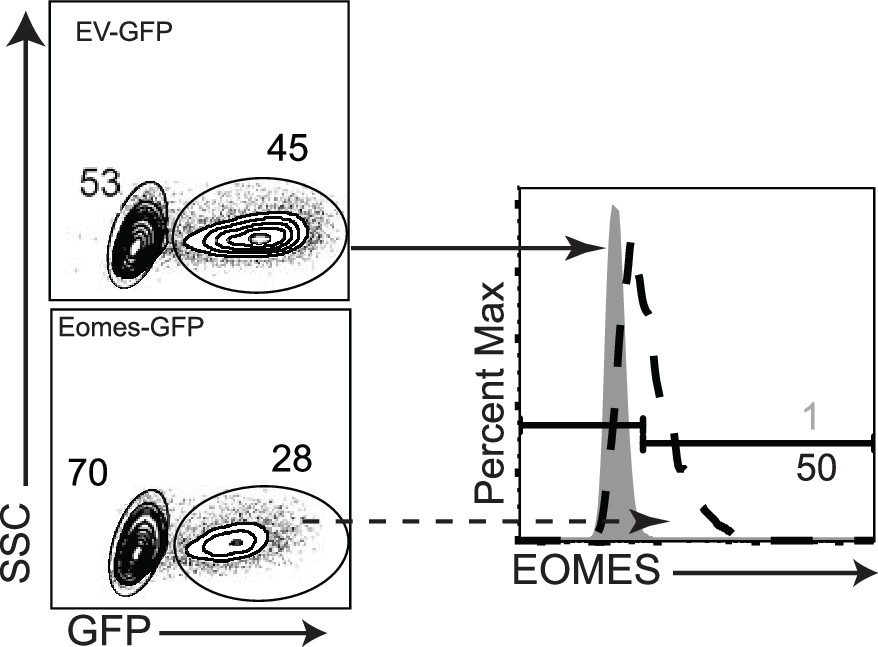
EKO cells were transduced with EOMES-IRES-GFP (dashed lines) or EV-IRES-GFP (gray fill).
Overlaid histograms show EOMES expression in GFP+ cells at 2 days after transduction.
Figure 5—figure supplement 4

S4Ctrl and S4KO CD8 T cells were transduced with EV-IRES-GFP or EOMES-IRES-GFP.
GFP+ cells were analyzed for CD103 (top) and CD62L (bottom) expression at 4 days after transduction.
Figure 5—figure supplement 5

S4KO CD8 T cells were transduced with EV-IRES-GFP or SMAD4-IRES-GFP.
GFP+ cells were analyzed for CD103 and CD62L expression at 4 days after transduction.
Figure 6
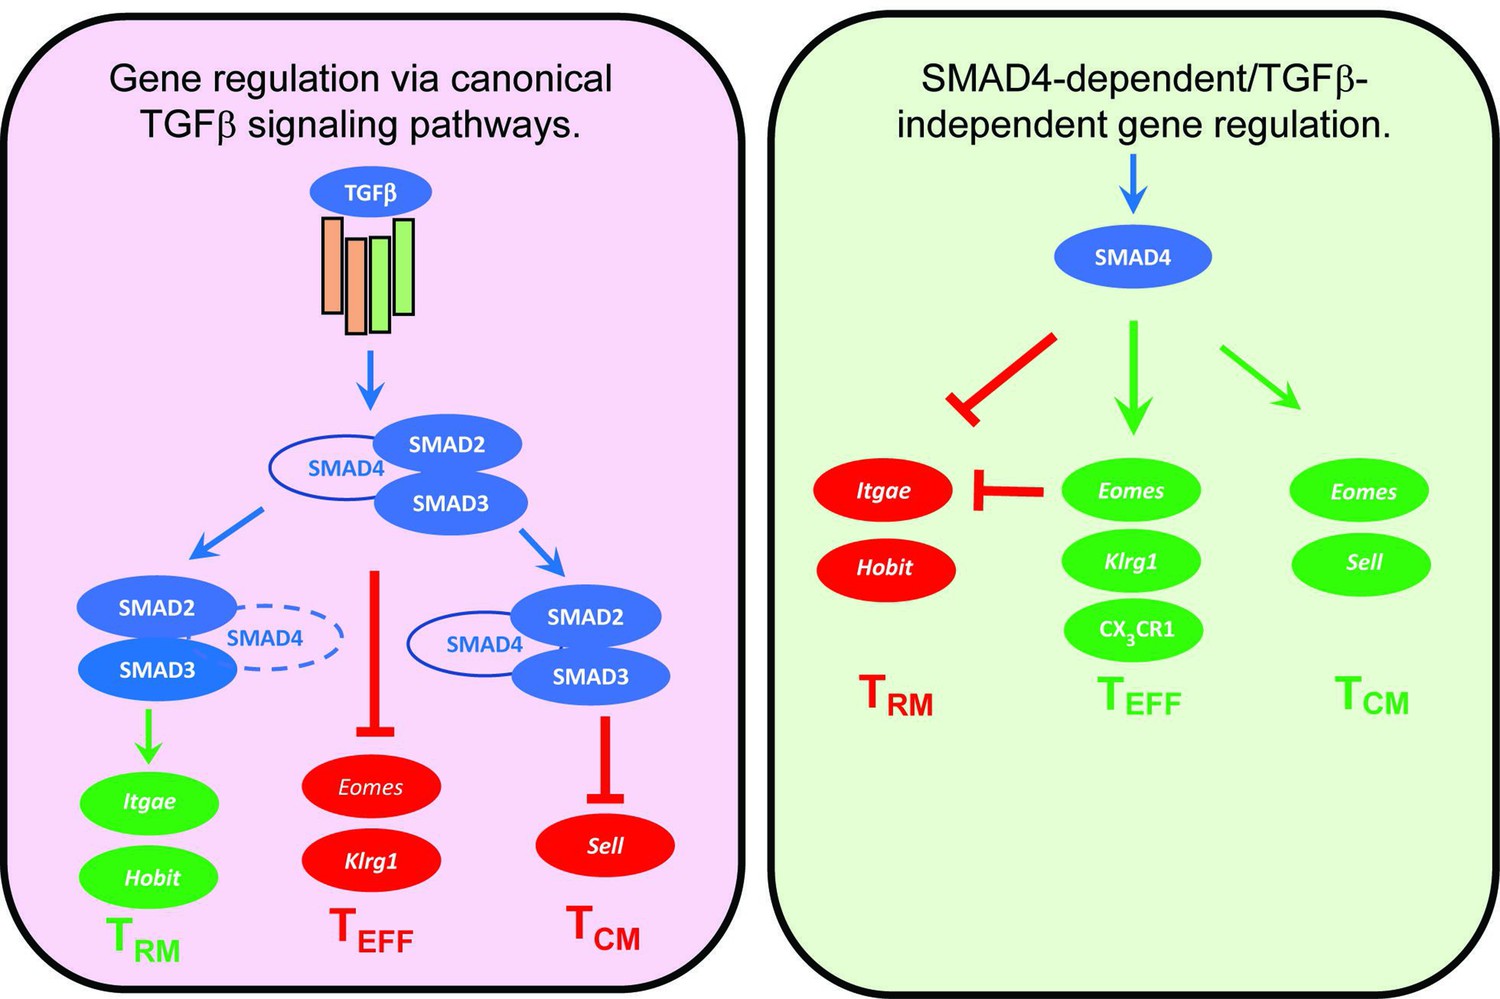
Genes that are cooperatively regulated by SMAD4 and transforming growth factor β (TGFβ).
Diagram shows reciprocal changes in gene expression as CTLs are modified via SMAD-dependent signaling pathways.
Additional files
-
Supplementary file 1
Primer sequences for qPCR.
- https://cdn.elifesciences.org/articles/76457/elife-76457-supp1-v3.xlsx
-
Supplementary file 2
p values for Figure 1A, B.
- https://cdn.elifesciences.org/articles/76457/elife-76457-supp2-v3.xlsx
-
Transparent reporting form
- https://cdn.elifesciences.org/articles/76457/elife-76457-transrepform1-v3.docx
Download links
A two-part list of links to download the article, or parts of the article, in various formats.
Downloads (link to download the article as PDF)
Open citations (links to open the citations from this article in various online reference manager services)
Cite this article (links to download the citations from this article in formats compatible with various reference manager tools)
SMAD4 and TGFβ are architects of inverse genetic programs during fate determination of antiviral CTLs
eLife 11:e76457.
https://doi.org/10.7554/eLife.76457


