Steroid hormone signaling activates thermal nociception during Drosophila peripheral nervous system development
- Department of Physiology, Department of Biochemistry and Biophysics, University of California, San Francisco, United States
- Howard Hughes Medical Institute, United States
- Department of Developmental Biology, Washington University Medical School, United States
Figures
Figure 1 with 1 supplement
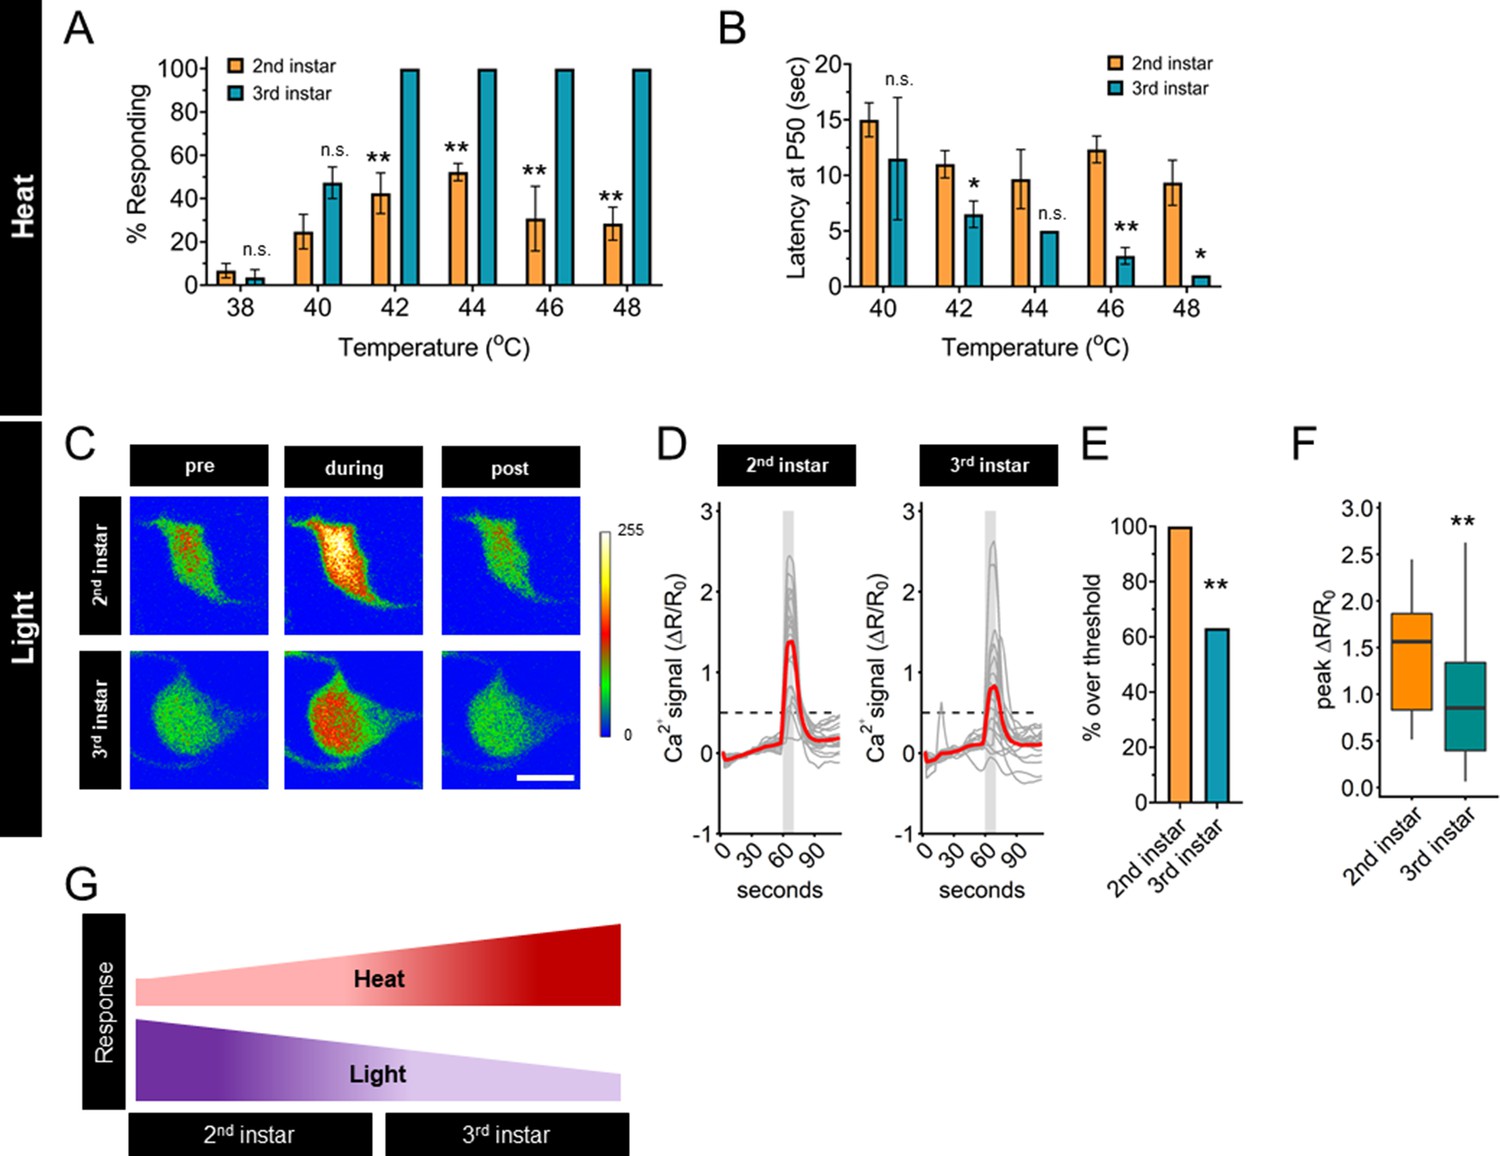
Thermal nociception behaviors increase during larval development, while UV-A light response decreases.
(A) Groups of age-matched control larvae were touched with a thermal probe at different temperatures. The nociceptive response was scored if a 360° roll occurred during 20 s of stimulus. (B) Latency by which 50% of the responding population of larvae has had a nociceptive behavior response. (C) Representative GCaMP6s images of second and third instars in soma Class IV dendritic arborization (C4da) neurons. Scale bar = 10 μm. Periods of UV-A treatment program: Pre = before UV-A stimulus. During = period of UV-A light stimulus. Post = after the end of UV-A stimulus. (D) Individual traces (gray lines) and means (red lines) of Ca2+ activity calculated by ratiometric change from baseline. Gray column indicates period of UV-A stimulus. Dotted line indicates threshold level for % over threshold calculations. (E) Percent of soma with Ca2+ activity over the threshold level. (F) Peak Ca2+ activity during the periods of UV-A treatment programs. (G) Heat and light development have opposite trends during larval development. (A) n = 2–4 staging replicates of 15–20 larvae were tested for each age and temperature. (C–F) Second instar n = 21 neurons. Third instar n = 19 neurons. (A, B) Student’s t-test. (E) Fisher’s exact test, one-sided. (F) Student’s t-test. *p < 0.05, **p < 0.01.
Figure 1—figure supplement 1
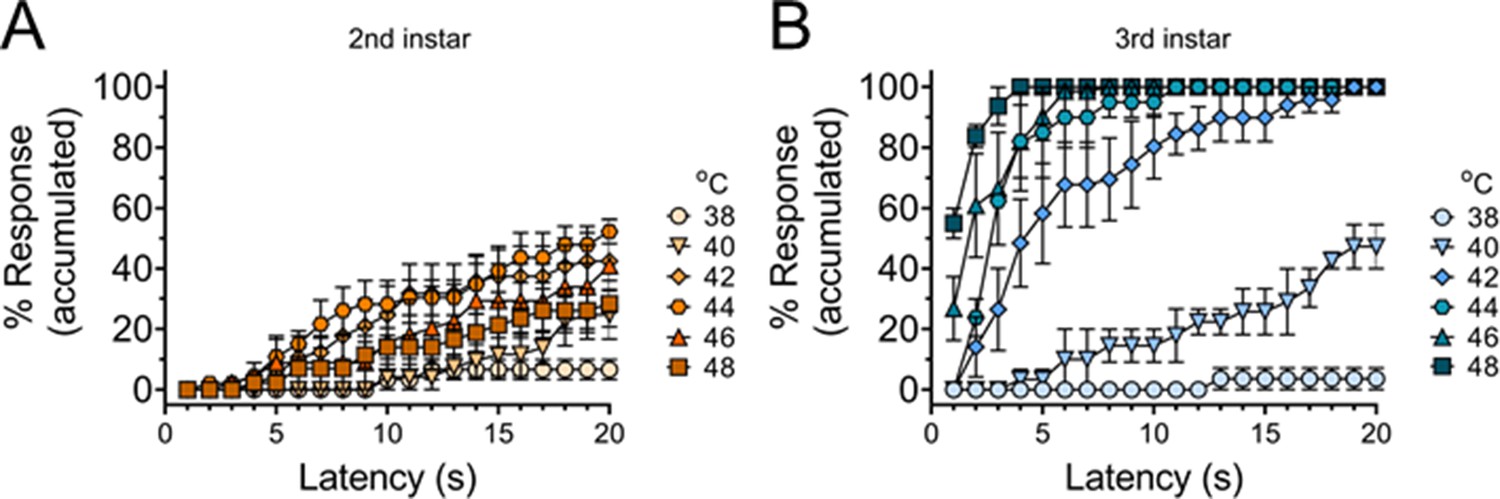
Thermal nociceptive sensitivity increases across temperatures from second to third instar.
Accumulated curve of percentage larvae that will have exhibited the nociceptive behavior by the length of time experiencing the stimulus (latency in seconds). (A) Percentage of second instar larvae that will have had the nociceptive behavior at the latency response time. (B) Percentage of third instar larvae that will have had the nociceptive behavior at the latency response time. Quantification of data from Figure 1A. n = 2–4 staging replicates of 15–20 animals were tested for each age and temperature.
Figure 2 with 1 supplement
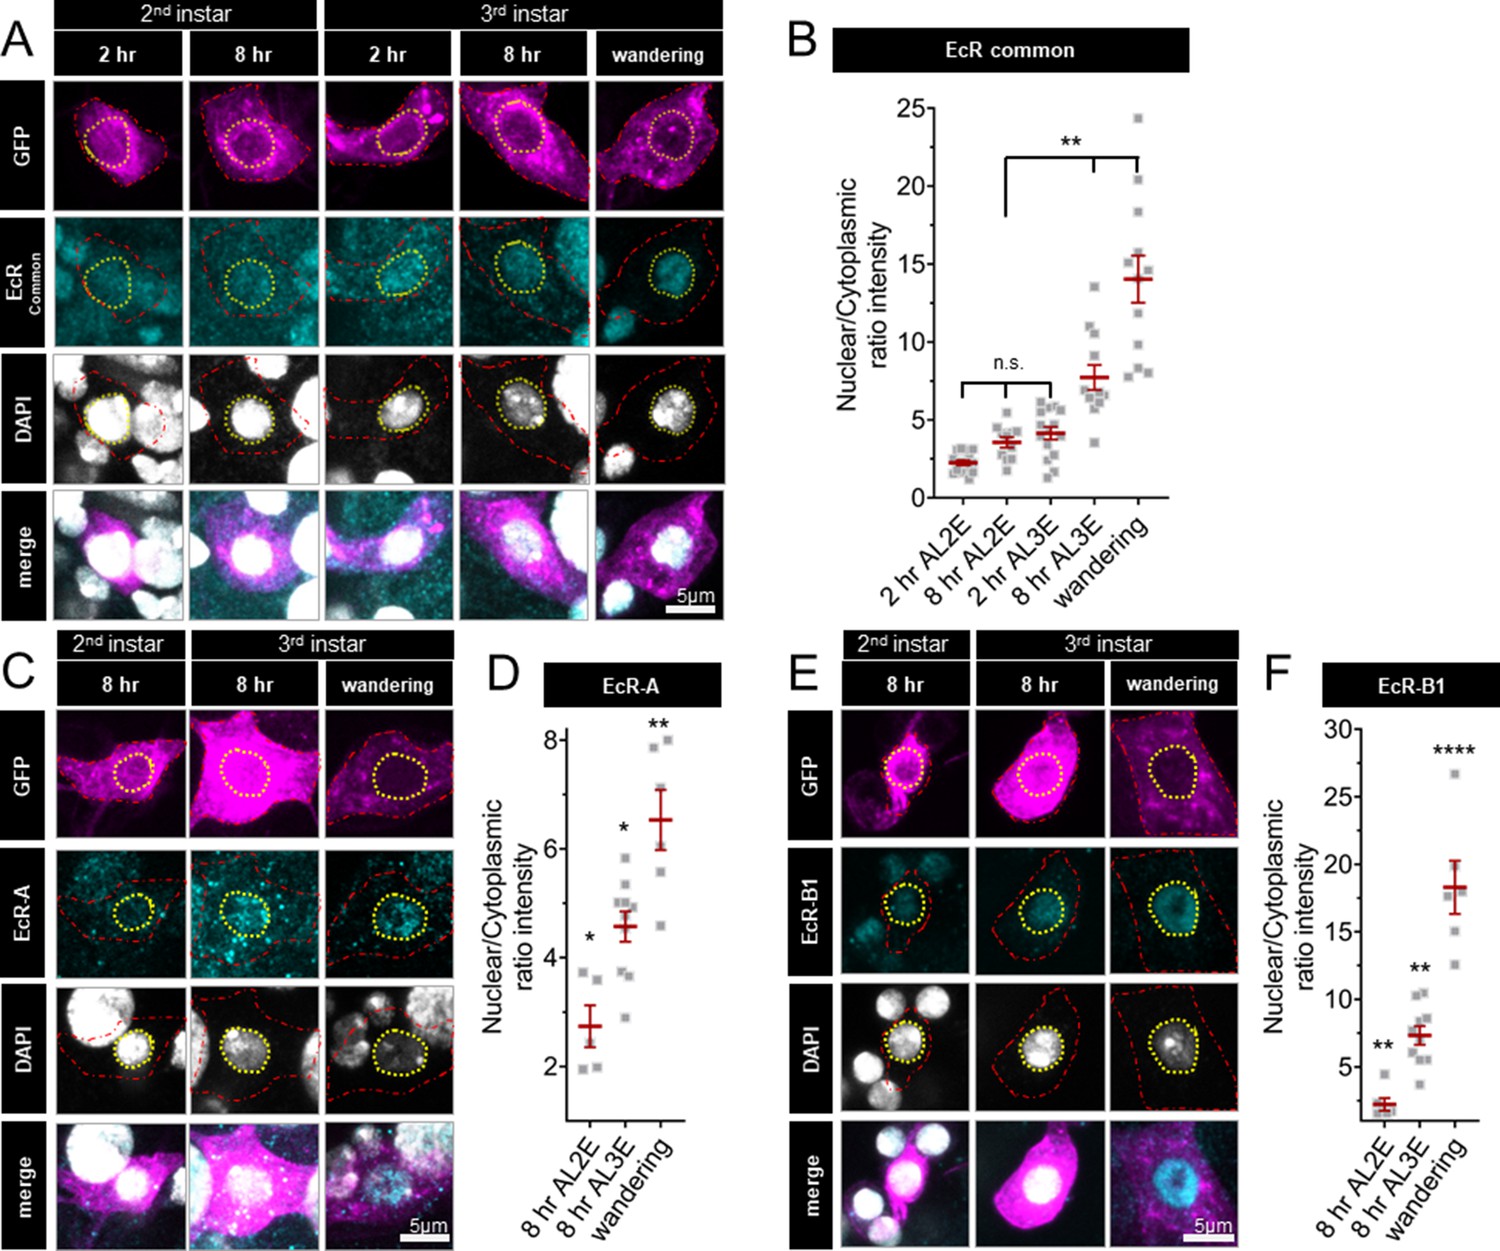
Ecdysone receptor (EcR) nuclear localization in Class IV dendritic arborization (C4da) neurons increases early during the third instar.
(A) EcR immunohistochemistry with EcR-common antibody (C) EcR-A antibody, and (E) EcR-B1 antibody. Red dashed line outlines C4da neurons and yellow dashed line indicates position of nucleus. C4da neurons are labeled by ppktd-GFP. EcR nuclear localization quantified by nuclear to cytoplasmic ratio of intensity with (B) EcR-common and (D) EcR-A, and (E) EcR-B1 antibody. After L2 Ecdysis (AL2E), After L3 Ecdysis (AL3E). One-way analysis of variance (ANOVA) with Bonferroni post test. *p < 0.05, **p < 0.01, ****p < 0.0001.
Figure 2—figure supplement 1
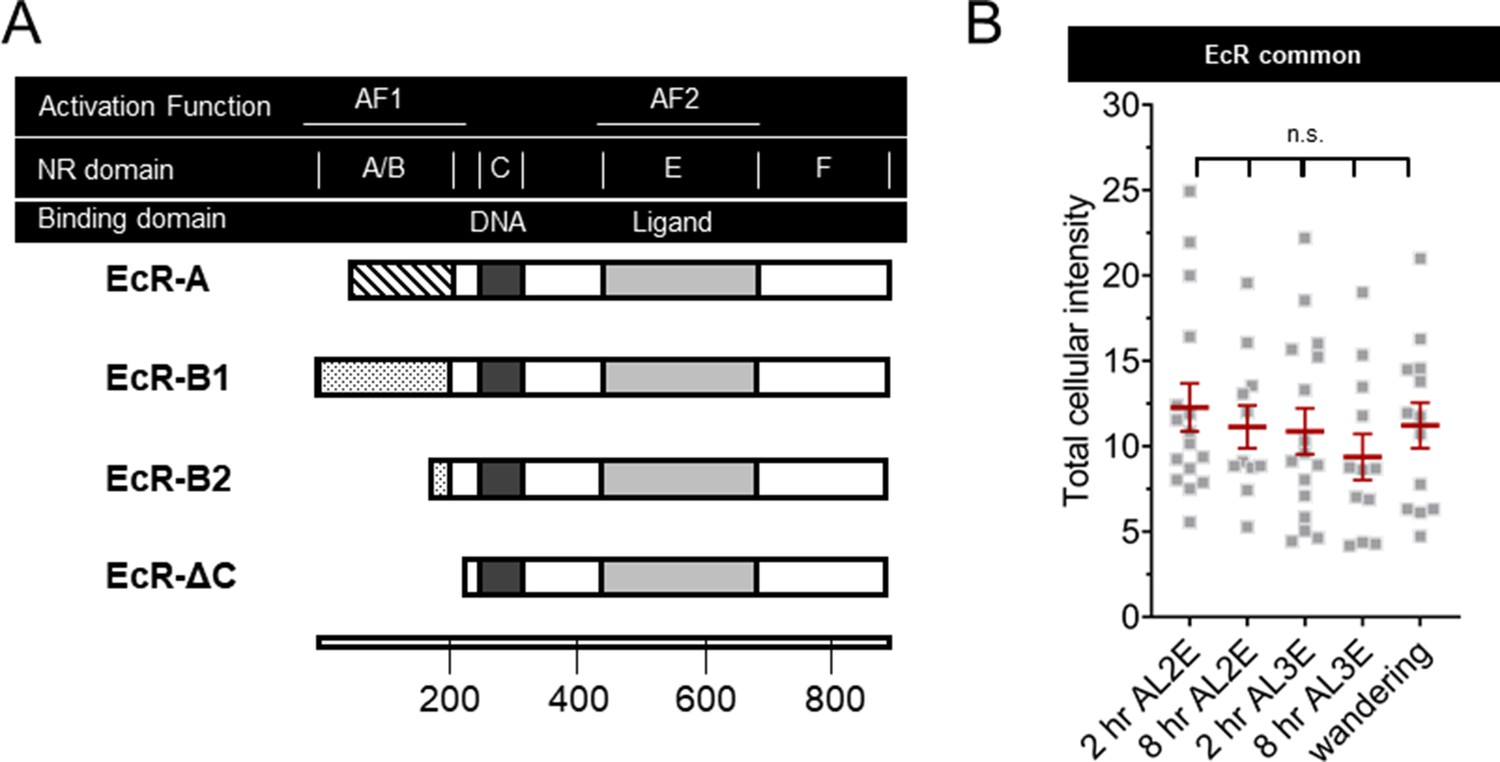
Domains of ecdysone receptor (EcR) isoforms and total EcR in Class IV dendritic arborization (C4da) neuron early during the second and third instars.
(A) EcR domain structures. Activation function (AF) and nuclear receptor (NR) domains along with DNA (dark bar) and ligand- (light bar) binding domains. All EcR isoforms have identical sequences except for the A/B NR domain which contains AF1 function. EcR-ΔC is a synthetic isoform containing only sequences present in all isoforms. Scale in amino acid residues. (B) EcR immunohistochemistry with EcR-common antibody quantifying total intensity in both the nucleus and cytoplasm. One-way analysis of variance (ANOVA) with Bonferroni post test.
Figure 3
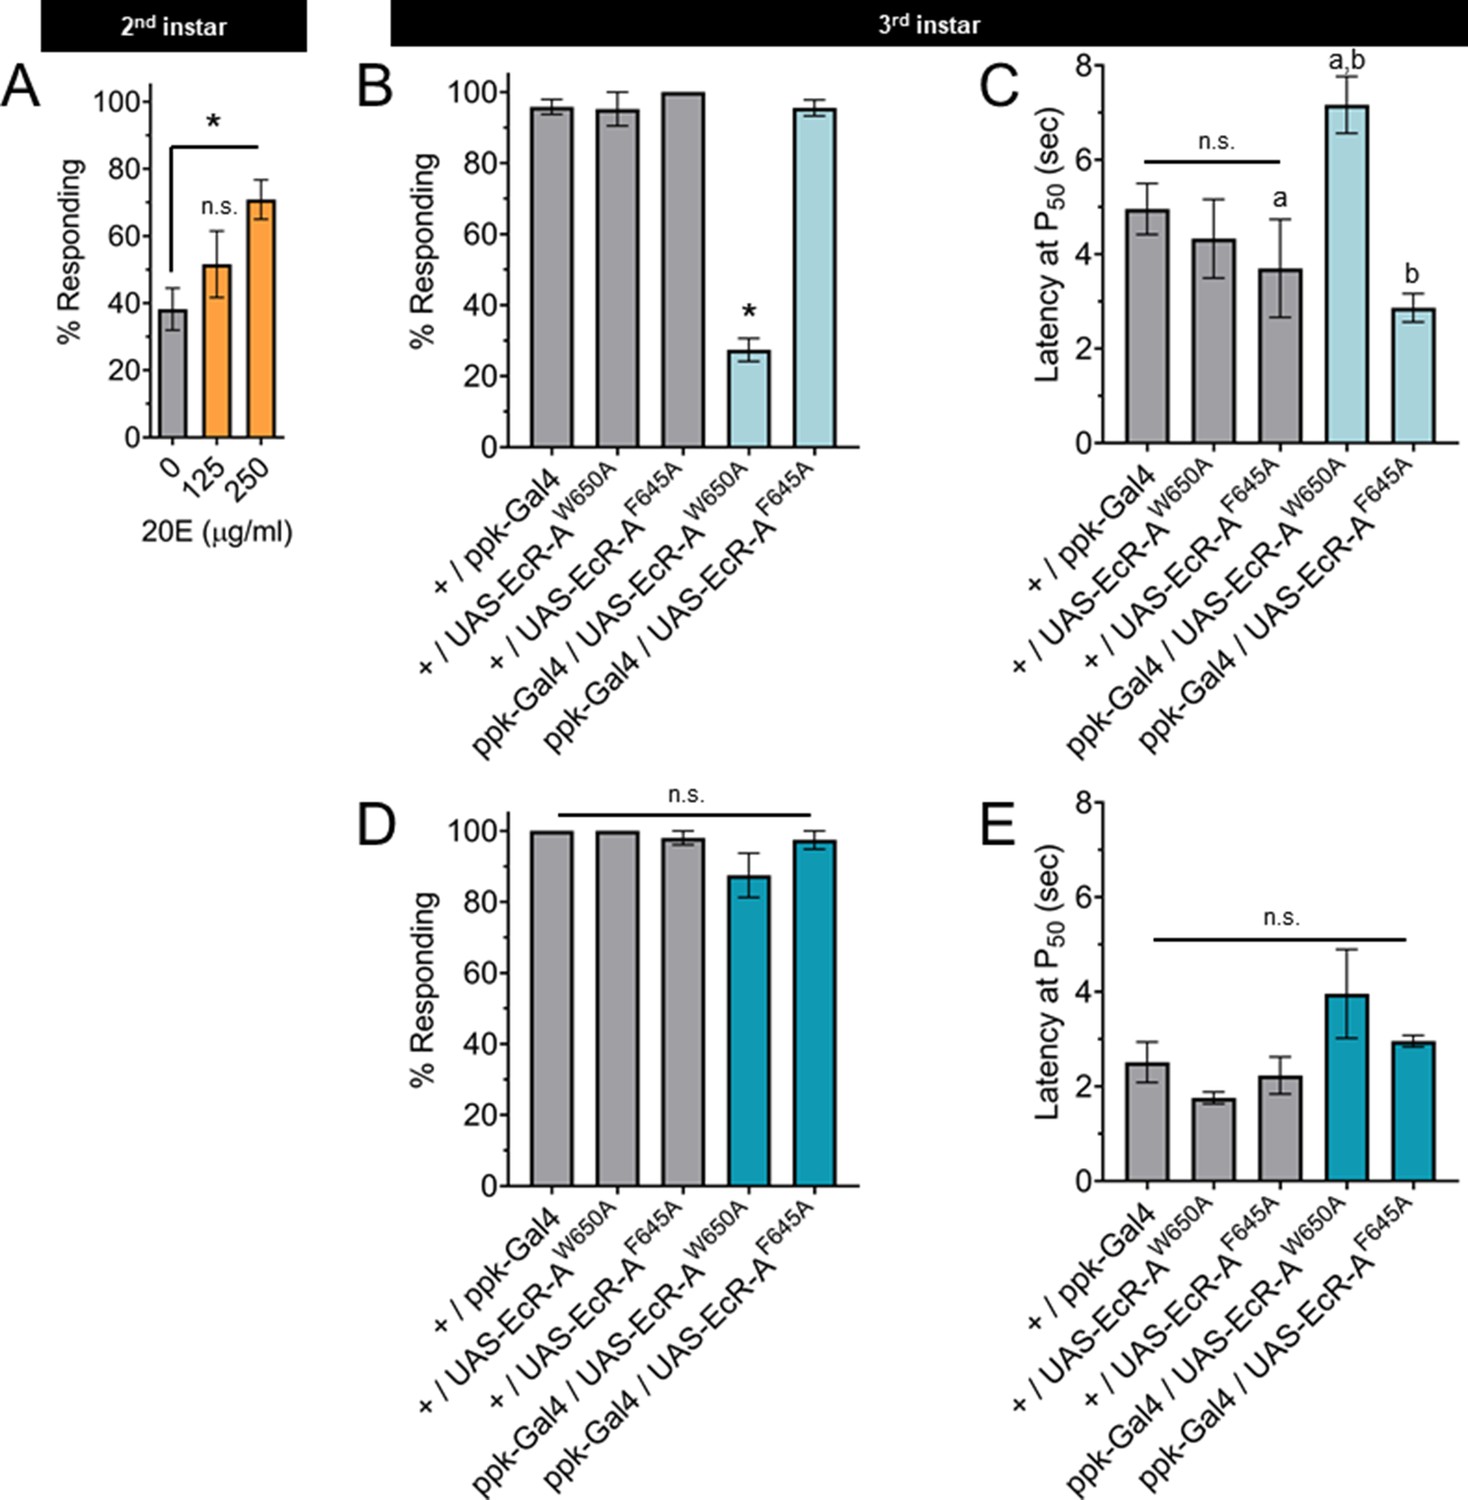
The nociceptive transition is ecdysone ligand activity dependent.
(A) Percent of second instar larvae population displaying nociceptive behavior when fed 20-hydroxyecdysone (20E). (B, D) Percent of population displaying nociceptive behavior when overexpressing ligand-binding mutant ecdysone receptor (EcR)-A (ppk-Gal4/UAS-EcR-A -W650A), or coactivator mutant EcR-A (ppk-Gal4/UAS-EcR-A-F645A). Third instar larvae with (B) 42°C nociceptive probe or (D) 46°C nociceptive probe. (C, E) Latency by which 50% of the responding population displaying nociceptive behavior when overexpressing mutant EcR-A. Third instar larvae with (C) 42°C nociceptive probe or (E) 46°C nociceptive probe. One-way analysis of variance (ANOVA) with Tukey’s post test. *, a, or b = p < 0.05. (A) n > 35 larvae for each treatment. (B) n = 2–4 staging replicates of 15–20 larvae were tested for each genotype.
Figure 4 with 2 supplements
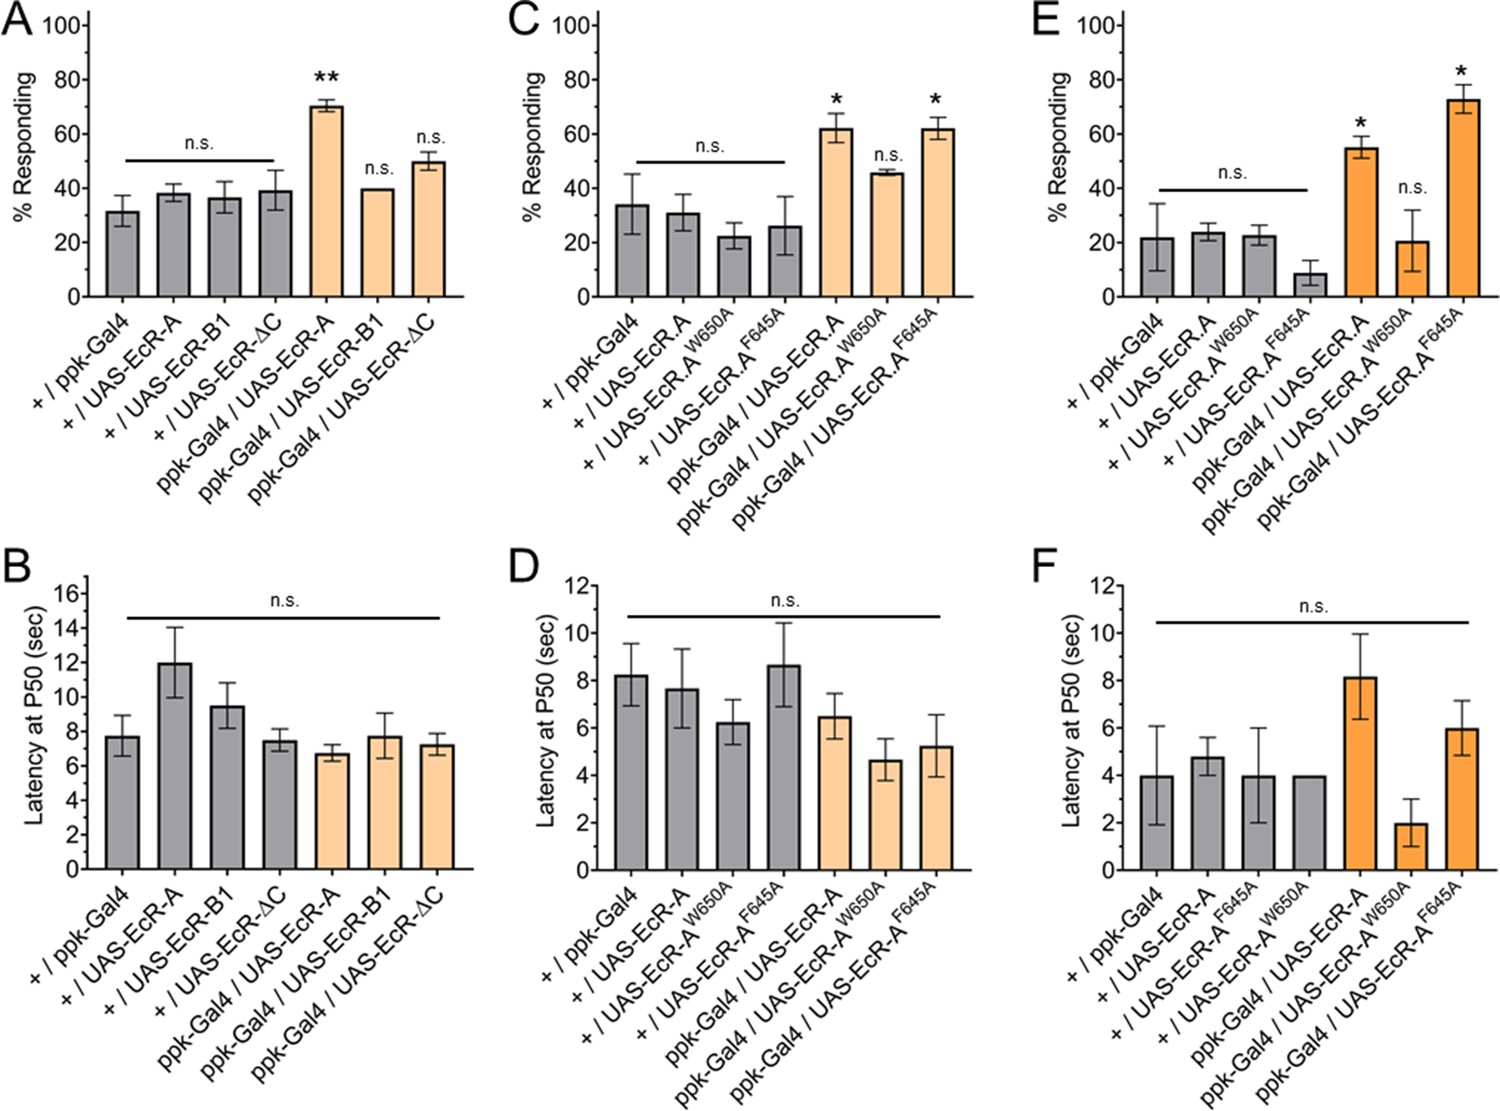
Ecdysone receptor (EcR)-A overexpression in Class IV dendritic arborization (C4da) neurons increases thermal nociception in the second instar.
(A) Nociceptive behavior in second instar larvae with EcR isoforms overexpressed in C4da neurons. (C, E) Nociceptive behavior in second instar larvae with overexpression of EcR-A mutants. Ligand-binding mutant EcR-A (ppk-Gal4/UAS-EcR-W650A), or coactivator mutant EcR-A (ppk-Gal4/UAS-EcR-F645A). (B, D, F) Second instar latency by which 50% of the responding population displaying nociceptive behavior when overexpressing wild-type or mutant EcR-A. (A–D) 42°C nociceptive probe and (E, F) 46°C nociceptive probe. One-way analysis of variance (ANOVA) with Tukey’s post test. *p < 0.05, **p < 0.01. n = 2–4 staging replicates of 15–20 larvae were tested for each genotype.
Figure 4—figure supplement 1
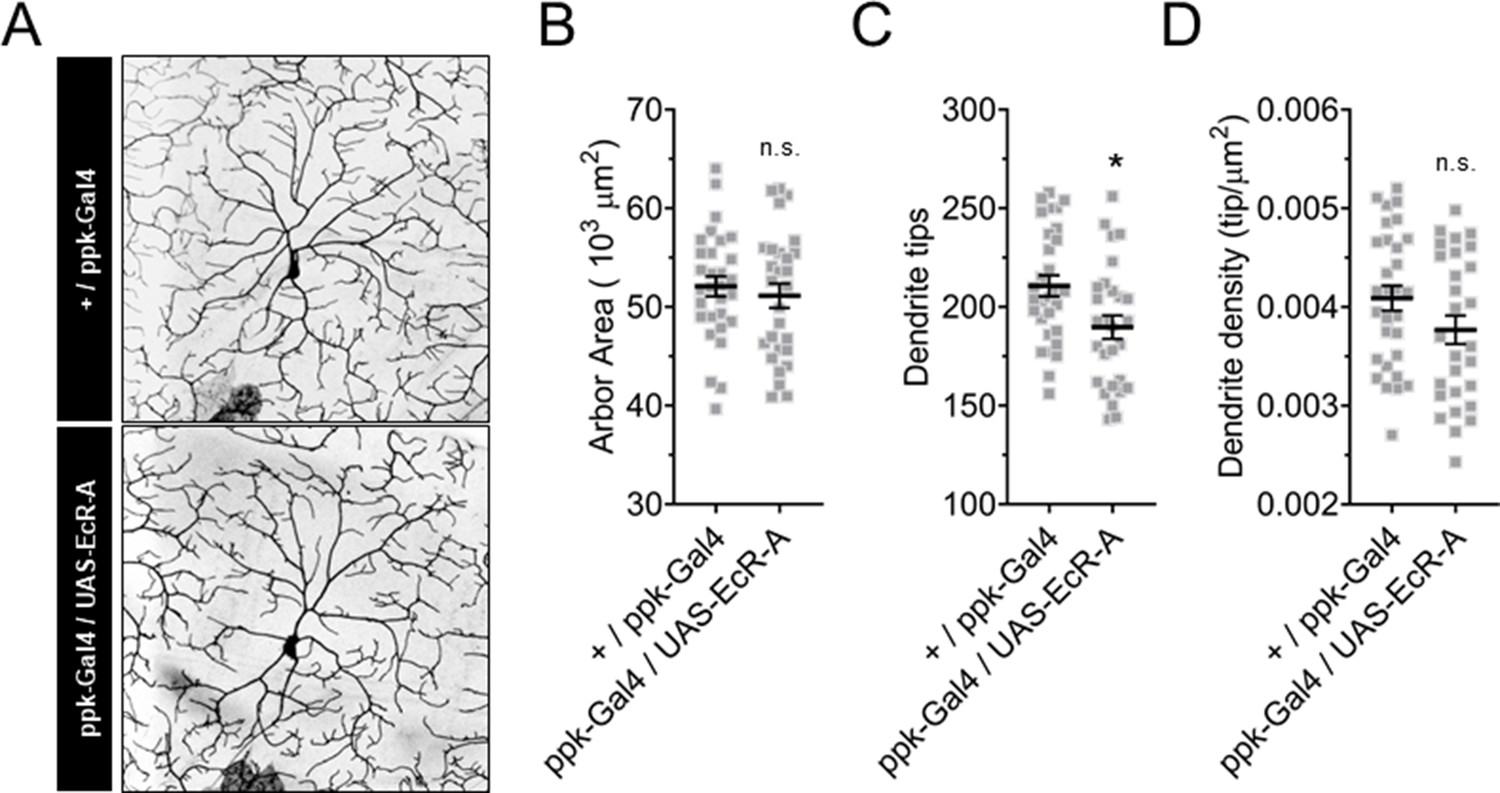
Ecdysone receptor (EcR)-A overexpression in Class IV dendritic arborization (C4da) neurons reduces dendrite tip number in the second instar.
(A–D) Second instar C4da neuron arbors overexpressing wild-type EcR-A. (A) Representative images of second instar C4da neuron arbors. (B) Second instar C4da neuron arbor area. (C) Second instar C4da neuron dendrite tip number. (D) Second instar C4da neuron dendrite density. (E, F) Student’s t-test. *p < 0.05. n = 2 staging replicates of 30 and 28 larvae were tested for each genotype, respectively.
Figure 4—figure supplement 2
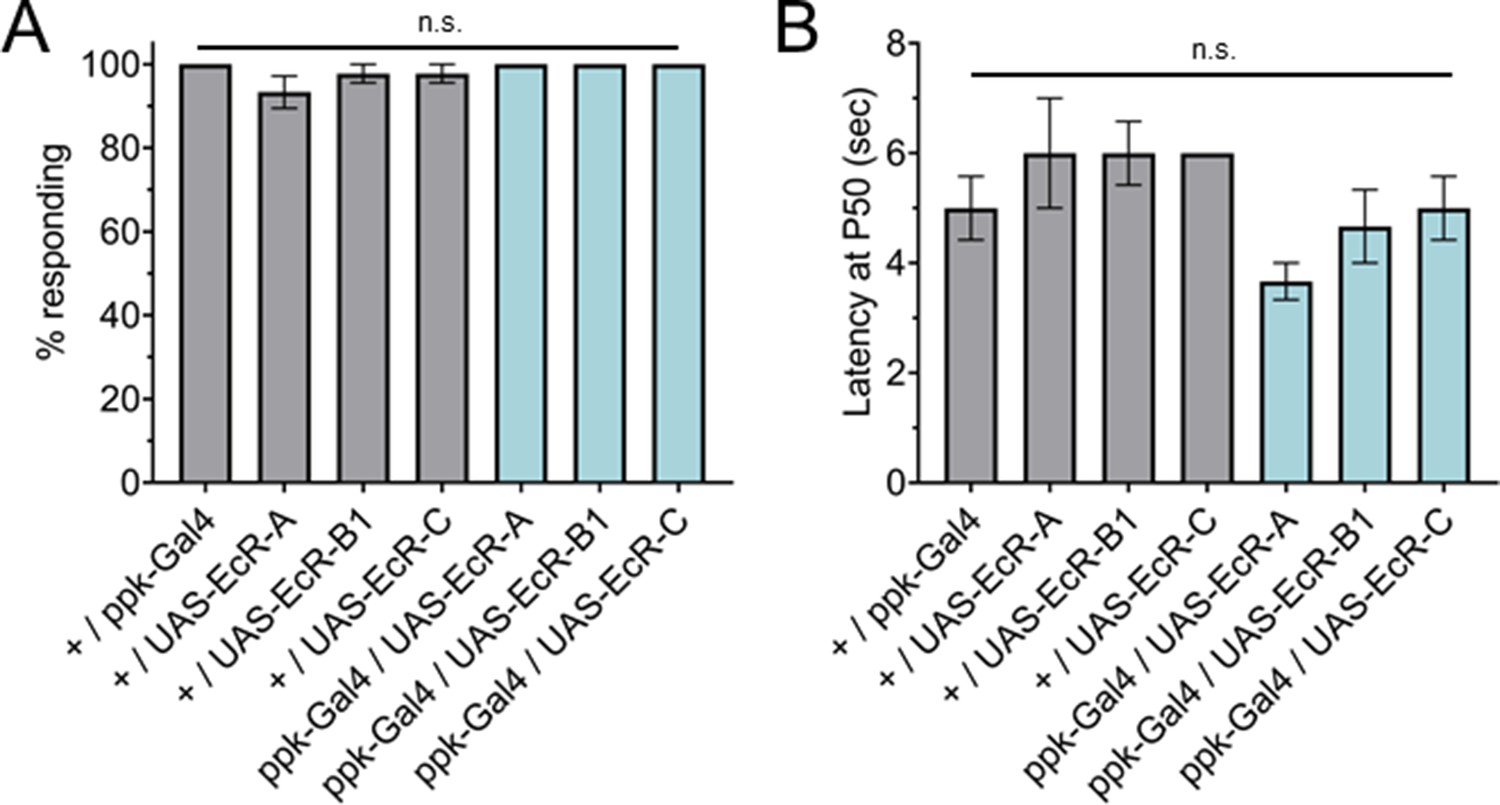
Ecdysone receptor (EcR) isoform overexpression in Class IV dendritic arborization (C4da) neurons does not change thermal nociception in the third instar.
(A) Nociceptive behavior in third instar larvae with EcR isoforms overexpressed in C4da neurons. (B) Third instar latency by which 50% of the responding population displaying nociceptive behavior when overexpressing EcR isoforms. 42°C nociceptive probe. One-way analysis of variance (ANOVA) with Tukey’s. n = 3 staging replicates of 15–20 larvae were tested for each genotype.
Figure 5 with 2 supplements
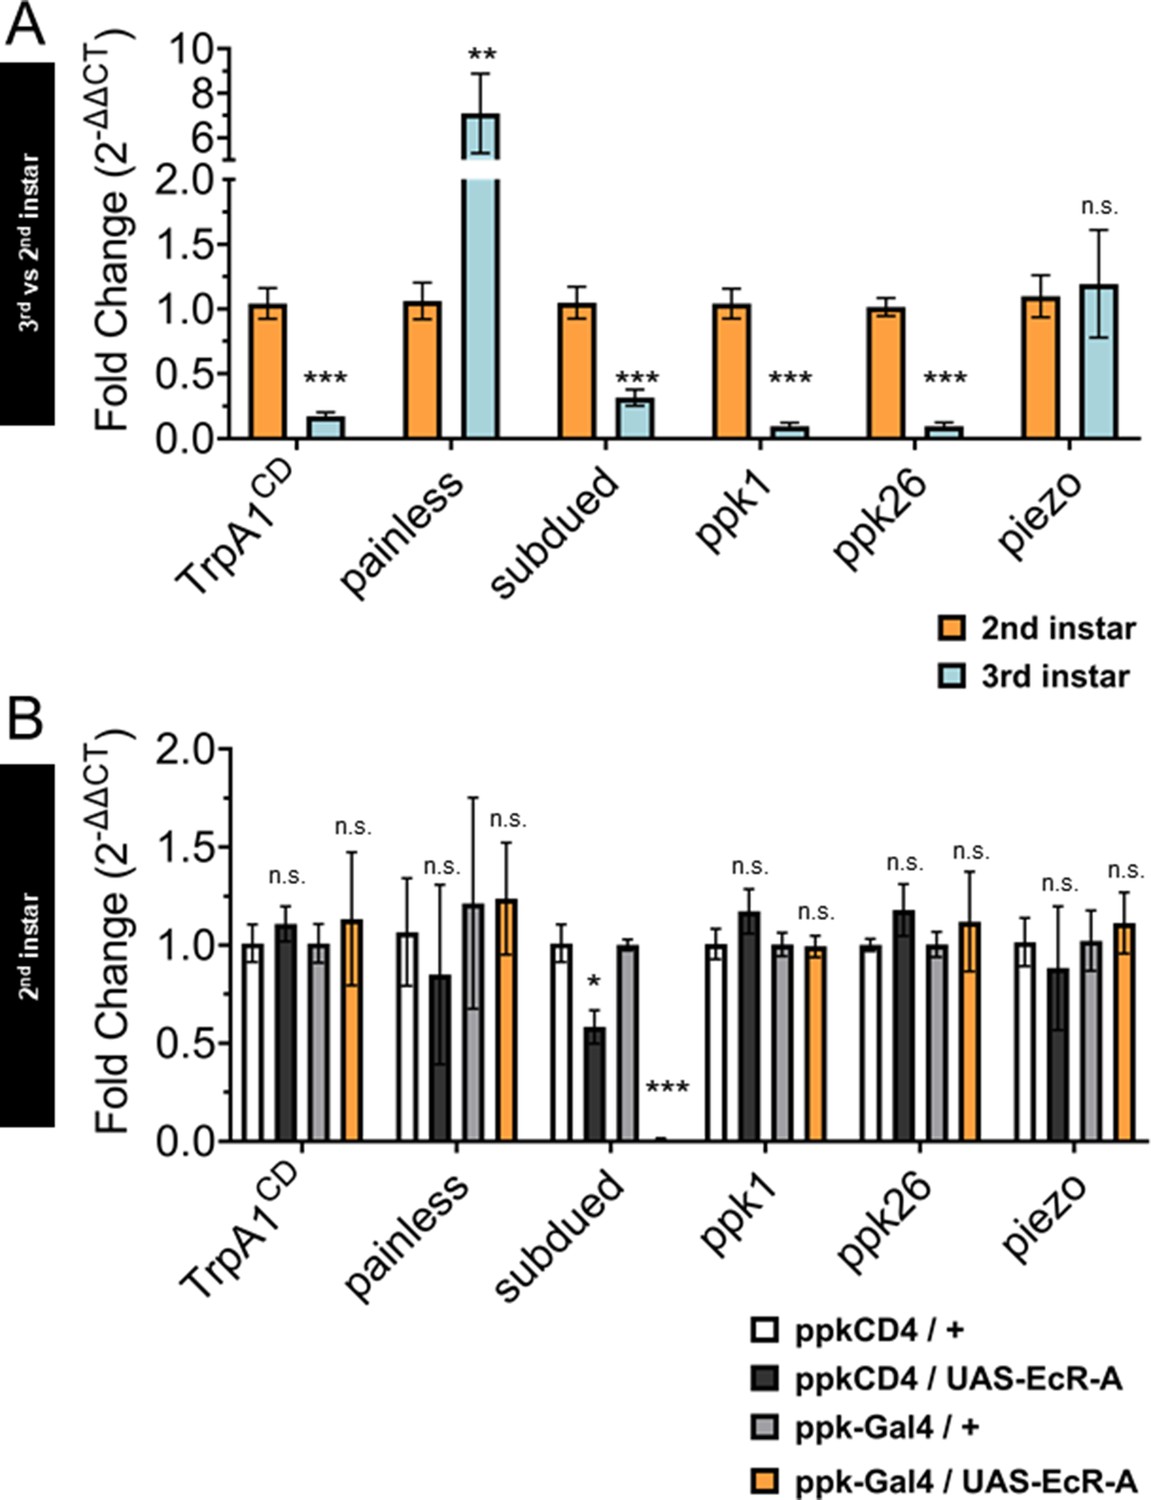
Ecdysone receptor (EcR) transcriptionally regulates subdued during the period of thermal nociceptive development.
Expression of nociceptive genes measured by qRT-PCR from fluorescence-activated cell sorting (FACS) purified Class IV dendritic arborization (C4da) neurons. (A) C4da neurons isolated from second and third instar larvae. Expression in third instar neurons was normalized to second instar expression. (B) C4da neurons isolated from second instar larvae expressing wild-type EcR-A. Genotypic controls not expressing EcR-A (ppkCD4/UAS-EcR-A) were normalized to age-matched neurons (ppkCD4/+). Expression in EcR-A expressing neurons (ppk-Gal4/UAS-EcR-A) was normalized to age-matched control neurons without EcR-A expression (ppk-Gal4/+). Student’s t-test. *p < 0.05, **p < 0.01, ***p < 0.001. (A) n = 8 and (B) n = 3–4 FACS isolation/staging replicates for each age and genotype.
Figure 5—figure supplement 1
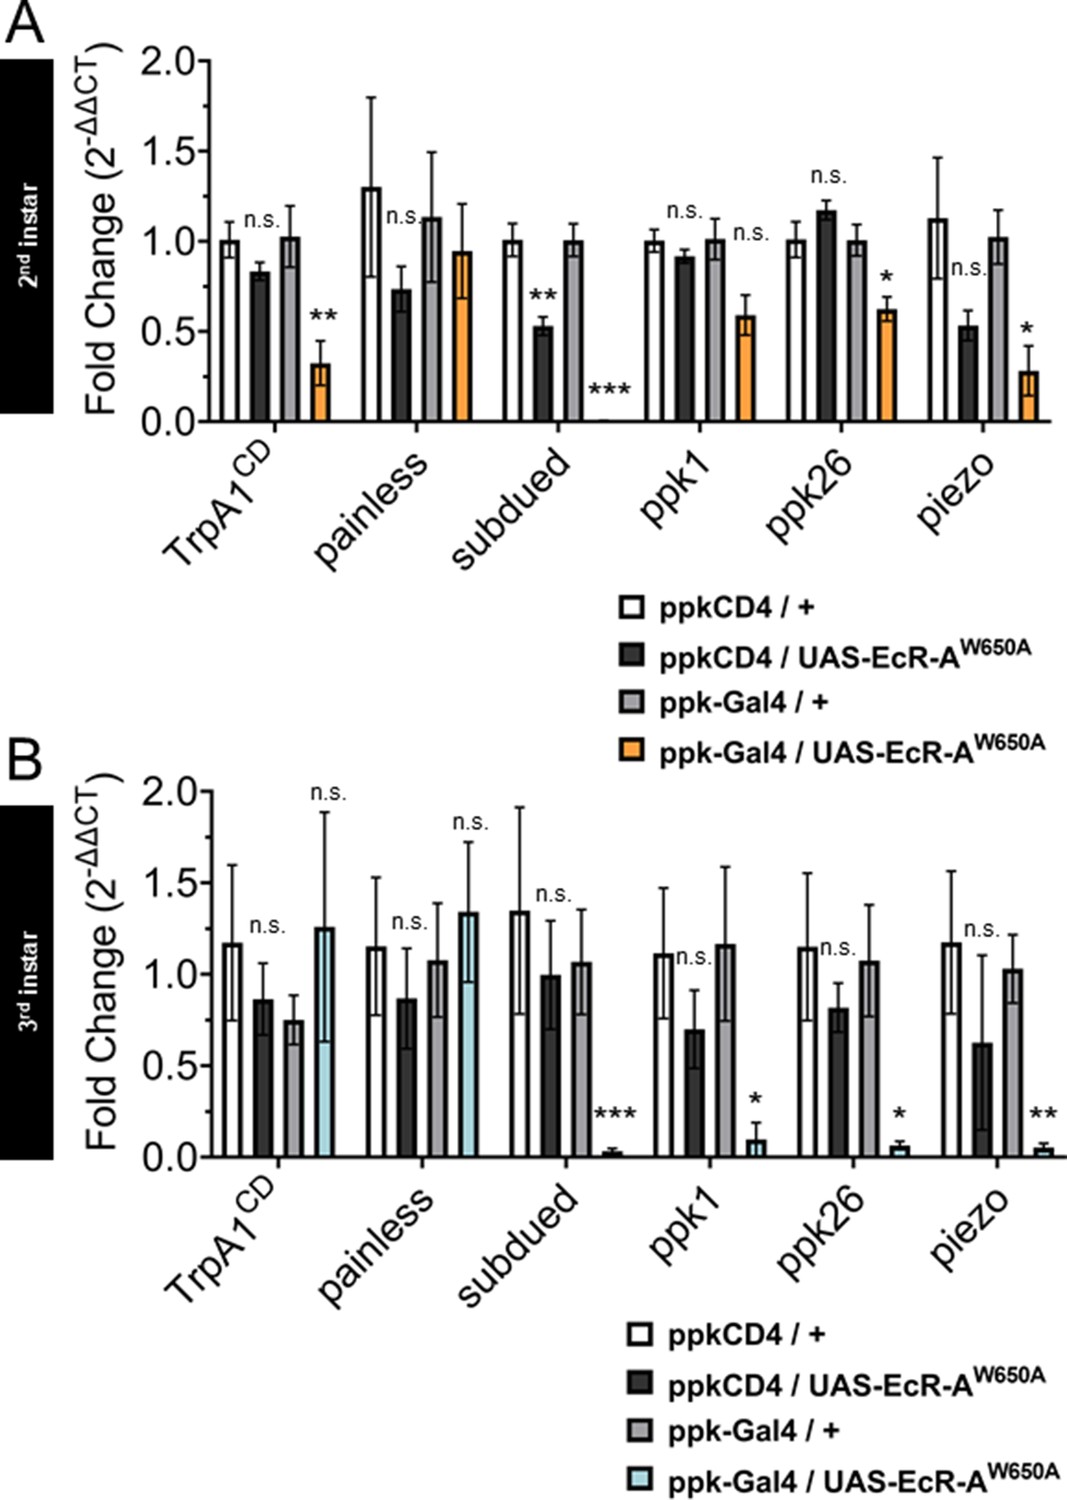
Mutant ecdysone receptor (EcR) transcriptionally regulates nociceptive genes during the period of thermal nociceptive development.
Expression of nociceptive genes measured by qRT-PCR from fluorescence-activated cell sorting (FACS) purified Class IV dendritic arborization (C4da) neurons. (A) Second instar and (B) third instar C4da neurons expressing ligand-binding mutant EcR-A-W650A. Genotypic controls not expressing EcR-A-W650A (ppkCD4/UAS- EcR-A-W650A) were normalized to age-matched neurons (ppkCD4/+). Expression in EcR-A-W650A expressing neurons (ppk-Gal4/UAS-EcR-A-W650A) was normalized to control neurons without EcR-A-W650A expression (ppk-Gal4/+). Student’s t-test. *p < 0.05, **p < 0.01, ***p < 0.001. n = 3–4 FACS isolation/staging replicates for each genotype.
Figure 5—figure supplement 2
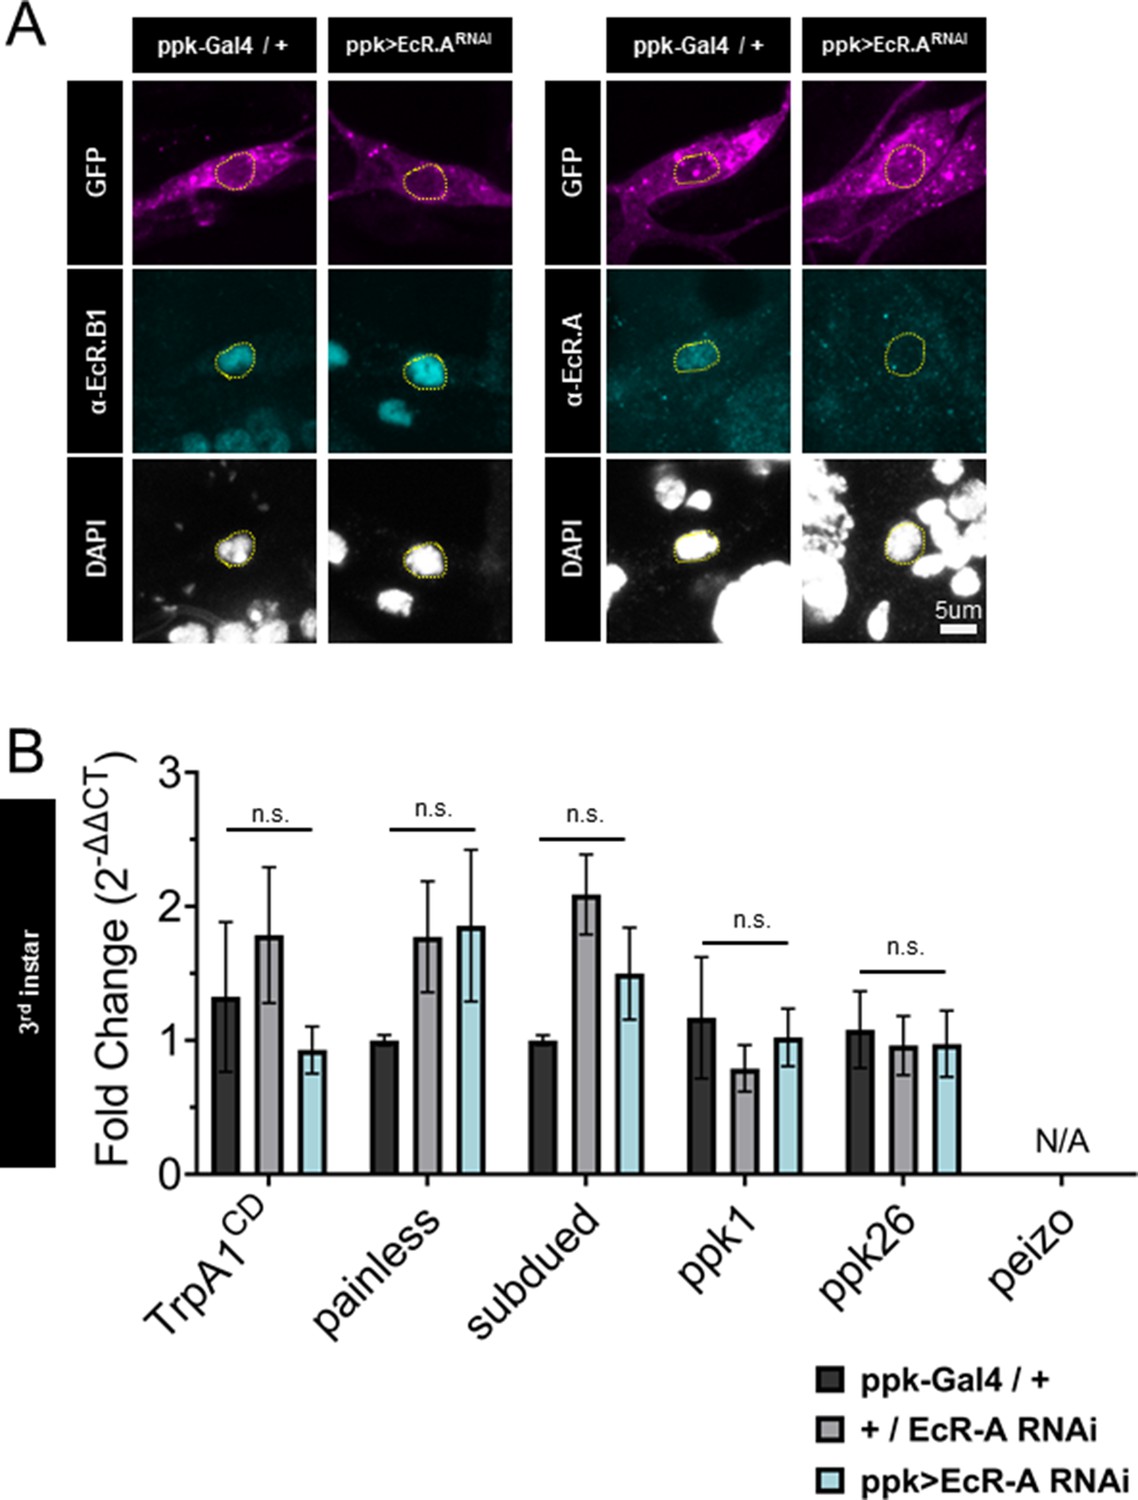
Ecdysone receptor A (EcR-A) RNAi reduces EcR-A protein but does not alter nociceptive gene expression.
(A) EcR-A RNAi reduces EcR-A protein expression and does not reduce EcR-B1 protein expression. EcR immunohistochemistry with EcR-B1 or EcRA antibody. Yellow dashed line indicates position of nucleus. Class IV dendritic arborization (C4da) neurons labeled by ppktd-GFP. (B) C4da neurons isolated from third instar larvae expressing EcR-A RNAi. Genotypic controls not expressing EcR-A RNAi (+/EcR-A RNAi) and EcR-A RNAi expressing neurons (ppk >EcR A RNAi) were normalized to age-matched control neurons without EcR-A RNAi expression (ppk-Gal4/+). Transcripts of piezo were not measurable from samples (N/A: not applicable). Student’s t-test. n = 3–4 fluorescence-activated cell sorting (FACS) isolation/staging replicates for each genotype.
Figure 6 with 1 supplement
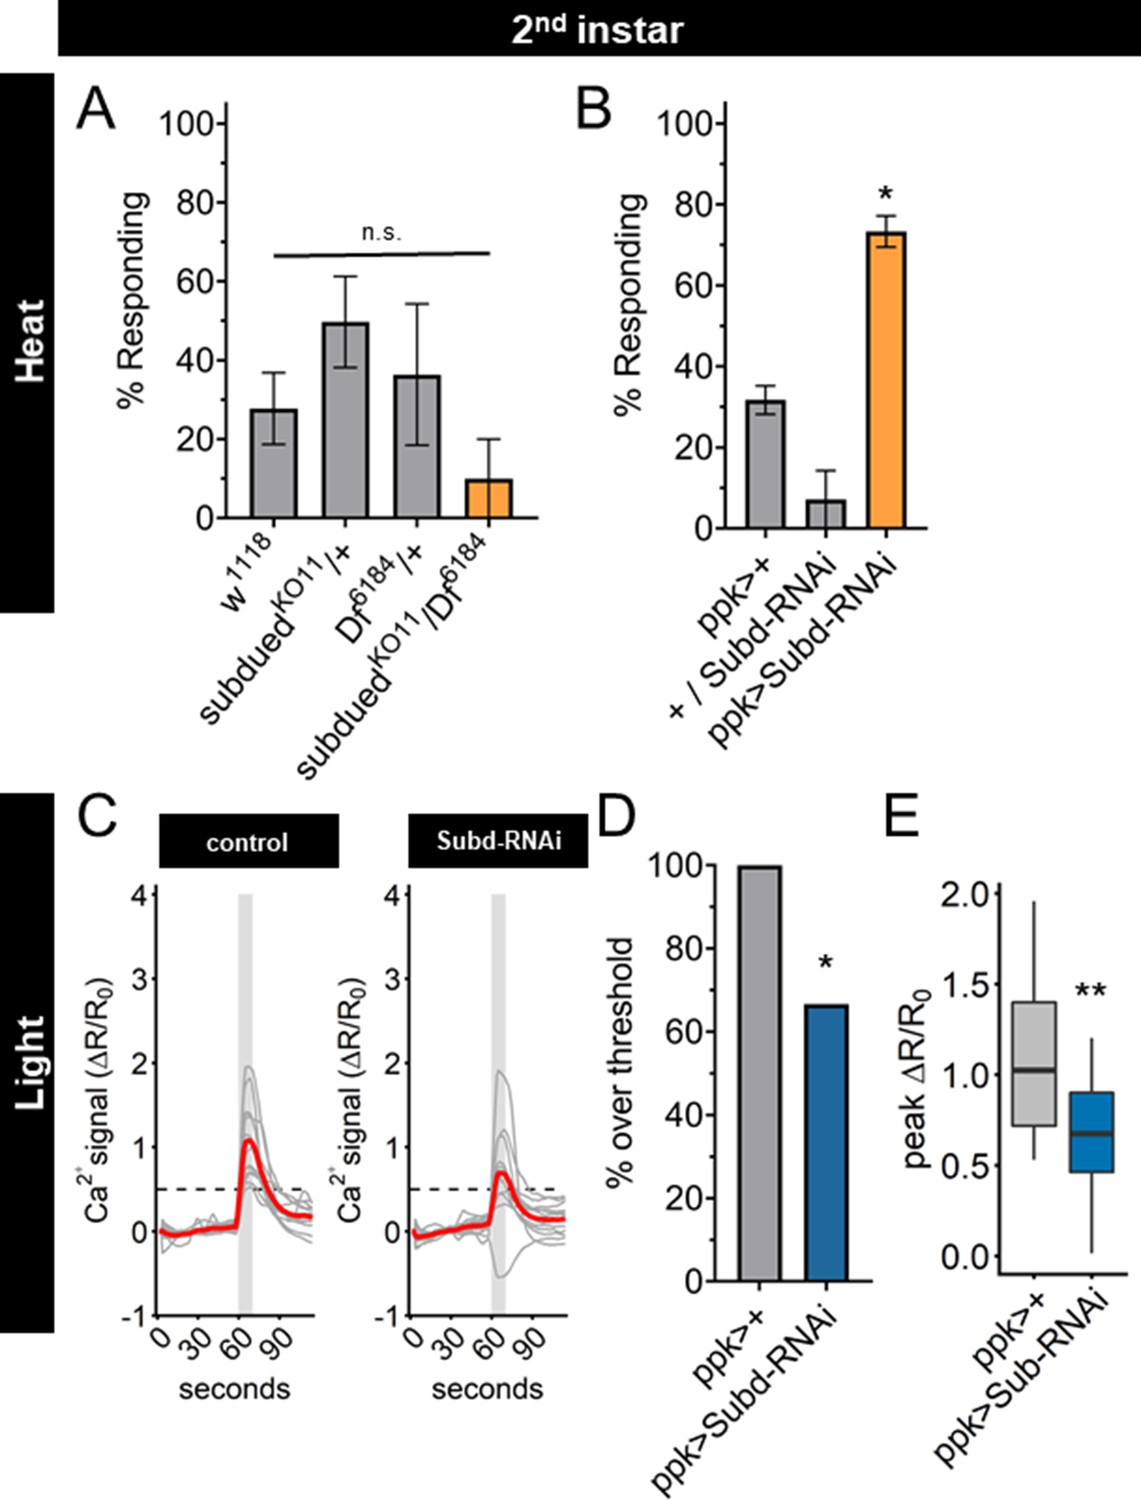
Subdued-RNAi changes second instar Class IV dendritic arborization (C4da) neuron sensory response pattern to third instar sensory response pattern.
(A) Second instar larvae with 42°C nociceptive probe. Percent of population displaying nociceptive behavior when mutant for Subdued. (B) Second instar larvae with 42°C nociceptive probe. Percent of population displaying nociceptive behavior when expressing Subdued-RNAi (ppk-Gal4 > Subd RNAi v37472). (C) Individual traces (gray lines) and means (red lines) of Ca2+ activity calculated by ratiometric change from baseline. Gray column indicates period of stimulus. Dotted line indicates threshold level for % over threshold calculations. (D) Percent of soma with Ca2+ activity over the threshold level. (E) Peak Ca2+ activity during the periods of stimulus programs. (A, B) One-way analysis of variance (ANOVA). (D) Fisher’s exact test, one-sided. (E) Student’s t-test. (A, B) n = 3–4 staging replicates of 15–20 larvae. (C–E) ppk > +n = 14 neurons, ppk > Subd RNAi n = 12 neurons. *p < 0.05, **p < 0.01.
Figure 6—figure supplement 1
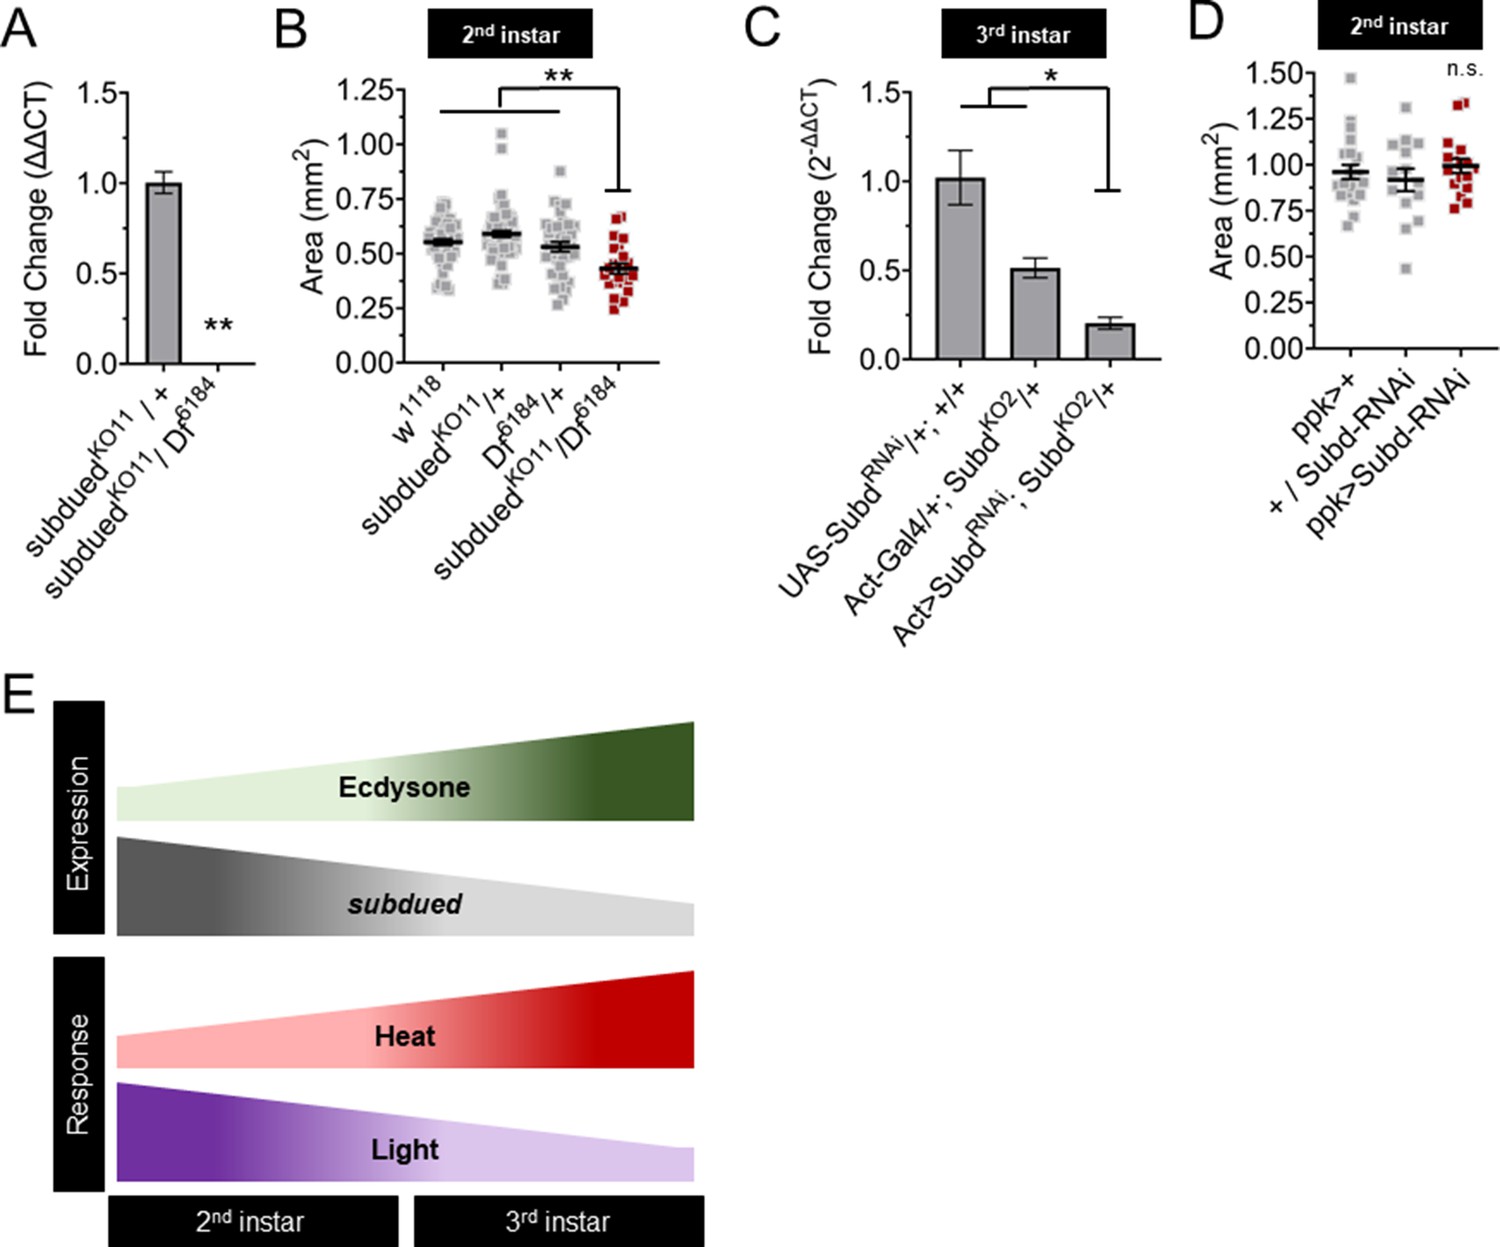
Subdued mutants have reduced larvae growth during the second instar.
(A) Subdued expression in knockout mutant larvae measured by qRT-PCR. (B) Size of second instar larvae mutant for subdued measured by body area. (C) Subdued expression in Subdued-RNAi expressing larvae measured by qRT-PCR. (D) Size of larvae expressing subdued-RNAi in Class IV dendritic arborization (C4da) neurons. (E) Ecdysone regulates subdued expression to regulate the sC4da neuron sensory switch. (A) Student’s t-test. (B–D) One-way analysis of variance (ANOVA). *p < 0.05, **p < 0.01. (A, C) n = 3 whole larvae isolation replicates.
Tables
Table 1
Drosophila melanogaster stocks used in this study.
| Figure | Genotype | Source |
|---|---|---|
| 1A and S1-1 | ppk-tdGFP1b,UAS-Dcr2/+;ppk-Gal41a/+ | Han et al., 2011 |
| 1C–F | ppk-Gal4vk37/+;UAS-GCaMP6(s),UAS-tdTom/+ | BDSC 42749, Han et al., 2011 |
| 2A–C, S2-1B, 3A | ppk-tdGFP1b,UAS-Dcr2/+;ppk-Gal41a/+ | |
| 3B and S3-1A–C | ppk-tdGFP1b,UAS-Dcr2/+;ppk-Gal41a/+ | |
| P{UAS-EcR.A.W650A}TP5/+ | BDSC 9451 | |
| P{UAS-EcR.A.F645A}TP2/+ | BDSC 9452 | |
| ppk-tdGFP1b,UAS-Dcr2/P{UAS-EcR.A.F645A}TP2;ppk-Gal41a/+ | ||
| ppk-tdGFP1b,UAS-Dcr2/P{UAS-EcR.A.W650A}TP5;ppk-Gal41a/+ | ||
| 4A and S4-2A, B | ppk-Gal4vk37 | Han et al., 2011 |
| P{UAS-EcR.A}3a/+ | BDSC 6470 | |
| P{UAS-EcR.B1}3b/+ | BDSC 6469 | |
| P{UAS-EcR.C}TP1-4/+ | BDSC 6868 | |
| ppk-Gal4vk37;P{UAS-EcR.A}3a | ||
| ppk-Gal4vk37; P{UAS-EcR.B1}3b | ||
| ppk-Gal4vk37;P{UAS-EcR.C}TP1-4 | ||
| 4B and S4-1A–G | ppk-tdGFP1b,UAS-Dcr2/+;ppk-Gal41a/+ | |
| P{UAS-EcR.A}3a/+ | ||
| P{UAS-EcR.A.F645A}TP2/+ | ||
| P{UAS-EcR.A.W650A}TP5/+ | ||
| ppk-tdGFP1b,UAS-Dcr2/+;ppk-Gal41a/P{UAS-EcR.A}3a | ||
| ppk-tdGFP1b,UAS-Dcr2/P{UAS-EcR.A.F645A}TP2;ppk-Gal41a/+ | ||
| ppk-tdGFP1b,UAS-Dcr2/P{UAS-EcR.A.W650A}TP5;ppk-Gal41a/+ | ||
| 5A | ppk-tdGFP1b,UAS-Dcr2/+;ppk-Gal41a/+ | |
| 5B | ppk-CD4- tdGFP1b /+ | |
| ppk-CD4- tdGFP1b /+;P{UAS-EcR.A}3a/+ | ||
| ppk-tdGFP1b,UAS-Dcr2/+;ppk-Gal41a/+ | ||
| ppk-tdGFP1b,UAS-Dcr2/+;ppk-Gal41a/P{UAS-EcR.A}3a | ||
| S5-1A, B | ppk-CD4- tdGFP1b /+ | |
| ppk-CD4- tdGFP1b / P{UAS-EcR.A.W650A}TP5 | ||
| ppk-tdGFP1b,UAS-Dcr2/+;ppk-Gal41a/+ | ||
| ppk-tdGFP1b,UAS-Dcr2/P{UAS-EcR.A.W650A}TP5;ppk-Gal41a/+ | ||
| S5-2A, B | ppk-tdGFP1b,UAS-Dcr2/+;ppk-Gal41a/+ | |
| ppk-CD4- tdGFP1b /+;P{w[ + mC] = UAS EcR.A.dsRNA}91/+ | BDSC 9328 | |
| ppk-tdGFP1b,UAS-Dcr2/+;ppk-Gal41a/ P{w[ + mC] = UAS EcR.A.dsRNA}91 | ||
| 6A, S6-1A, B | SubduedKO11/+ | Wong et al., 2013 |
| Df(3R)Exel6184, P{w[ + mC] = XPU}Exel6184 | BDSC 7663 | |
| SubduedKO11/Df(3R)Exel6184, P{w[ + mC] = XPU}Exel6184 | ||
| 6B, S6-1D | ppk-tdGFP1b,UAS-Dcr2/+;ppk-Gal41a/+ | |
| P{GD3674}v37472/+ | VDRC 37472 | |
| ppk-tdGFP1b,UAS-Dcr2/+;ppk-Gal41a/ P{GD3674}v37472 | ||
| S6-1C | P{GD3674}v37472/+ | VDRC 37472 |
| Actin-Gal4/+; SubduedKO2/+ | Wong et al., 2013 | |
| Actin-Gal4/+; SubduedKO2/P{GD3674}v37472 | ||
| 6-1C–E | ppk-Gal4vk37/+;UAS-GCaMP6(s),UAS-tdTom/+ | BDSC 42749, Han et al., 2011 |
| ppk-Gal4vk37/+;UAS-GCaMP6(s),UAS-tdTom/ P{GD3674}v37472 |
Additional files
Download links
A two-part list of links to download the article, or parts of the article, in various formats.
Downloads (link to download the article as PDF)
Open citations (links to open the citations from this article in various online reference manager services)
Cite this article (links to download the citations from this article in formats compatible with various reference manager tools)
Steroid hormone signaling activates thermal nociception during Drosophila peripheral nervous system development
eLife 11:e76464.
https://doi.org/10.7554/eLife.76464


