The skeletal muscle circadian clock regulates titin splicing through RBM20
- Department of Physiology and Functional Genomics, University of Florida, United States
- Myology Institute, University of Florida, United States
- Department of Pharmacology and Therapeutics, University of Florida, United States
- Department of Molecular Physiology and Biophysics, University of Vermont, United States
- Department of Molecular Genetics of Microbiology, Center for Neurogenetics, University of Florida, United States
- Medical Faculty Mannheim, University of Heidelberg, Germany
Figures
Figure 1
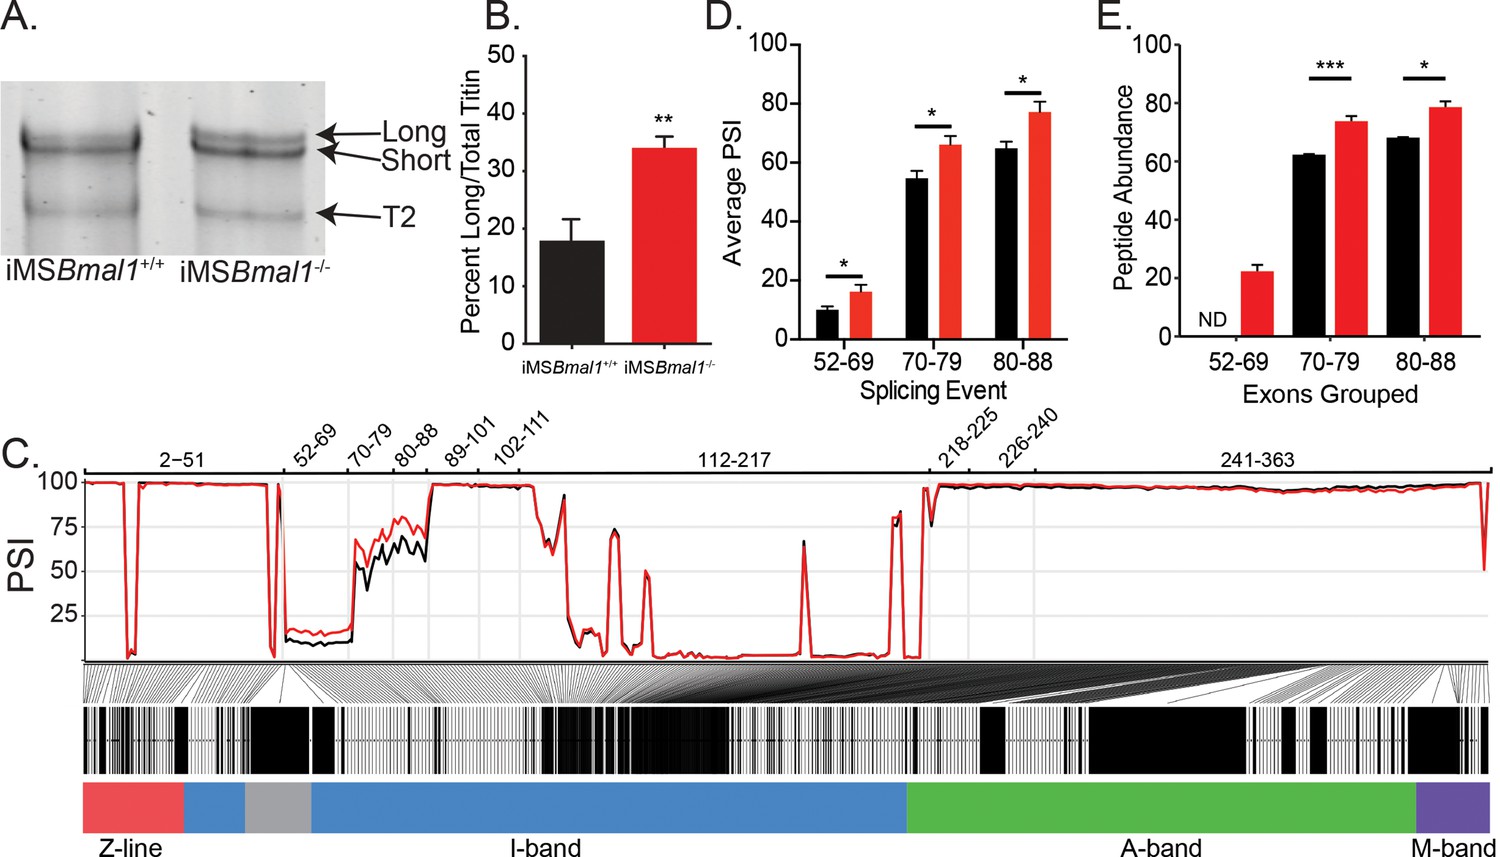
Skeletal muscle Bmal1 knockout results in altered splicing of titin’s spring region.
(A) Sodium dodecyl sulfate-vertical agarose gel electrophoresis (SDS-VAGE) was performed to measure titin protein isoform in iMSBmal1+/+ and iMSBmal1-/- tibialis anterior muscles. (B) Quantification of titin isoforms in these muscles shows a significant shift in titin isoform from a predominantly short isoform to a mix of long and short isoforms in iMSBmal1-/- muscles but not iMSBmal1+/+ muscles (N = 8/group). (C) Percent spliced in (PSI) and ∆PSI of titin exons expressed in iMSBmal1+/+ and iMSBmal1-/- skeletal muscle. Exons within the proximal Ig domain were included more often in iMSBmal1-/- muscle compared to iMSBmal1+/+ muscle (N = 3/group). (D) Average PSI across three splicing events in the proximal Ig domain of tibialis anterior muscle show increased exon inclusion in iMSBmal1-/- mice compared to iMSBmal1+/+ controls (N=3/group). Each event is highlighted in Figure 2C. (E) Liquid chromatography–mass spectrometry (LC-MS)-quantified peptide abundance mapping onto exons identified using RNAseq confirms changes in titin splicing are translated to titin protein (N=3/group). §No peptides were detected that mapped to exons 52–69 in iMSBmal1+/+ muscle. Data plotted as mean ± SEM. Statistical significance determined by Student's t-test. *p<0.05, **p<0.01, ***p<0.0001.
-
Figure 1—source data 1
Sodium dodecyl sulfate-vertical agarose gel electrophoresis (SDS-VAGE) gels used for quantifying titin isoform ratios in iMSBmal1+/+ and iMSBmal1-/- tibialis anterior (TA) muscle.
- https://cdn.elifesciences.org/articles/76478/elife-76478-fig1-data1-v2.zip
-
Figure 1—source data 2
Titin peptide-level data used for quantifying domain-level changes to titin splicing.
Data are provided for each individual and listed with the exon coding for the peptide.
- https://cdn.elifesciences.org/articles/76478/elife-76478-fig1-data2-v2.zip
Figure 2
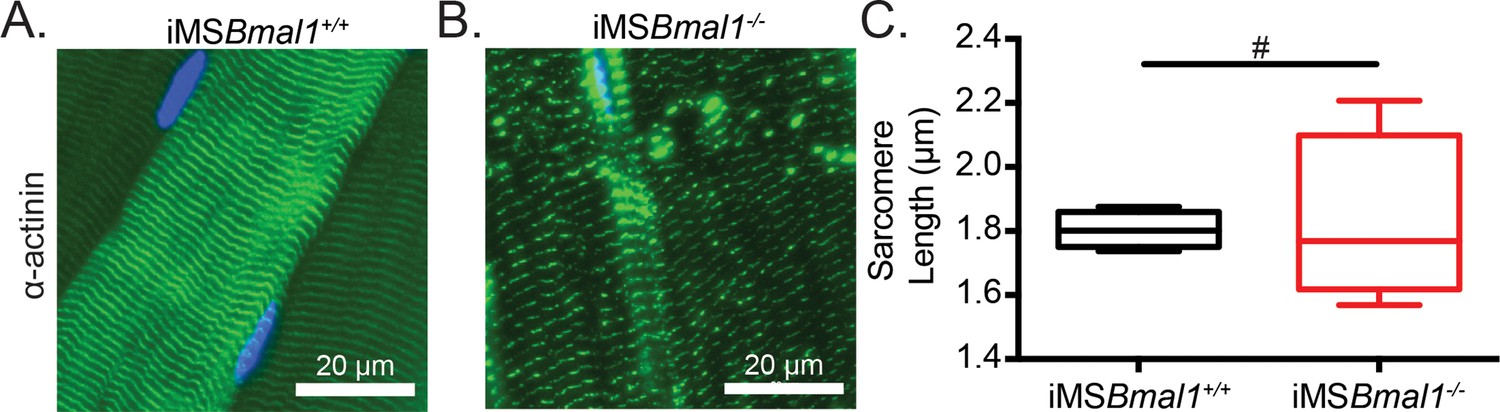
Sarcomere lengths are variable in iMSBmal1-/- muscle.
Representative images from (A) iMSBmal1+/+ and (B) iMSBmal1-/- tibialis anterior muscles. Muscles were longitudinally cryosectioned and stained with a primary antibody against α-actinin-2. (C) Sarcomere lengths are significantly more variable as based on an F-test in iMSBmal1-/- muscles compared to iMSBmal1+/+ controls. N = 4/group. #Significant difference in variance (p<0.05).
Figure 3
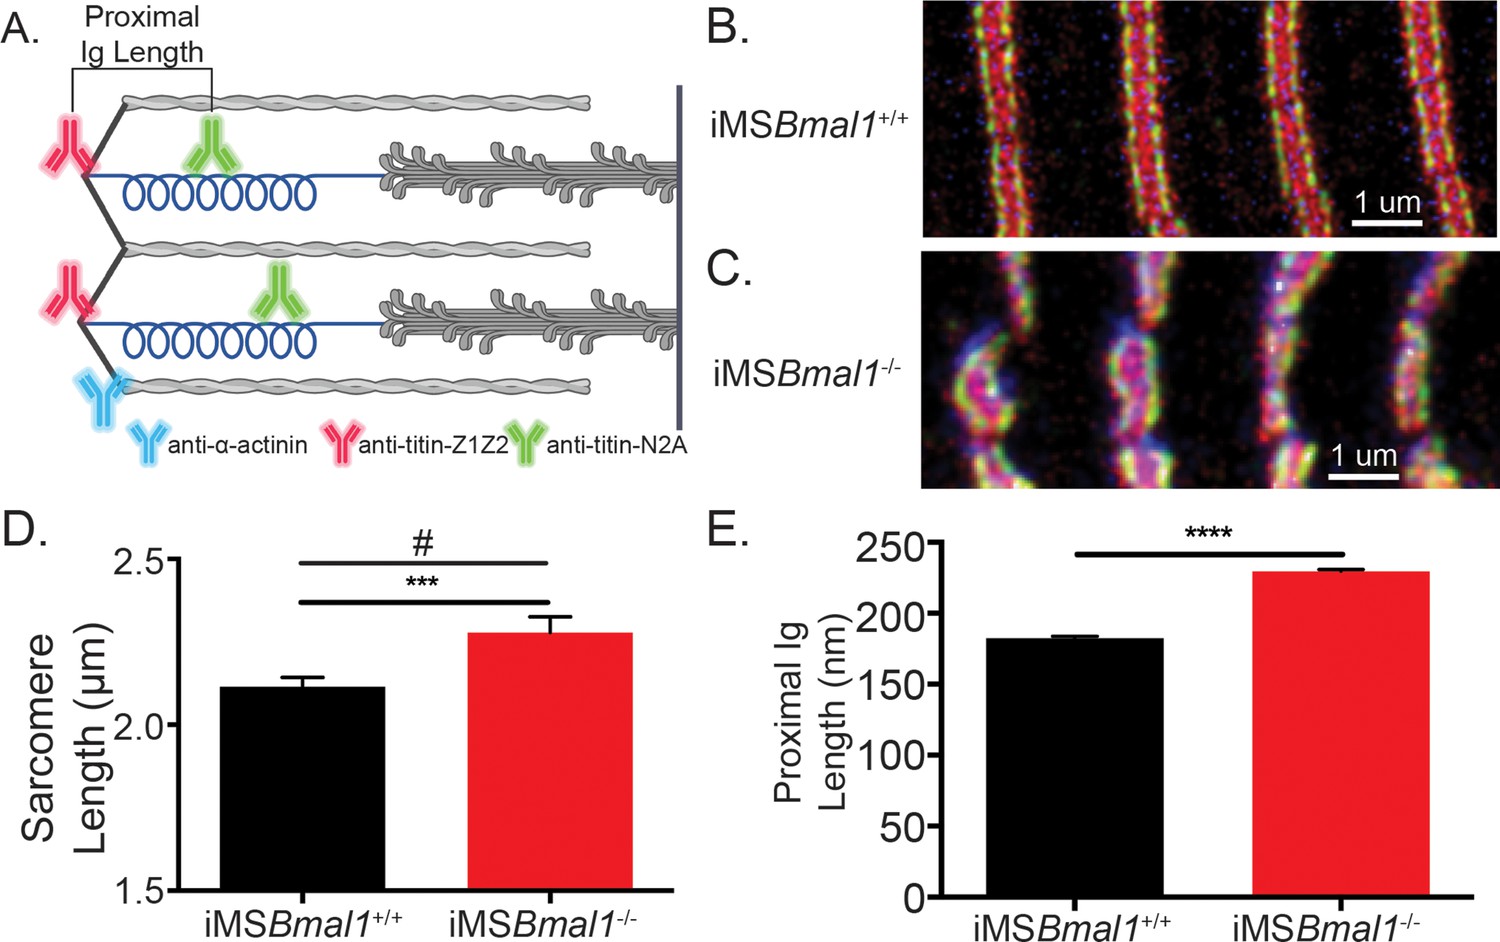
The change in titin’s spring length in iMSBmal1-/- muscle accounts for sarcomere length variability.
(A) Proximal Ig length was determined as the positional difference between the Z1Z2 domain of titin and the N2A domain of titin. These antibodies flank the proximal Ig domain. Created with BioRender.com. Representative images of immunohistochemistry using titin-epitope-specific and α-actinin-2 antibodies for (B) iMSBmal1+/+ and (C) iMSBmal1-/- skeletal muscle. Green: N2A titin; red: Z1Z2 titin; blue: α-actinin-2. (D) Sarcomere length variability is significantly lower in iMSBmal1+/+ compared to iMSBmal1-/- skeletal muscle. (E) A significantly longer proximal Ig length is correlated with this change in sarcomere length variability. N = 250–350 sarcomeres/three biological replicates per group. Data plotted as mean ± SEM. Statistical significance determined by Student's t-test. ***p<0.001, ****p<0.0001. # Significant difference in variance determined by F-test (p<0.05).
Figure 4
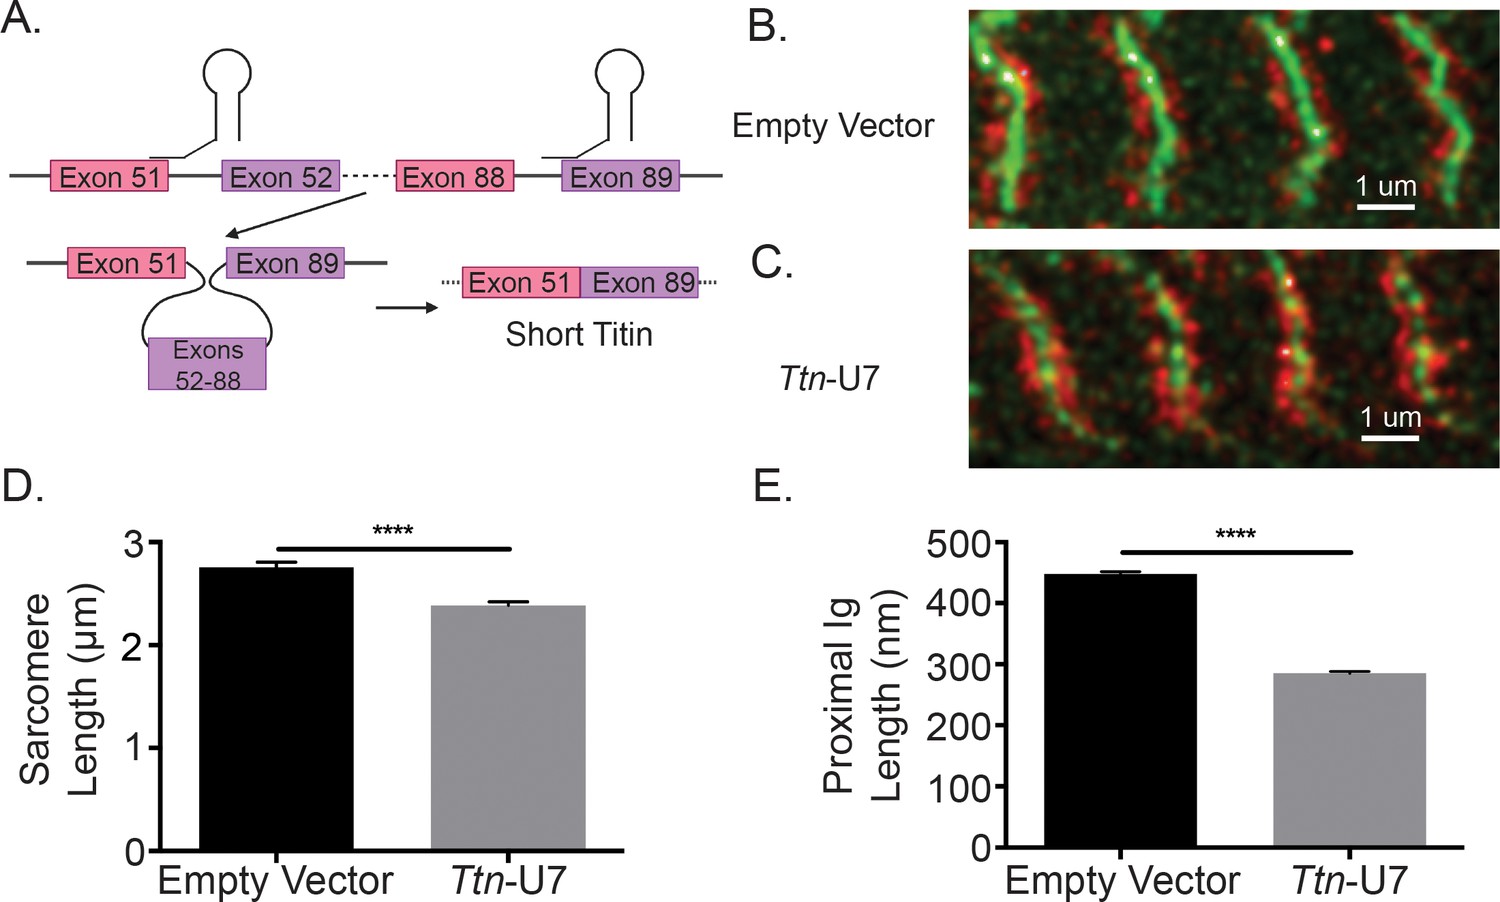
Directly shortening titin’s proximal Ig domain length results in shorter sarcomeres in vitro.
(A) U7 snRNPs were designed to induce splicing or the proximal Ig domain with dysregulated splicing in iMSBmal1-/- muscle. Created with BioRender.com. Representative images of immunocytochemistry using a titin-epitope-specific antibody and stably expressing eGFP-ACTN2 C2C12 myotubes that were transfected with an (B) empty vector control or (C) Ttn-U7 splicing factors. Green: α-actinin-2; red: N2A titin. (D) Sarcomere lengths were significantly shorter in myotubes transfected Ttn-U7 vectors compared to empty vector controls. (E) Ttn-U7 vector transfection resulted in significantly shorter proximal Ig domain lengths in eGFP-ACTN2-C2C12 myotubes. N = 100-200 sarcomeres/two biological replicates per group. Data plotted as mean ± SEM. Statistical significance determined by Student's t-test. ****p<0.0001.
Figure 5
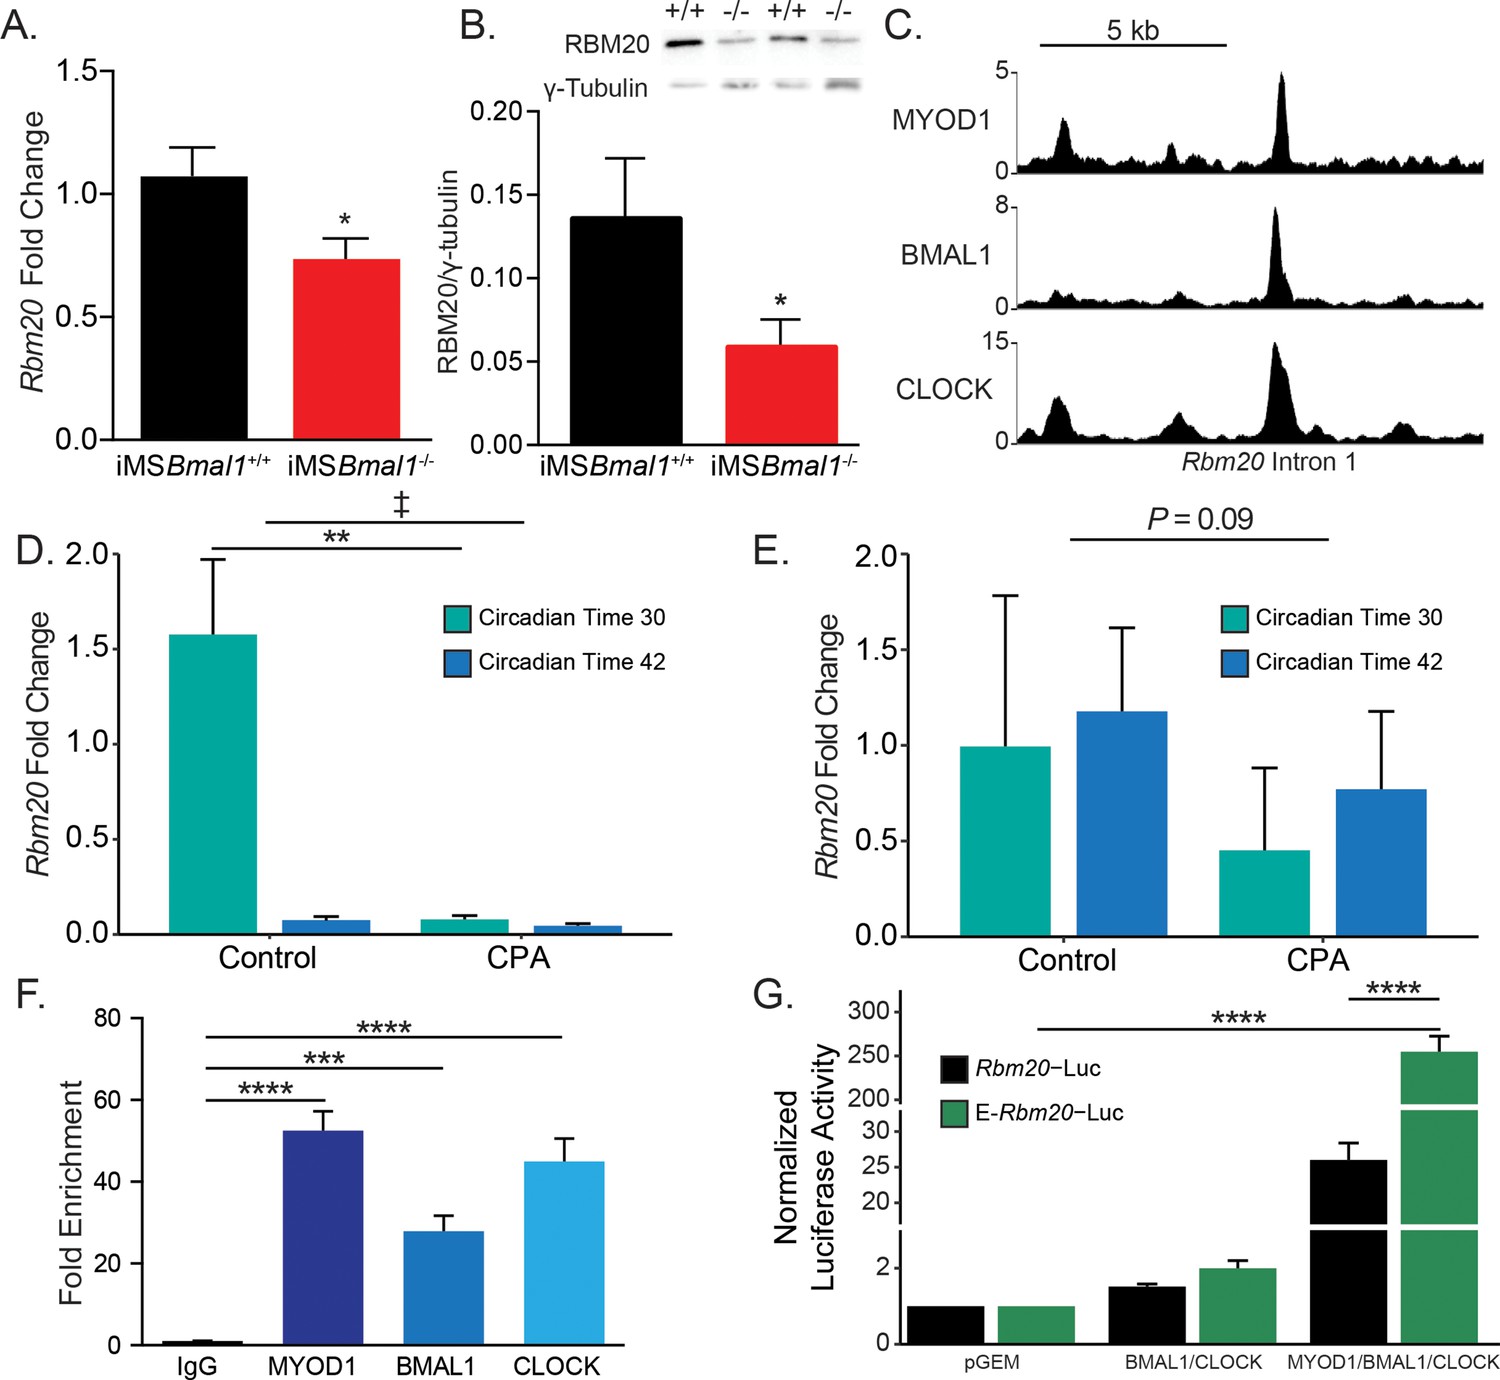
Rbm20 is targeted by the positive limb of the skeletal muscle molecular clock.
(A) Rbm20 mRNA is decreased by 34% in iMSBmal1-/- muscle compared to iMSBmal1+/+ muscle (N = 6–8/group). (B) iMSBmal1-/- muscle shows a 57% reduction in RBM20 protein levels compared to iMSBmal1+/+ control muscle (N = 4/group). (C) BMAL1, CLOCK, and MYOD1 ChIP-seq data were used to identify potential regulatory regions for Rbm20. A significant binding peak was found within intron 1 of this gene. (D) C57BL/6J mice subjected to repeated phase advances (CPA) show a significant reduction in Rbm20 mRNA expression in the quadriceps muscle (N = 4/group). (E) C57BL/6J mice subjected to CPA show a nonsignificant reduction in Rbm20 expression in the tibialis anterior muscle (N = 3/group). (F) ChIP-PCR confirms binding of each protein of the positive limb of the molecular clock at this site (N = 3/group). (G) Dual-luciferase activity shows significant activation of E-Rbm20-Luc with overexpression of the positive limb of the molecular clock (N = 3/group). Data plotted as mean ± SEM. Statistics performed using Student's t-test or one-way ANOVA with Tukey's post-hoc test. *p<0.05, **p<0.01, ****p<0.0001, ‡ Group effect p<0.05.
-
Figure 5—source data 1
RBM20 expression is decreased in iMSBmal1-/- muscle compared to iMSBmal1+/+ muscle.
Western blot of alternating lanes of iMSBmal1+/+ and iMSBmal1-/- muscle lysates probed with anti-RBM20 antibody (top). Western blot of alternating lanes of iMSBmal1+/+ and iMSBmal1-/- muscle lysates probed with anti-γ-tubulin antibody (bottom).
- https://cdn.elifesciences.org/articles/76478/elife-76478-fig5-data1-v2.zip
Figure 6 with 1 supplement
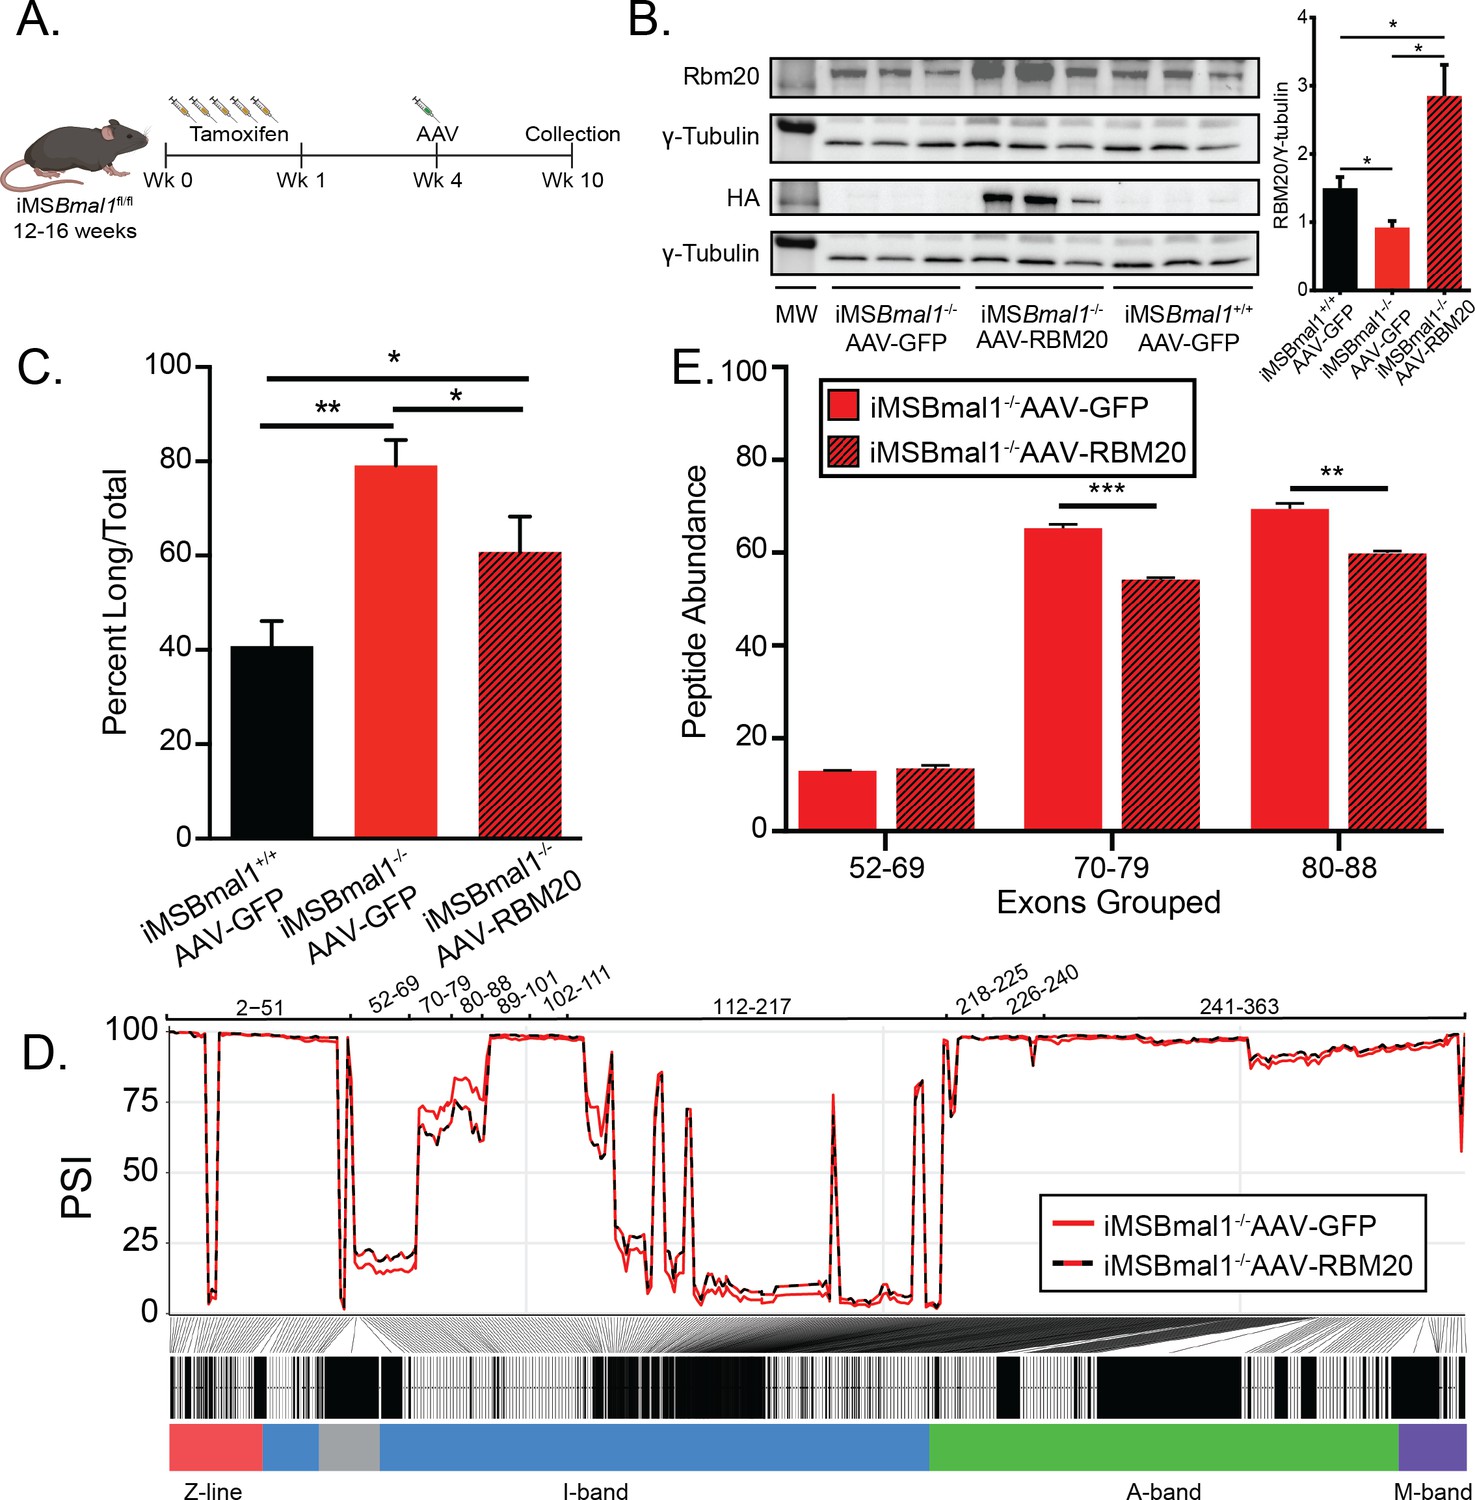
Rescuing RBM20 expression in iMSBmal1-/- muscle restores titin spring length and sarcomere length variability.
(A) Protocol for conditionally knocking out skeletal muscle Bmal1 and overexpressing RBM20. (B) Transduction of AAV-RBM20 in iMSBmal1-/- muscle increases RBM20 91% over iMSBmal1+/+ AAV-GFP muscle and threefold over iMSBmal1-/- AAV-GFP muscle (N = 4/group). Molecular weight markers (MW) correspond to 150 kDa in RBM20 and HA blots and 50 kDa in tubulin blots. (C) Titin isoform expression is partially restored in iMSBmal1-/- AAV-RBM20 muscle (N = 4/group). (D) Percent spliced in (PSI) of every exon of Ttn between iMSBmal1-/--GFP and iMSBmal1-/--RBM20 muscle (N = 3/group). (E) Liquid chromatography–mass spectrometry (LC-MS)-quantified peptide abundance mapping onto exons identified using RNAseq confirms changes in titin splicing are translated to titin protein (N=3/group). Data plotted as mean ± SEM. Statistics performed using Student's t-test or one-way ANOVA with Tukey's post-hoc test. *p<0.05; **p<0.01.
-
Figure 6—source data 1
RBM20 and HA protein expression are increased in iMSBmal1-/-AAV-RBM20 muscle lysates compared to iMSBmal1-/- AAV-GFP and iMSBmal1+/+ AAV-GFP.
Western blot of HA protein expression across groups (top-left). Western blot of γ-tubulin expression across groups (top-right). Western blot of RBM20 expression across groups (middle left). Western blot of γ-tubulin expression across groups (middle right). Rescue of RBM20 expression results in titin isoform ratio similar to isoform ratio in wildtype muscle (bottom).
- https://cdn.elifesciences.org/articles/76478/elife-76478-fig6-data1-v2.zip
Figure 6—figure supplement 1
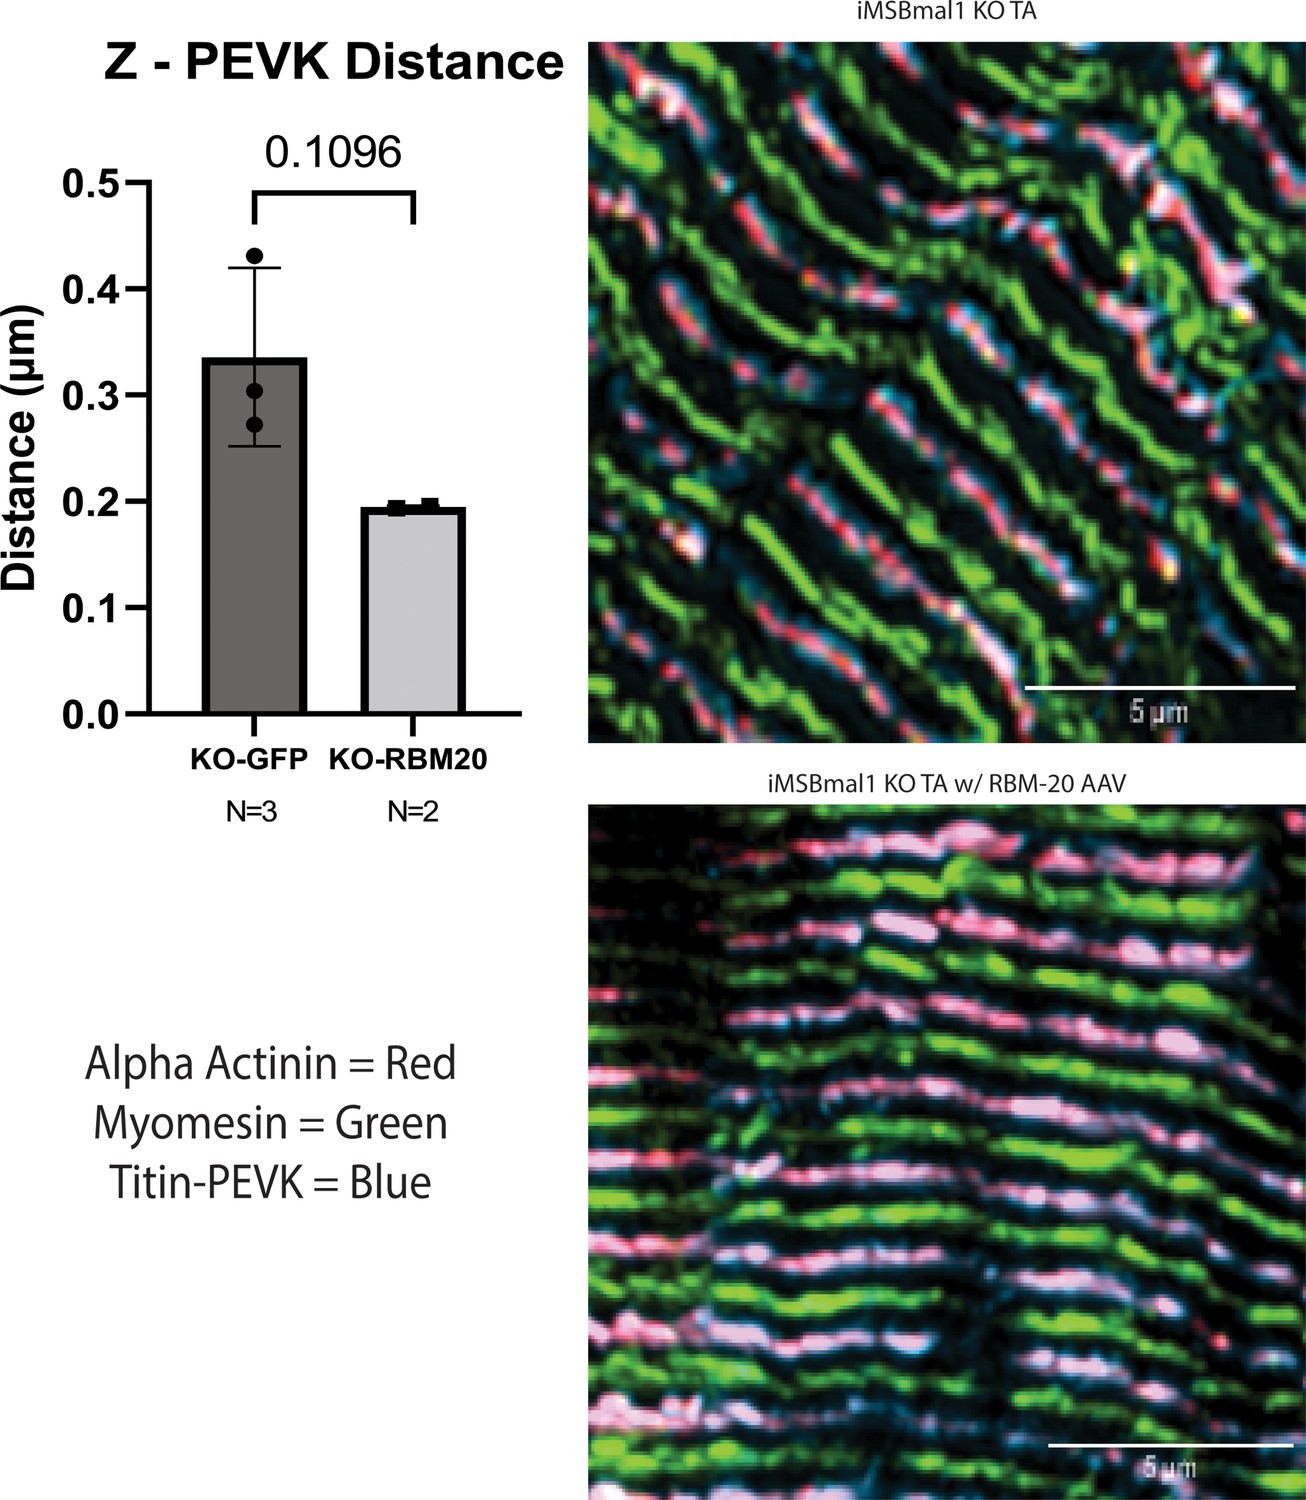
Rescue of RBM20 protein expression in iMSBmal1-/- muscle results in a reduction in the distance of the titin-PEVK domain from the sarcomere Z-disc.
Quantification of the average distance from the sarcomere Z-disc (α-actinin) and the titin-PEVK epitope (top-left). Tibialis anterior longitudinal sections from iMSBmal1-/- (top-right) and iMSBmal1-/- AAV-RBM20 (bottom-right) labeled with antibodies specific to the Z-disc (α-actinin, red), M-line marker (myomesin, green), and the PEVK domain of titin (Titin-PEVK, blue). Data plotted as mean ± SD. Statistics performed using Student's t-test.
Tables
Key resources table
| Reagent type (species) or resource | Designation | Source or reference | Identifiers | Additional information |
|---|---|---|---|---|
| Genetic reagent (Mus musculus) | iMSBmal1fl/fl | https://doi.org/10.1186/s13395-015-0039-5 | Tamoxifen-inducible, skeletal muscle-specific deletion Bmal1 resulting in lack of BMAL1 in this tissue | |
| Antibody | Anti-sarcomeric α-actinin (rabbit monoclonal) | Abcam | EP2529Y | (1:1000) |
| Antibody | Anti-titin N2A (rabbit polyclonal) | Myomedix | TTN-4 | (1:250) |
| Antibody | Anti-titin Z1Z2 (rabbit polyclonal) | Myomedix | TTN-1 | (1:100) |
| Antibody | Anti-RBM20 (rabbit polyclonal) | Myomedix | RBM20-1 | (1:500) |
| Antibody | Anti-PEVK (rabbit polyclonal) | Myomedix | PEVK-1 | (1:500) |
| Antibody | Anti-γ-tubulin (mouse monoclonal) | Sigma-Aldrich | T6557 | (1:1000) |
| Antibody | Anti-HA High Affinity (rat monoclonal IgG1) | Roche | 11867423001 | (1:1000) |
| Antibody | Alexa Fluor-488 conjugated goat anti-rabbit IgG (goat polyclonal) | Thermo Scientific | A11034 | (1:500) |
| Antibody | Alexa Fluor-Plus 405 conjugated goat anti-rabbit IgG (goat polyclonal) | Thermo Scientific | A48254 | (1:500) |
| Antibody | Alexa Fluor-647 conjugated goat anti-rabbit IgG (goat polyclonal) | Thermo Scientific | A21244 | (1:500) |
| Antibody | HRP conjugated goat anti-rabbit IgG (H+L) (goat polyclonal) | Sigma-Aldrich | AO307P | (1:10,000) |
| Antibody | HRP conjugated goat anti-mouse IgG (H+L) (goat polyclonal) | Sigma-Aldrich | 401215 | (1:10,000) |
| Sequence-based reagent | U7-BglII F | https://doi.org/10.1007/978-1-61737-982-6_11 | PCR primers | GGGAGATCTTTAACAACATAGGAGCTGTGATTGGCTGT |
| Sequence-based reagent | U7-PstI R | https://doi.org/10.1007/978-1-61737-982-6_11 | PCR primers | AAACTGCAGCACAACGCGTTTCCTAGGAAACCA |
| Sequence-based reagent | SDM_U7 smOpt F | http://doi.org/10.1007/978-1-61737-982-6_11 | PCR primers | GCTCTTTTAGAATTTTTGGAGCAGGTTTTCTGAC |
| Sequence-based reagent | SDM_U7 smOpt R | https://doi.org/10.1007/978-1-61737-982-6_11 | PCR primers | GTCAGAAAACCTGCTGGTTAAATTCTAAAAGAGC |
| Sequence-based reagent | Ttn-51-AS F | This paper | PCR primers | TTAGGGTGGGTGGATACGCCTCTGC AAAAGAATTTTTGGAGCAGGTTTTCTG |
| Sequence-based reagent | Ttn-51-AS R | This paper | PCR primers | TATCCACCCACCCTAAGTCCCTATCATAGCGGAAGTGCGTCTGTAG |
| Sequence-based reagent | Ttn-89-AS F | This paper | PCR primers | TAGGGTGCAAGGTACTCCTTAGAGTGAAAGAATTTTTGGAGCAGGTTT |
| Sequence-based reagent | Ttn-89-AS R | This paper | PCR primers | GTACCTTGCACCCTAAGTCCCTATCATAGCGGAAGTGCGTCTGTAG |
| Sequence-based reagent | Rbm20 qPCR F | https://doi.org/10.1161/CIRCULATIONAHA.117.031947 | PCR primers | TGCATGCCCAGAAATGCCTGCT |
| Sequence-based reagent | Rbm20 qPCR R | https://doi.org/10.1161/CIRCULATIONAHA.117.031947 | PCR primers | AAAGGCCCTCGTTGGAATGGCT |
| Sequence-based reagent | Rpl26 qPCR F | https://doi.org/10.7554/eLife.43017 | PCR primers | CGAGTCCAGCGAGAGAAGG |
| Sequence-based reagent | Rpl26 qPCR R | https://doi.org/10.7554/eLife.43017 | PCR primers | GCAGTCTTTAATGAAAGCCGTG |
| Sequence-based reagent | Rbm20 Intron 1 F | This paper | PCR primers | CTAGGACGGAATCTGCTGTG |
| Sequence-based reagent | Rbm20 Intron 1 R | This paper | PCR primers | AACAGGGTGTCTGTCTGTCT |
| Cell line (M. musculus) | eGFP-ACTN2-C2C12 | https://doi.org/10.1186/s13395-019-0203-4 | Allows for visualization of sarcomeres in live C2C12 myotubes | |
| Commercial assay or kit | Dual-luciferase reporter assay system | Promega | E1960 | |
| Commercial assay or kit | X-tremeGENE 9 DNA transfection reagent | Roche | 6365787001 | |
| Commercial assay or kit | QuikChange II Site-Directed Mutagenesis kit | Agilent | 200523 | |
| Software, algorithm | Prism 7 | GraphPad | www.graphpad.com; | |
| Software, algorithm | HISAT2 | https://doi.org/10.1038/nprot.2016.095 | http://daehwankimlab.github.io/hisat2/ | |
| Software, algorithm | R; RStudio | R Project for Statistical Computing; RStudio | www.r-project.org; www.rstudio.com |
Additional files
Download links
A two-part list of links to download the article, or parts of the article, in various formats.
Downloads (link to download the article as PDF)
Open citations (links to open the citations from this article in various online reference manager services)
Cite this article (links to download the citations from this article in formats compatible with various reference manager tools)
The skeletal muscle circadian clock regulates titin splicing through RBM20
eLife 11:e76478.
https://doi.org/10.7554/eLife.76478


