Assembly of recombinant tau into filaments identical to those of Alzheimer’s disease and chronic traumatic encephalopathy
- Medical Research Council Laboratory of Molecular Biology, United Kingdom
- Thermo Fisher Scientific, Netherlands
Figures
Figure 1 with 8 supplements
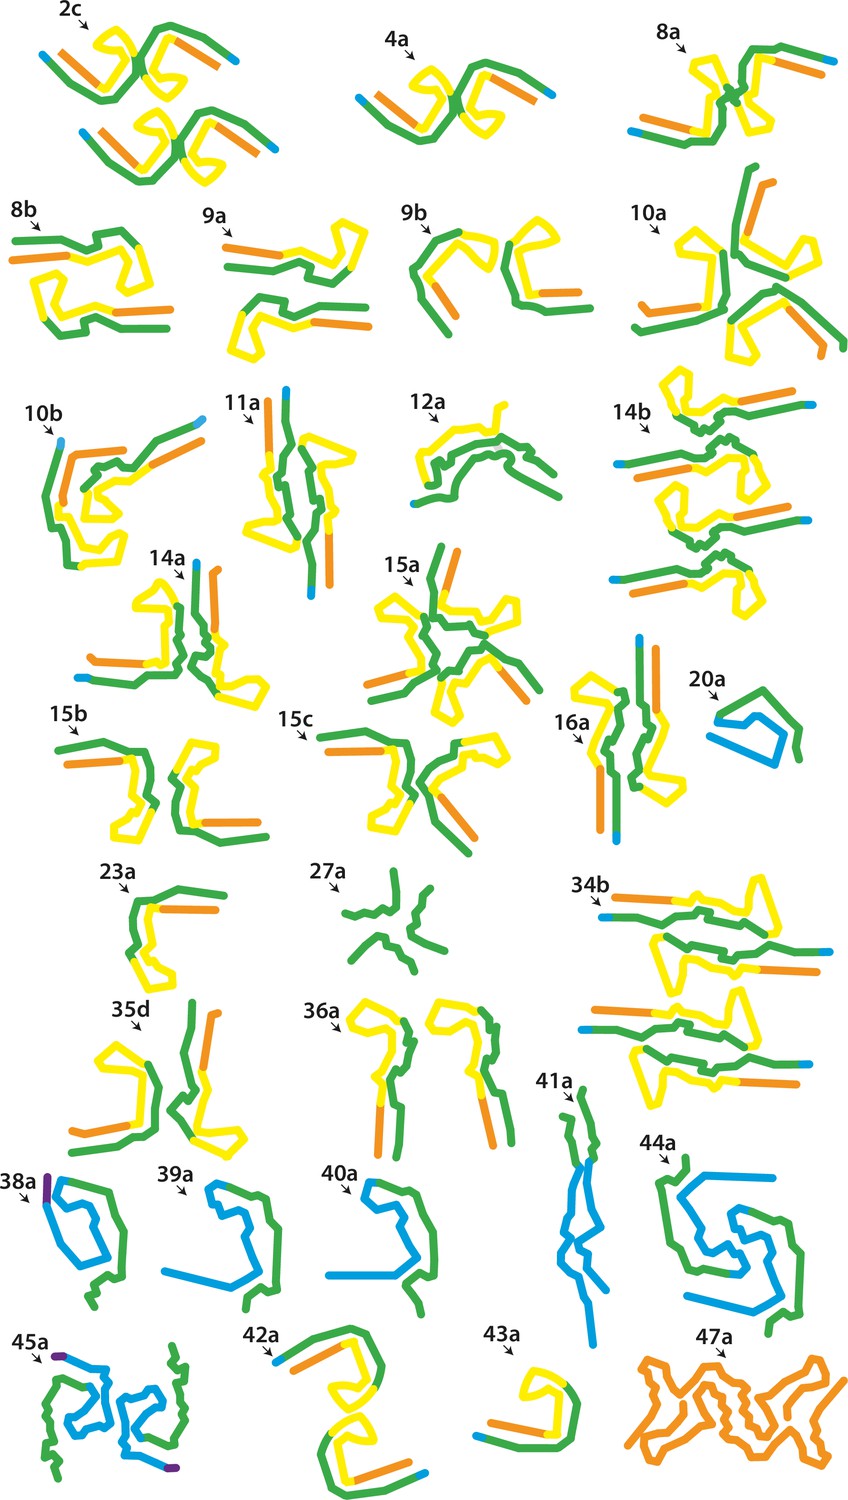
New electron cryo-microscopy (cryo-EM) structures.
Backbone traces for filaments with previously unobserved structures. Residues 244–274 (R1) are shown in purple; residues 275–305 (R2) are shown in blue; residues 306–336 (R3) are shown in green; residues 337–368 (R4) are shown in yellow; residues 369–441 (C-terminal domain) are shown in orange. The filament types (as defined in Table 1) are shown at the top left of each structure.
Figure 1—figure supplement 1
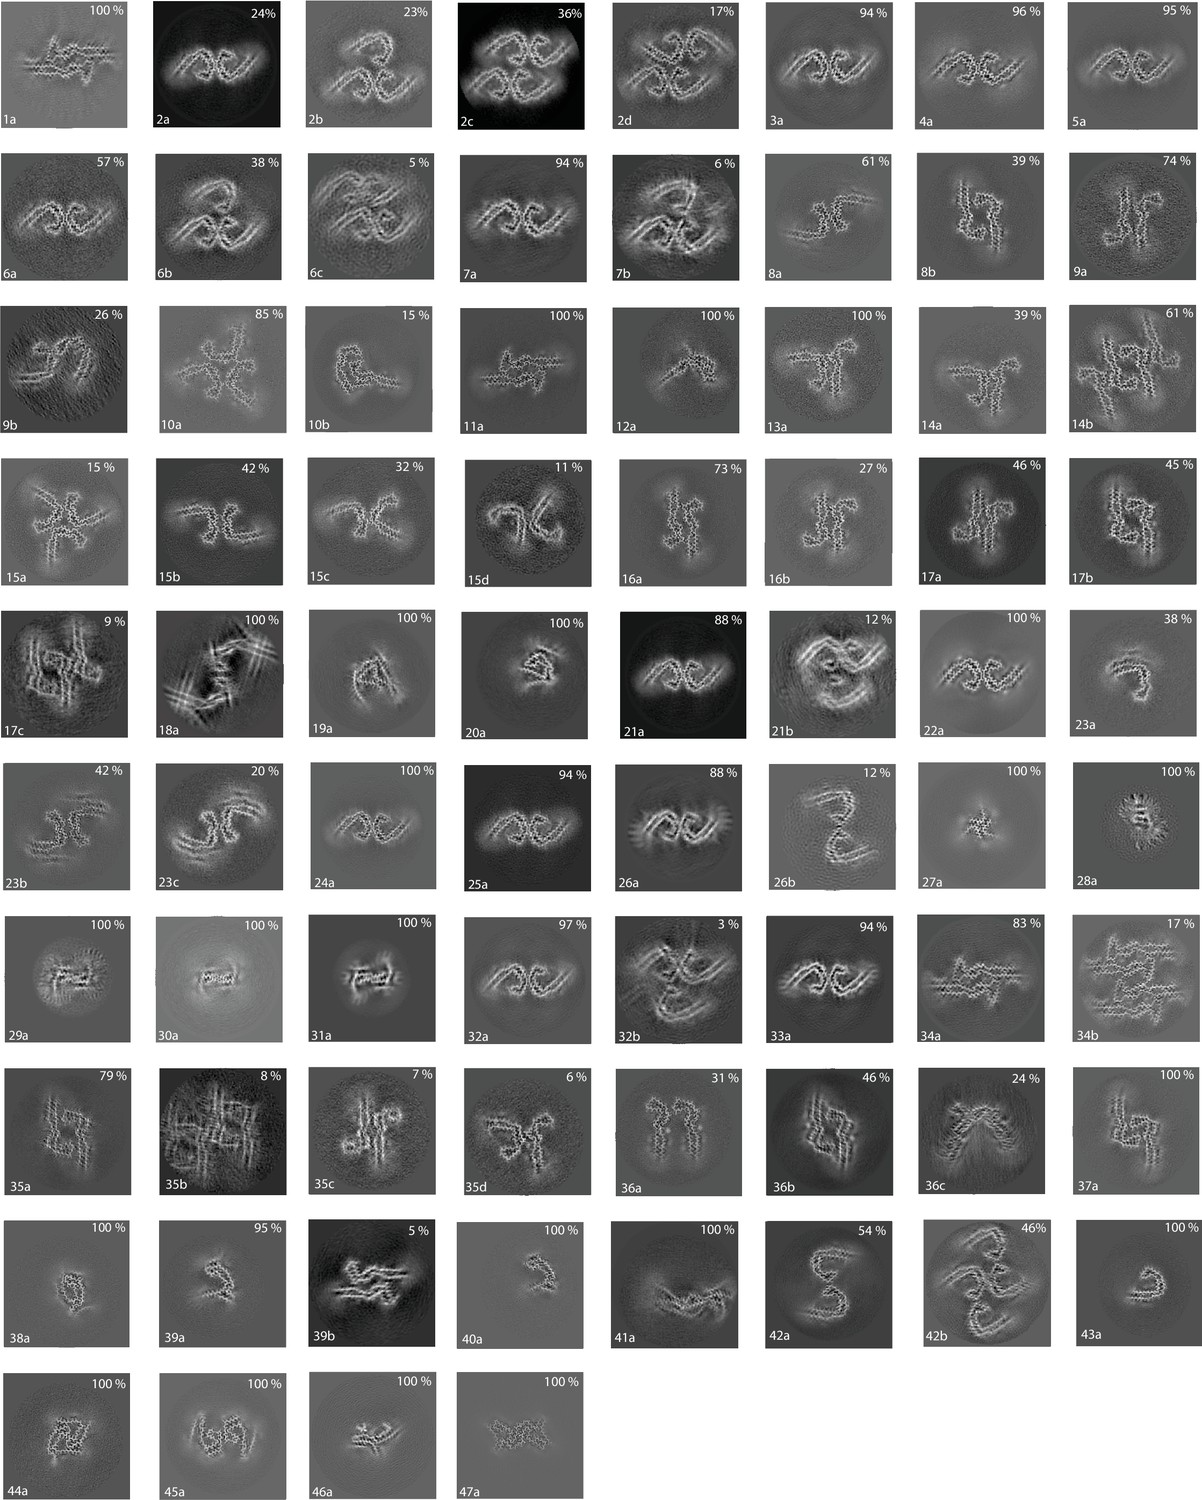
Cross-sections of electron cryo-microscopy (cryo-EM) reconstructions.
Projected slices perpendicular to the helical axis, and with a thickness of approximately 4.7 Å, are shown for all cryo-EM structures described in this paper. For each structure, the filament type (as defined in Table 1) is displayed in the bottom left, and the percentage of a given type in the cryo-EM data set is shown in the top right.
Figure 1—figure supplement 2
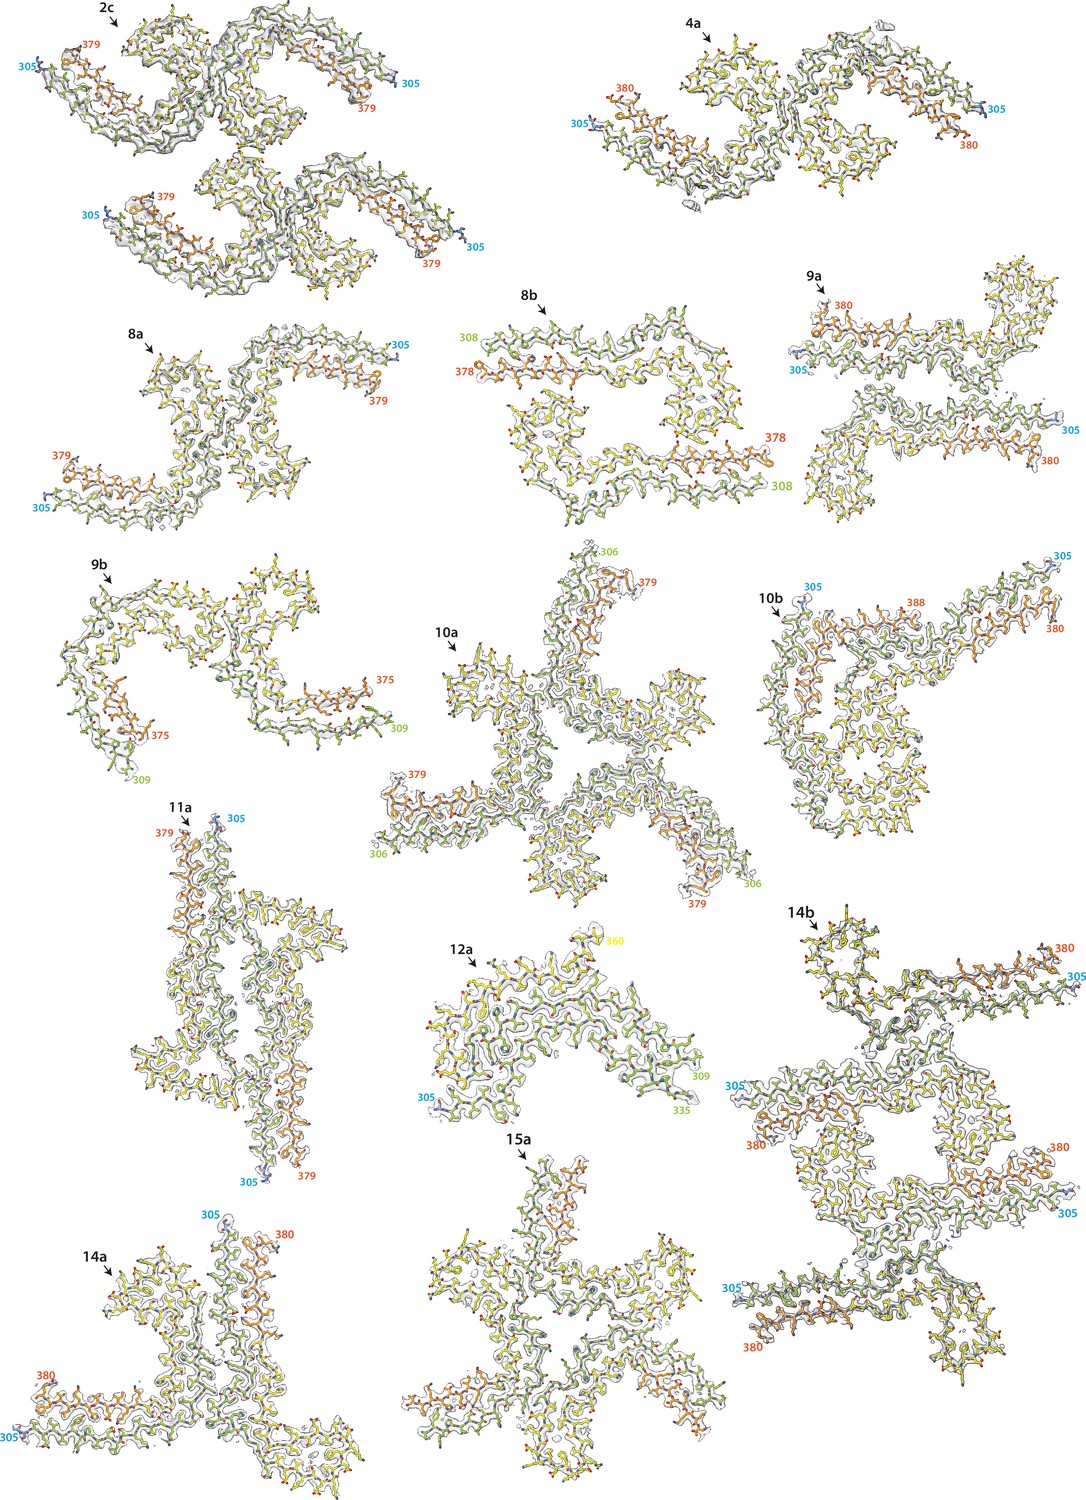
Electron cryo-microscopy (cryo-EM) maps and models of new structures (part 1).
Cryo-EM density maps (grey transparent) and atomic models are shown for filaments with previously unobserved structures. Residues 244–274 (R1) are shown in purple; residues 275–305 (R2) are shown in blue; residues 306–336 (R3) are shown in green; residues 337–368 (R4) are shown in yellow; residues 369–441 (C-terminal domain) are shown in orange. The filament types (as defined in Table 1) are shown at the top left of each structure.
Figure 1—figure supplement 3
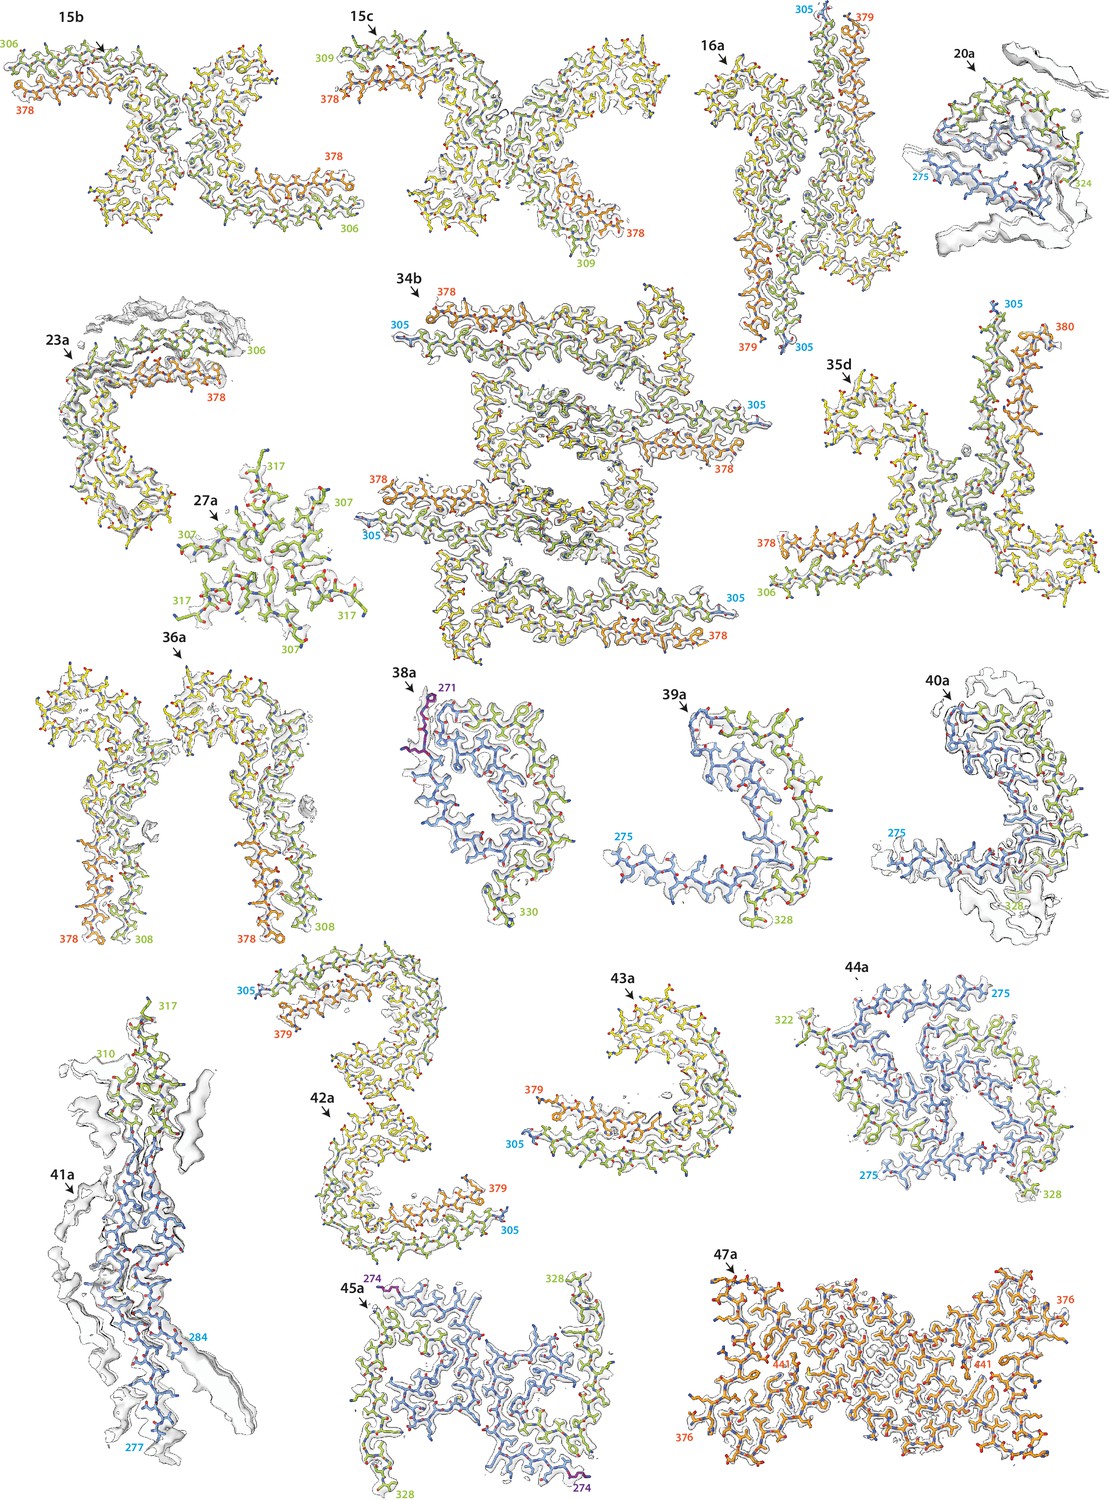
Electron cryo-microscopy (cryo-EM) maps and models of new structures (part 2).
Cryo-EM density maps (grey transparent) and atomic models are shown for filaments with previously unobserved structures. Residues 244–274 (R1) are shown in purple; residues 275–305 (R2) are shown in blue; residues 306–336 (R3) are shown in green; residues 337–368 (R4) are shown in yellow; residues 369–441 (C-terminal domain) are shown in orange. The filament types (as defined in Table 1) are shown at the top left of each structure.
Figure 1—figure supplement 4
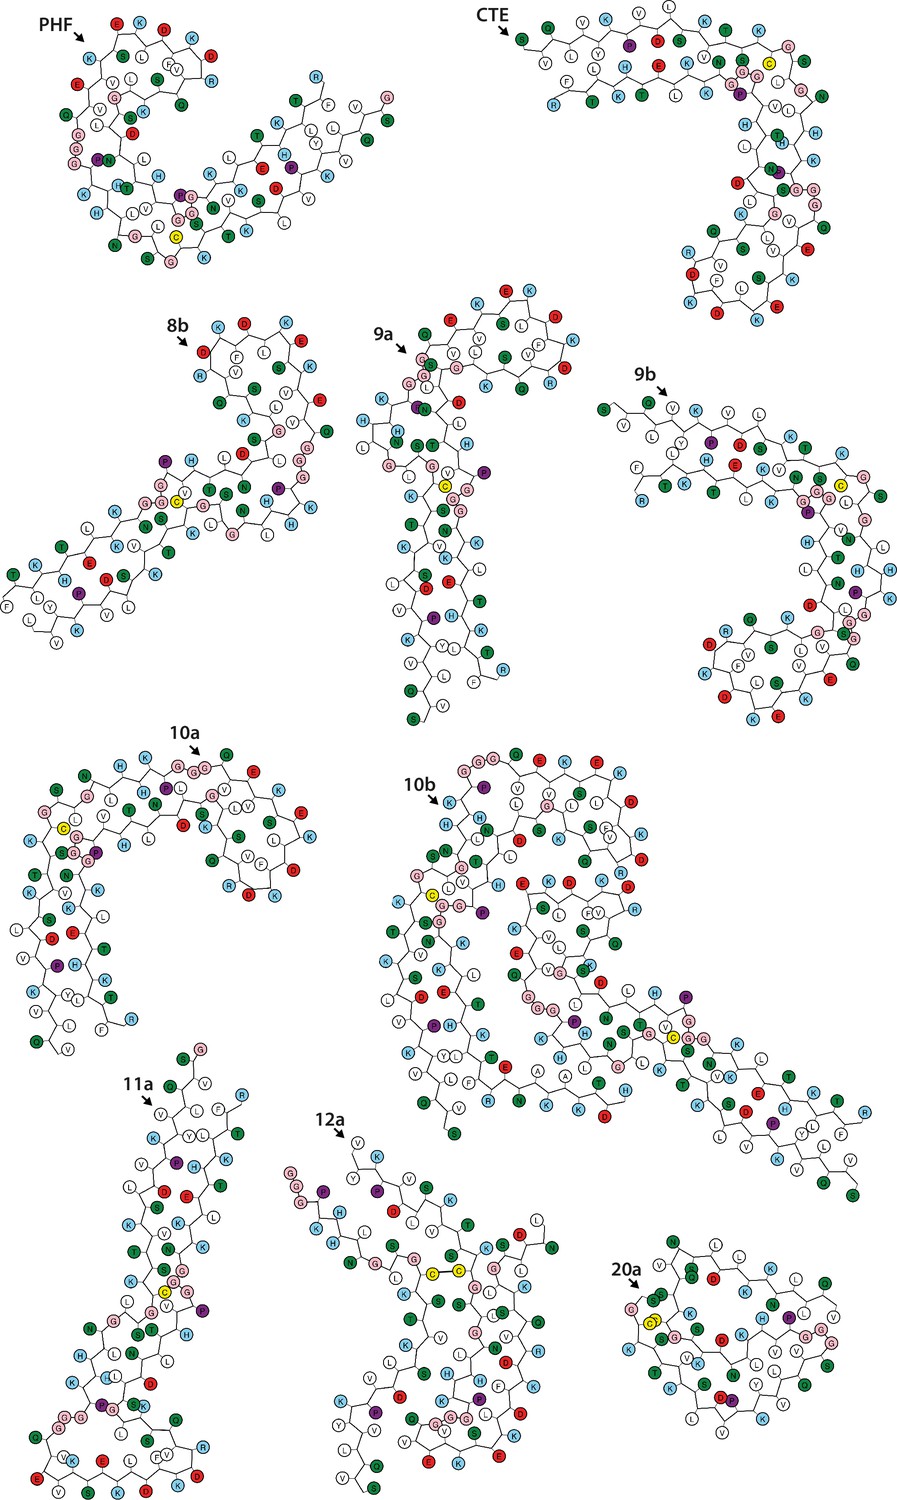
Schematics of the tau folds (part 1).
Negatively charged residues are shown in red, positively charged residues in blue, polar residues in green, non-polar residues in white, sulphur-containing residues in yellow, prolines in purple, and glycines in pink. PHF, paired helical filament; CTE, chronic traumatic encephalopathy.
Figure 1—figure supplement 5
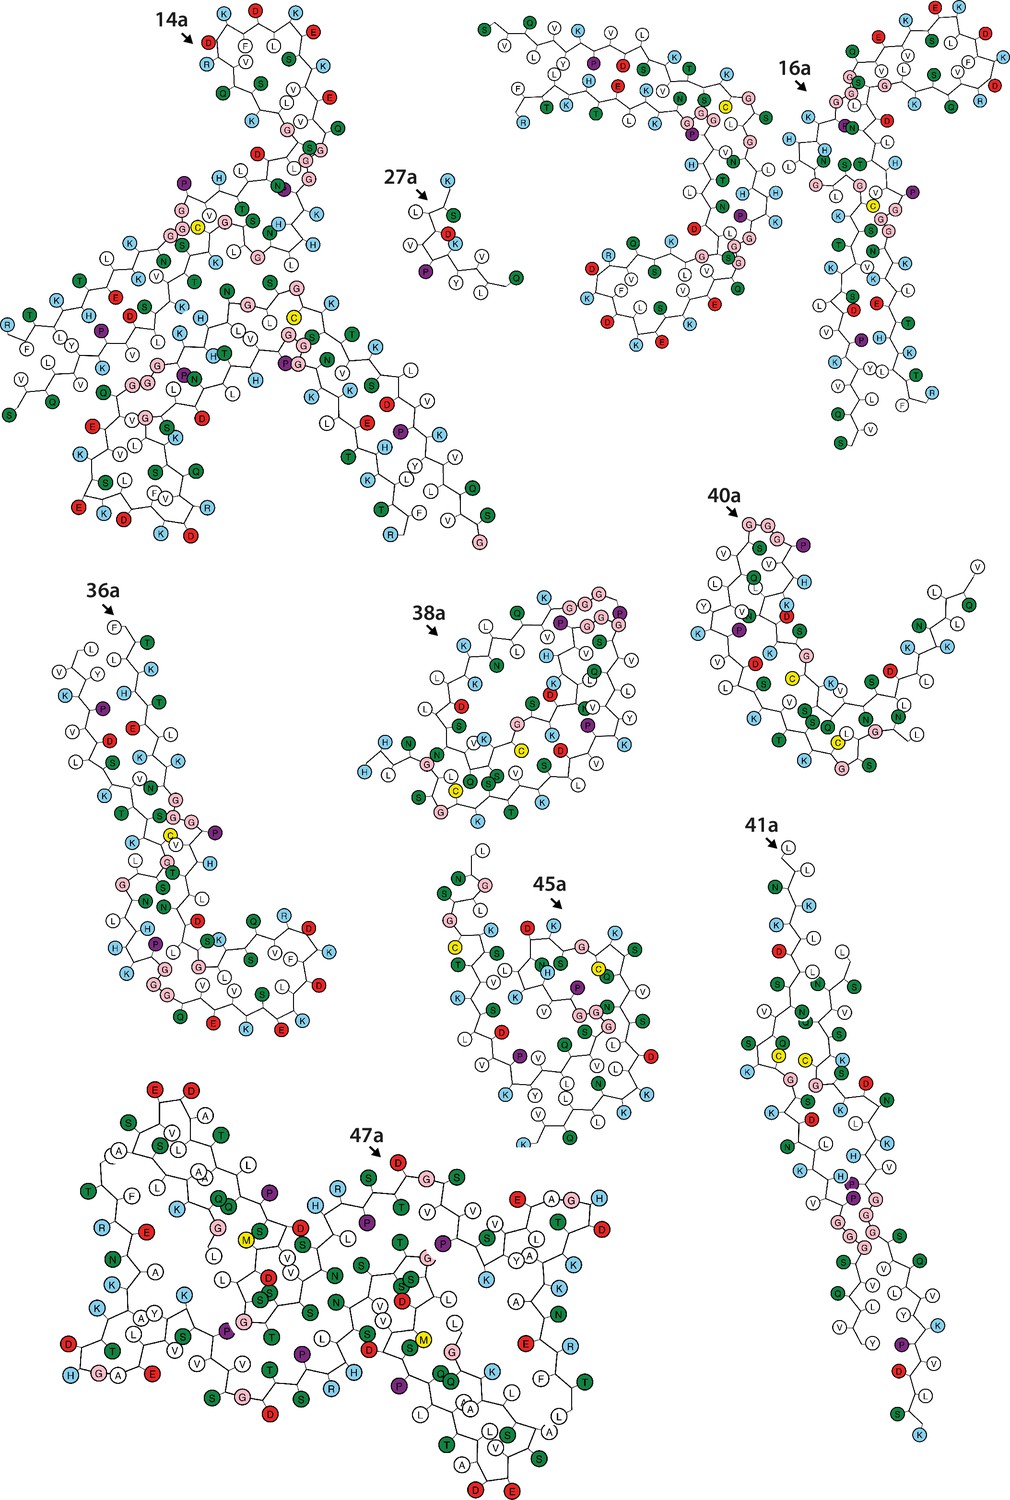
Schematics of the tau folds (part 2).
Negatively charged residues are shown in red, positively charged residues in blue, polar residues in green, non-polar residues in white, sulphur-containing residues in yellow, prolines in purple, and glycines in pink.
Figure 1—figure supplement 6
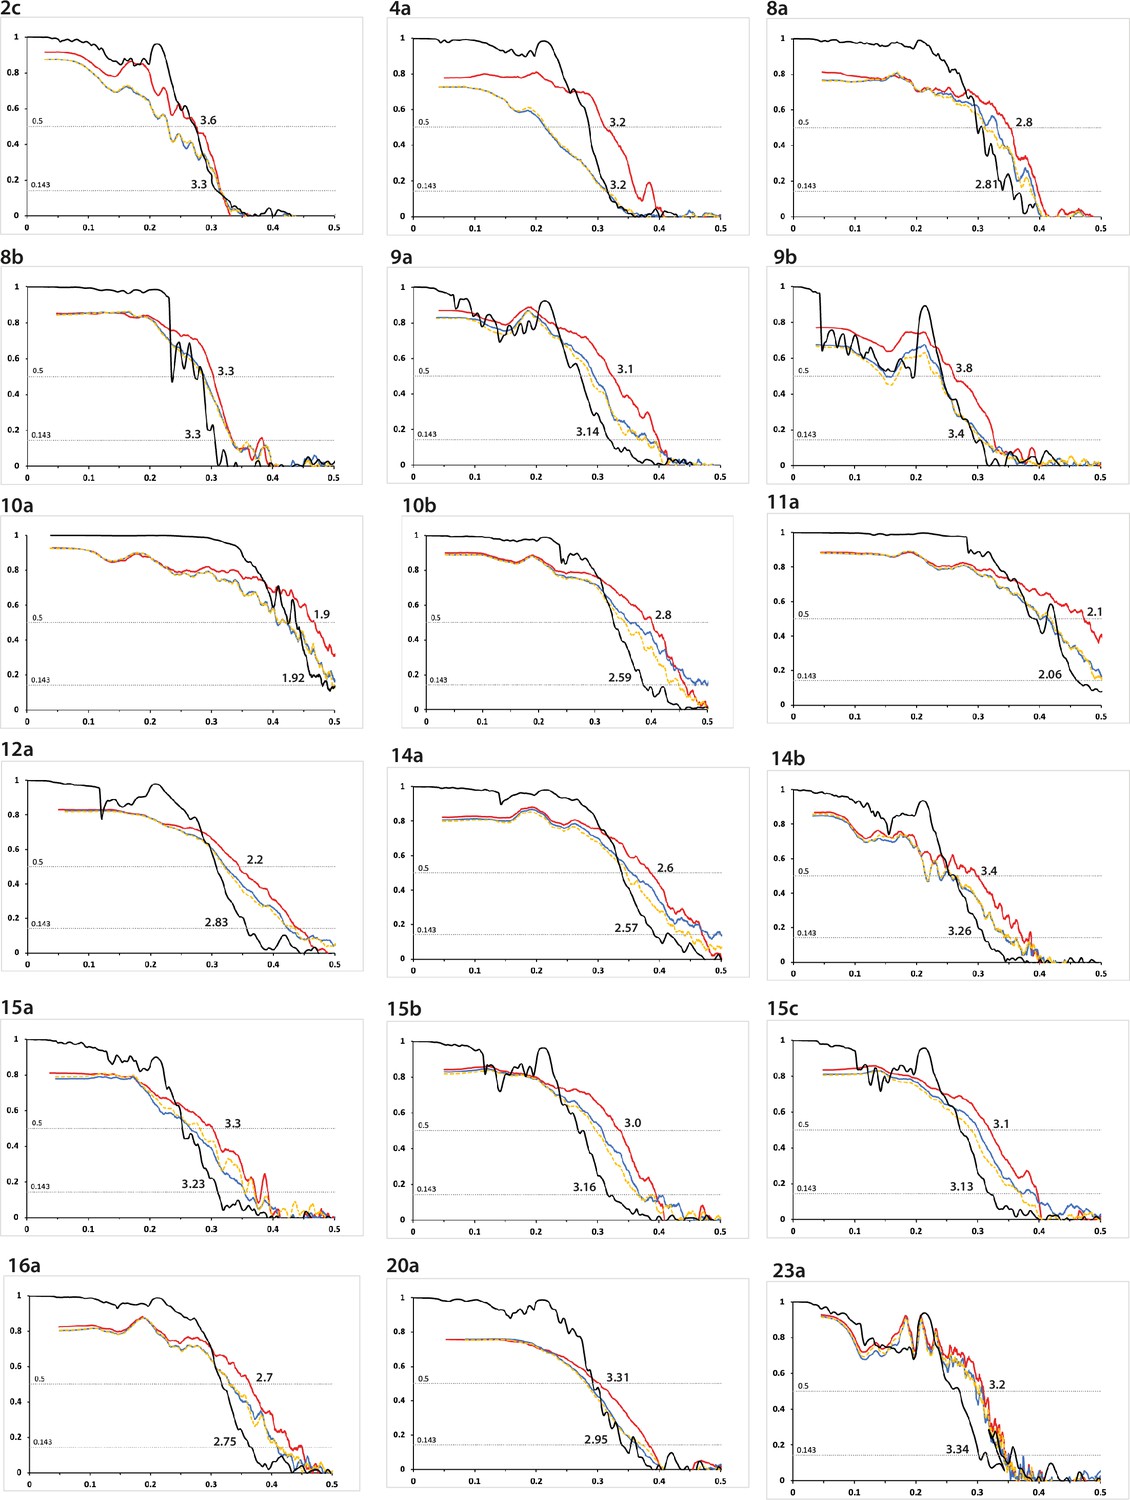
Fourier shell correlation curves (part 1).
FSC curves are shown for two independently refined cryo-microscopy (cryo-EM) half-maps (black); for the final refined atomic model against the final cryo-EM map (red); for the atomic model refined in the first half-map against that half-map (blue); and for the refined atomic model in the first half-map against the second half-map (yellow). The resolutions where the black line drops below 0.143 and the red line drops below 0.5 are indicated. The corresponding filament type (as defined in Table 1) is shown at the top left of each graph. See Supplementary file 1 - Tables 1–25 for further details on data processing.
Figure 1—figure supplement 7

Fourier shell correlation curves (part 2).
Figure 1—figure supplement 8
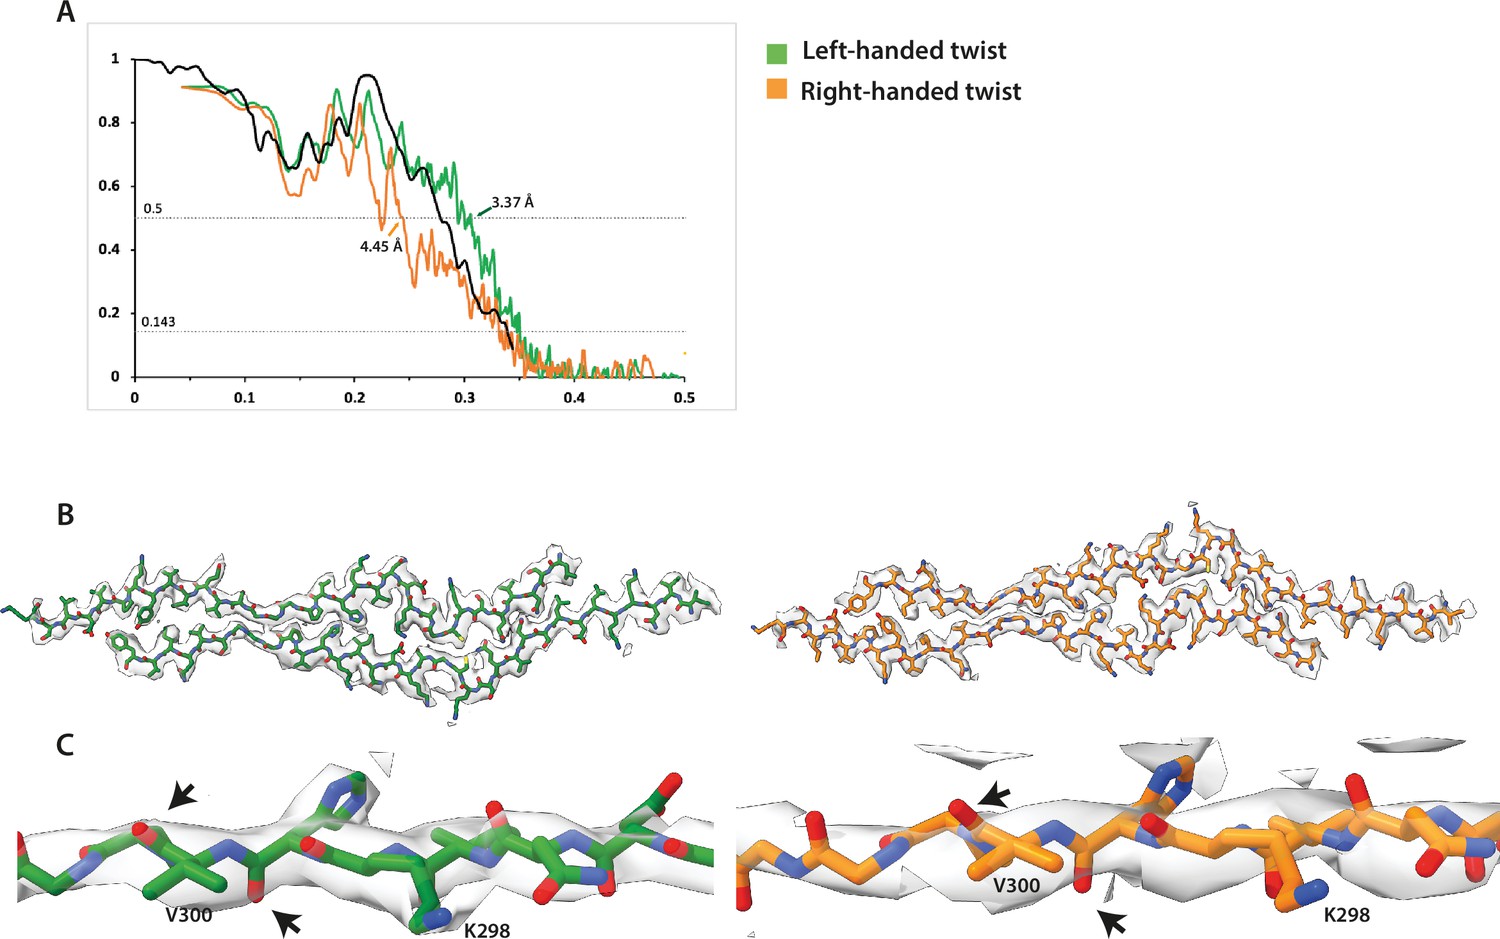
Handedness of structure 41a.
(A) Fourier shell correlation curves for the final refined atomic model against the left-handed map (green) and against the right-handed map (orange). (B) Cryo-microscopy density maps (grey transparent) and atomic models are shown for the left- and right-handed options. (C) Close-up of carbonyls showing a better map-model fit for the left-handed map.
Figure 2 with 1 supplement
Assembly of recombinant tau into filaments like Alzheimer’s disease paired helical filaments (AD PHFs).
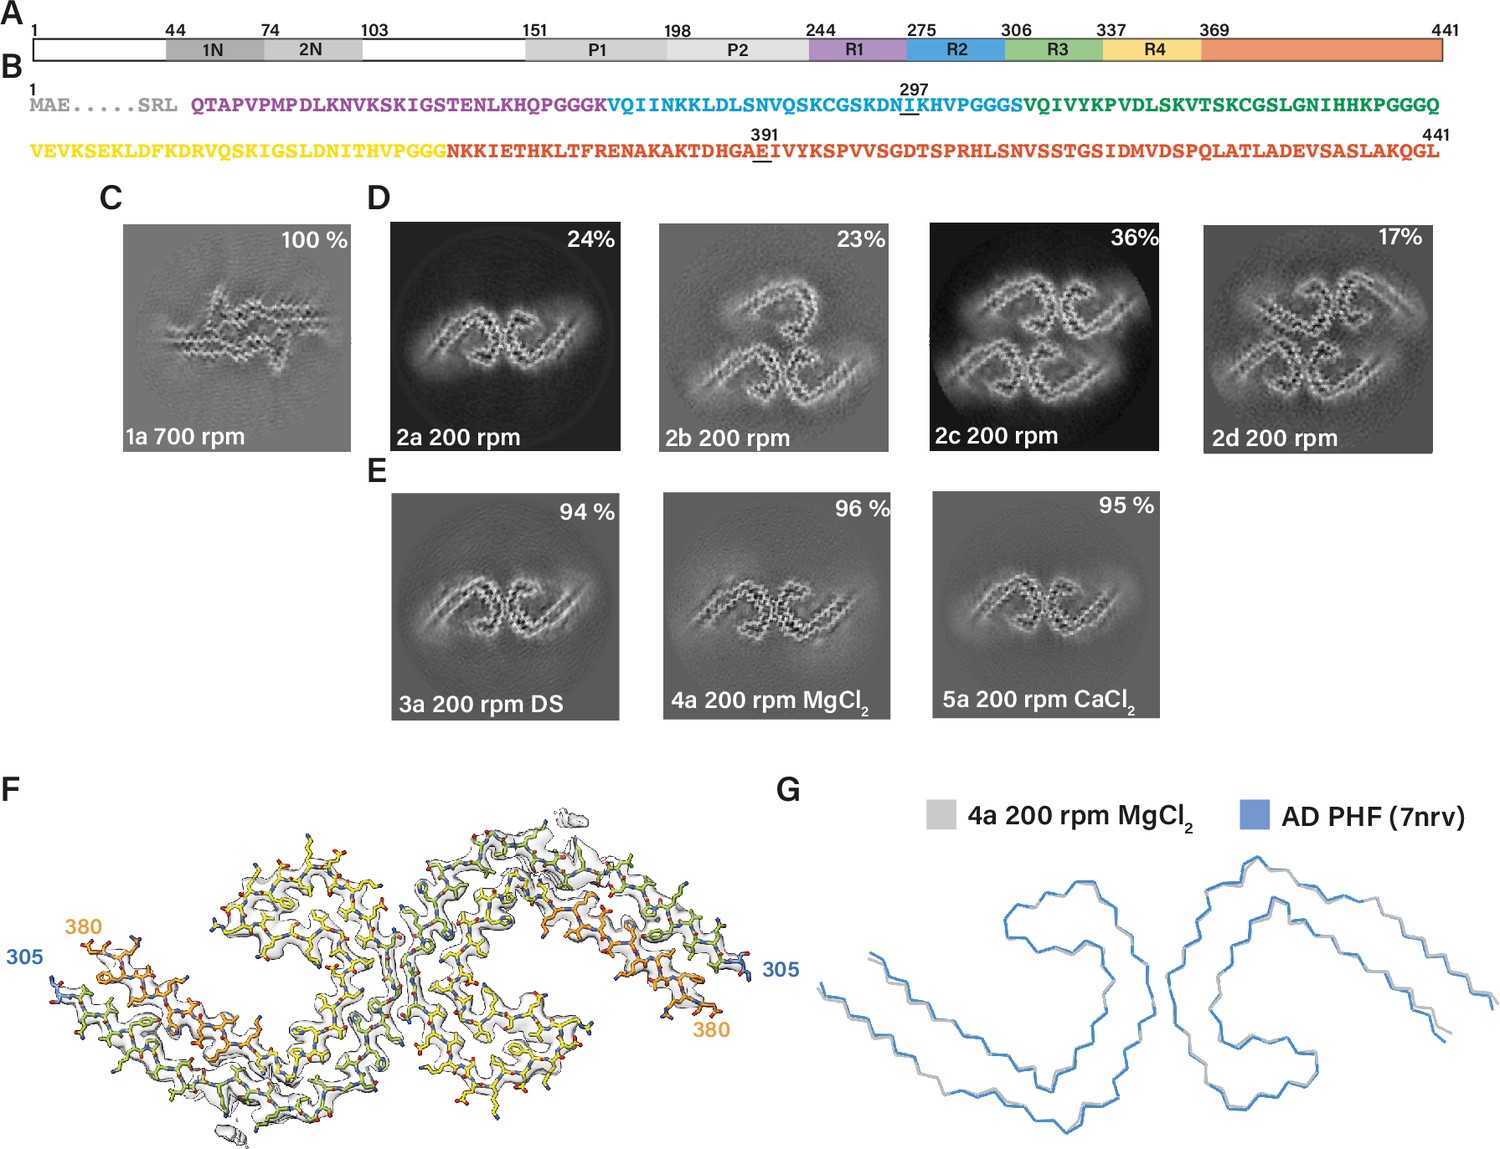
(A) Schematic of 2N4R tau sequence with domains highlighted. The regions 1N (44–73), 2N (74–102), P1 (151–197), and P2 (198–243) are shown in increasingly lighter greys; R1 (244–274) is shown in purple; R2 (275–305) is shown in blue; R3 (306–336) is shown in green; R4 (337–368) is shown in yellow; the C-terminal domain (369-441) is shown in orange. (B) Amino acid sequence of residues 244–441 of tau, with the same colour scheme as in A. (C–E:) Projected slices, with a thickness of approximately 4.7 Å, orthogonal to the helical axis for several cryo-microscopy (cryo-EM) reconstructions. The filament types (as defined in Table 1) are shown at the bottom left and the percentages of types for each cryo-EM data set are given at the top right of the images. (C) Conditions of Al-Hilaly et al., 2017, with shaking at 700 rpm. (D) Our adapted protocol, using 200 rpm shaking. From left to right; paired helical filament (PHF), triple helical filament, quadruple helical filament type 1, and quadruple helical filament type 2. (E) Our optimised conditions for in vitro assembly of relatively pure PHFs.( F) Cryo-EM density map (grey transparent) of in vitro assembled tau filaments of type 4a and the atomic model colour coded according as in A. (G) Backbone ribbon of in vitro PHF (grey) overlaid with AD PHF (blue).
Figure 2—figure supplement 1
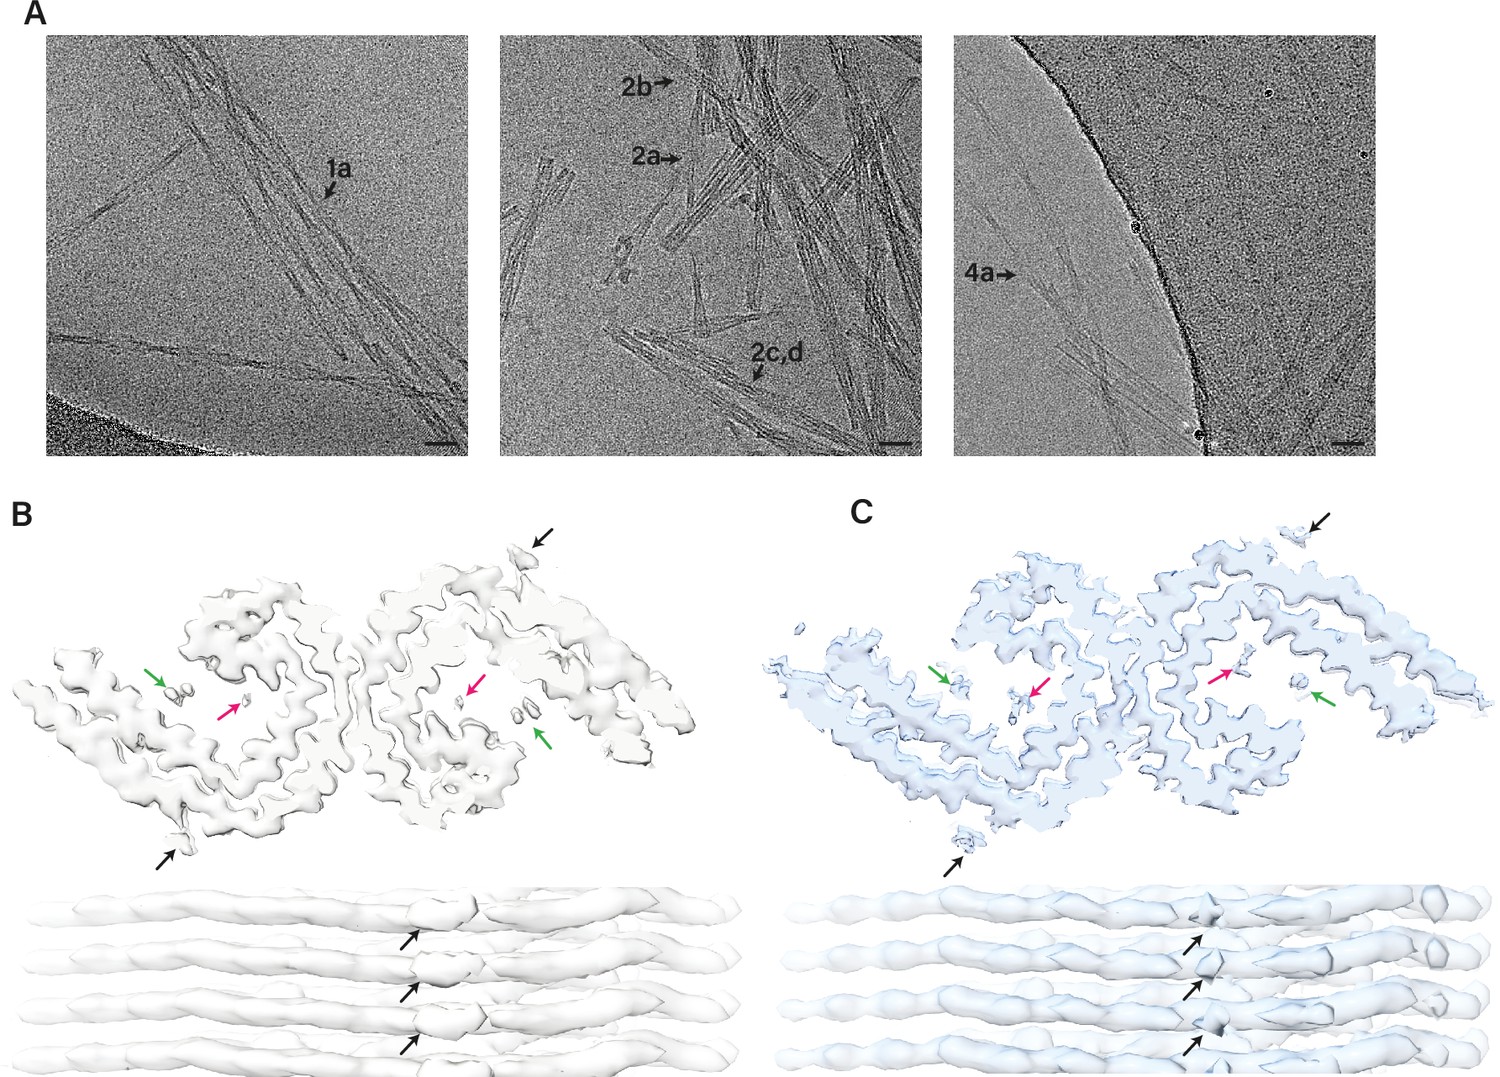
Electron cryo-microscopy (cryo-EM) micrographs and density maps comparing in vitro assembled paired helical filaments (PHFs) and Alzheimer’s disease paired helical filaments (AD PHFs).
(A) Cryo-EM micrographs with filaments from in vitro assembly conditions 1 (left), 2 (middle), and 4 (right). Scale bar represents 100 Å.( B) Cryo-EM density maps of in vitro PHF (filament type 4a, EMDB-14063) as top view (top) and side view (bottom). (C). Cryo-EM density maps of AD PHF (EMDB:0259) as top view (top) and side view (bottom). The black arrows point to densities in front of lysines 317 and 321; the green and pink arrows point to densities inside the C-shape.
Figure 3 with 3 supplements
Assembly of recombinant tau into filaments like chronic traumatic encephalopathy (CTE) type II filaments.
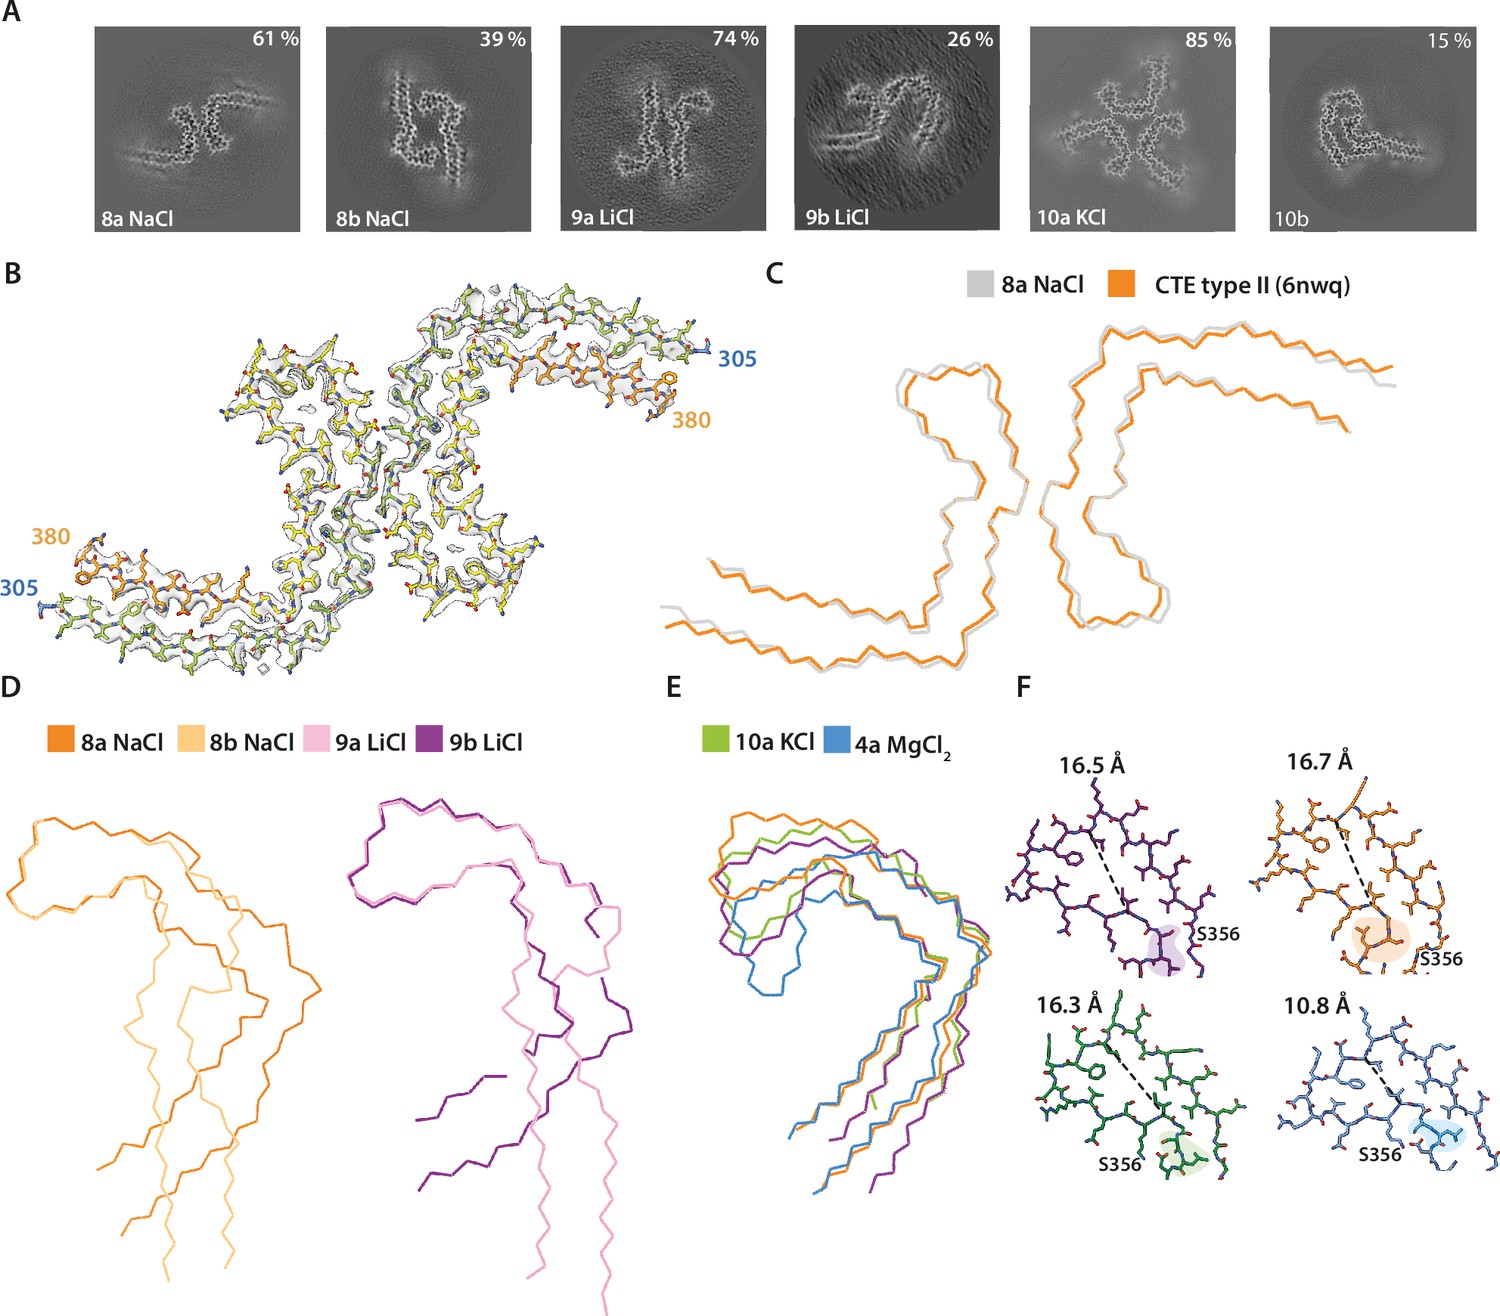
(A) Projected slices, with a thickness of approximately 4.7 Å, orthogonal to the helical axis are shown for different assembly conditions and filament types (as defined in Table 1), which are indicated in the bottom left. The percentages of types are shown in the top right of each panel. ( B) Cryo-EM density map (grey transparent) of filament type 8a and the corresponding atomic model with the same colour scheme as in Figure 1. (C–E) Backbone ribbon views of protofilament and filament folds. (C) In vitro NaCl filament type 8a (grey) overlaid with CTE type II (orange). (D) Extended and C-shaped protofilaments aligned at residues 338–354 for LiCl, filament types 9a and 9b (left) and NaCl, filament types 8a and 8b (right). (E) Filament types 8b (NaCl), 9a (LiCl), 10a (KCl), and 4a (MgCl2) aligned at residues 356–364. (F) Atomic view of residues 334–358. The distance between the Cα of L344 and I354 is indicated. Filament types 8a, 8b, 9a, 9b, and 10a are shown in light purple, dark purple, dark orange, light orange, and blue, respectively.
Figure 3—figure supplement 1
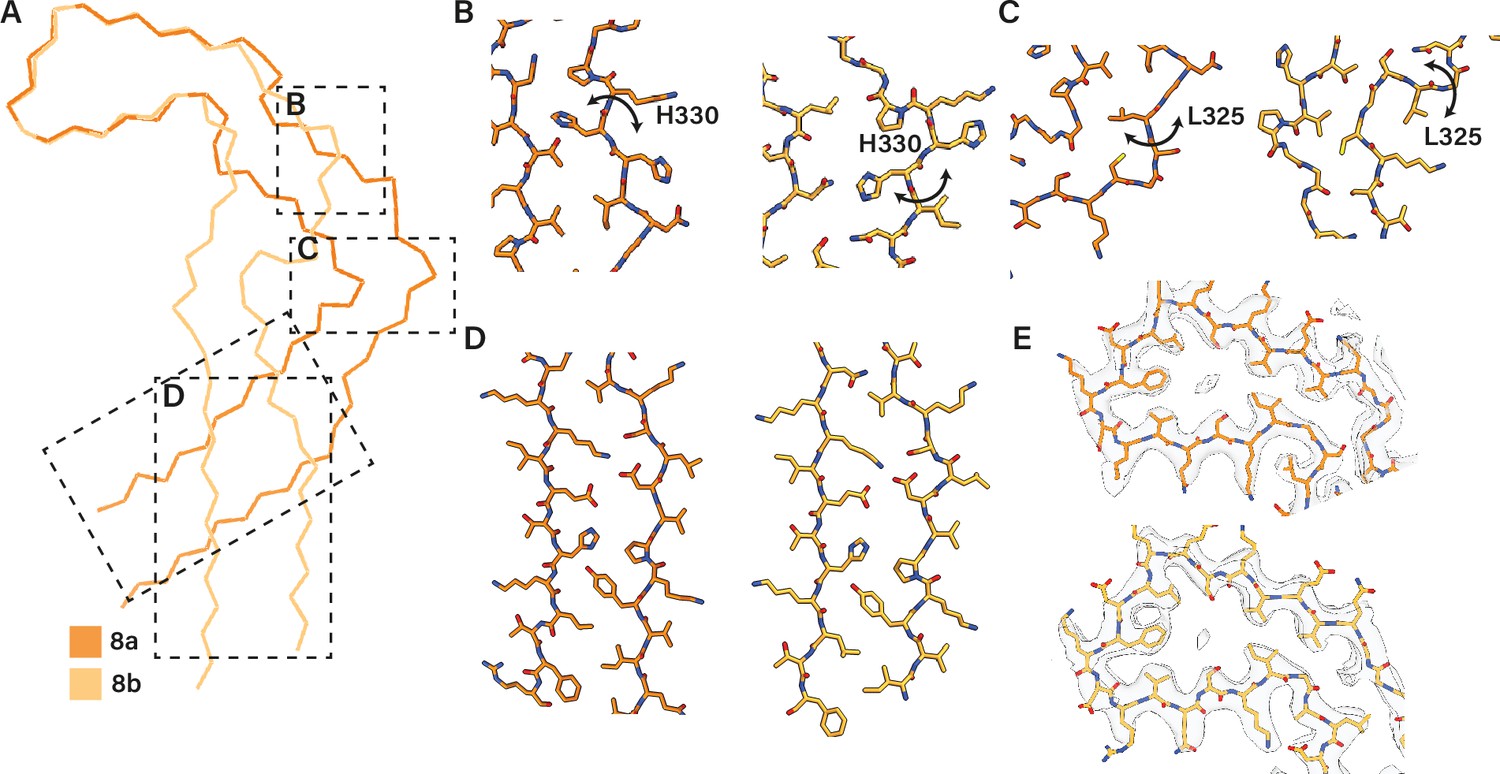
Extended and C-shaped NaCl protofilaments.
(A) Backbone ribbon view of C-shaped (filament type 8a) and extended (filament type 8b) protofilaments formed with NaCl, aligned at residues 338–354. (B–D) Close-up atomic view of regions highlighted in A. (E) Cryo-microscopy density map (transparent grey) and the atomic model at residues 338–354. Filament types 8a and 8b are shown in dark and light orange, respectively.
Figure 3—figure supplement 2
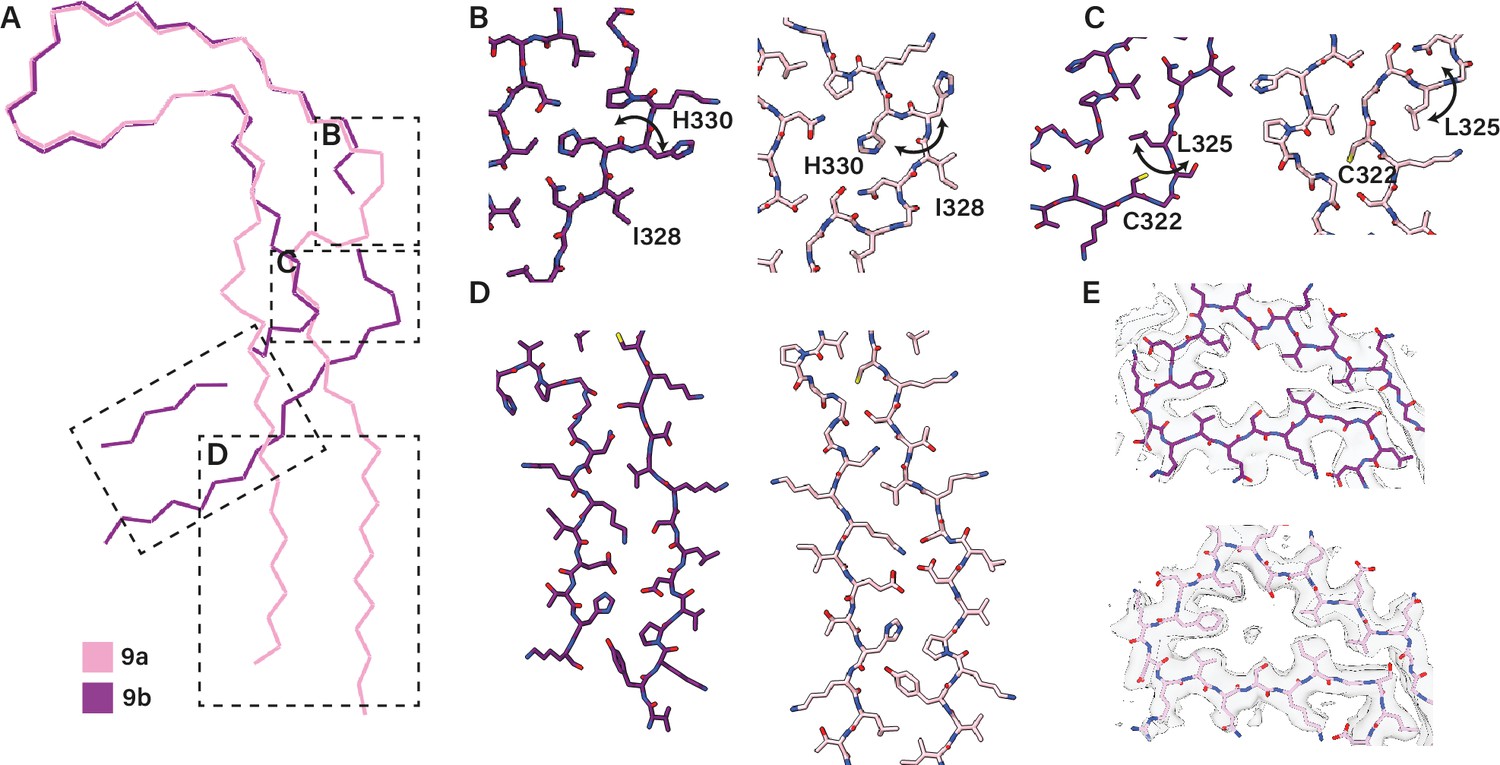
Extended and C-shaped LiCl protofilaments.
(A) Backbone ribbon view of extended (filament type 9a) and C-shaped (filament type 9b) protofilaments formed with LiCl, aligned at residues 338–354.( B–D) Close-up atomic view of regions highlighted in A. (E) Cryo-microscopy density map (transparent grey) and the atomic model at residues 338–354. Filament types 9a and 9b are shown in light and dark purple, respectively.
Figure 3—figure supplement 3
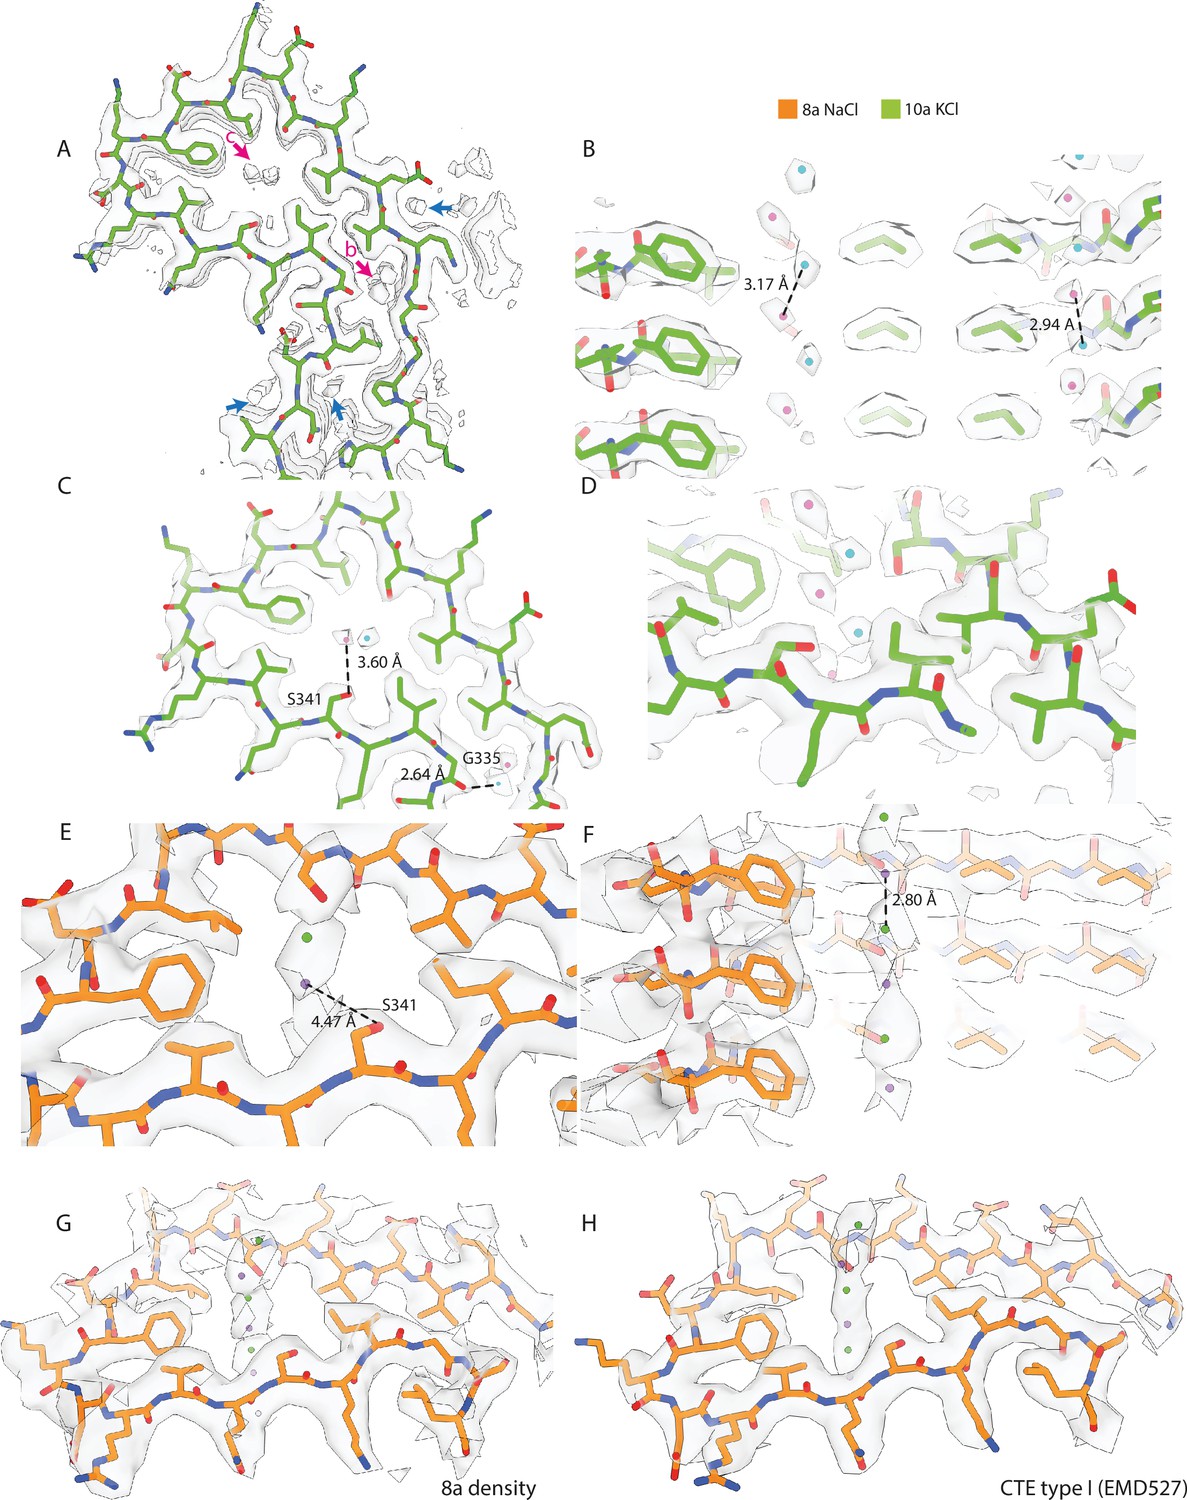
Cryo-microscopy (cryo-EM) densities inside the cavities of KCl and NaCl filaments.
(A–H) Cryo-EM density map (transparent grey) and the corresponding atomic models for filament types 7a (assembled with NaCl) and 8a (assembled with KCl) are shown in orange and green, respectively.( A) Cryo-EM density at the tip of the protofilament of 8a with additional non-proteinaceous densities highlighted by arrows. Blue arrows represent putative water molecules; pink arrows represent putative K+ or Cl− ions. K+ ions are shown in pink; Cl− ions are shown in cyan. (B–D) Close-up view of putative K+ and Cl− ion pairs. Distances between K+ and Cl− ions, and Oγ of S341 or the carbonyl oxygen of G335 are indicated. (E) Cryo-EM density of the tip of the protofilament of 8a with putative Na+ and Cl− ions fitted into the density. Purple arrow represents putative Na+ or Cl− ions; Na+ ions are shown in purple; Cl− ions are shown in cyan. (F–G) Close-up view of putative Na+ and Cl− ions. Distances between the Na+ and Cl− ions and the Oγ of S341 are indicated. (H) Cryo-EM density of chronic traumatic encephalopathy type I (EMD:0527), with putative Na+ and Cl− ions modelled inside the additional density.
Figure 4 with 2 supplements
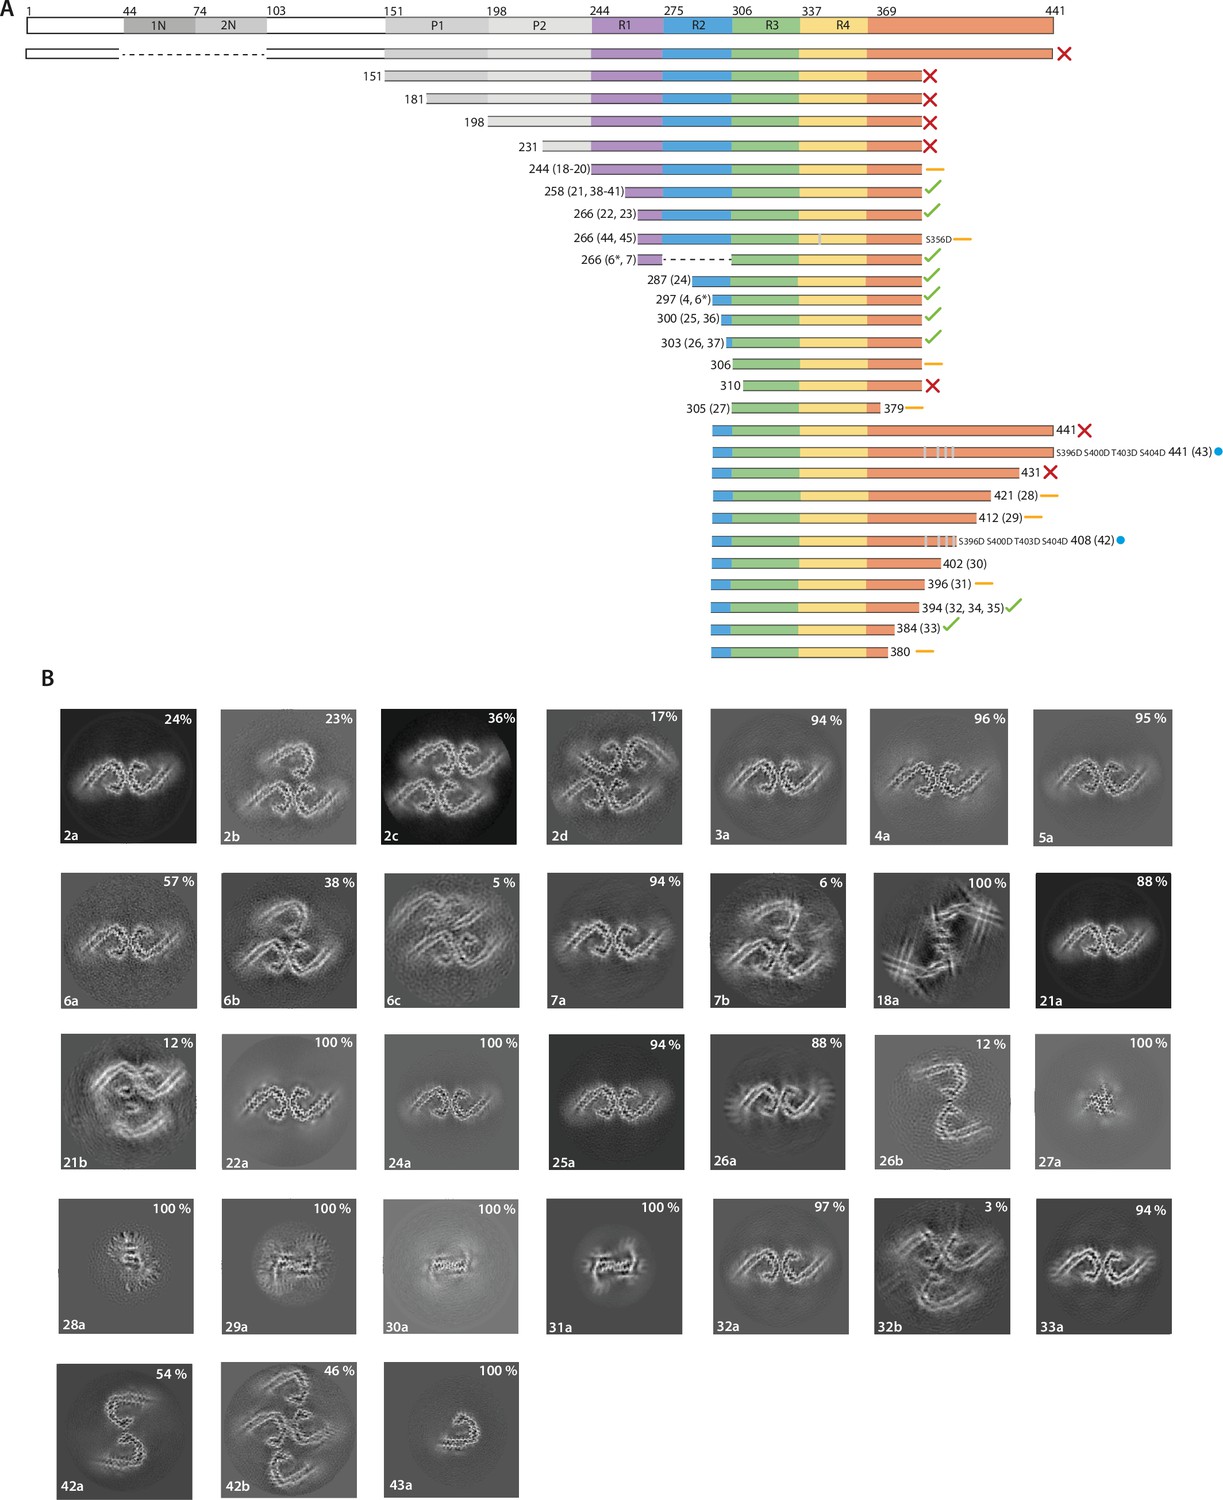
The effects of protein length on tau filament assembly.
(A) Schematic representation of 2N4R tau and the constructs used in this study. A red cross indicates that no filaments were formed; an orange dash indicates that filaments with structures distinct from Alzheimer’s disease paired helical filaments (AD PHFs) were formed; a blue circle indicates that the AD protofilament fold was formed; a green tick indicates that AD PHFs were formed. Resulting filament types (as defined in Table 1) are indicated for each experiment. (B) Projected slices, with a thickness of approximately 4.7 Å, orthogonal to the helical axis for the filaments formed with the constructs in A. Filament types are indicated at the bottom left; percentages of filament types in each cryo-EM data set are shown in the top right. (*) 50:50 ratio of 266–391 (3R) and 297–391 (4R) tau.
Figure 4—figure supplement 1
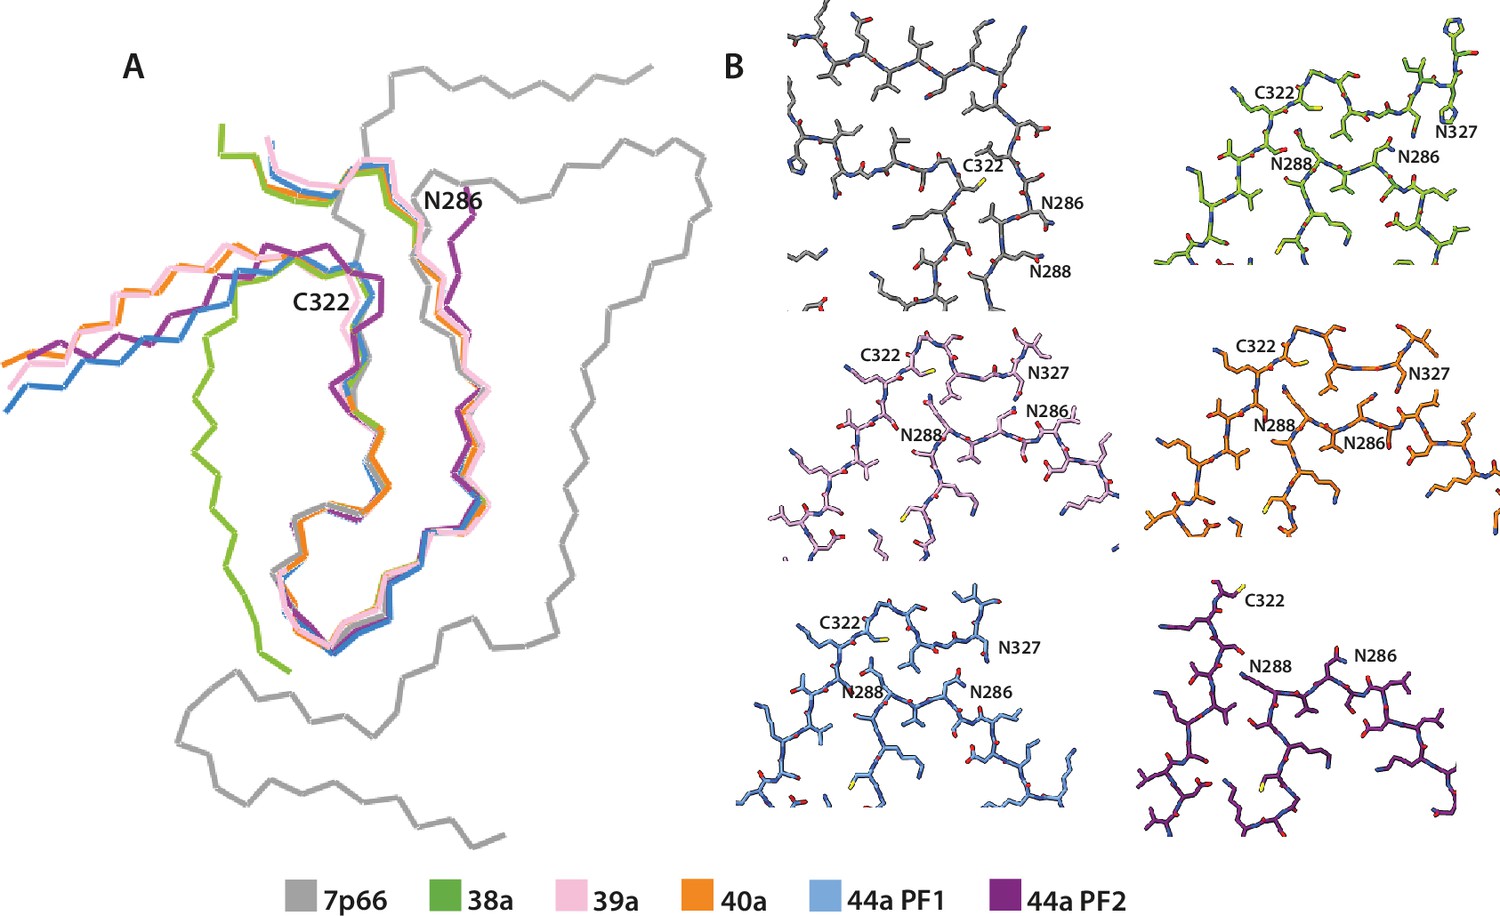
Comparison of in vitro assembled tau filaments with the globular glial tauopathy (GGT) fold.
(A) Backbone ribbon view of GGT type 1 (PDB:7p66) and tau filaments from in vitro assembled filament types 27a, 28a, 29a, 32a protofilament (PF)1, and 32a PF2, aligned at residues 288–322. (B) Close-up atomic view. 7p66 is shown in grey, 27a in green, 28a in pink, 29a in orange, 32a PF-1 in blue, and 32a PF-2 in purple.
Figure 4—figure supplement 2
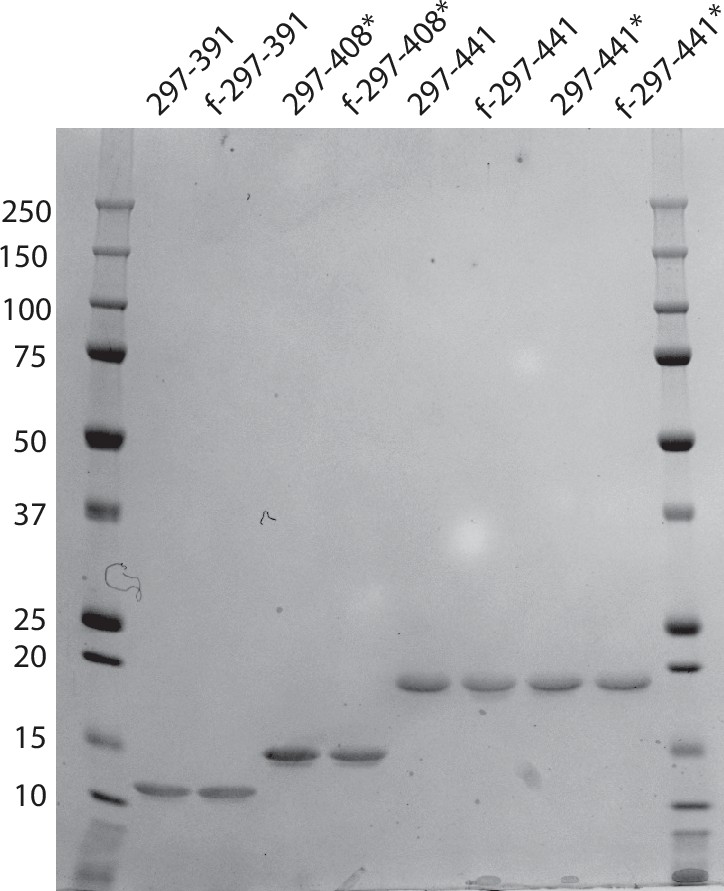
Coomassie stained sodium dodecyl-sulfate polyacrylamide gel electrophoresis (SDS-PAGE) gel for constructs 297–391, 297–408, and 296–441 before and after filament assembly.
About 3.5 μg of protein was loaded into each well. f: after filament assembly; *: constructs with the four-phospho-mimetic mutations: S396D, S400D, T403D, and S404D.
Tables
Table 1
In vitro assembly conditions for all filament types.
| Filament types | Construct (residues) | Buffer | Shaking (rpm) | Time(hr) | Fold |
|---|---|---|---|---|---|
| 1a | 297–391 | 10 mM PB 10 mM DTT pH 7.4 | 700 | 48 | New |
| 2a–d | 297–391 | 10 mM PB 10 mM DTT pH 7.4 | 200 | 48 | AD |
| 3a | 297–391 | 10 mM PB 10 mM DTT pH 7.40.1 μg /ml dextran sulphate | 200 | 48 | AD |
| 4a | 297–391 | 10 mM PB 10 mM DTT pH 7.4 200 mM MgCl2 | 200 | 48 | AD |
| 5a | 297–391 | 10 mM PB 10 mM DTT pH 7.4 20 mM CaCl2 | 200 | 48 | AD |
| 6a–c | 266/297–391* | 10 mM PB 10 mM DTT pH 7.4 | 200 | 48 | AD |
| 7a–b | 266–273 –391 | 10 mM PB 10 mM DTT pH 7.4 200 mM MgCl2 | 200 | 48 | AD |
| 8a–b | 266/297–391 | 10 mM PB pH 7.4 10 mM DTT 200 mM NaCl | 200 | 48 | CTE |
| 9a–b | 266/297–391 | 10 mM PB pH 7.4 10 mM DTT 200 mM LiCl | 200 | 48 | New |
| 10a–b | 266/297–391 | 10 mM PB pH 7.4 10 mM DTT 200 mM KCl | 200 | 48 | New |
| 11a | 266/297–391 | 10 mM PB pH 7.4 10 mM DTT 100 μM ZnCl2 | 200 | 48 | New |
| 12a | 266/297–391 | 10 mM PB pH 7.4 10 mM DTT 200 μM CuCl2 | 200 | 48 | New |
| 13a | 266/297–391 | 10 mM PB pH 7.4 10 mM DTT 20 mM MgCl2 50 mM KCl 50 mM NaCl | 200 | 48 | New |
| 14a–b | 266/297–391 | 10 mM PB pH 7.4 10 mM DTT 20 mM MgCl2 100 mM NaCl | 200 | 48 | New |
| 15a–d | 266/297–391 | 10 mM PB pH 7.4 10 mM DTT 10 mM MgSO4 100 mM NaCl | 200 | 48 | CTE |
| 16a–b | 266/297–391 | 10 mM PB pH 7.4 10 mM DTT 10 mM NaHCO3 100 mM NaCl | 200 | 48 | New |
| 17a–c | 266/297–391 | 10 mM PB pH 7.4 10 mM DTT 500 mM NaCl | 200 | 48 | New |
| 18a | 244–391 | 50 mM PB pH 7.4 10 mM DTT 20 mM MgCl2 | 200 | 76 | New |
| 19a | 244–391 | 50 mM PB pH 7.4 10 mM DTT 200 mM NaCl | 200 | 76 | New |
| 20a | 244–391 | 10 mM PB 10 mM DTT 5 mM Na4P2O7 | 200 | 76 | New |
| 21a–b | 258–391 | 10 mM PB pH 7.4 10 mM DTT 200 mM MgCl2 | 200 | 48 | New |
| 22a | 266–391 | 10 mM PB pH 7.4 10 mM DTT 200 mM MgCl2 | 200 | 48 | New |
| 23a–c | 266–391 | PBS pH 7.4 10 mM DTT | 200 | 48 | CTE |
| 24a | 287–391 | 10 mM PB pH 7.4 10 mM DTT 200 mM MgCl2 | 200 | 48 | AD |
| 25a | 300–391 | 10 mM PB pH 7.4 10 mM DTT 200 mM MgCl2 | 200 | 48 | AD |
| 26a | 303–391 | 10 mM PB pH 7.4 10 mM DTT 200 mM MgCl2 | 200 | 48 | AD |
| 27a | 305–379 | 10 mM PB pH 7.4 10 mM DTT 200 mM MgCl2 | 200 | 48 | New |
| 28a | 297–421 | 10 mM PB pH 7.4 10 mM DTT 200 mM MgCl2 | 200 | 48 | New |
| 29a | 297–412 | 10 mM PB pH 7.4 10 mM DTT 200 mM MgCl2 | 200 | 48 | New |
| 30a | 297–402 | 10 mM PB pH 7.4 10 mM DTT 200 mM MgCl2 | 200 | 48 | New |
| 31a | 297–396 | 10 mM PB pH 7.4 10 mM DTT 200 mM MgCl2 | 200 | 48 | New |
| 32a–b | 297–394 | 10 mM PB pH 7.4 10 mM DTT 200 mM MgCl2 | 200 | 48 | AD |
| 33a | 297–384 | 10 mM PB pH 7.4 10 mM DTT 200 mM MgCl2 | 200 | 48 | AD |
| 34a–b | 297–394 | 10 mM PB pH 7.4 10 mM DTT | 700 | 48 | AD |
| 35a–d | 297–394 | PBS pH 7.4 10 mM DTT | 700 | 48 | New |
| 36a–c | 300–391 | PBS pH 7.4 10 mM DTT | 700 | 48 | New |
| 37a | 303–391 | PBS pH 7.4 10 mM DTT | 700 | 48 | New |
| 38a | 258–391 | 10 mM PB pH 7.4 10 mM DTT | 700 | 48 | GGT |
| 39a–b | 258–391 | 10 mM PB pH 7.4 10 mM DTT 5 mM phosphoglycerate | 700 | 48 | GGT |
| 40a | 258–391 | 10 mM PB pH 7.4 10 mM DTT 300 ug/ul heparan sulphate | 700 | 48 | GGT |
| 41a | 258–391 | 10 mM PB pH 7.4 10 mM DTT 0.1% NaN3 | 700 | 48 | New |
| 42a–b | 297–408 4-pmm* | 10 mM PB pH 7.4 10 mM DTT 200 mM MgCl2 | 200 | 48 | AD |
| 43a | 297–441 4-pmm | 10 mM PB pH 7.4 10 mM DTT 200 mM MgCl2 | 200 | 48 | AD |
| 44a | 266–391 S356D | 10 mM PB pH 7.4 10 mM DTT 200 mM KCl | 200 | 48 | New |
| 45a | 266–391 S356D | 10 mM PB pH 7.4 10 mM DTT 200 mM NaCl | 200 | 48 | New |
| 46a | 0N4R | PBS pH 7.4 5 mM TCEP 50 ug/mL polyA RNA | 200 | 96 | New |
| 47a | 0N4R | PBS pH 7.4 5 mM TCEP 5 mM L-phosphoserine | 200 | 96 | New |
-
DTT: 1,4-dithiothreitol PB: Na2HPO4, NaH2PO4; Dextran sulphate: molecular weight 7–20 kDa (9011-18-1, Sigma-Aldrich); Heparan sulphate: 50–200 disaccharide units (57459-72-0, Sigma-Aldrich); Poly-A RNA (26763-19-9, Sigma-Aldrich); PBS: Phospho-buffered saline; TCEP: Tris(2-carboxyethyl) phosphine; *4-pmm: four-phospho mimetic mutations: S396D S400D T403D S404D *PB: Na2HPO4, NaH2PO4;*266/297–391: 50:50 ratio of 266LKHQ269 (3 R) and 297IKHV300 (4 R) –391. Fold: AD: Alzheimer’s Disease protofilament fold, CTE: chronic traumatic encephalopathy protofilament fold and GGT: globular glial tauopathy-like fold, New: new tau fold.
Key resources table
| Reagent type (species) or resource | Designation | Source or reference | Identifiers | Additional information |
|---|---|---|---|---|
| Recombinant DNA reagent | Plasmid: pRK172-0N4R | PMID:2124967 | NCBI ReferenceSequence:NM_005910.5 | All constructs were derived from this plasmid |
| Strain, strain background (Escherichia coli) | BL21(DE3) | Agilent | 200,131 | Chemically competent cells |
| Software, algorithm | RELION | PMID:30412051 | RRID:SCR_016274 | RELION 4.0Helical reconstruction |
| Software, algorithm | Coot | PMID:20383002 | RRID:SCR_014222 | Model building |
| Software, algorithm | ISOLDE | PMID:20383002 | Model refinement |
Table 2
Data acquisition details for the different microscopes.
| Microscope | LMB Krios G1 | LMB Krios G2 | TFS Glacios | TFS Krios G4 |
|---|---|---|---|---|
| Magnification | 105,000 | 96,000 | 165,000 | 165,000 |
| Camera | K2*/K3 | Falcon 4 | Falcon 4 | Falcon 4 |
| Energy filter (eV) | 20 | NA | 10 | 10 |
| Voltage (kV) | 300 | 300 | 200 | 300 |
| Electron exposure (e–/Å2) | 40 | 30/40 | 40 | 40 |
| Defocus range (μm) | 1.5–3 | 1.2–2.5 | 0.6–1.2 | 0.6–1.2 |
| Pixel size (Å) | 0.85/1.145* | 0.824 | 0.672 | 0.727 |
-
LMB: Laboratory of Molecular Biology.
-
*
LMB Krios G1 initially had a K2 camera, which was later replaced by a K3 camera. Only condition 1 a (as defined in Table 1) was collected on the K2 camera. The pixel size on the K2 camera was 1.145 Å.
Additional files
-
Supplementary file 1
Cryo-EM data processing, refinement and validation statistics (Supplementary Tables 1-25).
- https://cdn.elifesciences.org/articles/76494/elife-76494-supp1-v2.docx
-
Transparent reporting form
- https://cdn.elifesciences.org/articles/76494/elife-76494-transrepform1-v2.docx
-
Source data 1
Uncropped gel of Figure 4—figure supplement 2.
- https://cdn.elifesciences.org/articles/76494/elife-76494-data1-v2.zip
Download links
A two-part list of links to download the article, or parts of the article, in various formats.
Downloads (link to download the article as PDF)
Open citations (links to open the citations from this article in various online reference manager services)
Cite this article (links to download the citations from this article in formats compatible with various reference manager tools)
Assembly of recombinant tau into filaments identical to those of Alzheimer’s disease and chronic traumatic encephalopathy
eLife 11:e76494.
https://doi.org/10.7554/eLife.76494


