Mesoscale cortex-wide neural dynamics predict self-initiated actions in mice several seconds prior to movement
- Department of Psychiatry, Kinsmen Laboratory of Neurological Research, University of British Columbia, Canada
- Djavad Mowafaghian Centre for Brain Health, University of British Columbia, Canada
- Department of Ophthalmology and Visual Sciences, University of British Columbia, Canada
- Biozentrum, Centre for Molecular Life Sciences, University of Basel, Switzerland
- Department of Engineering, University of Florida, United States
- Department of Cellular and Molecular Medicine, University of Ottawa, Canada
Figures
Figure 1 with 7 supplements

Tracking and decoding self-initiated behaviors from widefield neural activity in mice .
Detecting and decoding upcoming self-initiated mouse behaviors via widefield calcium activity. (a) Human voluntary behavior studies using scalp electroencephalography (EEG) target motor cortex and related areas. (b) Human voluntary wrist flexion studies recording EEG from motor areas (as in (a)) reveal a change in neural activity 0.5–1.5 s prior to behavior initiation (t = 0 s) or even awareness (t = W) in some studies (note: the y-axis of the plot is inverted so the readiness potential [RP] is negative). (c) Mice learn to voluntarily self-initiate a lever pull to receive water reward while widefield [Ca++] activity is captured at 30 Hz. (d) Allen Brain Atlas and locaNMF decomposition of neural activity into neuroanatomical areas (see also Methods). (e) The average motor cortex widefield calcium (neural) activity (solid blue line) becomes increasingly stereotyped prior to a self-initiated lever pull (t = 0 s; data shown are from 21 s locked out trials; dashed line represents Hilbert transform of oscillatory signal). (f) Human studies seeking to decode voluntary choice relying on functional magnetic resonance imaging (fMRI) during voluntary behaviors. (g) Decoding accuracy for left- vs. right-hand voluntary button presses (solid purple line) is a few percent above chance several seconds prior to movement initiation and peaks at approximately 10% above chance at movement time. (h) Two examples of decoding accuracy for rewarded lever pull vs. random states in mice (solid blue lines; shading is the standard deviation of 10-fold cross-validation accuracy) showing increases seconds prior to movement and peaking >30% above chance at movement time (data shown for two examples of long earliest decoding times (EDTs) obtained from mice M2 and M3 using 15 s locked out low-pass filtered trials; see Main text). (b) has been adapted from Box 1 in Haggard, 2008. (g) Has been adapted from Figure 2 in Soon et al., 2008.
Figure 1—figure supplement 1
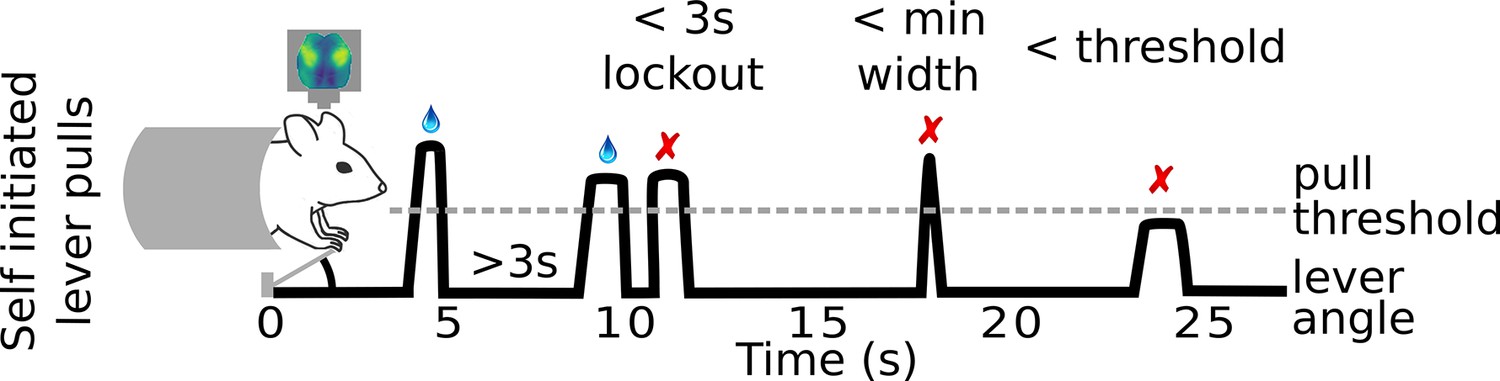
Mouse self-initiated lever-pull paradigm.
Mice are trained to pull a lever to receive a water reward. In order to receive a water reward the lever pulls must occur at least 3 s after a previous lever pull, pass a minimum lever angle threshold, and the lever must be held past the threshold for a minimum amount of time (e.g., 0.1 s).
Figure 1—figure supplement 2
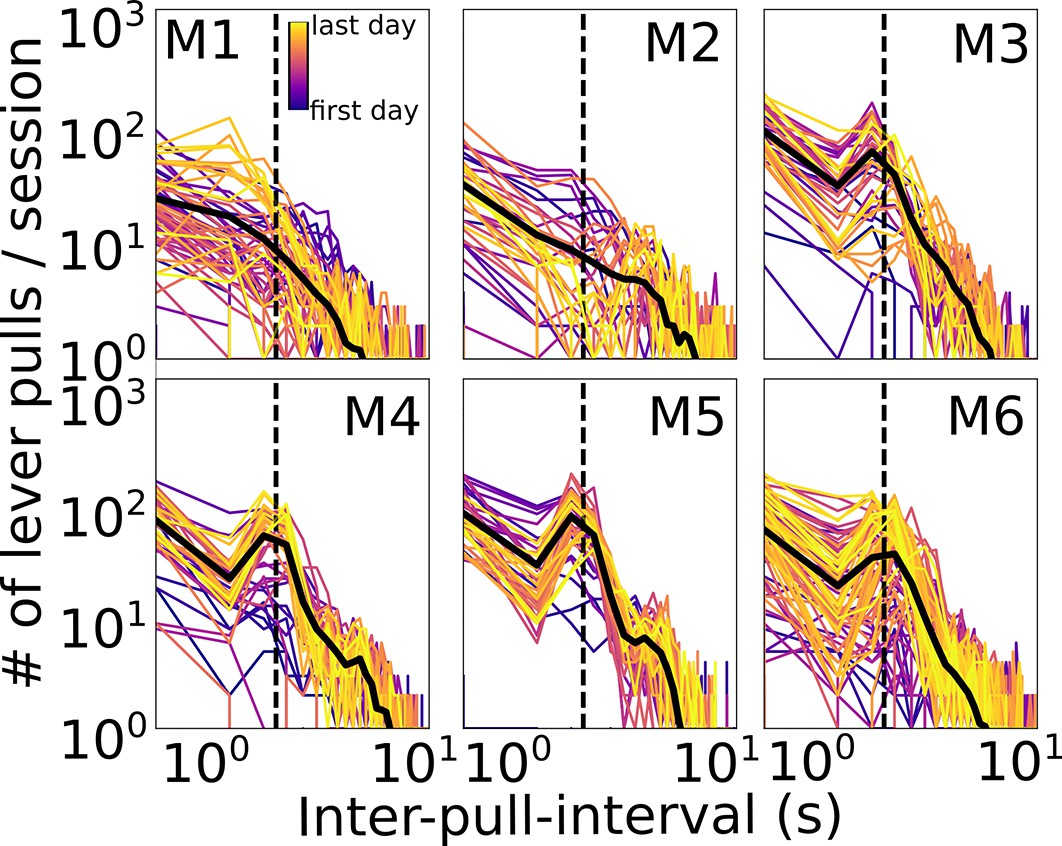
Mouse longitudinal inter-lever-pull interval distributions.
Inter-lever-pull distributions for each session (colored lines) and all session averages (black lines) for all mice. Dashed line indicates t = 3 s which was the minimum ‘lockout’ time (i.e., no previous lever pull) in order to receive a water reward. (Lever-pull times were defined as the initial movement of the lever from rest; see Methods.)
Figure 1—figure supplement 3
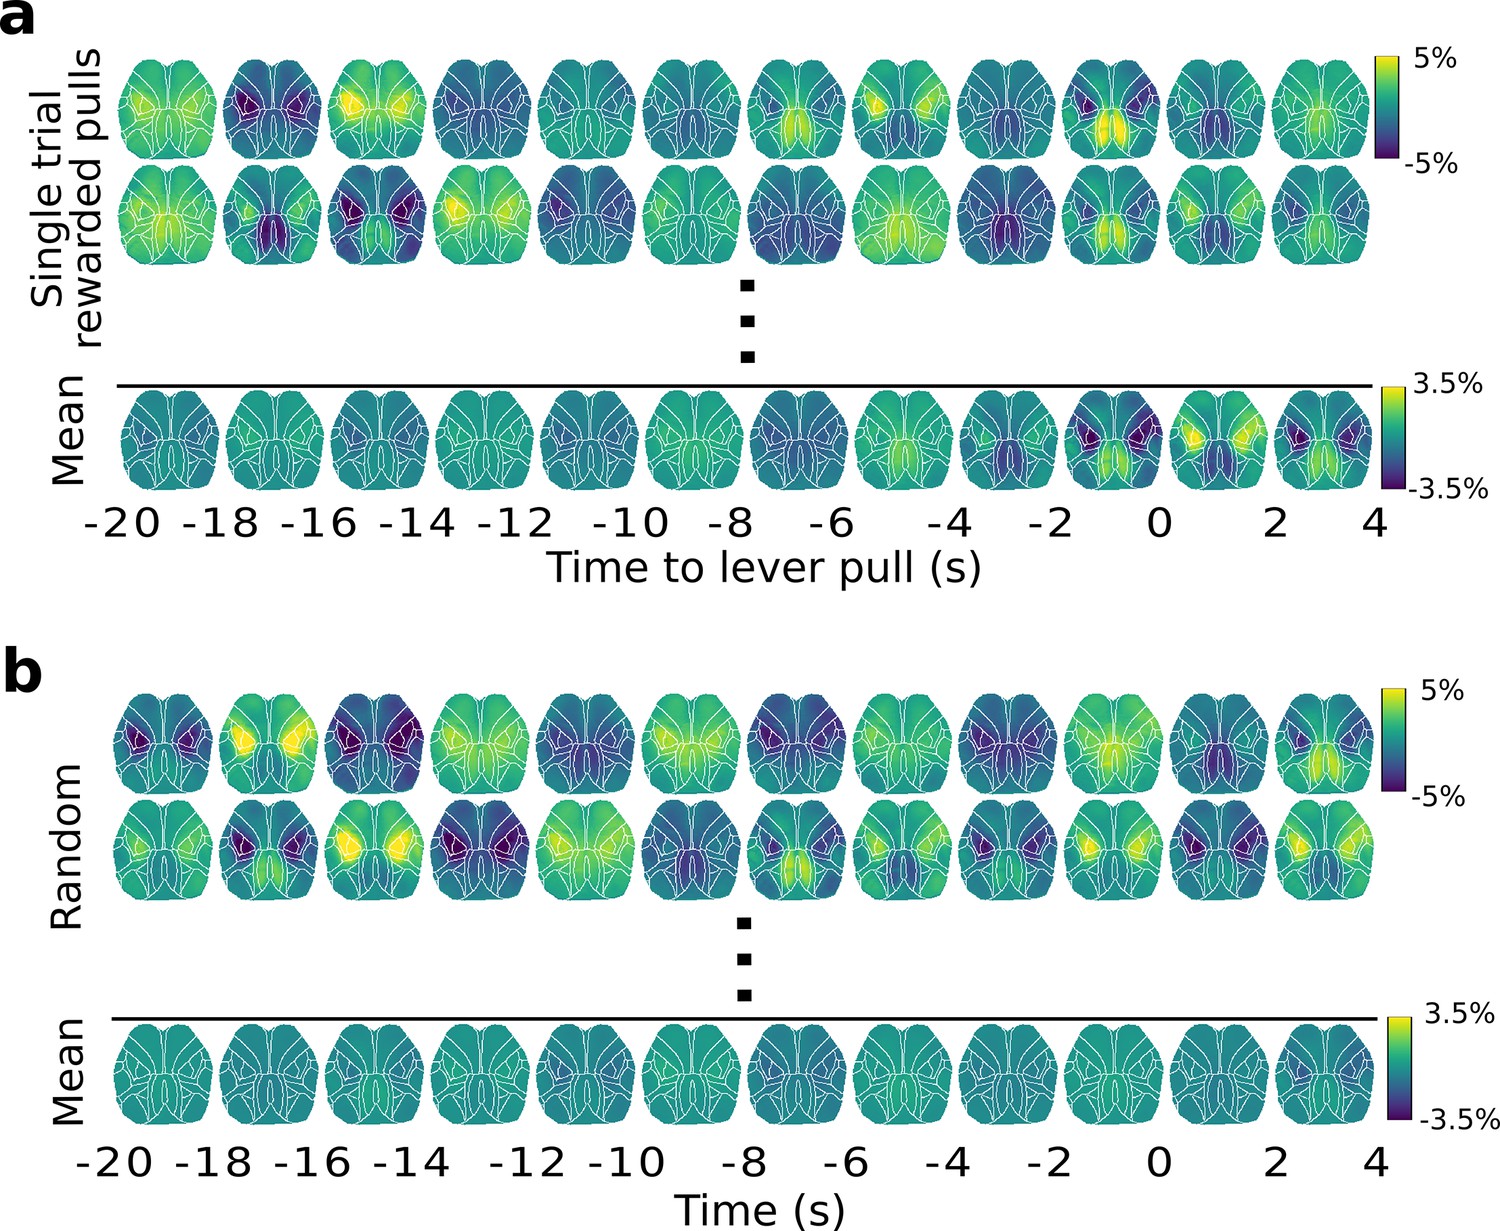
Widefield [Ca++] dynamics during random vs. rewarded lever pulls.
(a) Top: widefield [Ca++] activity from single lever-pull trials; Bottom: widefield [Ca++] activity obtained for a session average (30 trials). (b) Top: same as (a)-Top but for a random segment of neural activity (i.e., not locked to lever pull at t = 0 s); Bottom: same as (a)-Bottom but for random neural segments.
Figure 1—figure supplement 4
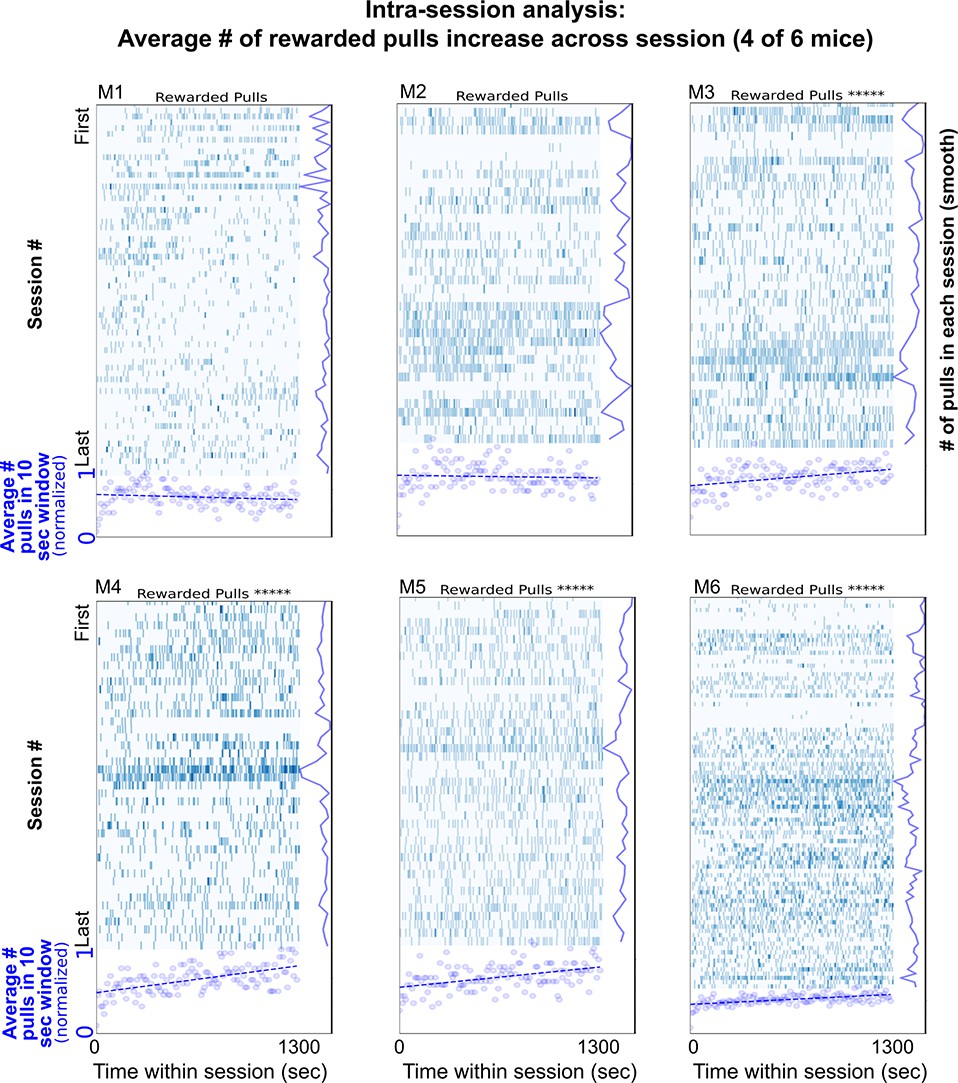
The number of lever pulls changes across sessions.
Single lever pulls (blue vertical rasters) and sliding window (10 s) averages (blue round scatter plot) show that on average four of six mice (M3, M4, M5, and M6) increase their lever pulls across the duration of the session (i.e., have a positive slope in correlation; Pearson correlation were: M1: −0.14347, pval: 0.10479; M2: −0.05616, pval: 0.52723; M3: 0.38835, pval: 5.4e−06; M4: 0.55091, pval: 1.3e−11; M5: 0.44370, pval: 1.4e−07; M6: 0.53118, pval: 9.4e−11; ***** represents pvals <1.0E-5).
Figure 1—figure supplement 5
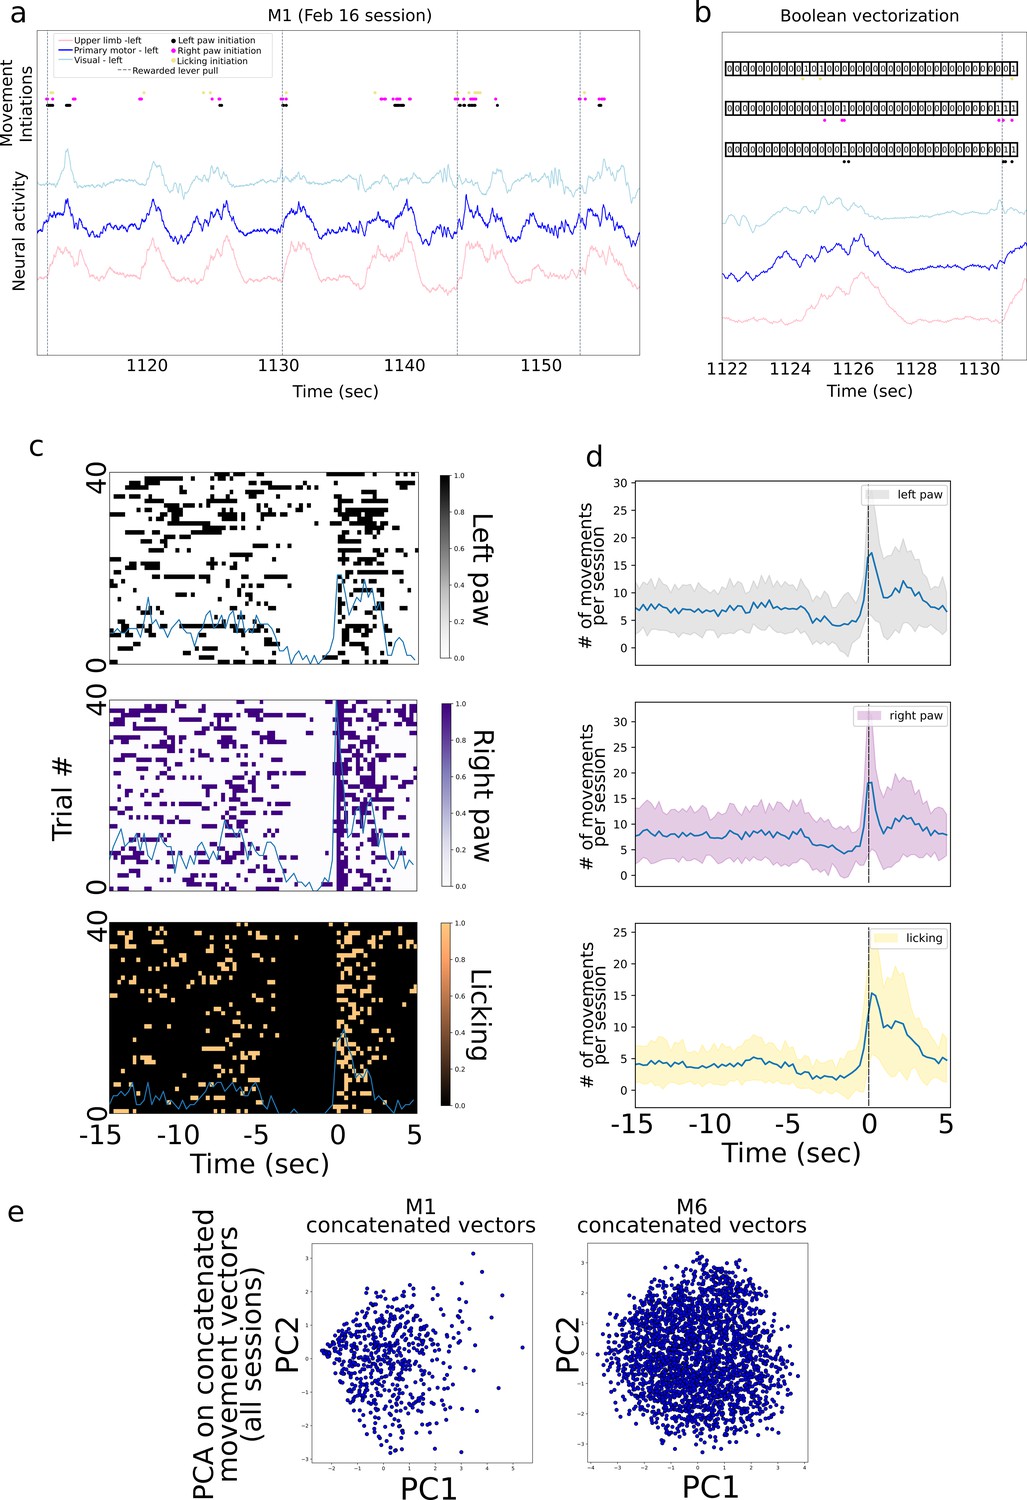
Body movement sequence analysis.
(a) An approximately 40-s period of neural activity from motor, limb, and visual cortex overlaid with body movement initiations and rewarded lever pulls. (b) A method for detecting sequences of behavior by creating and clustering Boolean vectors of activity in 0.25-s bins over the 10 s prior to a lever pull. For each body movement initiation (e.g., left paw movement), we created an array containing 0 s when the behavior was not present and 1 s when the behavior was present (note: the visualization is qualitative and bin width may differ from those implemented). (c) Boolean arrays from the three body movements from approximately 40 trials in the session from (a) (from −15 to +5 s) do not reveal patterns of movement (sum of movements shown as ‘blue’ curve). (d) The average sum of movements over all sessions in mouse M1 reveals a decrease in body movements in the few seconds prior to lever pull (i.e., time = 0 s). (e) Principal component analysis (PCA) on concatenated Boolean vectors from all sessions in mouse M1 (note: data for PCA consisted in Boolean vectors from −10 to 0 s prior to lever pull; different windows yielded similar results; see Methods) do not reveal obvious clusters in this PCA space (note: clusters may have implied that different body parts have different initiation times, potentially giving rise to sequences).
Figure 1—figure supplement 6
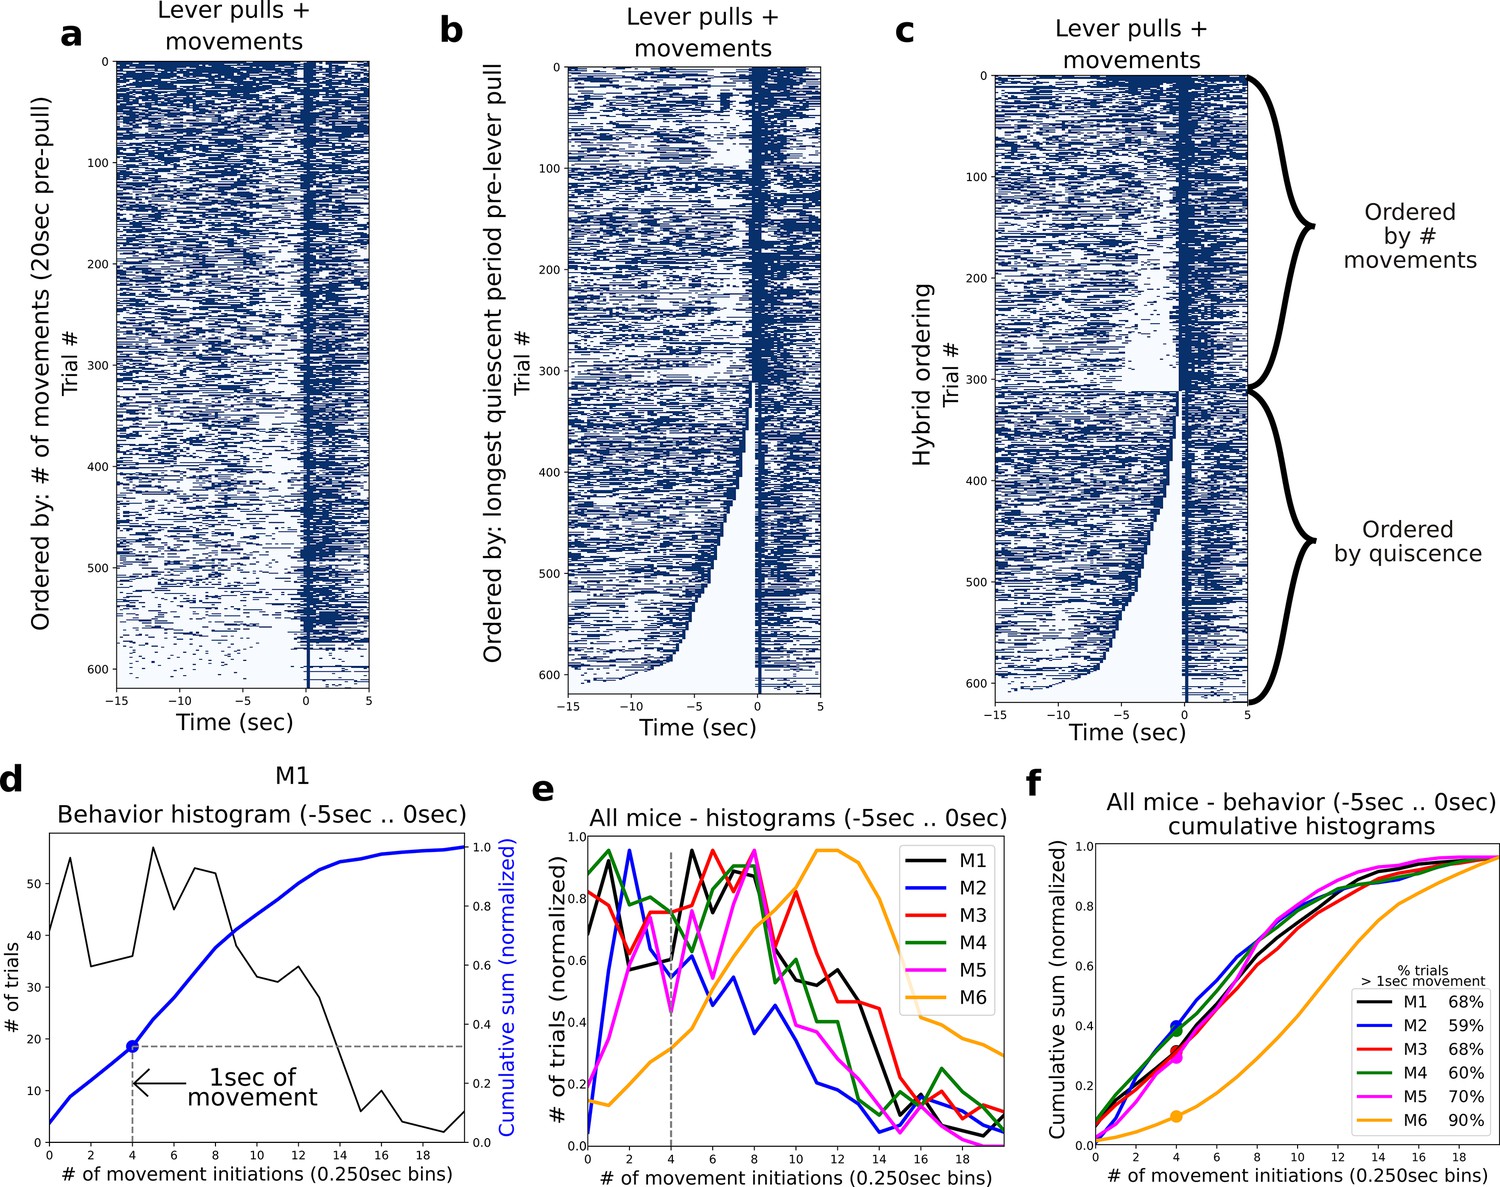
Characterizing quiescent periods prior to rewarded lever pulls.
(a) Scatter plot of lever-pull locations for all (video recorded) trials in mouse M1 ordered by the most active to least active trials in the period of −5 to 0 s. (b) Same as (a) but trials ordered the duration of quiescence prior to the lever pull. (c) Sames as (a) but ordered first by quiescence and the remainder of trials by # of movements. (d) Widefield [Ca] activity for each trial ordered as in (a). (d) Histogram of data in (a) for behaviors occurring in the period of −5 to 0 s (black) along with the cumulative sum (blue) and the location of the 4 bin (i.e., 1 s) movement threshold (blue dot). (e) Same as histogram (black curve) in (e) for all mice. (f) Same as cumulative sum (blue curve) in (e) for all mice.
Figure 1—figure supplement 7
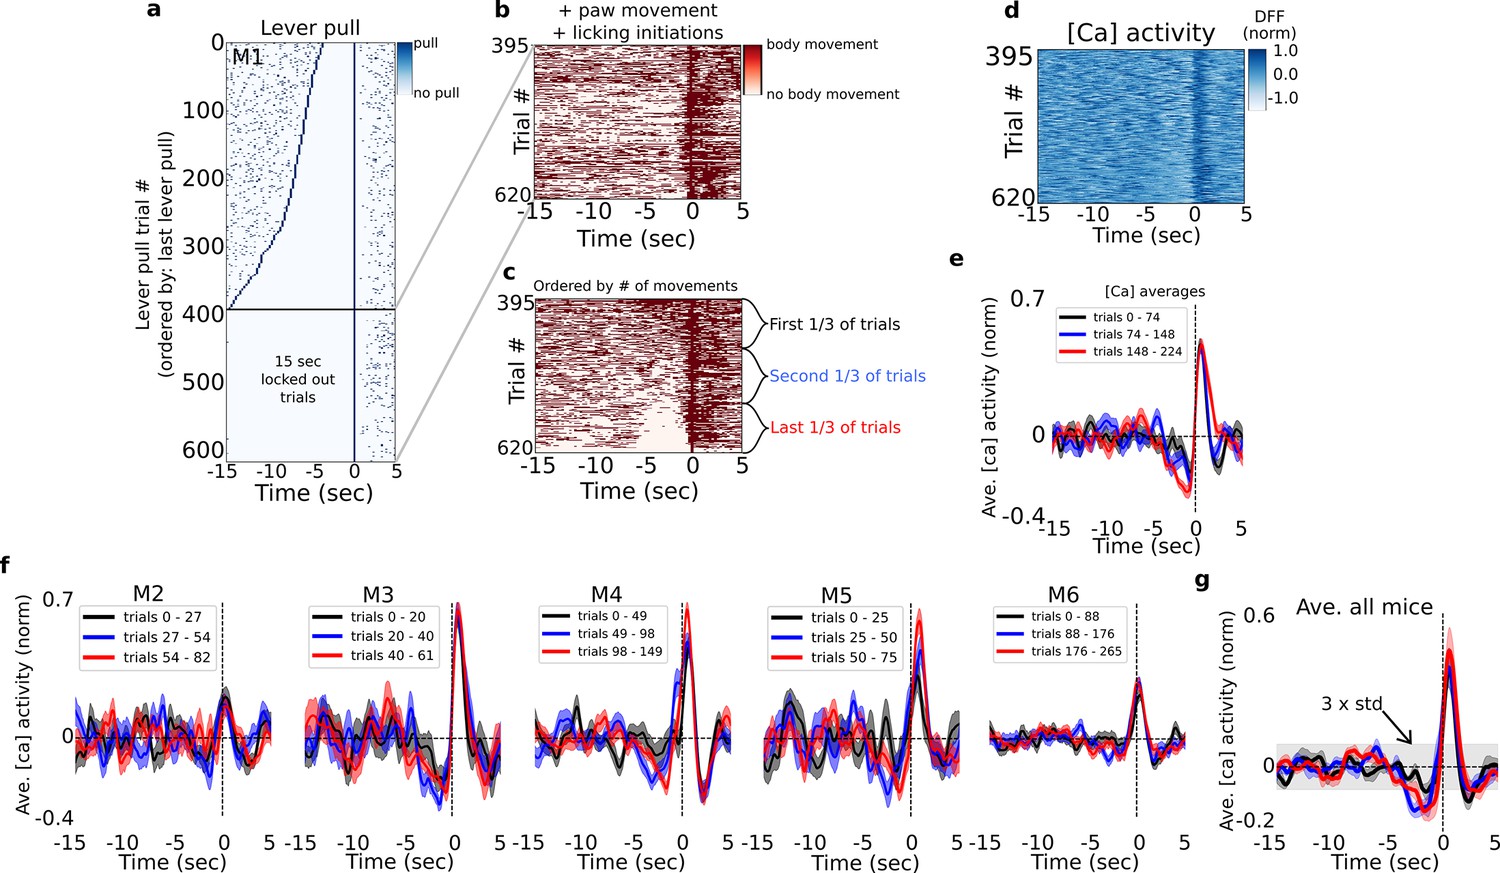
Characterizing pre-lever-pull neural activity as a function of body movement.
(a) Raster plot of lever-pull times for all (video recorded) trials in mouse M1 ordered by the longest pre-pull quiescent (i.e., no-lever pull) period; the bottom 225 rewarded trials were ‘15-s lockout’ trials as they did not have any preceding lever pulls. (b) Left and right paw movements and licking times for the 15-s lever-pull lockout trials shown in (a). (c) Same as (b) but ordered by the most active to least active trials in the period of −5 to 0 s prior to lever pulls. (Note: arranging by longest quiescent periods yielded similar results.) (d) Widefield [Ca] activity from motor cortex for each trial ordered as in (c). (e) Average neural dynamics for the first, second, and last third groups of ordered trials (as in c) for mouse M1 (shading is standard error). (f) Same as (e) but for mice M2–M6. (g) The average of means over all mice (color shading is standard error of the mean; grey shading is the 3× standard deviation of the signal from −15 to −5 s; see Methods).
Figure 2 with 4 supplements

A cortex-wide distributed multi-second neural code underlies self-initiated actions .
Decoding self-initiated lever pulls using cortical neural activity. (a) Decoding self-initiated water-rewarded lever pulls using a minimum 3-s lockout window and a minimum lever angle threshold (see also Methods). (b) Support vector machine (SVM) decoding accuracy curves of two different sessions (mouse M4) reveal increased decoding accuracy near lever-pull time and an earliest decoding time (EDT) of several seconds (curves represent average accuracy and shaded colored regions represent standard deviation over 10-fold cross-validation; top colored bars represent p values of Student t-test with a Benjamini–Hockberg correction for multiple hypotheses; see Methods for more details; note sessions shown were atypical and were selected to illustrate decoding curves for early EDTs when decoding from all trials, that is without locking out previous lever pulls). (c) EDTs from all sessions (mouse M6) show a strong correlation between EDT and the number of trials within a session (lighter colors indicate earlier sessions in the experiment). (d) Same as (b) but for an example from concatenated, that is multi-session, analysis. (e) EDTs for concatenated sessions (M6) also show a correlation between EDT and the number of trials present in the session and the EDT (lighter shading representing earlier sessions in training). (f) EDT distributions across all mice for single session trials (blue) vs. multi-session trials (red) reveals a significant lengthening (i.e., further from lever-pull time) in EDTs for multi-sessions across all animals (cyan box plots show 25th percentile, median, and 75th percentile; comparisons between single vs. concatenated sessions were carried out using two-sample KS test with asterisks indicating: *<0.05; **<0.01; ***<0.001; ****<0.0001; *****<0.00001). (g) Same as (f) but for 15-s lockout trials concatenated across multiple sessions. (h) Recomputed EDTs for filtered calcium traces. (i) Examples of decoding accuracy curves for 15-s lockout trials using filtered vs. non-filtered neural time series (see also Methods).
Figure 2—figure supplement 1
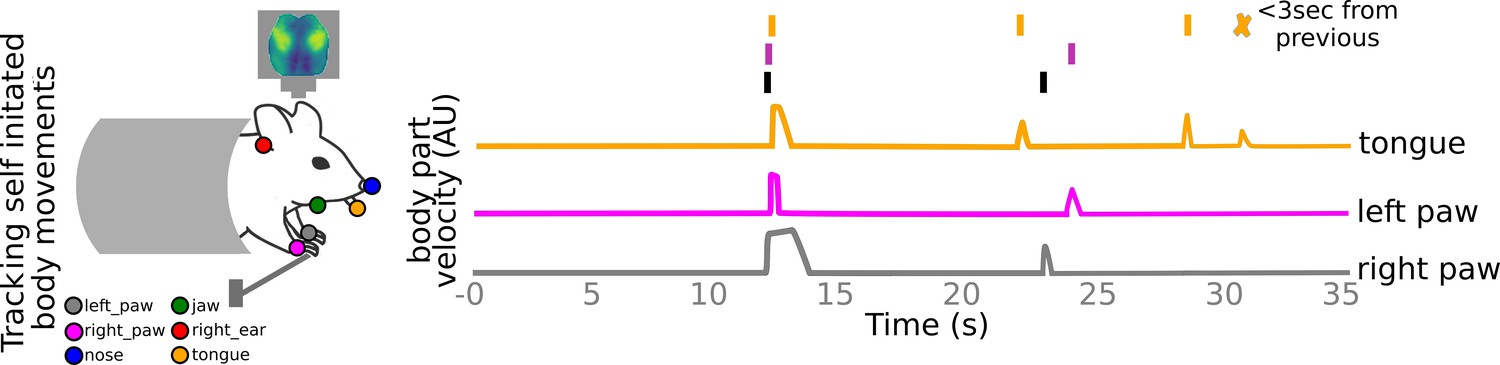
Tracking self-initiated body movements.
Markerless pose estimation methods are used to track the locations of left paw, right paw, nose, right year, jaw, and tongue. Self-initiated body movements are defined as increases in body part velocities above noise threshold and not preceded by a body movement <3 s prior (see also Methods).
Figure 2—figure supplement 2
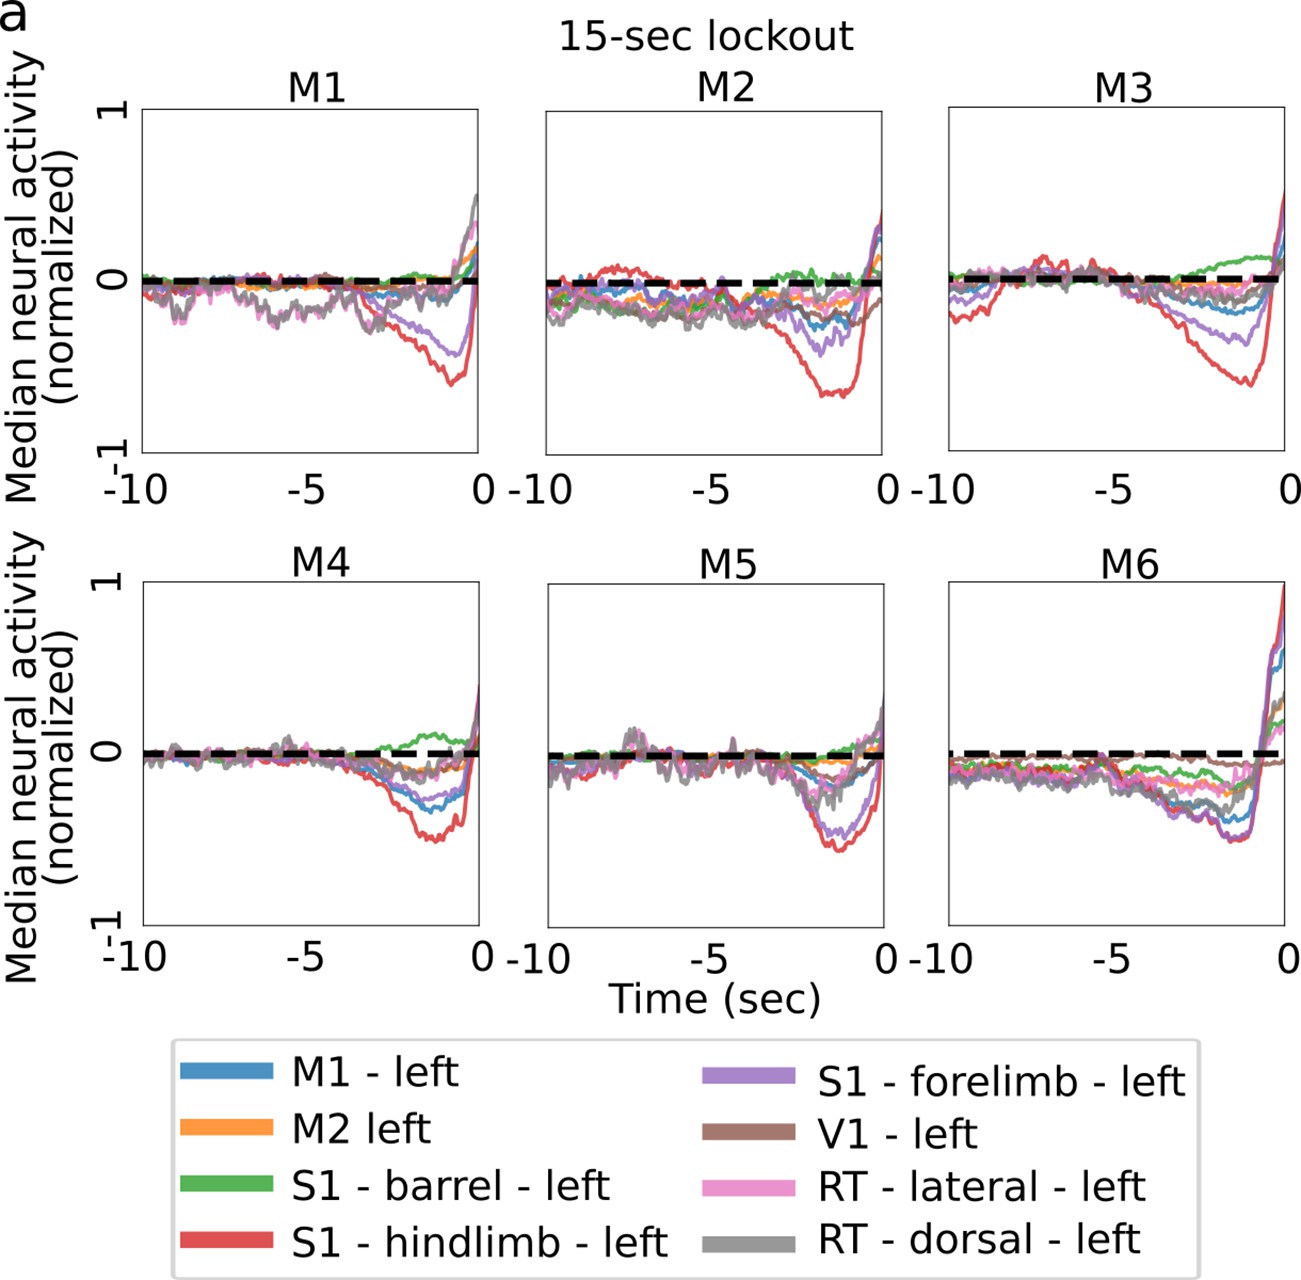
Median neural activity prior to lever pull.
(a) Median neural activity in eight left hemisphere regions of interest (ROIs) for all trials (and all sessions) in each mouse using trials not proceeded by other lever pulls for a period of at least 15 s (note: lever was pulled with the right paw).
Figure 2—figure supplement 3
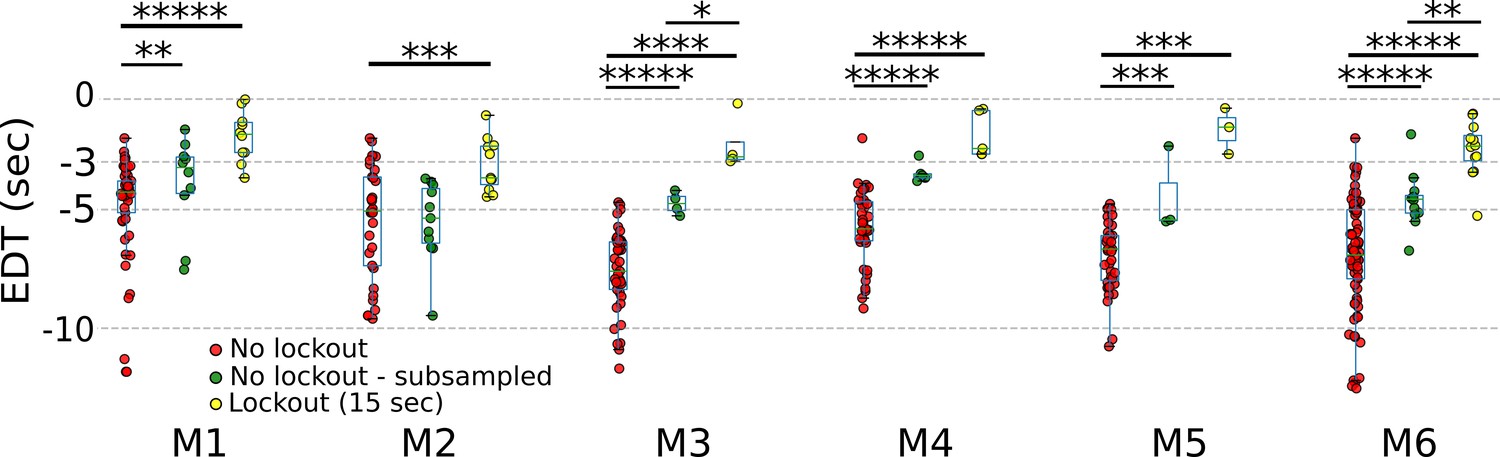
Subsampling non-lockout trials longitudinally leads to an increase in earliest decoding times (EDTs).
EDTs computed from lockout trials (15 s; yellow) to non-lockout trials (red) to non-lockout trials that uniformly subsampled to match the # of trials in the lockout condition (green). (p values to 5 decimal places: M1: no lockout vs. no lockout subsampled: 0.00171; no lockout vs. no lockout subsampled: 0; no lockout subsampled vs. lockout: 0.99446; M2: no lockout vs. no lockout subsampled: 0.53748; no lockout vs. no lockout subsampled: 0.00065; no lockout subsampled vs. lockout: 0.21148; M3: no lockout vs. no lockout subsampled: 0.00001; no lockout vs. no lockout subsampled: 0.00001; no lockout subsampled vs. lockout: 0.02857; M4: no lockout vs. no lockout subsampled: 0.00001; no lockout vs. no lockout subsampled: 0.00001; no lockout subsampled vs. lockout: 0.87302; M5: no lockout vs. no lockout subsampled: 0.00017; no lockout vs. no lockout subsampled: 0.00017; no lockout subsampled vs. lockout: 0.6; M6: no lockout vs. no lockout subsampled: 0; no lockout vs. no lockout subsampled: 0; no lockout subsampled vs. lockout: 0.00786; * pval <0.05; ** pval < 0.01; *** pval < 0.001; **** pval < 0.0001; ***** pval < 0.00001).
Figure 2—figure supplement 4
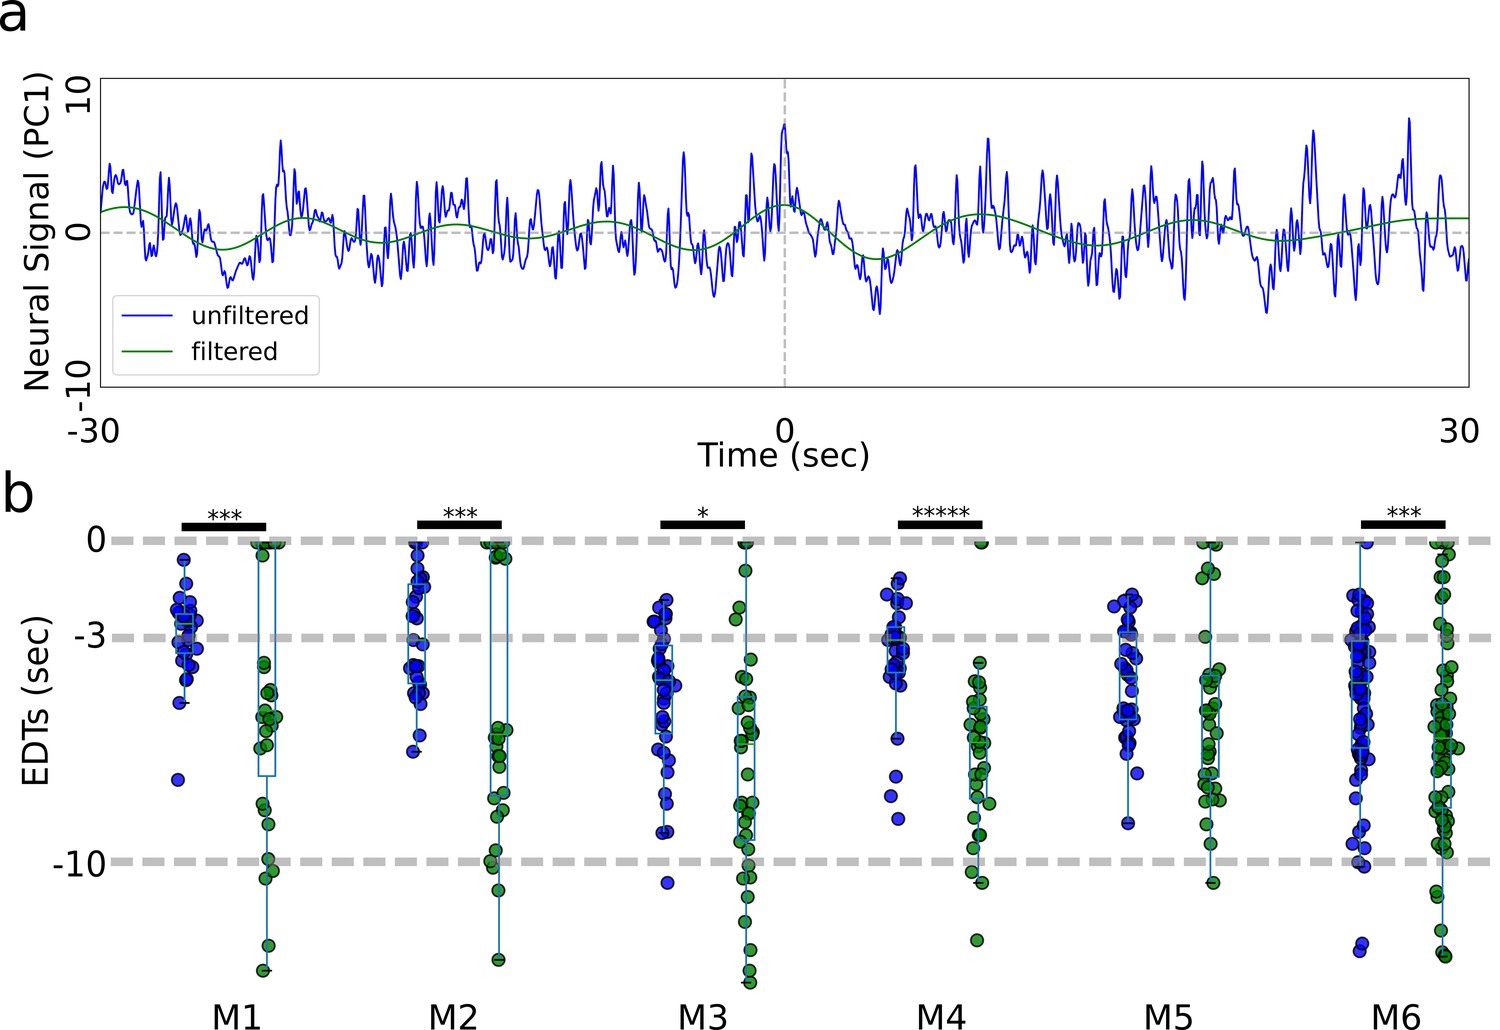
Earliest decoding times (EDTs) from low-pass filtered data do not show increased values.
(a) Panel (a) shows a 60-s segment of signal centered on lever pull before and after filtering (note: we use principal components rather than locaNMF ROIs as they are more representative of the raw data). (b) EDTs computed using the original unfiltered data (blue) vs. filtered data (green) show that all EDTs decrease significantly when removing faster oscillations from the data (pval * same as in Figure 2—figure supplement 3).
Figure 3 with 2 supplements
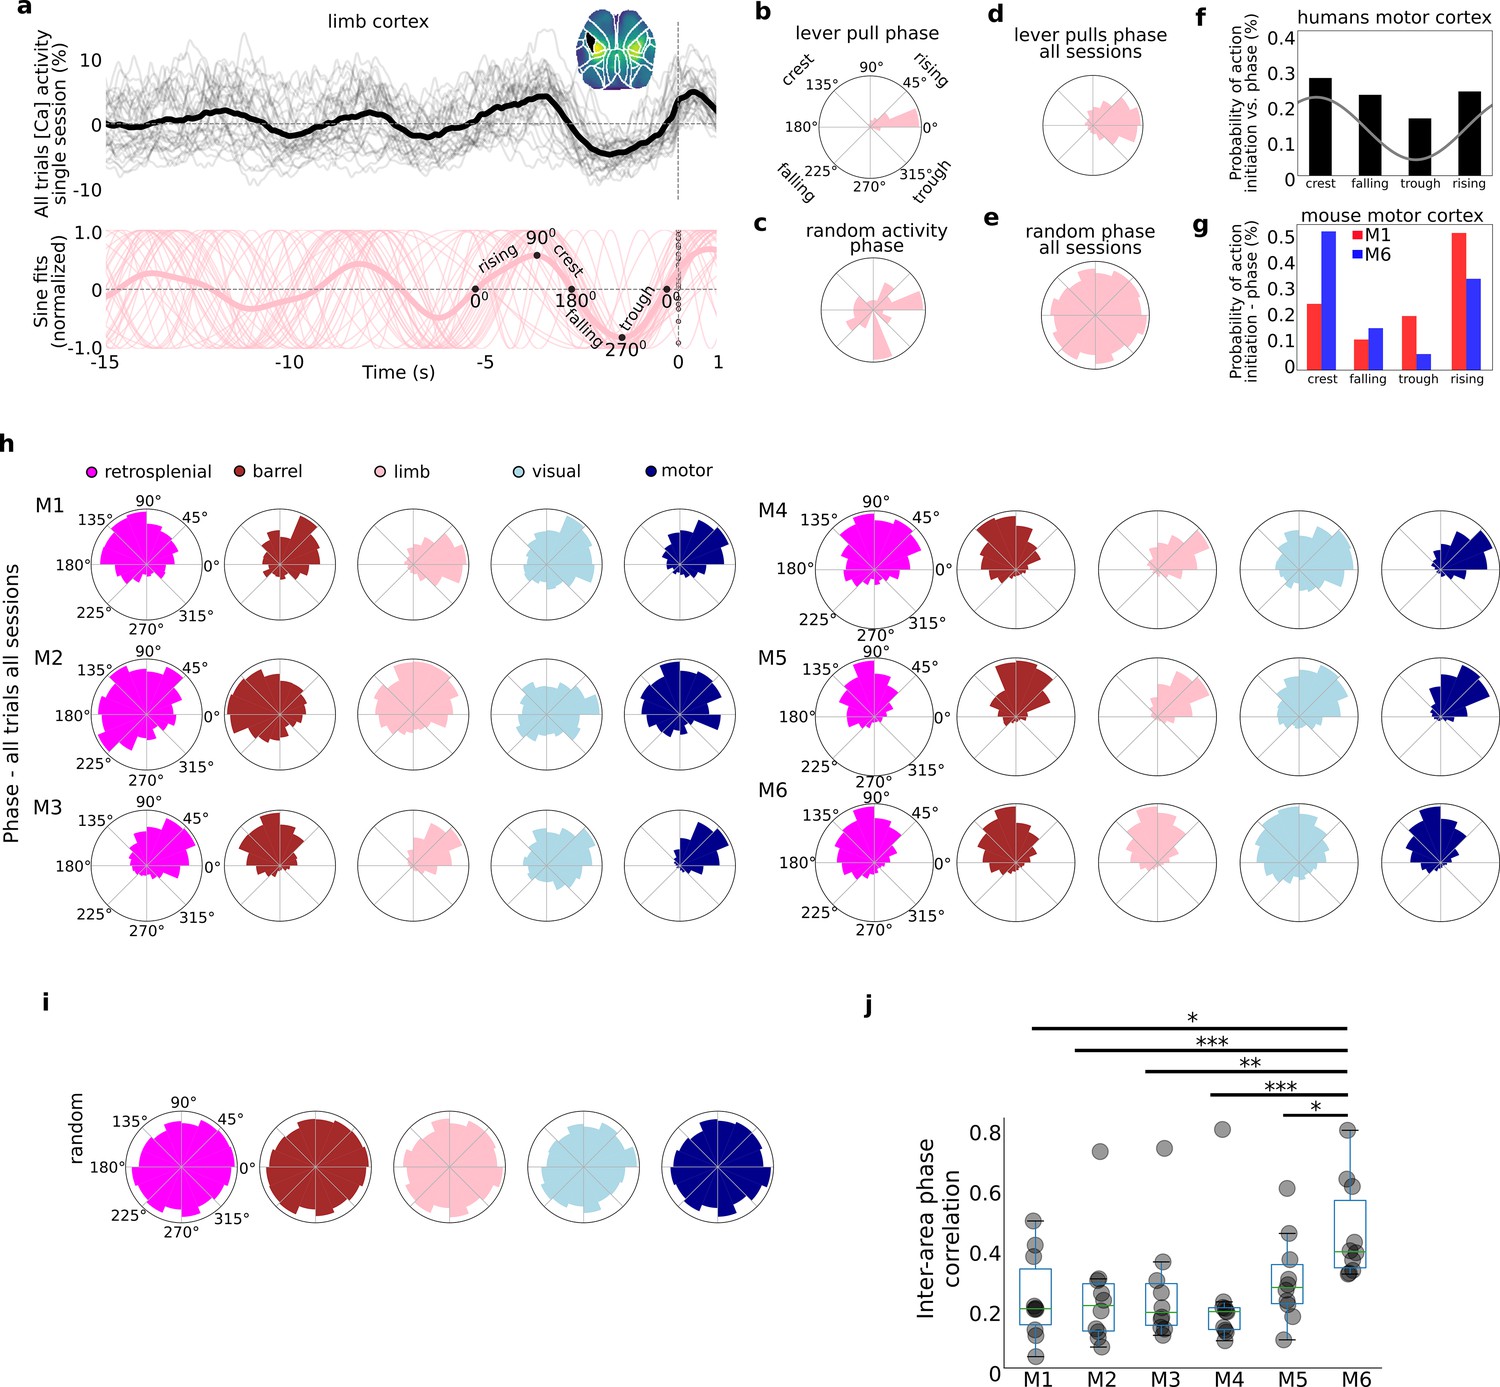
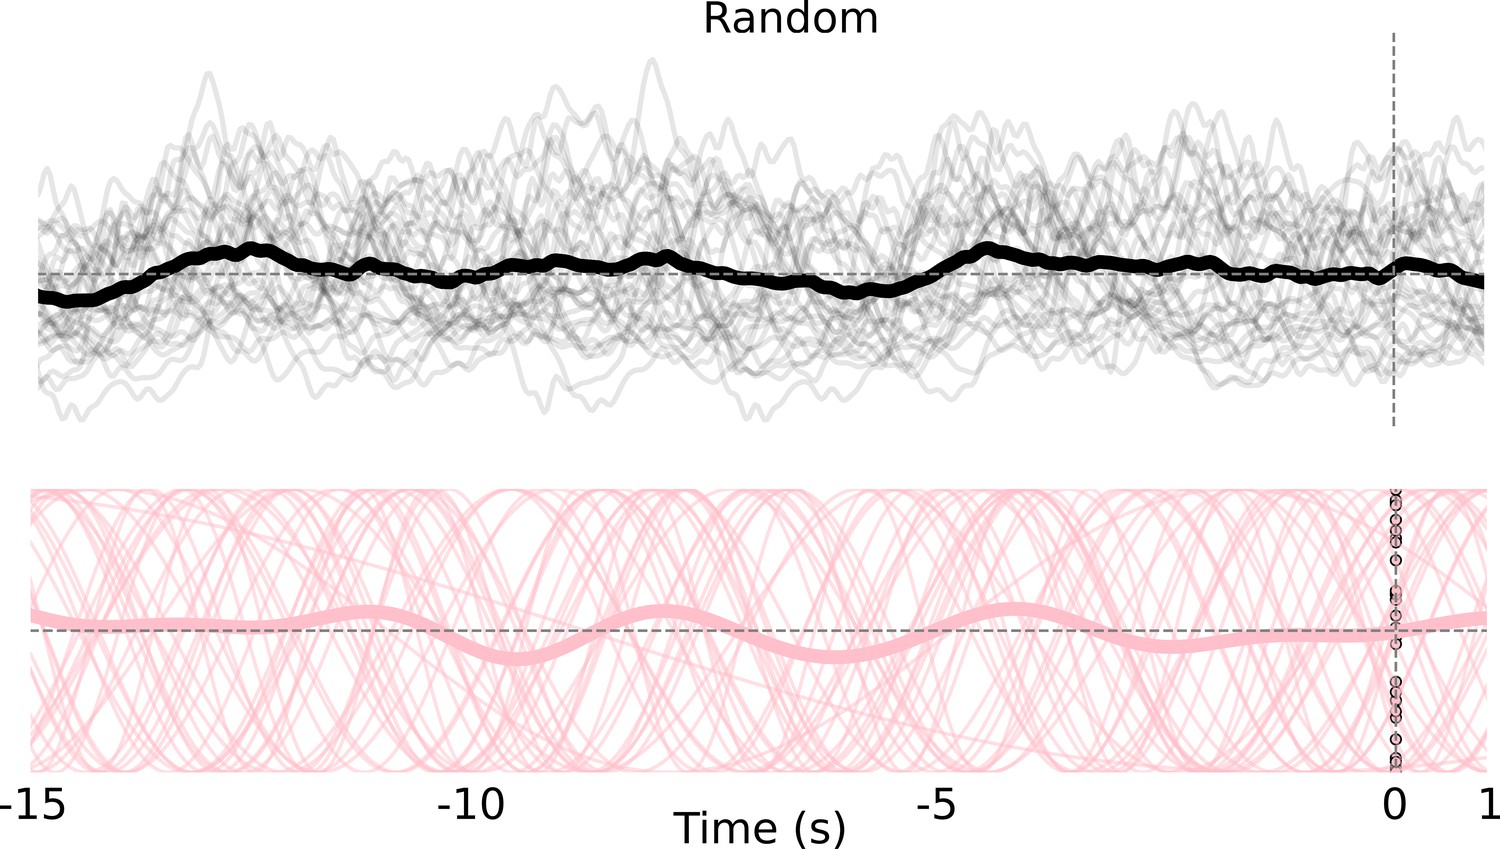
Self-initiated lever pulls occur during narrowly distributed slow-oscillation phases.
Self-initiated behaviors occur during specific phases of slow-oscillations. (a) Top: single-trial neural activity (gray curves) from 33 trials in a single session (M4) for somatosensory-upper left limb cortex contain oscillations that become increasingly stereotyped closer to lever-pull time (t = 0 s; thick black curve is session average; inset shows anatomical area selected); Bottom: single-trial sinusoidal fits (thin pink curves) to neural activity (in Top) and phases (scatter dots on the t = 0 s line; thick pink curve is session average). (b) Polar plot of results in (a) showing the distribution of sinusoidal fit phases at t = 0 s. (c) Same as (b) but for random periods of neural activity (i.e., not locked to any behavior). (d) Same as (b) but for all sessions in mouse M4. (e) Same as (d) but for random periods of neural activity across all sessions in mouse M4. (f) Probability of voluntary action in humans during various phases of the slow cortical potential (SCP). (g) Same as (f) but widefield [Ca++] from the motor cortex in mice M1 and M6. (h) Phase distributions across all mice, sessions, and areas. (i) SCP phase distributions for random segments of neural activity for all areas in mouse M4. (j) Single-trial pairwise correlation between all cortical areas (e.g., limb vs. motor, limb vs. retrosplenial, etc.). (f) Has been adapted from Figure 2 from Schmidt et al., 2016. (pval * same as in Figure 2—figure supplement 3).
© 2016, Elsevier. Figre 3f is reproduced from Figure 2 from Schmidt et al., 2016, with permission from Elsevier (copyright year 2016, copyright holder Elsevier). It is not covered by the CC-BY 4.0 licence and further reproduction of this panel would need permission from the copyright holder
Figure 3—figure supplement 1
Random controls for slow oscillation sinusoidal fits.
Top: single-trial neural activity from left somatosensory (limb) cortex (thin black lines) from a session and session average (thick black line). Bottom: sinusoidal fits to data in Top (thin pink lines) and session average (thick pink line).
Figure 3—figure supplement 2
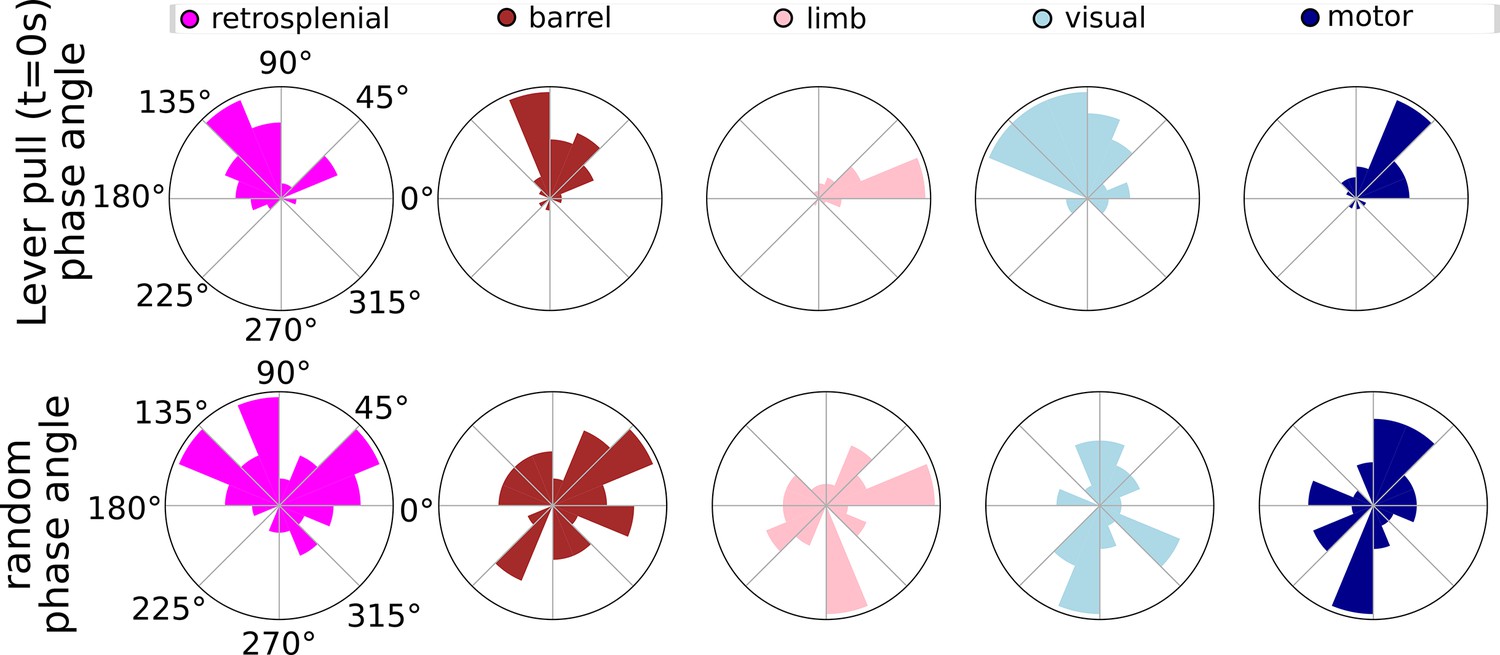
Phases for lever pulls vs. random segments across major cortical areas.
Top: single-trial phase distributions for retrsponelina, barrel, limb, visual, and motor cortex during rewarded lever-pull trials in a single session. Bottom: same as Top but for random time points.
Figure 4
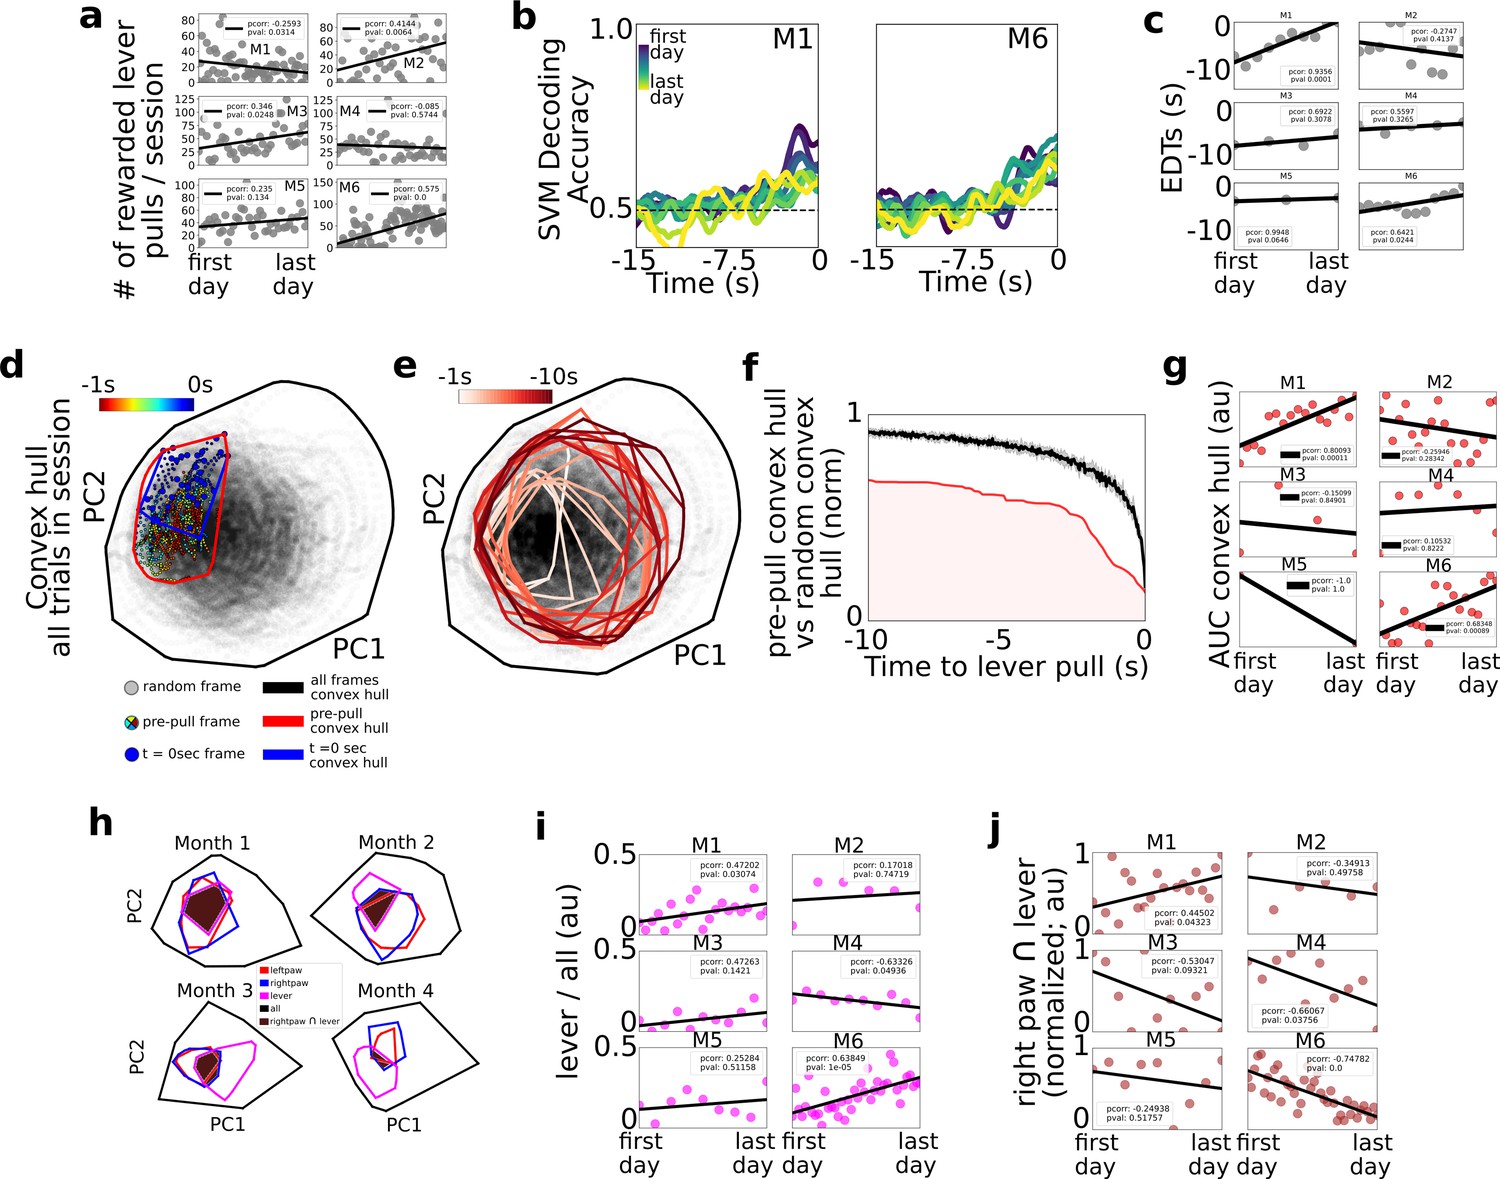
Changes in decoding and neural dynamics over weeks of task performance.
Tracking changes in decoding performance and spontaneous neural dynamics over time. (a) The number of rewarded lever pulls per session in all mice over the duration of the experiment. (b) Support vector machine (SVM) decoding accuracy curves from M1 and M2. (c) Earliest decoding times (EDTs) (black dots) for all mice (using 15-s lockout trials only black lines: linear fits; inset: Pearson correlation coefficient; note: the EDTs were computed on non-lockout data). (d) Convex hull of neural activity preceding lever pulls from 30 trials from a single session in mouse M3. The colored scatter points represent neural activity at various frames in the −1 to 0 s period and the polygons represent the convex hull of neural activity for all data (black), t = 0 s (blue) and t = −1 s to t = 0 s (red; see also legend for details). (e) Same as (d) but for 1 s segments ranging from −10 s to t = 0 s. (f) Convex hull volume (red line; shading represents area under the ratio curve [AUC]) of pre-pulls vs. random segments (black line; shading represents 10-fold sampling standard deviation; see also Methods). (g) AUC (scatter points) of ratio curves (as in (f)) for all animals and sessions. (h) Convex hull of 1 s of neural activity preceding body movements (red and blue polygons), lever pull (magenta polygons), and all neural data (black polygons) at different longitudinal time points in the experiment for mouse M6. Brown shaded regions represent the overlap between the right paw movement initiations and lever pull. (i) Ratio of convex hull of lever pull to all neural activity (magenta scatter points), linear fit (black line), and Pearson correlation value (inset). (j) Intersection of right paw and lever-pull initiation space (brown scatter points), linear fit (black lines), and Pearson correlation (inset).
Figure 5

Single-trial variance changes seconds prior to self-initiated lever pulls.
Internal-state evaluations begin several seconds prior to self-initiated lever pulls. (a) Average session neural activity from cortical areas (colored curves) and average over all sessions (red curve) from mouse M3. (b) Variance of data in (a) and the earliest variance decrease time (EVDT; black dots represent EVDT of all session averages, i.e., red curves in (a)). (c) EVDTs for all animals and sessions.
Figure 6
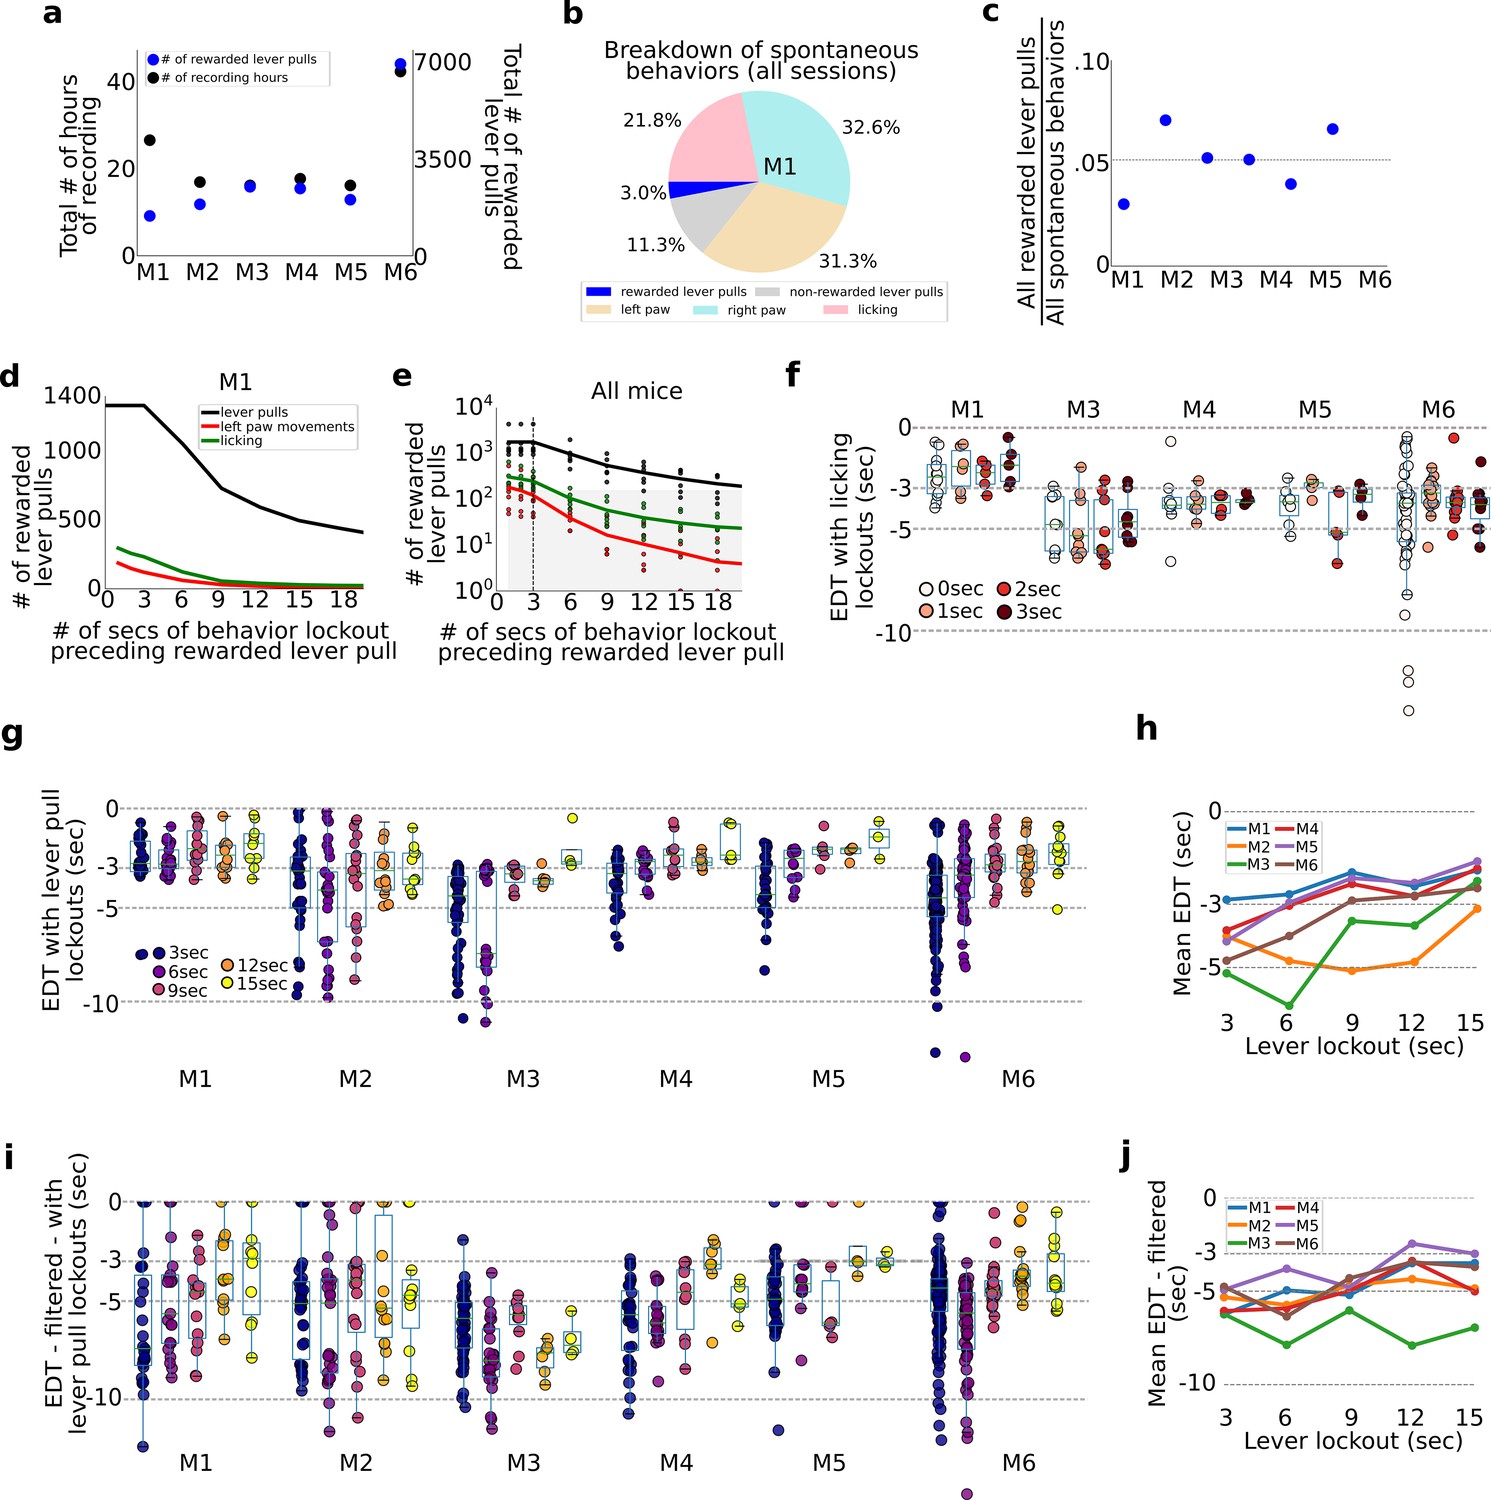
Evaluation of pre-ever pull movements and behavior lockout on earliest decoding times (EDTs).
Tracking and evaluating the effects of previous self-initiated movements on the decoding of rewarded lever pulls. (a) Total number of recording hours and number of lever pulls for each mouse (note: each recording session was approx. 22 min long). (b) Percentage of rewarded lever pulls, non-rewarded lever pulls, and left paw, right paw, and licking movements performed by mouse M1 across all sessions. (c) Proportion of rewarded lever pulls relative to all other body movements for all animals. (d) The number of rewarded lever pulls as a function of ‘locking out’ previous lever pulls, licking events or left paw movements (note: locking out means excluding any rewarded lever-pull trial that was preceded by a movement in the previous n-seconds; see also Main text and Methods). (e) Same as (d) but for all animals and sessions (shaded region indicates lockout conditions under which less than 100 trials were present across the entire study and decoding was not carried out). (f) EDTs for rewarded lever pulls conditioned on licking event locking out periods of 0–3 s (for clarity, the 0-s time point excluded any rewarded lever pull that occurred precisely at the same time as a licking event, i.e. to the resolution of our 15FPS video). (g) Same as (f) but conditioned on excluding previous lever pulls (3-s time point excluded any rewarded lever pulls that occurred exactly 3 s after a previous rewarded or unrewarded lever pull). (h) Mean EDTs from (g) as a function of lever-pull lockout period. (i) Same as (g) but following low-pass filtering of the locaNMF components. (j) Same as (h) but for data in panel (g).
Figure 7
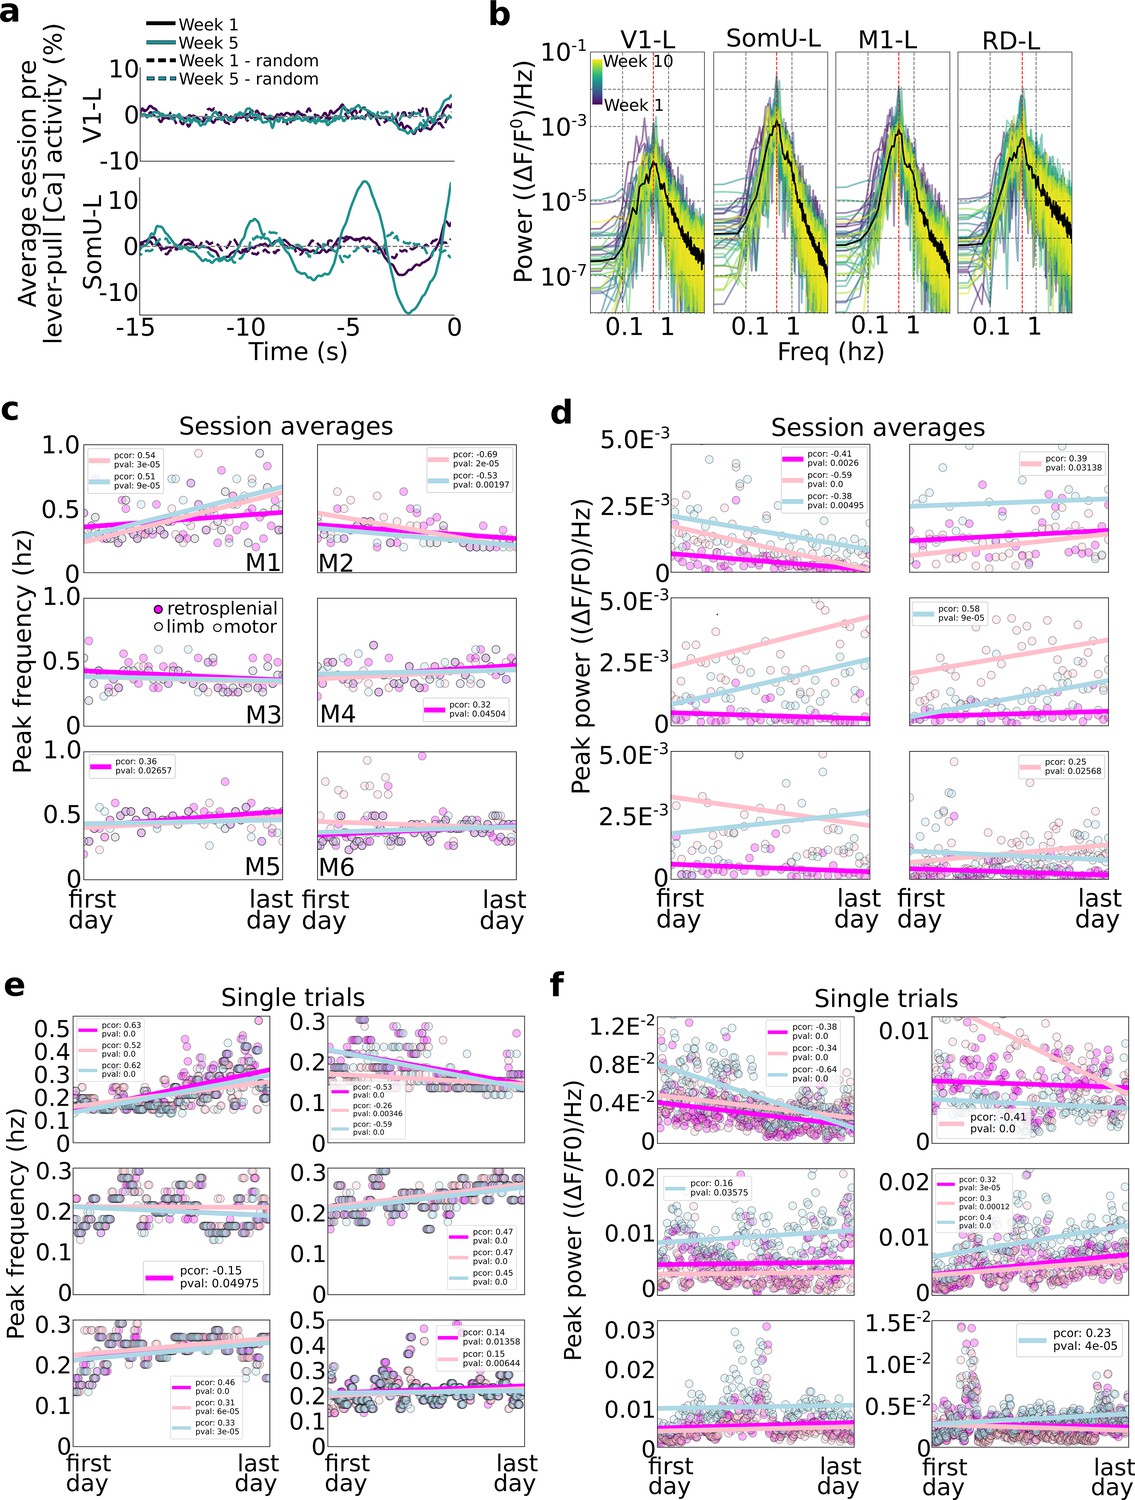
Slow oscillations dominate pre-self-initiated behavior neural dynamics.
Slow wave oscillations underlie self-initiated behavior in mice. (a) Examples of single session averages (dark continuous curves) from two time points and random segments (dark dashed curves) from V1-left and somatosensory-upper limb left reveal the presence of oscillations. (b) Power spectra of all session averages (colored curves) and average across all sessions (black curves) from mouse M4 in four cortical areas (dashed vertical lines indicate peak of average). (c) Peak frequency power of each session trial average for retrosplenial, motor, and limb cortex (colored scatter points). (d) Same as plot in (c) but for peak power for all animals and sessions. (e) Same peak frequency analysis as in (c) but for single lever-pull trials (instead of session averages). (f) Same peak power analysis as in (d) for single trials.
Figure 8
The widefield [Ca] activity correlates of self-initiated limb movement vs. goal-oriented actions.
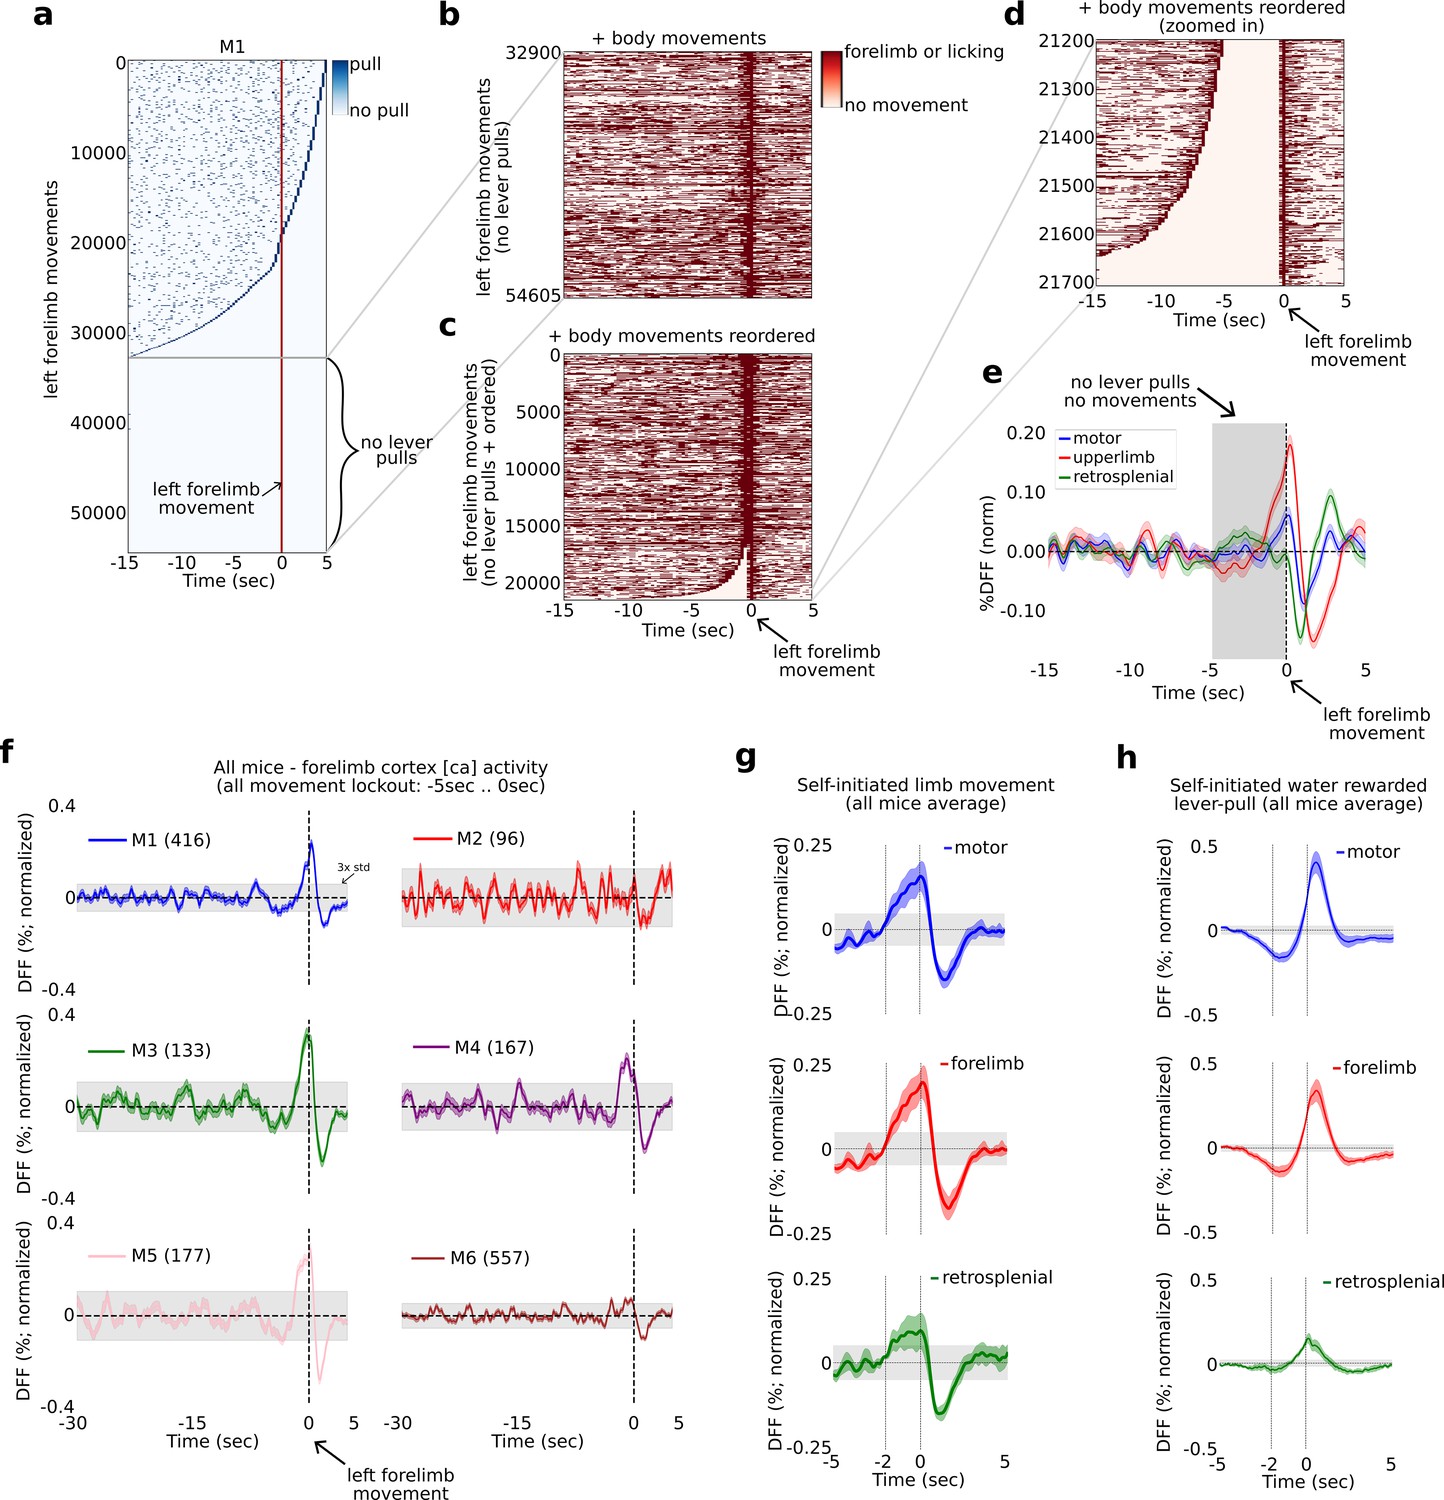
The widefield [Ca] activity correlates of random vs. goal-oriented self-initiated actions.
(a) Raster plot showing the location of all lever pulls in mouse M1 across all sessions (blue rasters) relative to spontaneous left paw movements (red line at t = 0 s) ordered by the duration of pre-paw-movement lever-pull quiescence. (b) The completely lever-locked left forelimb movements from (a) with added left and right forelimb movements and licking events (red rasters). (c) Same as (b) but ordered by the duration of quiescence prior to the left forelimb movement. (d) The bottom events from (c) showing the location of left and right forelimb movements and licking events (red rasters). (e) The average neural dynamics in motor cortex (blue), forelimb cortex (red), and retrosplenial cortex (green). (f) The average forelimb cortex activity (color shading represents standard error) for each mouse during periods as in (d) and (e). (g) The average neural activity (color shading represents standard error) from all mice averages as in (f) for motor, forelimb and retrosplenial cortex. (h) Same as (g) but for water-rewarded lever-pull activity. (Note: gray shading in all plots represents 3× standard deviation of the average neural signal between −30 and −5 s prior to movement or lever pull; see also Methods.)
Author response image 1
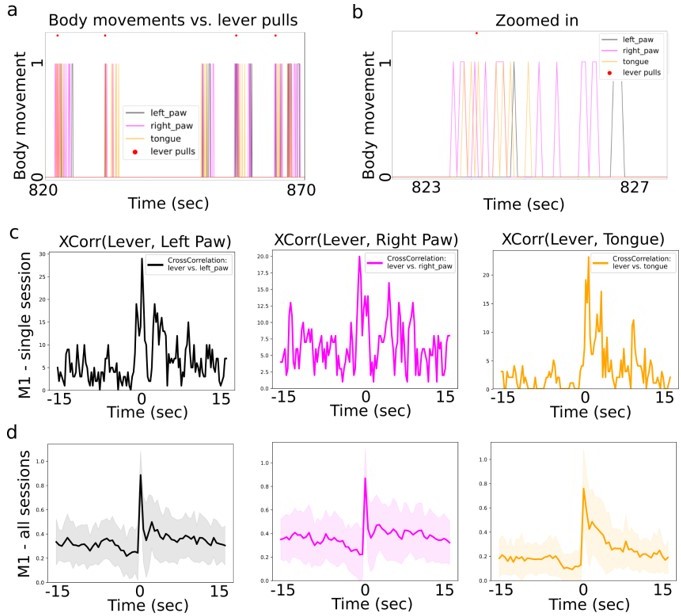
Cross-correlation between lever pull and body movement initiations.
(a) Visualizating body movement times (colored lines = boolean values) and lever pull locations (red dots) in a ~50sec window shows that many body movements occur in groups, are preceded by seconds of non-movement and often temporally coincide with lever pulls (example data was taken from mouse M1). (b) Zoomed in section from (a). (c) The cross-correlation between lever pull initiation time and the left paw, right paw and licking bout initiations (for session data in (a)). (d) The average (normalized) cross correlation (continuous lines) and standard deviation (shading) for all sessions in mouse M1 between lever pull and left paw, right and tongue movement invitations. (note: we obtained similar results for mice M2-M6).
Author response image 2
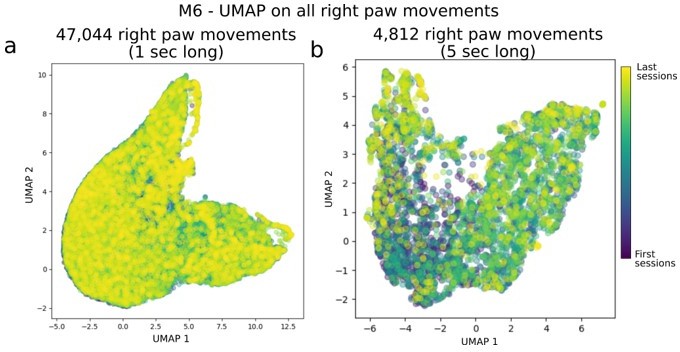
Evaluation of systematic longitudinal changes path in right paw movement trajectories.
Panel (a) shows UMAP applied on 1-sec long right paw movement segments from all sessions in mouse M6. For clarity, we took the DeepLabCut detected locations of the right paw, split them into continuous, non-overlapping 1 sec segments (and centered them, i.e. removed any offset as we were interested in relative changes in the 1 sec period), and fed it into UMAP (i.e. each example had dimensions of: [n_time points, n_spatial_locations] = [15, 2] in this panel). Panel (b) is the same as (a) but for 5 sec long movement snippets.
Author response image 3
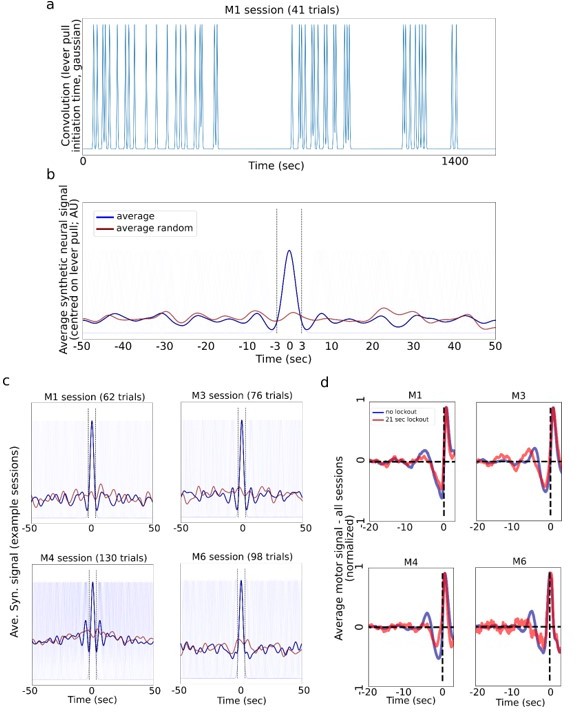
Generating synthetic “neural” data by convolving lever pull times and gaussians.
(a) A synthetic neural signal obtained by convolving each rewarded lever pull time within a single session with a gaussian kernel note: we used 1.5sec std gaussian, which gives about a 3.5-4.5sec wide signal; 1 sec or 2 sec std gaussians gave similar results; random data was generated by shifting the times by a random value drawn from U(-25sec,25sec). (b) Average synthetic neural data (blue) centered on the lever pulls and the random control neural signal (red). (c) Four example sessions from different mice showing synthetic data (note: M4 had many trials and shuffling -/+25 secs still yielded a “bump” in the random average; a higher shift value removes this effect). (d) The real (not simulated as in a-c) average of motor cortex activity for no lockout (blue) vs. 21 sec lockout (red; note: we used the 21 sec as the longest window still yielding sufficient data) conditions shows that some animals continue to have small oscillations even when locking out previous lever pulls.
Tables
Table 1
Lever-pull statistics.
Additional files
Download links
A two-part list of links to download the article, or parts of the article, in various formats.
Downloads (link to download the article as PDF)
Open citations (links to open the citations from this article in various online reference manager services)
Cite this article (links to download the citations from this article in formats compatible with various reference manager tools)
Mesoscale cortex-wide neural dynamics predict self-initiated actions in mice several seconds prior to movement
eLife 11:e76506.
https://doi.org/10.7554/eLife.76506


