Interplay of adherens junctions and matrix proteolysis determines the invasive pattern and growth of squamous cell carcinoma
- Tumour Cell Biology Laboratory, The Francis Crick Institute, United Kingdom
- Department of Pathology, Kitasato University, Japan
- Hoffman La-Roche, Switzerland
- Biomolecular Modelling Laboratory, The Francis Crick Institute, United Kingdom
- Institute of Cancer Research, United Kingdom
- Centre for Oral, Clinical and Translational Sciences, King's College London, United Kingdom
Figures
Figure 1 with 5 supplements

Diversity of collective invasion in squamous cell carcinoma (SCC).
(a) Images show a human invasive head and neck SCC stained with haematoxylin and eosin. Inset regions show different patterns of collective invasion: I – large rounded clusters, II – intermediate clusters, III – elongated strands only one or two cells wide. (b) Plot shows the mean number of cancer cell neighbours for each cell within invasive strands with the morphologies exemplified in panel (a) I, II, and III. One-way ANOVA with post-hoc multiple comparisons was performed. 95% confidence intervals are shown, one dot represents one cell analysed. (c) Images show phase contrast microscopy of a human oral SCC invading into a collagen/Matrigel mixture. Scale bar is 100 μm. Lower panels show manual tracking of individual cells within the clusters.
-
Figure 1—source data 1
Number of neighbouring cells for each cell within invasive strands in oral SCC tissue.
- https://cdn.elifesciences.org/articles/76520/elife-76520-fig1-data1-v1.xlsx
Figure 1—figure supplement 1

Diversity of collective invasion in squamous cell carcinoma.
(a) Images show a human invasive head and neck squamous cell carcinoma stained with haematoxylin and eosin (left) and anti-α-Smooth Muscle Actin (SMA) (right). Inset regions show different patterns of collective invasion: I – large rounded clusters, II – intermediate clusters, III – elongated strands only one or two cells wide. (b–d) Images show three further human invasive head and neck squamous cell carcinoma: stained with haematoxylin and eosin and cytokeratin (bottom right). Inset regions show different patterns of collective invasion: I – large rounded clusters, II – intermediate clusters, III – elongated strands only one or two cells wide. (e) Plot shows the average number of cancer cell neighbours each cell within invasive strands with the morphologies exemplified in panels (a) and (b–d), respectively. ***p<0.0005, ****p<0.0001. One-way ANOVA with post-hoc multiple comparisons. Error bars indicate 95% confidence intervals, one dot represents one cell analysed.
-
Figure 1—figure supplement 1—source data 1
Number of neighbouring cells for each cell within invasive strands in head and neck SCC tissue.
- https://cdn.elifesciences.org/articles/76520/elife-76520-fig1-figsupp1-data1-v1.xlsx
Figure 1—video 1
Single cell invasion: squamous cell carcinoma cells invading as single cells.
Figure 1—video 2
Single file strand invasion: squamous cell carcinoma cells invading as single file strand.
Figure 1—video 3
Thick strand invasion: squamous cell carcinoma cells invading as thick strand.
Figure 1—video 4
Pushing front invasion: squamous cell carcinoma cells invading as broad pushing invasive mass.
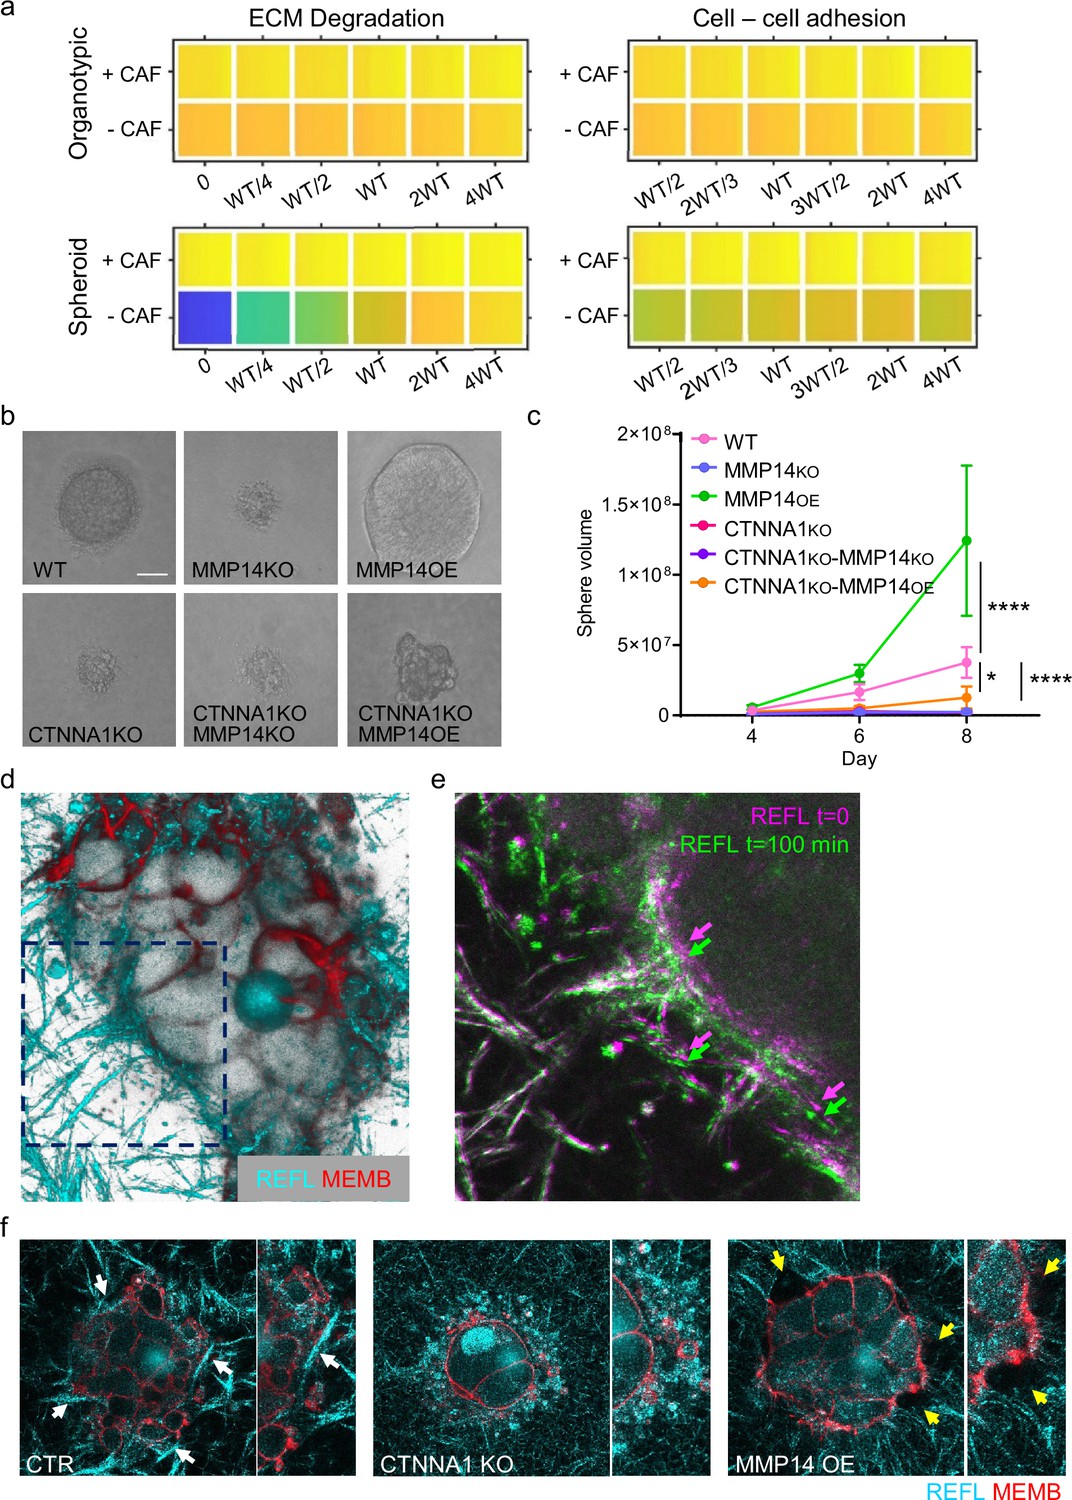
Figure 2 with 1 supplement

Agent-based modelling recapitulates diversity of collective invasion patterns.
(a) Images show the key steps and principles driving the agent-based model. At each time step, voxels are updated, and this can include growth – matrix replaced by cell, directional movement – cell voxel transposition, cell-cell adhesion – increase of voxels at the interface between cells, and extracellular matrix (ECM) remodelling or degradation – change in the ‘quantity’ of matrix in a voxel. Cancer cells are represented in green, fibroblasts in magenta, and matrix in greyscale. (b) Images show model outputs (panel columns 1, 2, 4, and 5) next to experimental data when fibroblasts are either absent or present in organotypic models (upper panels) or spheroids (lower panels). Cancer cells are green, fibroblasts are magenta. Scale bar = 100 μm. (c and d) Diverse patterns of collective invasion are shown in organotypic (c) and spheroid (d) models. Principal component analysis plot shows the metrics derived from over 2000 simulations in the presence of fibroblasts covering variation in cancer cell proteolysis, cancer cell–matrix adhesion, and cancer cell–cancer cell adhesion. The additional lines indicate how different metrics contribute to the first two components. The model runs corresponding to the exemplar images are indicated with roman numerals with three-dimensional images coloured according to mean number of squamous cell carcinoma (SCC) neighbours (blue low, red high). CAFs, cancer-associated fibroblasts.
Figure 2—figure supplement 1

Agent-based modelling recapitulates diversity of collective invasion patterns.
(a) Images show model outputs next to experimental data for increasing numbers of fibroblasts. Cancer cells are green, fibroblasts are magenta. Scale bar = 100 μm. (b) Cartoon illustrates the different metrics of invasion. (c) Cartoons illustrate different types of invasive strand and the metrics that they would generate. (d) Images show model output in an organotypic assay in the absence of fibroblasts but with a single permissive track. (e) Images illustrate how the track invasion score is calculated from the simulations illustrated in panel (d). Briefly, the extent of matrix remodelling in each extracellular matrix voxel is weighted based on the vertical distance from the starting cell–matrix interface. (f) Principal component analysis plots showing the metrics derived from thousands of simulations in the absence of fibroblasts (grey-level plots) and both the presence and absence of fibroblasts (green-yellow plots) covering variation in cancer cell proteolysis, cancer cell–matrix adhesion, and cancer cell–cancer cell adhesion.
Figure 3 with 1 supplement
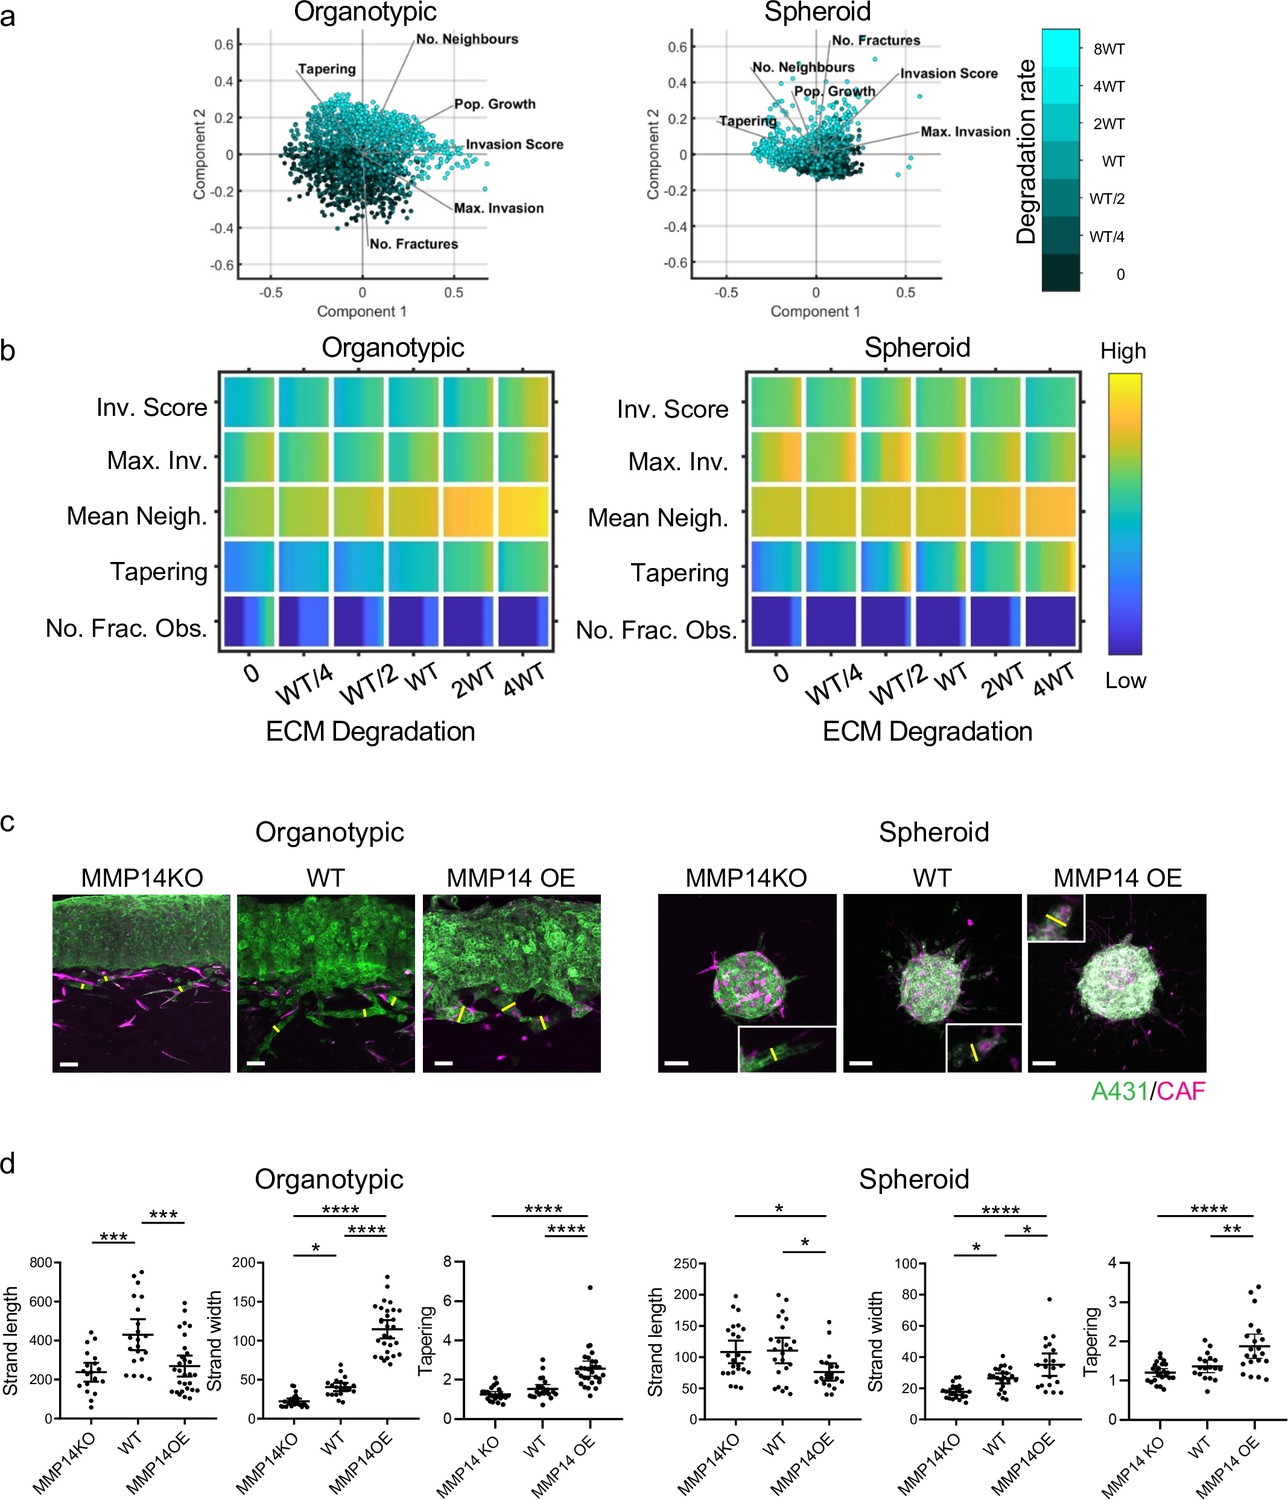
Matrix proteolysis determines strand width but not the distance invaded.
(a) Principal component analysis plots show the metrics derived from over 2000 simulations in the presence of fibroblasts covering variation in cancer cell proteolysis with values indicated by the intensity of cyan, cancer cell–matrix adhesion (not colour coded), and cancer cell–cancer cell adhesion (not colour coded). (b) Heatmaps show how varying the cancer cell proteolysis value (x axis) impacts on different metrics when fibroblasts are included in all simulations. WT indicates the ‘wild-type’ value based on experimental parameterisation using A431 cancer cells. Yellow indicates a high value, dark blue a low value. (c) Images show the effect of modulating matrix proteolysis via either MMP14 Crispr KO or MMP14 over-expression in cancer cells (green) both organotypic and spheroid assays including fibroblasts (magenta). Scale bar = 100 μm. (d) Quantification of three biological replicates of the experiment shown in panel (c) with strand length, strand width, and tapering shown – 1 unit is equivalent to 0.52 μm. Error bars indicate 95% confidence intervals, one dot represents one strand. ECM, extracellular matrix.
-
Figure 3—source data 1
Quantification of invading strand length, width, and tapering in A431 cells with/without MMP14 manipulation.
- https://cdn.elifesciences.org/articles/76520/elife-76520-fig3-data1-v1.xlsx
Figure 3—figure supplement 1
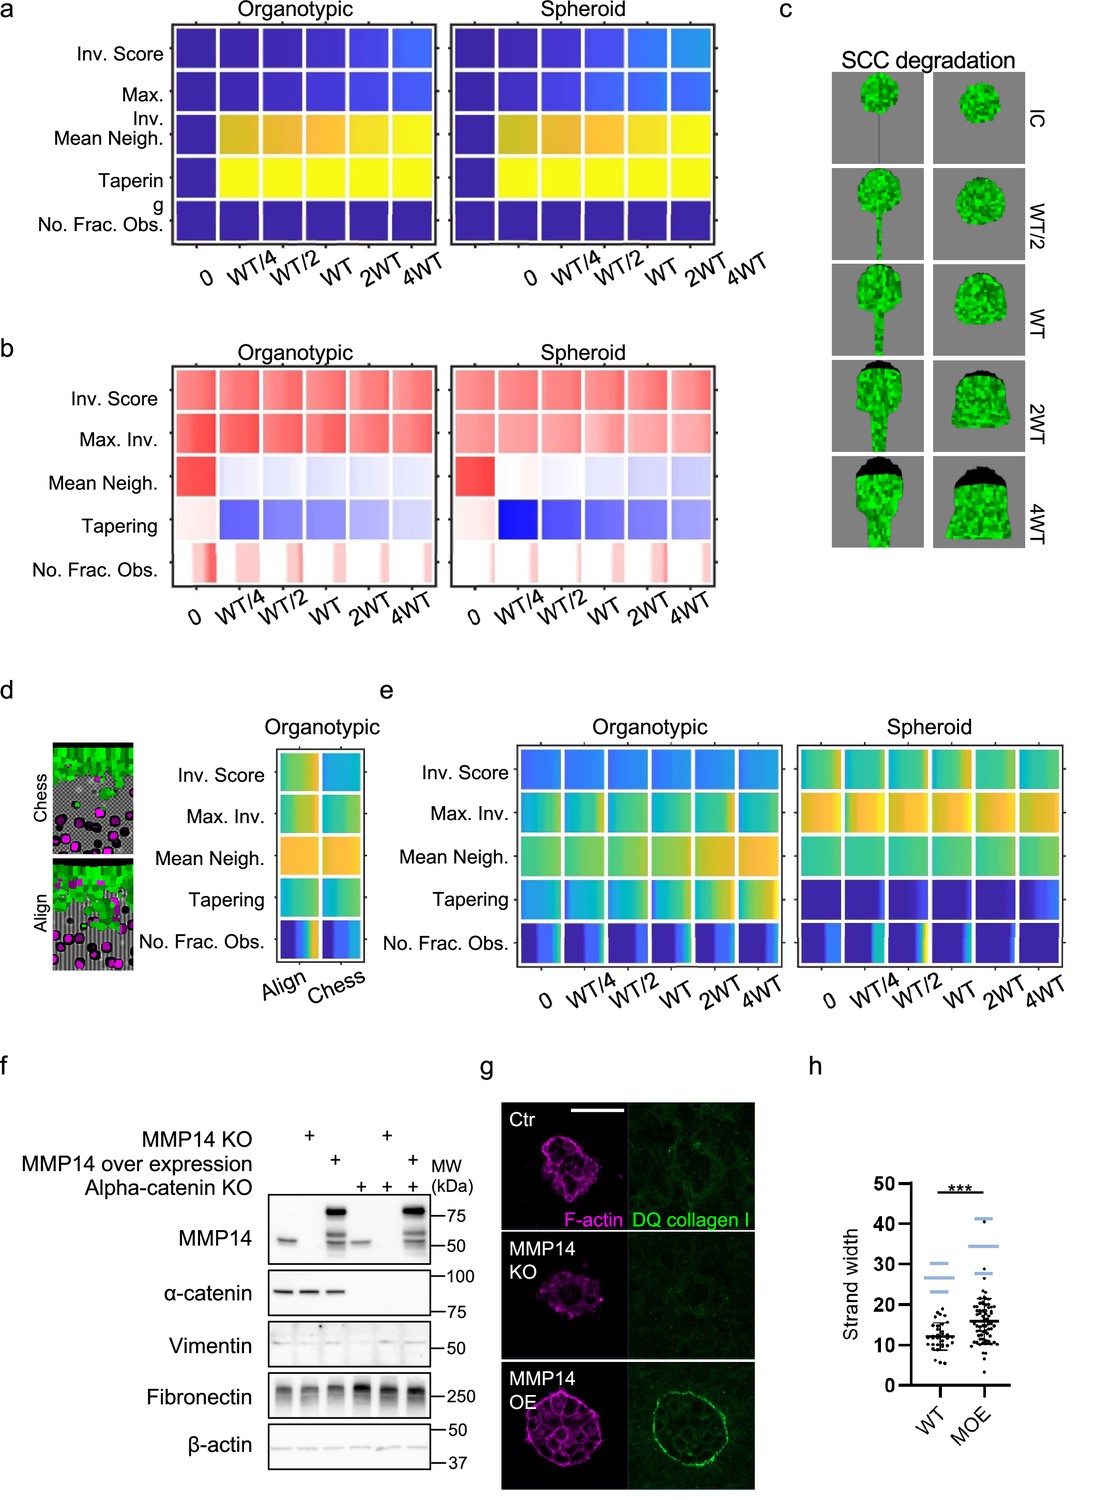
Matrix proteolysis determines strand width but not the distance invaded.
(a) Heatmaps show how varying the cancer cell proteolysis value (x axis) impacts on different metrics in the absence of fibroblasts. WT indicates the ‘wild-type’ value based on experimental parameterisation using A431 cancer cells. (b) Heatmaps show the differential values resulting from the inclusion of fibroblasts (effectively a comparison of Figure 3b and Figure 3—figure supplement 1a). Red indicates an increase when fibroblasts are present, dark blue a reduction when in the presence of fibroblasts. (c) Images show simulation output initiated with a spheroid, no fibroblasts, a uniform chemotactic cue, and varying cancer cell proteolysis. Left panel – day 7output in the absence of permissive track, right panel – day 5 output in the presence of permissive track. (d) Heatmaps show how varying the distribution of extracellular matrix (ECM) density in organotypic simulations impacts on different metrics when fibroblasts are included in all simulations. Parametrisation and colourmap as in (a). ‘Aligned’ refers to alternating tracks of high and low ECM density parallel to direction of invasion. ‘Chessboard’ refers to three-dimensional (3D) chessboard distribution of high and low ECM density values. (e) Heatmaps show how varying the cancer cell proteolysis value (x axis) impacts on different metrics when cancer-cell proliferation rate is halved, and fibroblasts are included in all simulations. Parametrisation and colourmap as in (a). (f) Western blots of MMP14, alpha-catenin, vimentin, fibronectin, and β-actin in A431 cells engineered using Crispr/Cas9 to delete MMP14 or CTNNA1, or to over-express MMP14. (g) Images show F-actin (magenta) and degraded collagen I represented by fluorescence of DQ collagen I (green) in 3D culture of A431 cells genetically engineered as indicated. (h) Plot shows the quantification of strand width in spheroid invasion assay of A431 WT or MMP14 over-expressing cells, which are pre-treated with mitomycin C. Unpaired t-test was performed. Error bars indicate 95% confidence intervals, one dot represents one strand. For comparison, light blue lines show the same metrics in the absence of mitomycin C (data from Figure 3d).
-
Figure 3—figure supplement 1—source data 1
Quantification of invading strand width in A431 WT and MMP14 OE cells pretreated with mitomycin C.
- https://cdn.elifesciences.org/articles/76520/elife-76520-fig3-figsupp1-data1-v1.xlsx
-
Figure 3—figure supplement 1—source data 2
Uncropped western blot images of WT, MMP14 KO, MMP14 OE, CTNNA1 KO, MMP14 KO/CTNNA1 KO, and MMP14 OE/CTNNA1 KO A431 lysates stained for MMP14, alpha-catenin, vimentin, fibronectin, or β-actin.
- https://cdn.elifesciences.org/articles/76520/elife-76520-fig3-figsupp1-data2-v1.zip
Figure 4 with 1 supplement
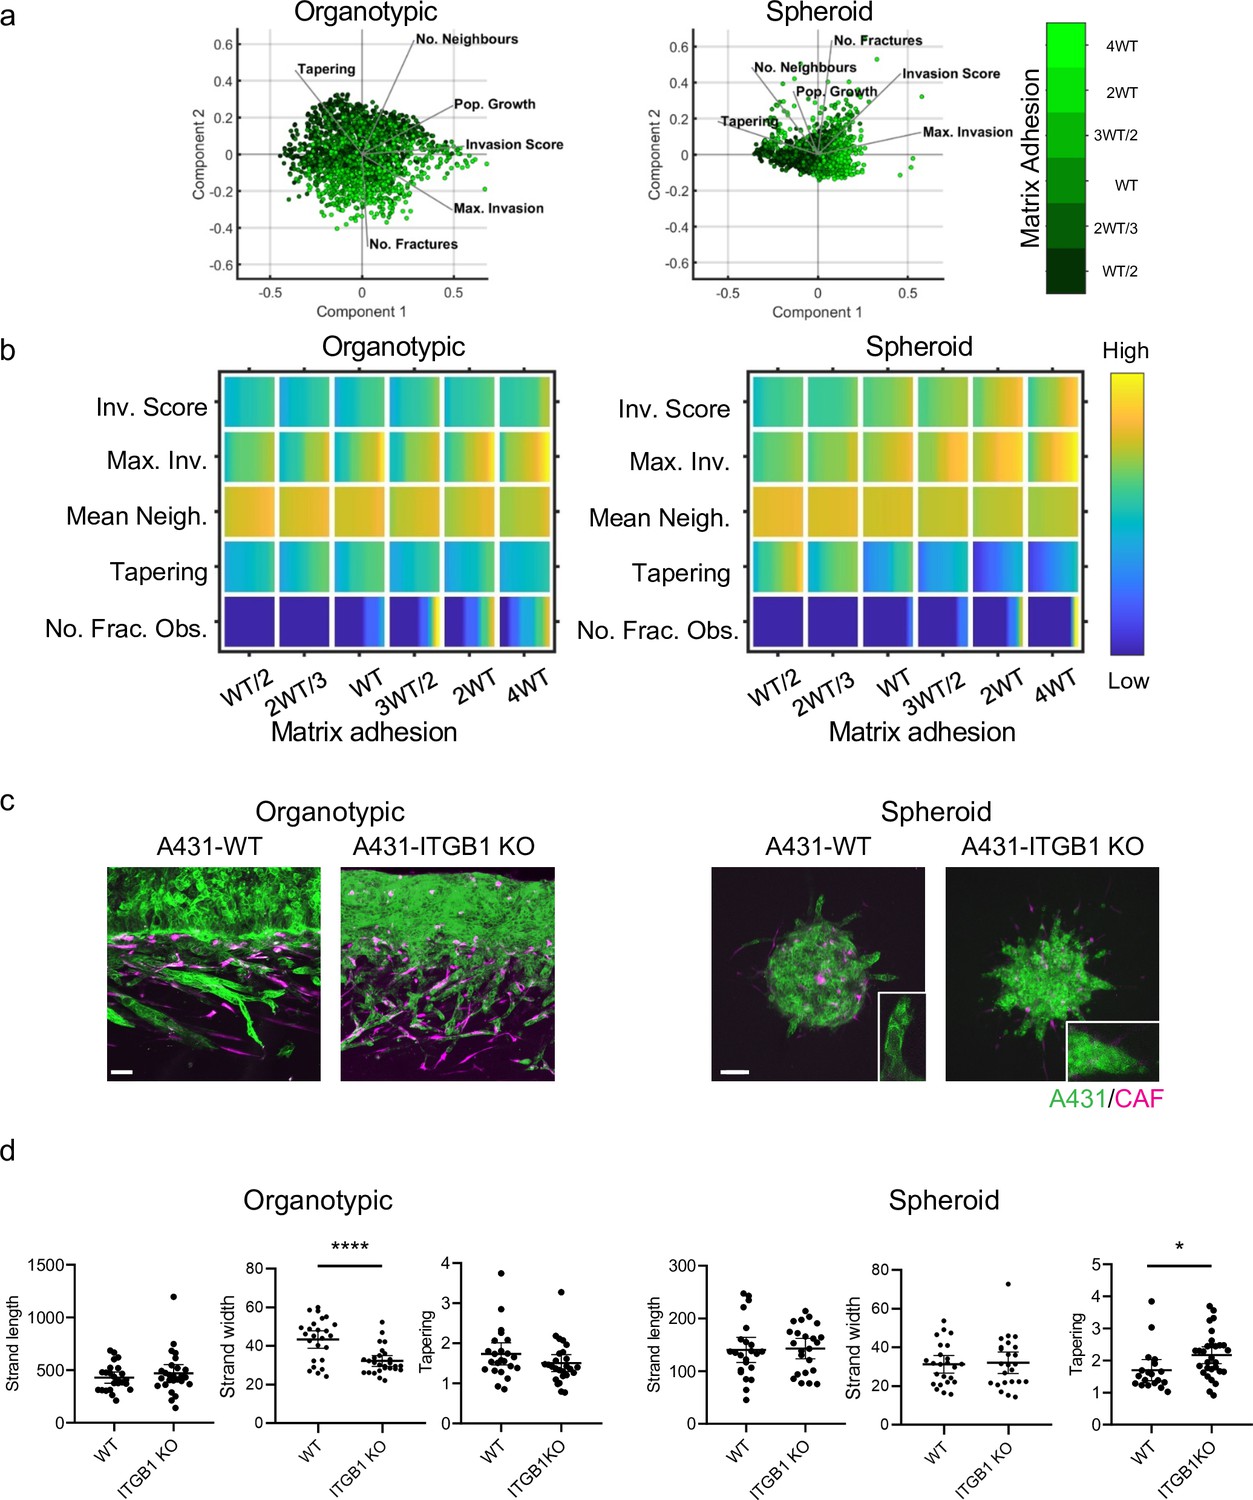
Cancer cell-matrix adhesion modulates the tapering of strands.
(a) Principal component analysis plots show the metrics derived from over 2000 simulations in the presence of fibroblasts covering variation in cancer cell–matrix adhesion with values indicated by the intensity of green, cancer cell proteolysis (not colour coded), and cancer cell–cancer cell adhesion (not colour coded). (b) Heatmaps show how varying the cancer cell–matrix adhesion value (x axis) impacts on different metrics when fibroblasts are included in all simulations. WT indicates the ‘wild-type’ value based on experimental parameterisation using A431 cancer cells. Yellow indicates a high value, dark blue a low value. (c) Images show the effect of modulating matrix adhesion via Crispr KO of ITGB1 in cancer cells (green) in both organotypic and spheroid assays including fibroblasts (magenta). Scale bar = 100 μm. (d) Quantification of three biological replicates of the experiment shown in panel (c) with strand length, strand width, and tapering metric shown – 1 unit is equivalent to 0.52 μm. Unpaired t-test was performed. 95% confidence intervals are shown, one dot represents one strand.
-
Figure 4—source data 1
Quantification of invading strand length, width, and tapering in A431 cells with/without ITGB1 manipulation.
- https://cdn.elifesciences.org/articles/76520/elife-76520-fig4-data1-v1.xlsx
Figure 4—figure supplement 1
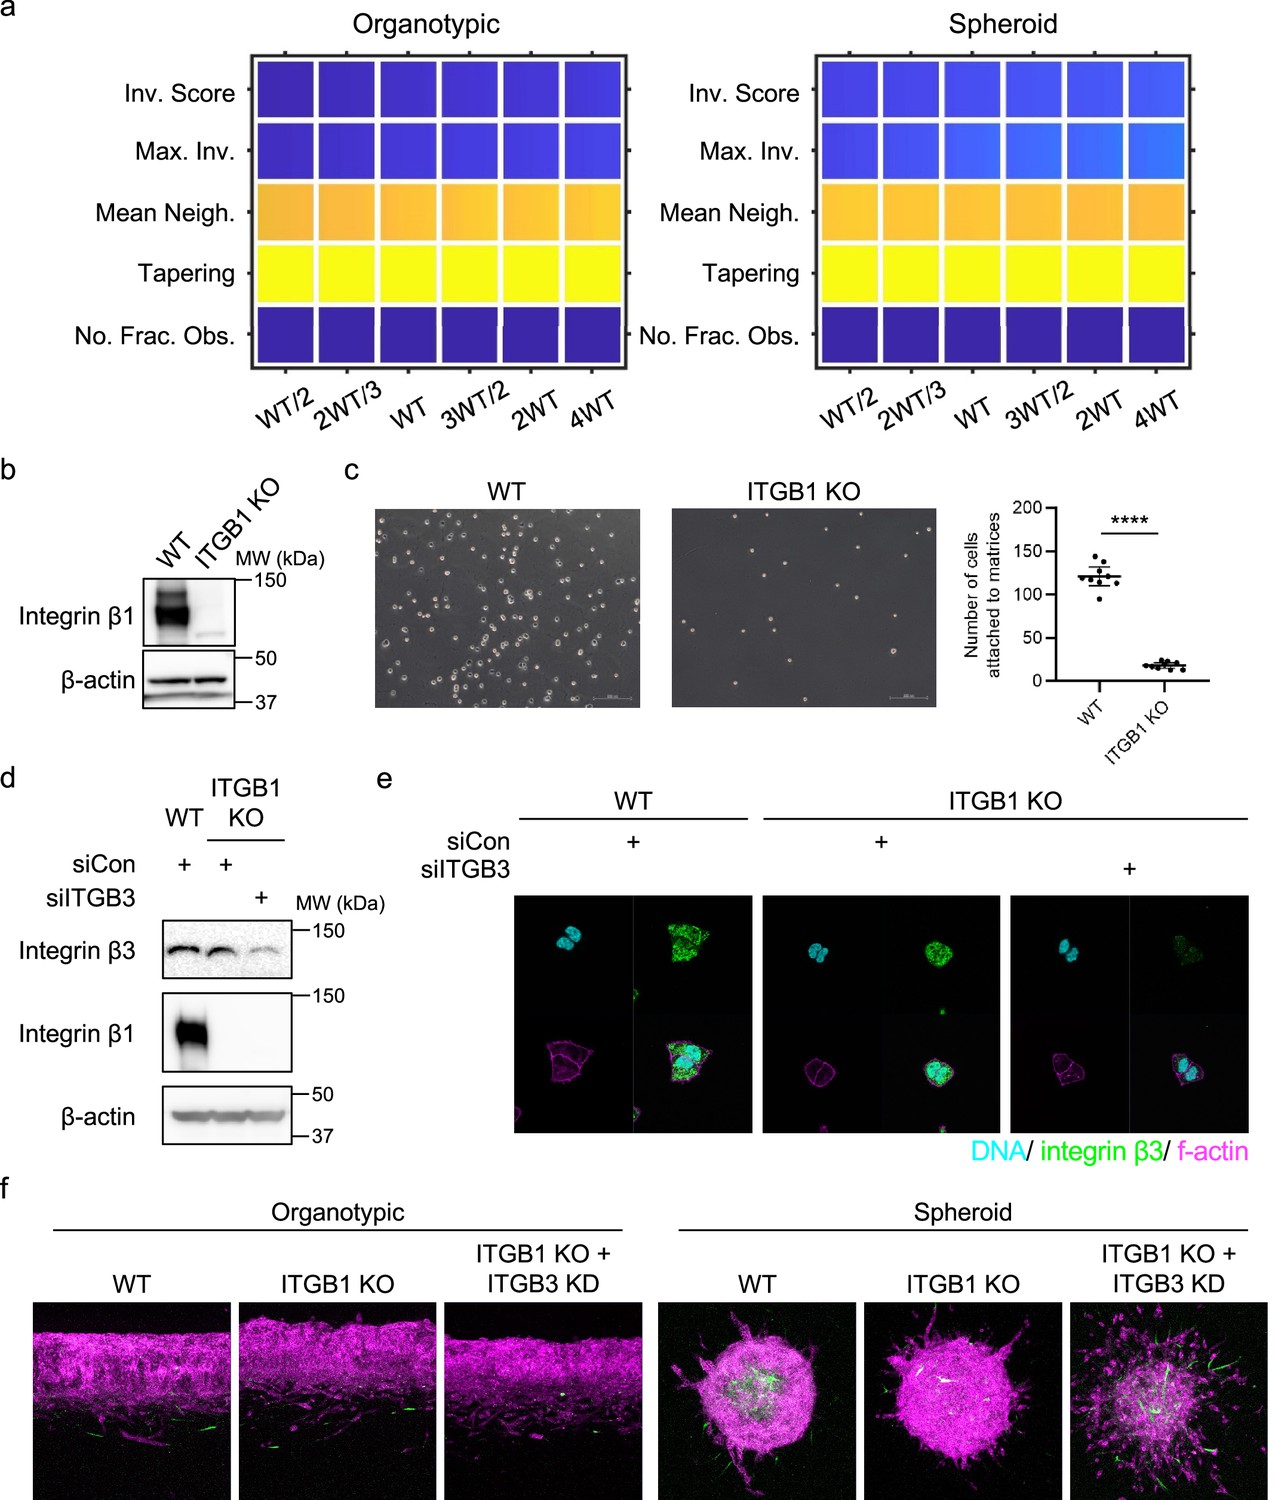
Cancer cell–matrix adhesion modulates the tapering of strands.
(a) Heatmaps show how varying the cancer cell–matrix adhesion value (x axis) impacts on different metrics in the absence of fibroblasts. WT indicates the ‘wild-type’ value based on experimental parameterisation using A431 cancer cells. (b) Western blots of integrin β1 and β-actin in A431 cells engineered using Crispr/Cas9 to delete integrin β1. (c) Images show adhesion of A431 WT cells or ITGB1 KO cells to extracellular matrices. The number of cells attached to matrices is quantified in the plot. Unpaired t-test was performed. Error bars indicate 95% confidence intervals, one dot represents one field of view with 3 fields quantified from 3 experiments. (d) Western blots of integrin β3, integrin β1, and β-actin in A431 cells engineered using Crispr/Cas9 to delete integrin β1 or to deplete integrin β3 by transfecting ITGB3 siRNA. (e) Images show DNA (cyan), integrin β3 (green), and F-actin (magenta) in A431 WT, ITGB1 KO, or ITGB1 KO/ ITGB1 KD cells. (f) Images show Invasion of A431 WT, ITGB1 KO, or ITGB1 KO/ ITGB3 KD cells in organotypic (left panel) or spheroid (right panel) invasion assay.
-
Figure 4—figure supplement 1—source data 1
Quantification of ECM adhesion in A431 WT and ITGB1 KO cells.
- https://cdn.elifesciences.org/articles/76520/elife-76520-fig4-figsupp1-data1-v1.xlsx
-
Figure 4—figure supplement 1—source data 2
Uncropped western blot images of WT, ITGB1 KO, ITGB1 KO/control KD, and ITGB1 KO/ITGB3 KD A431 lysates stained for integrin β1, integrin β3, or β-actin.
- https://cdn.elifesciences.org/articles/76520/elife-76520-fig4-figsupp1-data2-v1.zip
Figure 5 with 1 supplement

Cancer cell-cancer cell adhesion is required for efficient invasion in response to uniform directional cues.
(a) Principal component analysis plots show the metrics derived from over 2000 simulations in the presence of fibroblasts covering variation in cancer cell–cancer cell adhesion with values indicated by the intensity of magenta, cancer cell proteolysis (not colour coded), and cancer cell–matrix adhesion (not colour coded). (b) Heatmaps show how varying the cancer cell–cancer cell adhesion value (x axis) impacts on different metrics when fibroblasts are included in all simulations. WT indicates the ‘wild-type’ value based on experimental parameterisation using A431 cancer cells. Yellow indicates a high value, dark blue a low value. (c) Images show the effect of modulating cancer cell-cell adhesion via Crispr KO of CTNNA1 in cancer cells (green) in both organotypic and spheroid assays including fibroblasts (magenta). Scale bar = 100 μm. (d) Quantification of three biological replicates of the experiment shown in panel (c) with strand length, strand width, and tapering shown – 1 unit is equivalent to 0.52 μm. Unpaired t-test was performed. Error bars indicate 95% confidence intervals, one dot represents one strand. (e) Plots show the track invasion score with varying cancer cell–cancer cell adhesion in simulations lacking fibroblasts but with a single permissive track favouring invasion. Cartoons indicate the initial set up of cell positions and the directional cue in the simulation.
-
Figure 5—source data 1
Quantification of invading strand length, width, and tapering in A431 cells with/without CTNNA1 manipulation.
- https://cdn.elifesciences.org/articles/76520/elife-76520-fig5-data1-v1.xlsx
Figure 5—figure supplement 1
Cancer cell–cancer cell adhesion is required for efficient invasion in response to uniform directional cues.
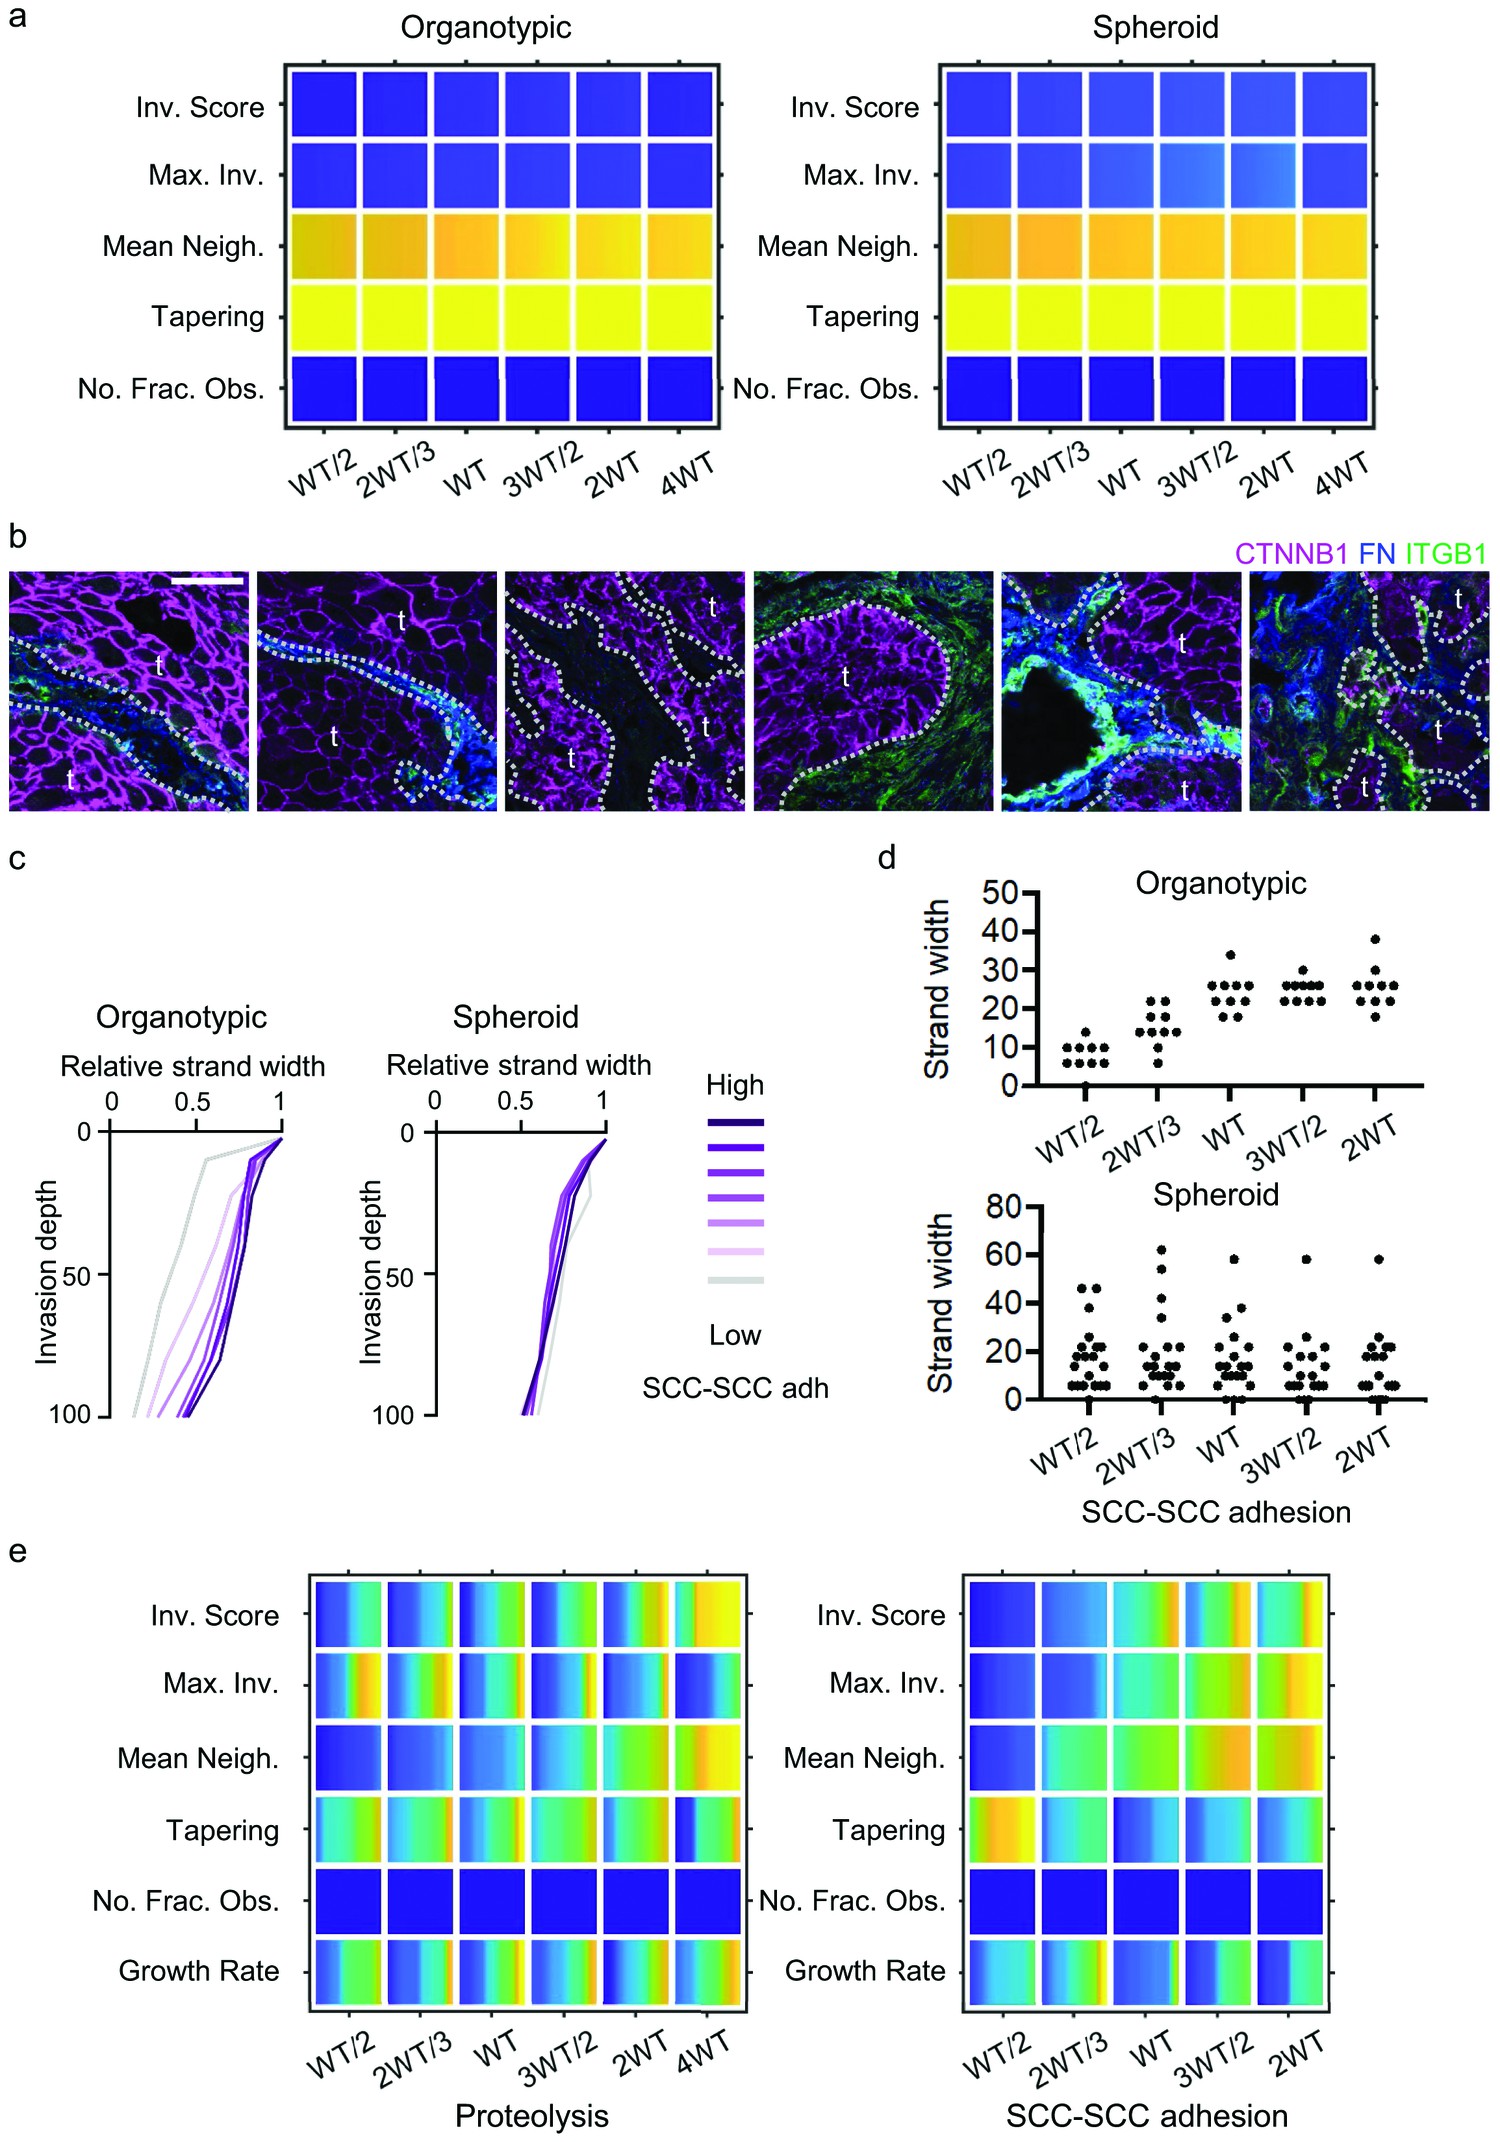
(a) Heatmaps show how varying the cancer cell–cancer cell adhesion value (x axis) impacts on different metrics in the absence of fibroblasts. WT indicates the ‘wild-type’ value based on experimental parameterisation using A431 cancer cells. (b) Images show the β-catenin (magenta), fibronectin (FN; blue), and integrin β1 (green) staining in human squamous cell carcinoma tissue. ‘t’ indicates tumour clusters, scale bar is 50 microns. (c) Plots show how the mean number of neighbours of cancer cells varies as a function of invasion depth in simulations with varying cancer cell–cancer cell adhesion (c.f. Figure 2—figure supplement 1b). (d) Plots show how the strand width varies depending on cancer cell–cancer cell adhesion in permissive track simulations, one dot represents one simulation. (e) Heatmaps show how varying the proteolysis (left panel) or cancer cell–cancer cell adhesion (right panel) values (x axis) impacts on different metrics in organotypic simulations when fibroblasts are mixed in with the cancer cells rather than extracellular matrix. Parametrisation and colourmaps as in Figure 5 and part (a).
Figure 6 with 1 supplement
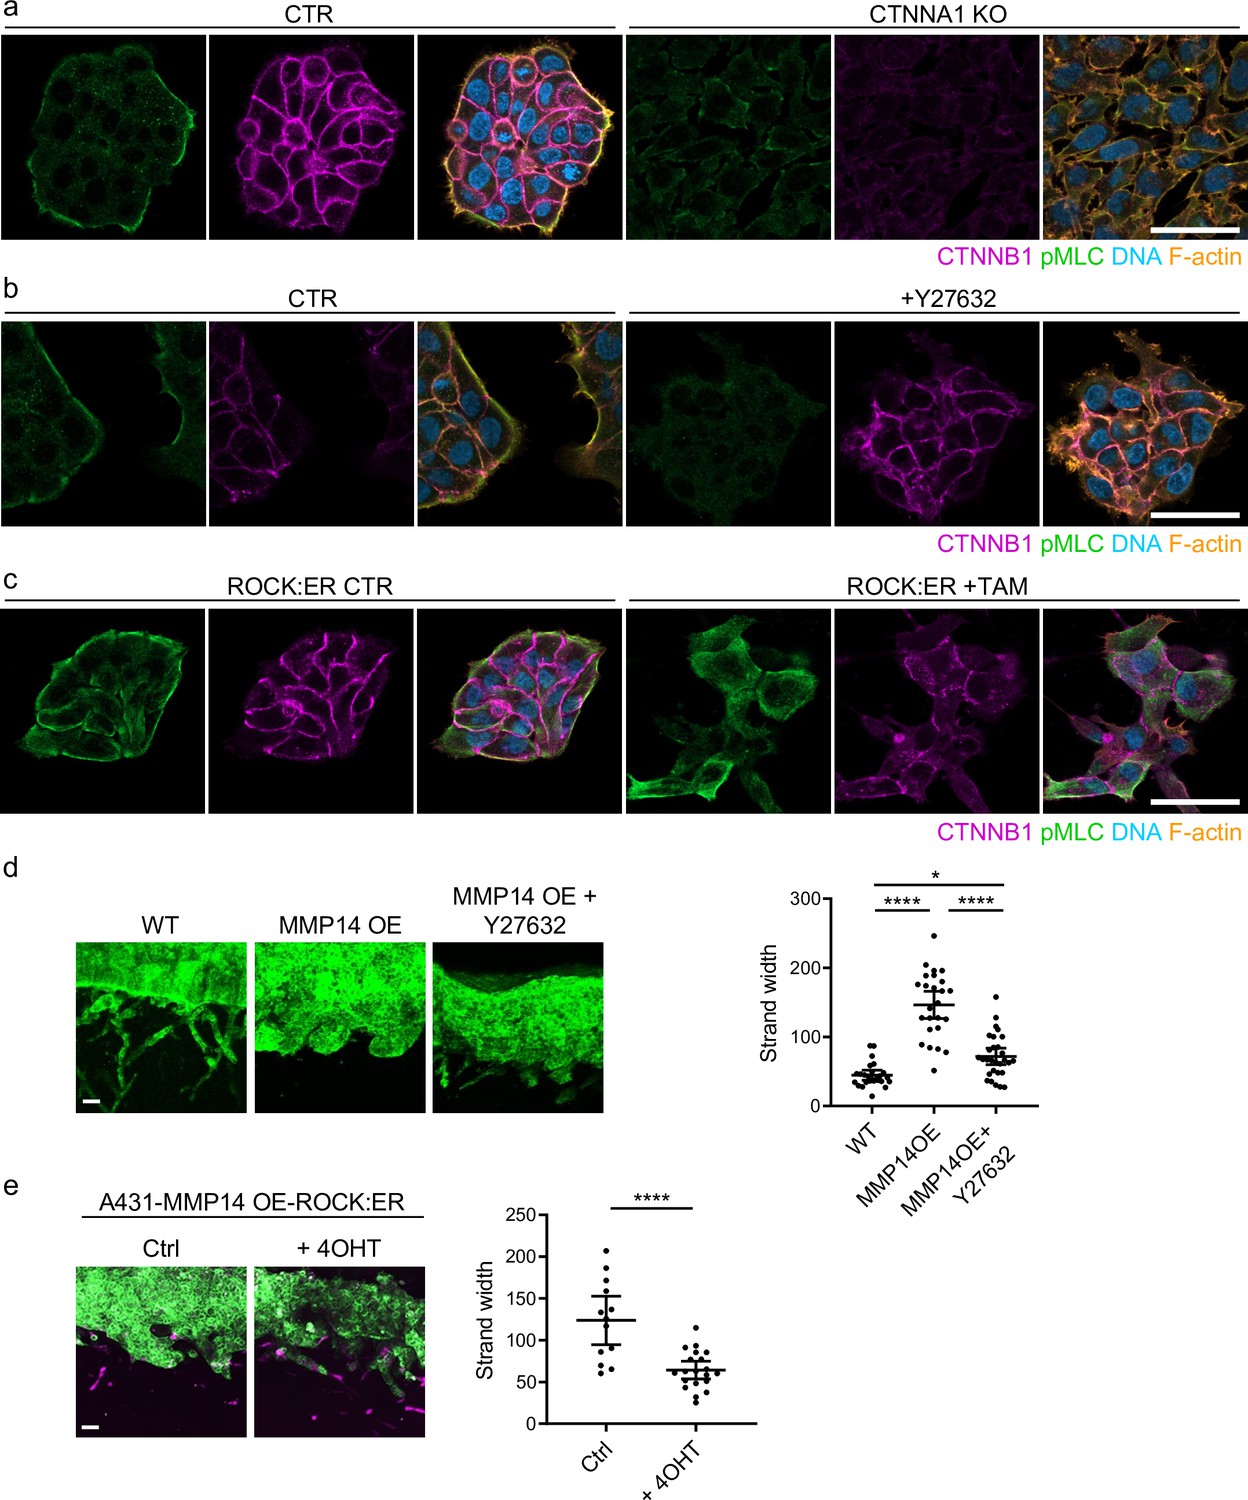
Supra-cellular coordination of actomyosin organisation by cell–cell junctions enables wide invading strands.
(a) Images show the β-catenin (magenta), F-actin (orange), DNA (blue), and active myosin (pS19-MLC - green) networks in control A431 and CTNNA1 KO A431 cells.( b) Images β-catenin (magenta), F-actin (orange), DNA (blue), and active myosin (pS19-MLC - green) networks in control A431- and 10-μM Y27632-treated cells. Scale bar = 20 μm. (c) Images show β-catenin (magenta), F-actin (orange), DNA (blue), and active myosin (pS19-MLC - green) networks in control A431 ROCK:ER- and 4-OHT-treated cells. Scale bar = 20 μm. (d) Images show organotypic killing assays using control or MMP14 over-expressing A431 cells in the presence or absence of 10 μM Y27632. Scale bar = 100 μm. Plot shows the quantification of strand width from three biological replicates – 1 unit is equivalent to 0.52 μm. One-way ANOVA with post-hoc multiple comparisons was performed. Error bars indicate 95% confidence intervals, one dot represents one strand. (e) Images show organotypic invasion assays using MMP14 over-expressing A431 cells additionally engineered to contain ROCK:ER in the presence or absence of 4-OHT. Scale bar = 100 μm. Plot shows the quantification of strand width from three biological replicates. Unpaired t-test was performed. Error bars indicate 95% confidence intervals, one dot represents one strand.
-
Figure 6—source data 1
Quantification of invading strand width in A431 cells with/without manipulation of actomyosin contractility.
- https://cdn.elifesciences.org/articles/76520/elife-76520-fig6-data1-v1.xlsx
Figure 6—figure supplement 1
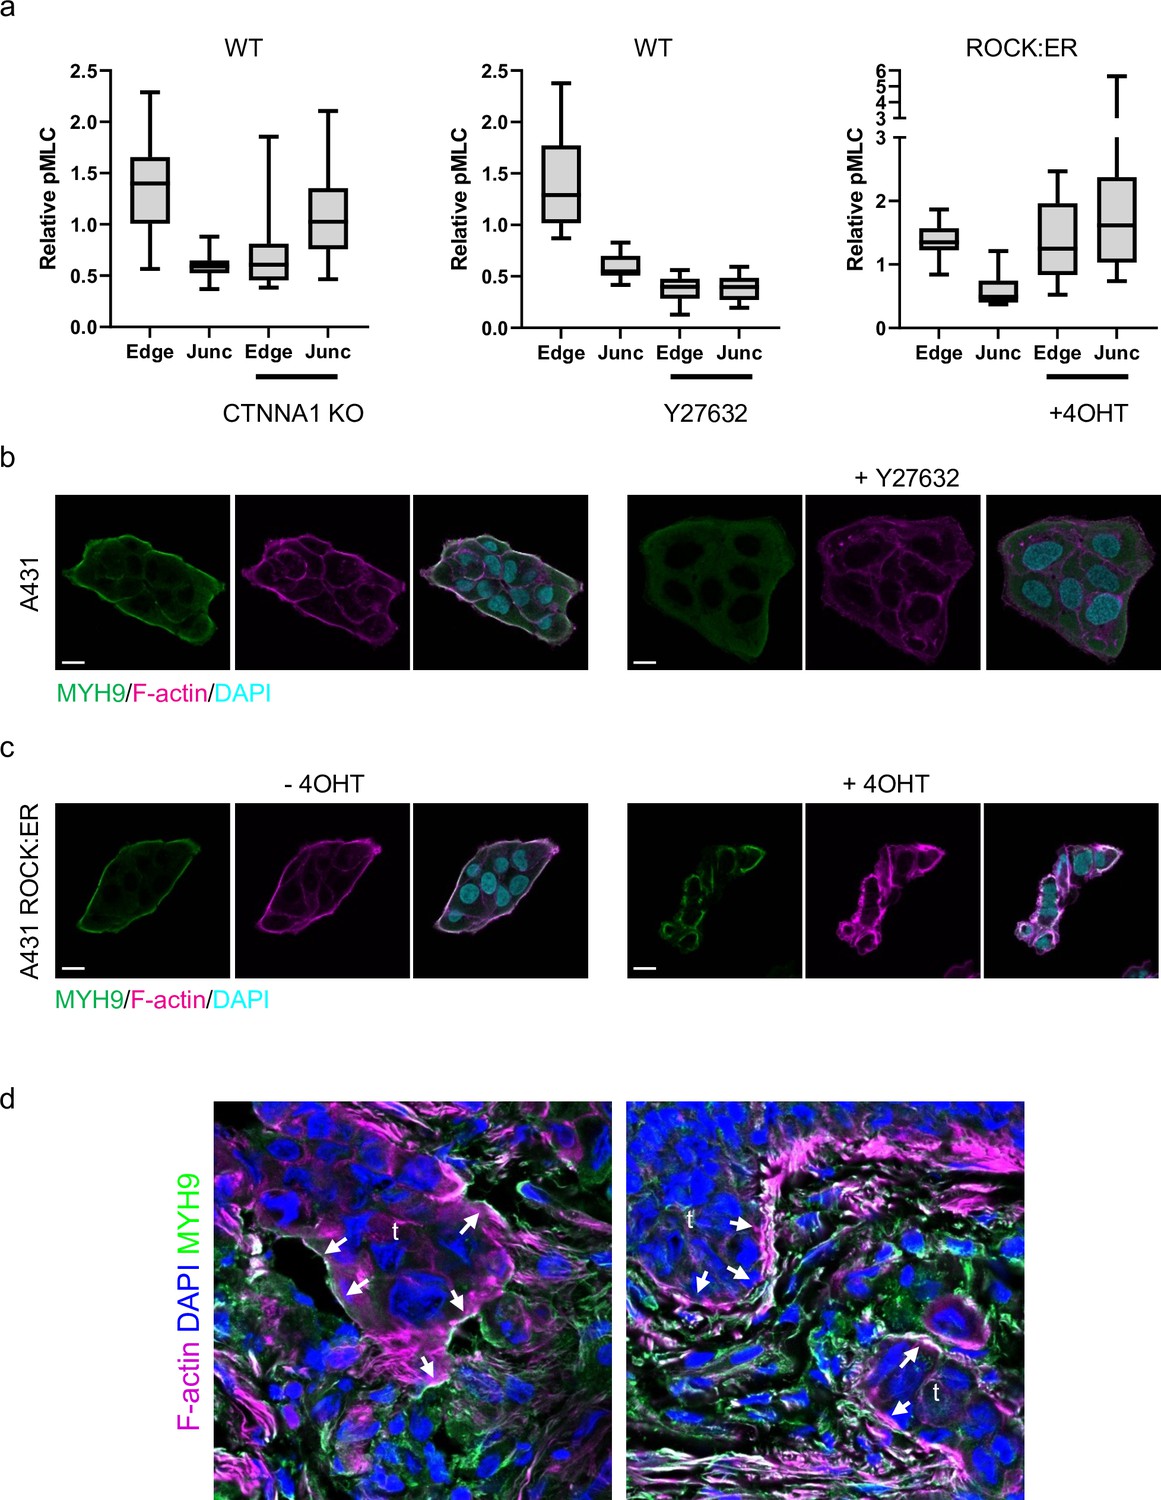
Supra-cellular coordination of actomyosin organisation by cell–cell junctions enables wide invading strands.
(a) Plots show the quantifications of relative intensity of pMLC in A431 WT, CTNNA1 KO, A431 WT cells treated with Y27632 and ROCK:ER expressing A431 ± 4(O)HT at the edge or cell-cell junction of the cells. Mean, quartiles, and extremes are shown, data from 3 independent experiments. (b) Images show the F-actin (magenta) and myosin (MYH9/MHCIIa - green) networks in control A431- and 10-μM Y27632-treated cells. Scale bar = 20 μm. (c) Images show the F-actin (magenta) and myosin (MYH9/MHCIIa - green) networks in control A431 ROCK:ER with/without 4-OHT treatment. Scale bar = 20 μm. (d) Images show the F-actin (magenta), DNA (DAPI; blue), and MYH9/MHCIIA (green) staining in human squamous cell carcinoma tissue. ‘t’ indicates tumour clusters, arrows point to supra-cellular actomyosin network, scale bar is 50 microns.
-
Figure 6—figure supplement 1—source data 1
Quantification of pMLC intensity in A431 WT, CTNNA1 KO, and cells with actomyosin manipulation.
- https://cdn.elifesciences.org/articles/76520/elife-76520-fig6-figsupp1-data1-v1.xlsx
Figure 7 with 1 supplement
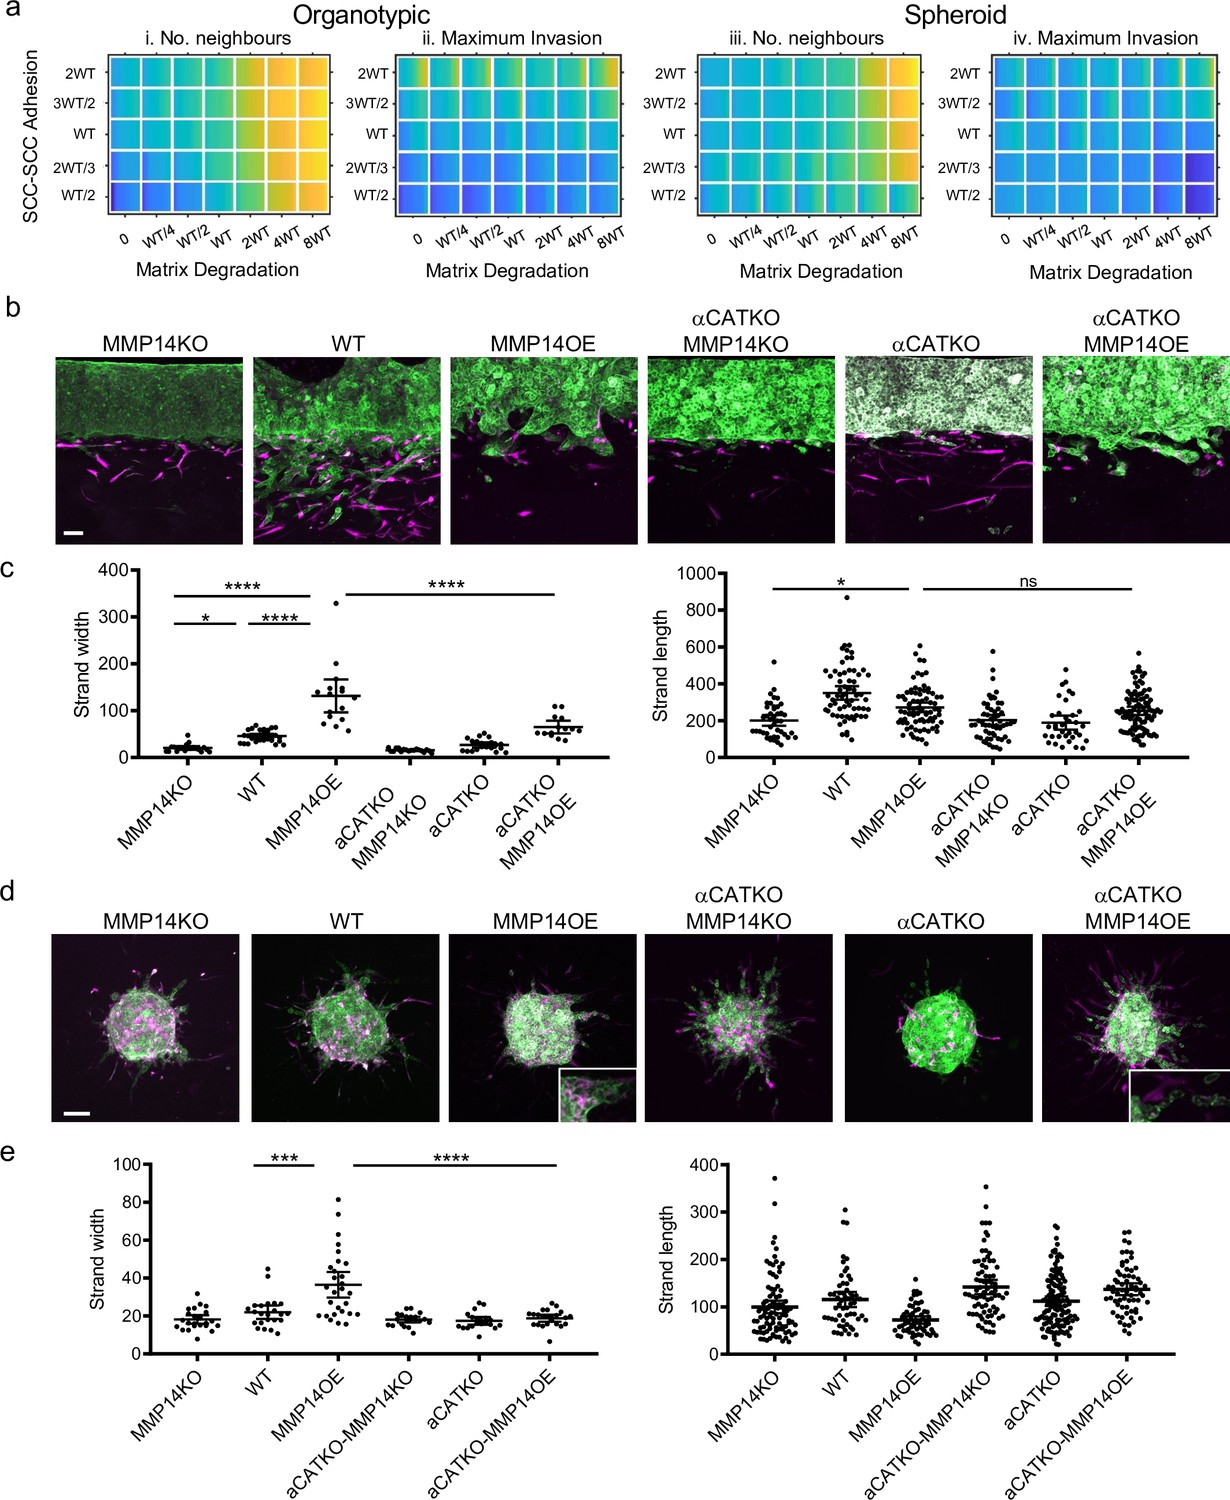
Proteolysis-driven strand widening requires adherens junctions.
(a) Heatmaps show how varying the matrix proteolysis (x-axis) and cancer cell–cancer cell adhesion value (y axis) impacts on different metrics when fibroblasts are included in all simulations. WT indicates the ‘wild-type’ value based on experimental parameterisation using A431 cancer cells. Yellow indicates a high value, dark blue a low value. (b) Images show the effect of combinatorial modulation of matrix proteolysis and cancer cell-cell adhesion via Crispr KO of CTNNA1 and/or MMP14 and/or MMP14 over-expression in cancer cells (green) in both organotypic assays including fibroblasts (magenta). Scale bar = 100 μm. (c) Quantification of three biological replicates of the experiment shown in panel (b) with strand length and strand width shown – 1 unit is equivalent to 0.52 μm. One-way ANOVA with post-hoc multiple comparisons was performed. Error bars indicate 95% confidence interval, one dot represents one strand. (d) Images show the effect of combinatorial modulation of matrix proteolysis and cancer cell-cell adhesion via Crispr KO of CTNNA1 and/or MMP14 and/or MMP14 over-expression in cancer cells (green) in both spheroid assays including fibroblasts (magenta). (e) Quantification of three biological replicates of the experiment shown in panel (d) with strand length and strand width shown. Scale bar = 100 μm. One-way ANOVA with post-hoc multiple comparisons was performed. Error bars indicate 95% confidence interval, one dot represents one strand.
-
Figure 7—source data 1
Quantification of invading strand width and length in A431 cells with/without manipulation of MMP14 and/or CTNNA1.
- https://cdn.elifesciences.org/articles/76520/elife-76520-fig7-data1-v1.xlsx
Figure 7—figure supplement 1
Proteolysis-driven strand widening requires adherens junctions.
(a) Images show simulations initiated with a spheroid, no fibroblasts, and a uniform downward chemotactic cue. Matrix proteolysis and cancer cell–cancer cell adhesion are varied. (b) Heatmaps show how varying the cancer cell–cancer cell adhesion value (x axis) and matrix proteolysis (y-axis) impacts on the curvature of the front of the invading cluster.
Figure 8 with 1 supplement
Strand widening is linked to tumour growth and metastasis.
(a) Heatmaps show how varying the matrix proteolysis (left) or cancer cell–cancer cell adhesion value (right) impacts on predicted cell growth in the presence or absence of fibroblasts. WT indicates the ‘wild-type’ value based on experimental parameterisation using A431 cancer cells. Yellow indicates a high value, dark blue a low value. (b) Phase contrast images show the growth of cancer cell colonies with the indicated manipulations of MMP14 and CTNNA1 after 8 days surrounded by matrix. Scale bar = 50 μm. (c) Plot shows quantification of the growth assay shown in (b). Two-way ANOVA with post-hoc multiple comparisons was performed. Error bars indicate 95% confidence intervals. Data from three biological replicates. (d) Fluorescent image shows reflectance of collagen fibre (cyan) and cell membrane of A431 WT cells in three-dimensional (3D) culture. (e) Fluorescent image shows reflectance of collagen fibres around A431 WT cells in 3D culture at two time points. t=0 min: magenta, t=100 min: green. (f) Fluorescent images show reflectance of collagen fibres (cyan) and cell membrane of A431 WT, CRNNA1 KO, or MMP14 over expressing cells (red) in 3D culture. White arrows highlight the formation and motion of collagen bundles adjacent to the cell clusters, yellow arrows highlight gaps.
-
Figure 8—source data 1
Quantification of cancer cell proliferation in 3D culture.
- https://cdn.elifesciences.org/articles/76520/elife-76520-fig8-data1-v1.xlsx
Figure 8—figure supplement 1

Strand widening is linked to tumour growth and metastasis.
(a) Images show EdU-labeled proliferating cells (green) and DNA (blue) in spheroid invasion assay with A431 WT, MMP14 KO, MMP14 OE, or CTNNA1 KO (magenta). (b) Plot shows the quantification of EdU-labeled cells shown in (a). One-way ANOVA with post-hoc multiple comparisons was performed. Error bars indicate 95% confidence intervals, n=3 biological replicates. (c) Plot shows quantification of growth of A431 cells with the indicated manipulations of MMP14 and CTNNA1 in two-dimensional cell culture. Two-way ANOVA with post-hoc multiple comparisons was performed. Error bars indicate 95% confidence intervals, n=3 biological replicates. (b) Phase contrast images show the growth of A431 ROCK:ER cancer cell colonies in the presence or absence of 4-OHT. Scale bar = 50 μm. (c) Plot shows quantification of the growth assay shown in (b). Data from three biological replicates. Two-way ANOVA with post-hoc multiple comparisons was performed. Error bars indicate 95% confidence intervals, n=3 biological replicates.
-
Figure 8—figure supplement 1—source data 1
Quantification of proliferation of WT, MMP14, CTNNA1, and/or ROCKER manipulated A431 in 2D and 3D culture.
- https://cdn.elifesciences.org/articles/76520/elife-76520-fig8-figsupp1-data1-v1.xlsx
Figure 9 with 1 supplement
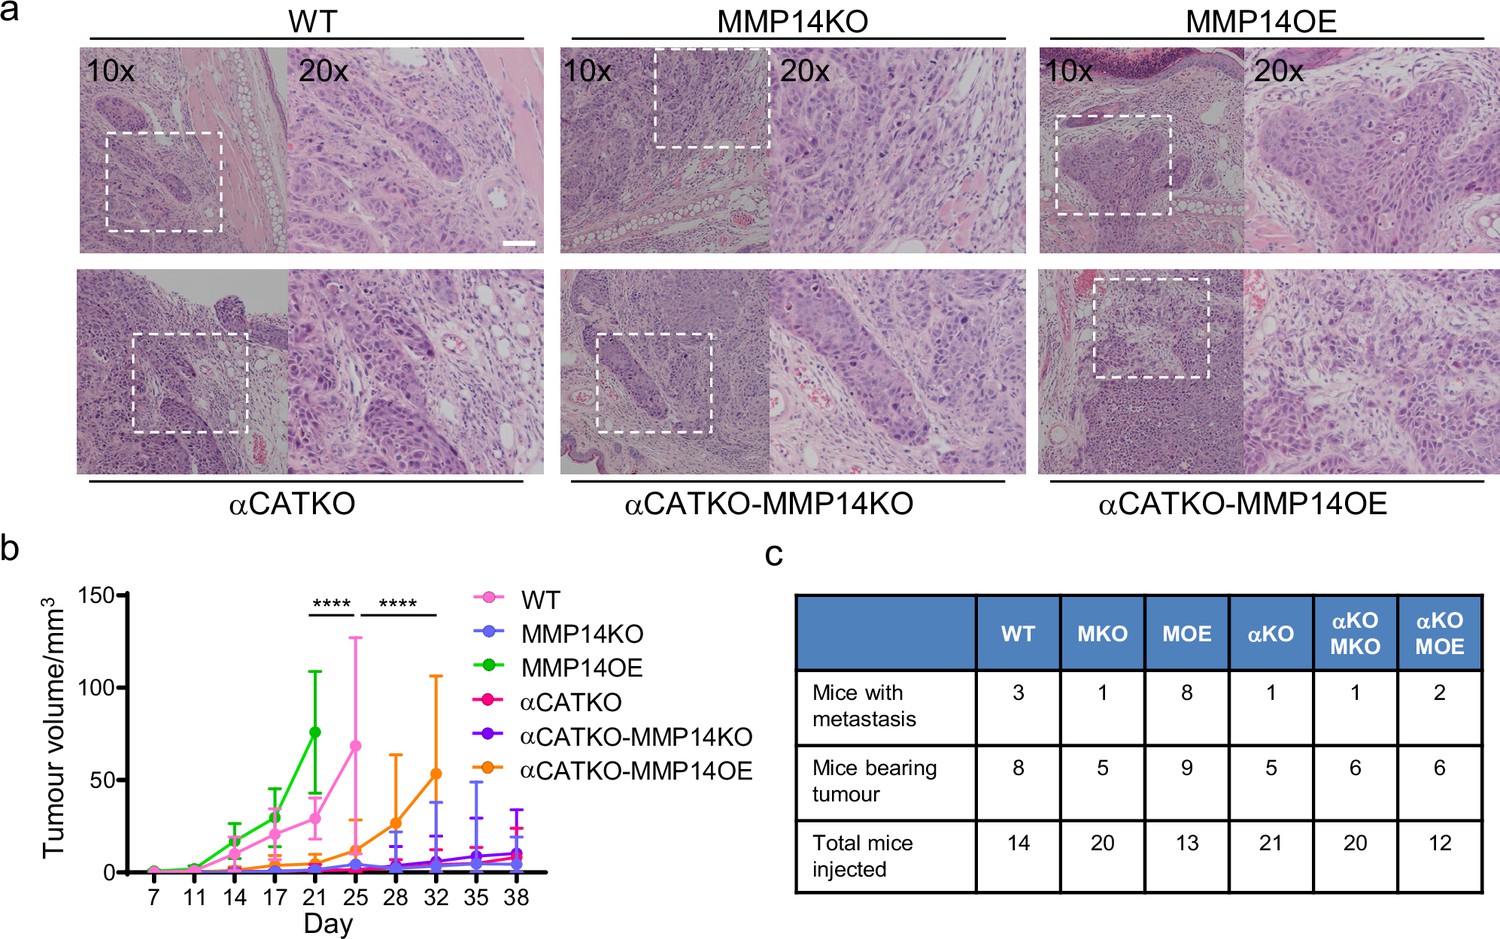
Strand widening is linked to tumour growth and metastasis.
(a) H&E images are shown on tumours growing in the ears of mice with the indicated manipulations of MMP14 and CTNNA1. Scale bar = 50 μm. (b) Plot shows quantification of A431 tumour growth with the indicated manipulations of MMP14 and CTNNA1. (c) Table shows quantification of mice with primary tumours and mice with lymph node metastases when injected with A431 cells with the indicated manipulations of MMP14 and CTNNA1. The total number of mice for each condition also applies to the data plotted in (b). Two-way ANOVA with post-hoc multiple comparisons was performed. Error bars indicate 95% confidence intervals.
-
Figure 9—source data 1
Tumour size and number of metastasis in WT and MMP14 and/or CTNNA1 manipulated tumour-bearing mice.
- https://cdn.elifesciences.org/articles/76520/elife-76520-fig9-data1-v1.xlsx
Figure 9—figure supplement 1
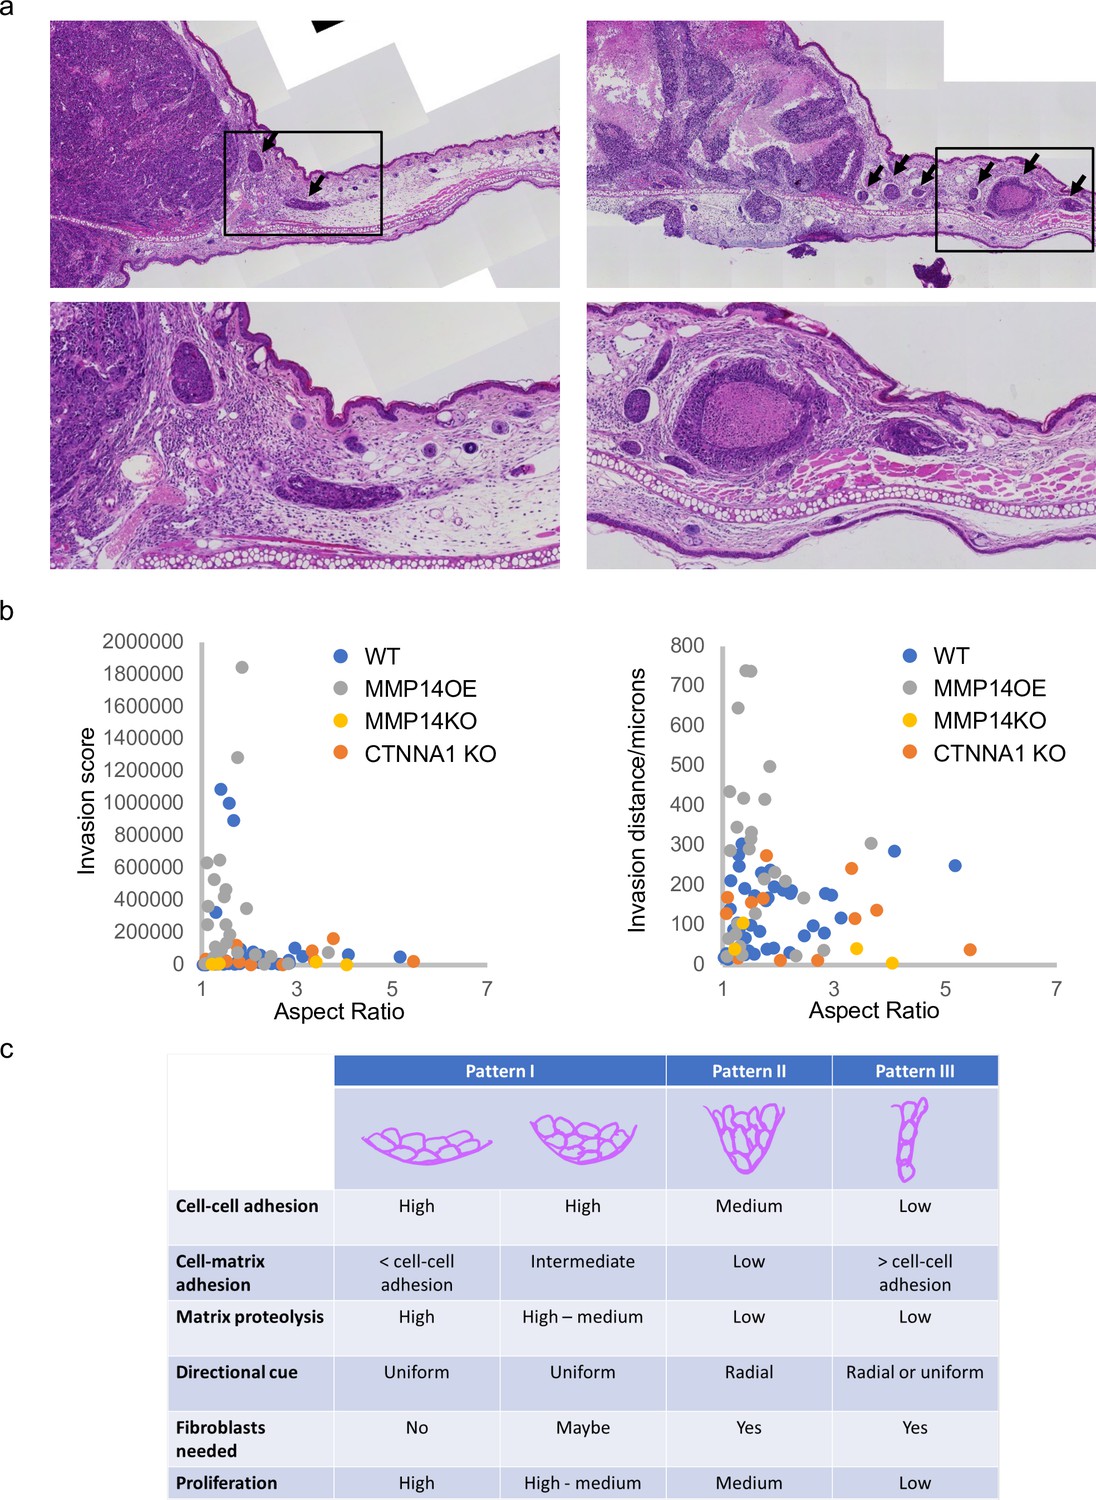
Interplay of adherens junctions and matrix proteolysis determines the invasive pattern and growth.
(a) Images show collective invasion from wild type and MMP14OE A431 tumours grown in the ear. Black arrows indicate invading cell clusters. (b) Left plot shows the ‘invasion score’ (product of the distance of the cluster and cluster area) vs the aspect ratio of the cluster, and right plot shows the invasion distance vs the aspect ratio. Each dot represents one invading cluster. (c) Table relating patterns of collective invasion to cancer cell properties and the presence or absence of fibroblasts.
-
Figure 9—figure supplement 1—source data 1
Tumour invasion metrics.
- https://cdn.elifesciences.org/articles/76520/elife-76520-fig9-figsupp1-data1-v1.xlsx
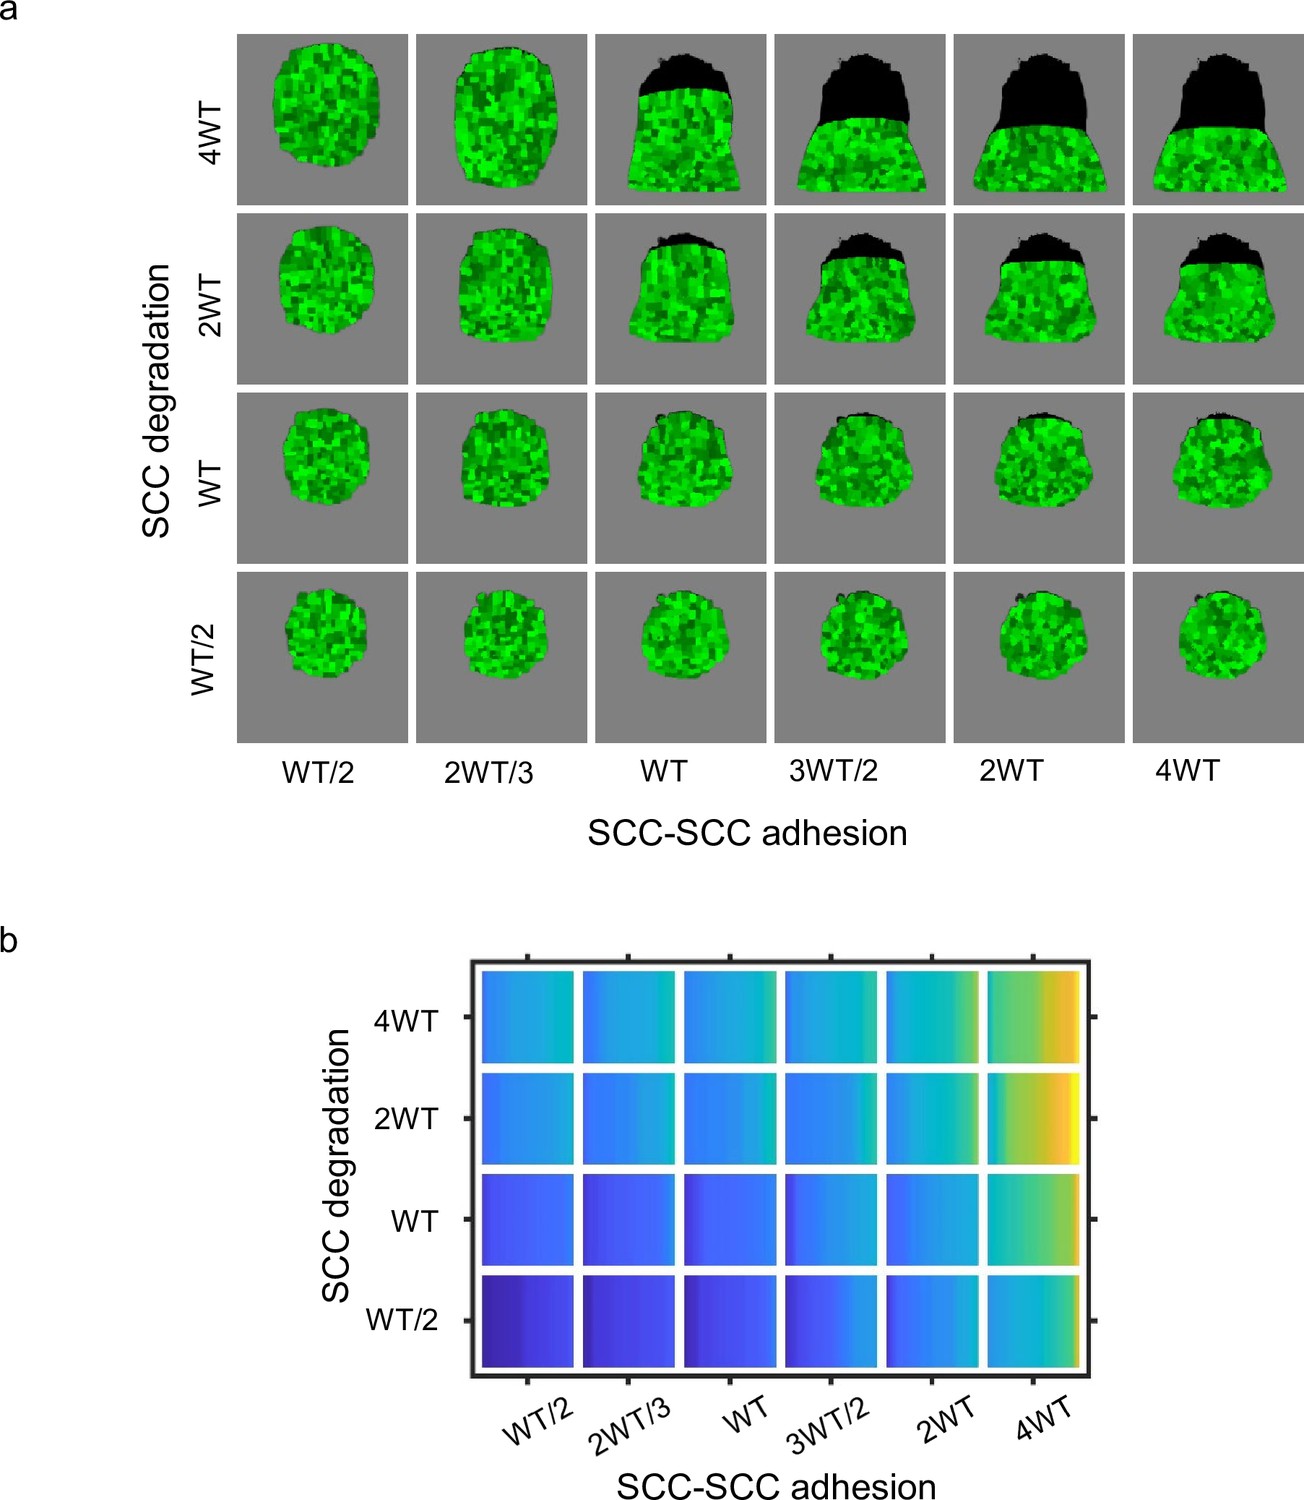
Author response image 1
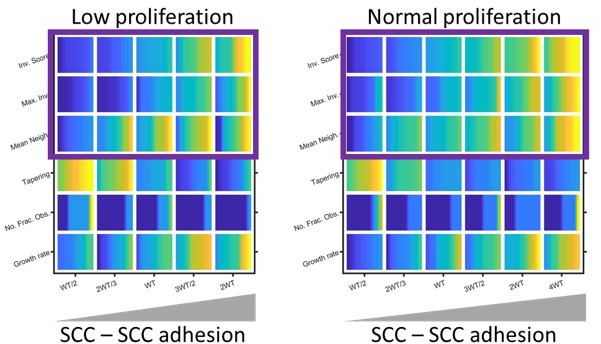
Modelling the effect of low proliferation on invasion.
Plots show the effect of reducing invasion and growth metrics (as determined by modelling) in organotypic conditions. Yellow indicates a high value and blue a low value. Note: the colour map has been normalised relative to the minimum and maximum values in each set of simulations to highlight the effect of varying SCC-SCC adhesion. Purple boxes highlight the similar relationship positive relationship between SCC – SCC adhesion and invasion regardless of proliferation rate.
Author response image 2
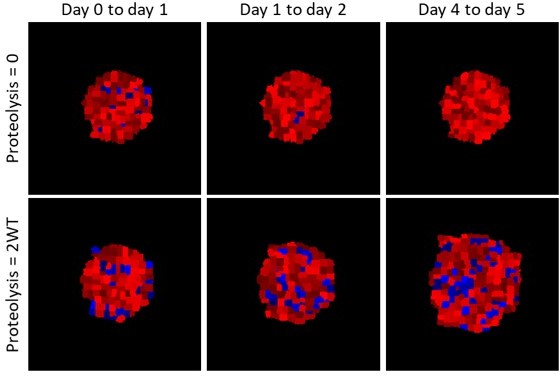
Modelling the location of proliferated cells.
Images show the location of cells that have proliferated in the timeframes indicated in blue (analogues to EdU labelling), red shows cells that have not proliferated. Upper panels show a spheroid with no ECM proteolysis, lower panels show a spheroid with high proteolysis.
Author response image 3
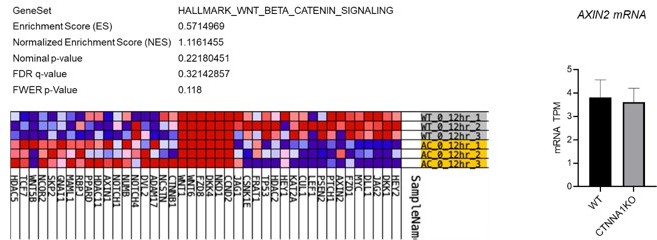
Analysis WNT/β-catenin signalling αCAT KO cells.
Left panels show the lack of significant gene enrichment score for WNT/β-catenin target genes in αCAT KO cells (lower yellow rows) compared to WT (upper grey rows). Right panel shows the levels of a AXIN2 mRNA in WT and αCAT/CTNNA1 KO cells. Data determined by RNA sequencing.
Author response image 4
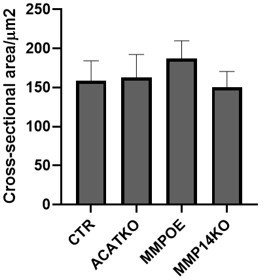
Size of cells in 3D following perturbations.
Plot shows the effect of the indicated manipulations on the cross-sectional area of A431 cells when grown in spheroid conditions mean and 95% confidence interval are plotted.
Author response image 5
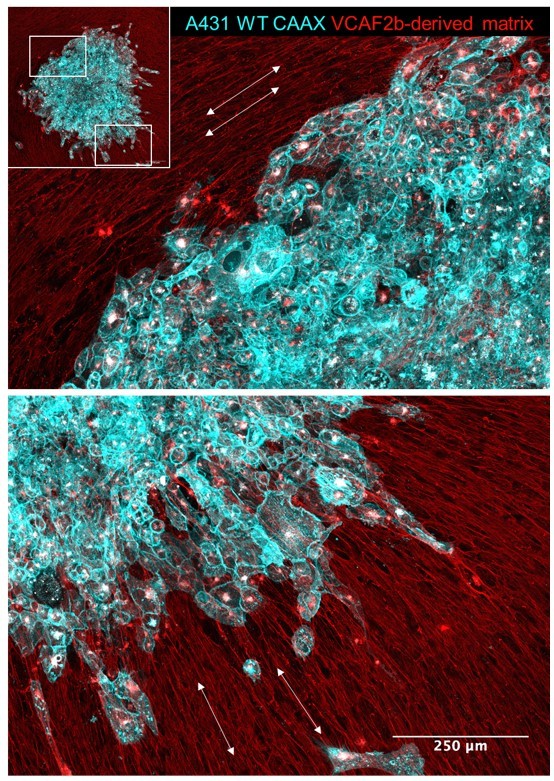
Cancer cell invasion aligns with matrix pattern.
Images shown in the pattern of SCC spheroid (A431 cells in cyan) invasion/migration 96 hours after being placed on top of an aligned fibroblast-derived matrix (red). White arrows indicate the local matrix alignment.
Author response image 6
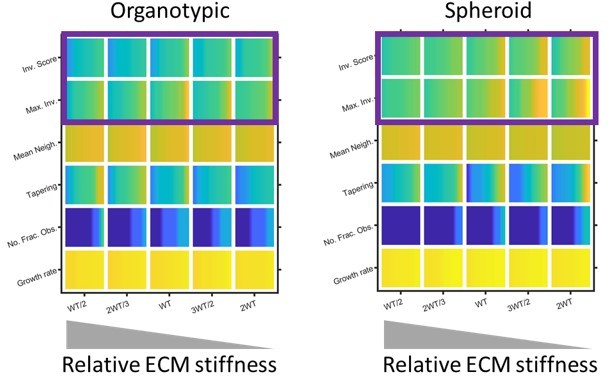
The effect of matrix definition invasion.
Plots show the effect of skewing the amount of force needed to remodel matrix in the model. Note high ‘stiffness’, which is modelled by reducing the ability to remodel the matrix is to the left of the plots. Purple boxes highlight how the distance and overall extent of invasion decreases when the relative matrix stiffness is high.
Author response image 7
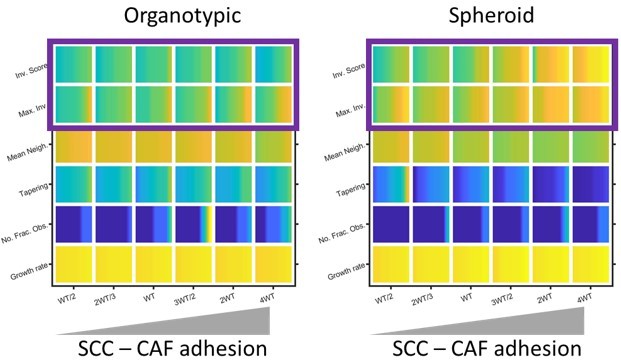
Modelling the effect of Cancer Cell – Fibroblast adhesion on invasion.
Plots show the effect of varying cancer cell – fibroblast adhesion of invasion and growth metrics (as determined by modelling) in both organotypic and spheroid conditions. Yellow indicates a high value and blue a ow value. Purple box highlights the positive relationship between cancer cell – fibroblast adhesion and invasion, expecially in the context of spheroids.
Tables
Table 1
Key CC3D parameter values.
| CC3D parameter | CC3D parameter value | Real world value | Comments |
|---|---|---|---|
| Monte Carlo timestep (MCS) | 1 | 30 s | |
| Voxel | 1 | 2 microns | |
| VCAF target volume | 800 voxels | 6400 microns3 | 6500 microns3 experimental measure |
| VCAF target surface | 700 voxels | 2800 microns2 | 4900 microns2 experimental measure |
| SCC initial target volume | 400 voxels | 3200 microns3 | |
| SCC dividing volume | 800 voxels | 6400 microns3 | |
| Median SCC volume in wild-type conditions | 550 voxels | 4400 microns3 | 4500 microns3 experimental measure |
| SCC surface area | 324 voxels (median) | 1296 microns2 (median) | Sphere assumed for surface area 1700 microns2 experimental measure |
| Mean time to mitosis | 8640 MCS | 3 days | |
| SCC-ECM adhesion | 10 (contact energy) | 45.53 (experimental measure) | Adhesions are normalised to SCC-ECM adhesion. They are inverted and multiplied by 10 to give contact energies |
| SCC-SCC adhesion | 21 (contact energy) | 21.8 | |
| SCC-CAF adhesion | 35 | 25.2 | SCC-CAF adhesion was marginally reduced below experimental measure in model (contact energy would be 18 from experiment) |
| CAF-CAF adhesion | 45 | 9.3 | |
| CAF-ECM adhesion | 15 | 29.6 | |
| SCC-ECM adhesion for zero-density ECM | 40 | 11.4 | |
| CAF-CAF repulsion range | 20 voxels | 40 microns | Approximately 1.5 CAF widths |
| SCC taxis energy | 13 | median speed 0.2 microns/min | 0.2 microns/min experimental measure |
| CAF taxis minimum energy | 3.5 | 0.06 micron/min | |
| CAF taxis maximum energy | 21 | 0.29 microns/min | |
| CAF median speed | 10 | 0.1 microns/min | 0.1 microns/min experimental measure |
| CAF taxis stimulation range | 30 voxels | Approximately 2.5 CAF widths | |
| CAF ECM pushing rate | 0.0140 | Corresponds to a reduced CAF speed of 0.07 microns/min through ECM | Speed due to pushing is three times faster than speed due to degradation |
| CAF ECM degradation rate | 0.0012 | Corresponds to a reduced CAF speed of 0.018 microns/min through ECM | Degradation and pushing effects on speed are sub-linear. The effective median speed is between 0.07 and 0.088 microns/min |
| SCC pushing rate | 0 | ||
| SCC degradation rate | 0.0001 | Corresponds to a reduced SCC speed of 0.009 microns/min through ECM | Effect of degradation is half for SCCs compared to CAFs. Effects are normalised to kinesis levels |
-
CAF, cancer-associated fibroblast; ECM, extracellular matrix; SCC, squamous cell carcinoma; VCAF, vulval CAF.
Key resources table
| Reagent type (species) or resource | Designation | Source or reference | Identifiers | Additional information |
|---|---|---|---|---|
| Antibody | Anti-MMP14 (rabbit monoclonal) | Abcam | ab51074 | WB (1:1000) |
| Antibody | Anti-alpha-catenin (rabbit monoclonal) | Abcam | ab51032 | WB (1:1000) |
| Antibody | Anti-vimentin (mouse monoclonal) | Sigma | SAB4200761 | WB (1:1000) |
| Antibody | Anti-fibronectin (rabbit polyclonal) | Sigma | F3648 | WB (1:1000) |
| Antibody | Anti-integrin β1 (mouse monoclonal) | Abcam | ab24693 | WB (1:1000) |
| Antibody | Anti-integrin β3 (rabbit monoclonal) | Abcam | ab179473 | WB (1:1000) IF (1:500) |
| Antibody | Anti-actin (mouse monoclonal) | Sigma | A4700 | WB (1:2000) |
| Antibody | Anti-pS19-MLC (rabbit polyclonal) | Cell Signaling | 3671 | IF (1:100) |
| Antibody | Anti-myosin MHC IIa (rabbit polyclonal) | Covance | PRB-440P | IF (1:100) |
| Antibody | Anti-β-catenin (mouse monoclonal) | Santa Cruz | sc7963 | IF (1:100) |
| Antibody | Anti-integrin β1 (mouse monoclonal) | Santa Cruz | sc13590 | IF (1:100) |
| Cell line (Homo-sapiens) | A431 | Cell Service department of Francis Crick Institute | ||
| Cell line (Homo-sapiens) | VCAF2B | Previously established (Gaggioli et al., 2007) | ||
| Transfected construct (Homo-sapiens) | px458 CTNNA1 gRNA | Santa Cruz | sc-419475 | |
| Transfected construct (Homo-sapiens) | px458 MMP14 gRNA | This paper | gctgctttgggccgagccg | Targeting gRNA sequence |
| Sequence-based reagent | siRNA: non-targeting | Dharmacon | siGENOME Non-Targeting Control siRNAD-001210-01-05 | Silencer Select Used at 20 nM |
| Sequence-based reagent | siRNA: targeting ITGB3 | Dharmacon | siGENOME SMARTpool M-004124-02-0010 | Silencer Select Used at 20 nM |
| Transfected construct (Homo-sapiens) | pMMP14-mCherry | Generous gift from Dr. Machesky at CRUK Beatson Institute | ||
| Transfected construct (Homo-sapiens) | pCSII-mCherry-CAAX | Previously generated | Lentiviral construct to transfect and express membrane targeting mCherry | |
| Transfected construct (Homo-sapiens) | pCSII-ECFP-CAAX | Previously generated | Lentiviral construct to transfect and express membrane targeting ECFP | |
| Transfected construct (Homo-sapiens) | pCSII-KEIMA-CAAX | Previously generated | Lentiviral construct to transfect and express membrane targeting KEIMA | |
| Chemical compound, drug | Collagen I | BD Biosciences | 354236 | |
| Chemical compound, drug | Matrigel | BD Biosciences | 354234 | |
| Chemical compound, drug | DQ collagen, type I from bovine skin, fluorescein conjugate | Thermo Fisher Scientific | D12060 | |
| Chemical compound, drug | Y27632 | Tocris Bioscience | 1254 | |
| Chemical compound, drug | 4-Hydroxytamoxifen (4OHT) | Sigma | H7904 | |
| Commercial assay or kit | Edu Cell Proliferation kit for imaging, Alexa Fluor 488 dye | Fisher Scientific | C10337 |
Additional files
-
Supplementary file 1
Appendices.
Appendix 1: A walkthrough of developed CC3D plug-ins and steppables. Appendix 2: Additional CC3D parameter values. Appendix 3: PCA loadings and variance explained.
- https://cdn.elifesciences.org/articles/76520/elife-76520-supp1-v1.pdf
-
Transparent reporting form
- https://cdn.elifesciences.org/articles/76520/elife-76520-transrepform1-v1.docx
Download links
A two-part list of links to download the article, or parts of the article, in various formats.
Downloads (link to download the article as PDF)
Open citations (links to open the citations from this article in various online reference manager services)
Cite this article (links to download the citations from this article in formats compatible with various reference manager tools)
Interplay of adherens junctions and matrix proteolysis determines the invasive pattern and growth of squamous cell carcinoma
eLife 12:e76520.
https://doi.org/10.7554/eLife.76520


