SNTA1 gene rescues ion channel function and is antiarrhythmic in cardiomyocytes derived from induced pluripotent stem cells from muscular dystrophy patients
- Department of Internal Medicine and Molecular and Integrative Physiology, Center for Arrhythmia Research, University of Michigan, United States
- Leviev Heart Center, Sheba Medical Center, Tel Hashomer, and Tel Aviv University, Israel
- Centro Nacional de Investigaciones Cardiovasculares (CNIC) Carlos III, Centro de Investigación Biomédica en Red de Enfermedades Cardiovasculares (CIBERCV), Spain
- Department of Molecular and Integrative Physiology, University of Michigan Medical School, United States
- Department of Physiology, Biophysics and Systems Biology, Ruth and Bruce Rappaport Faculty of Medicine, Technion - Israel Institute of Technology, Israel
Figures
Figure 1
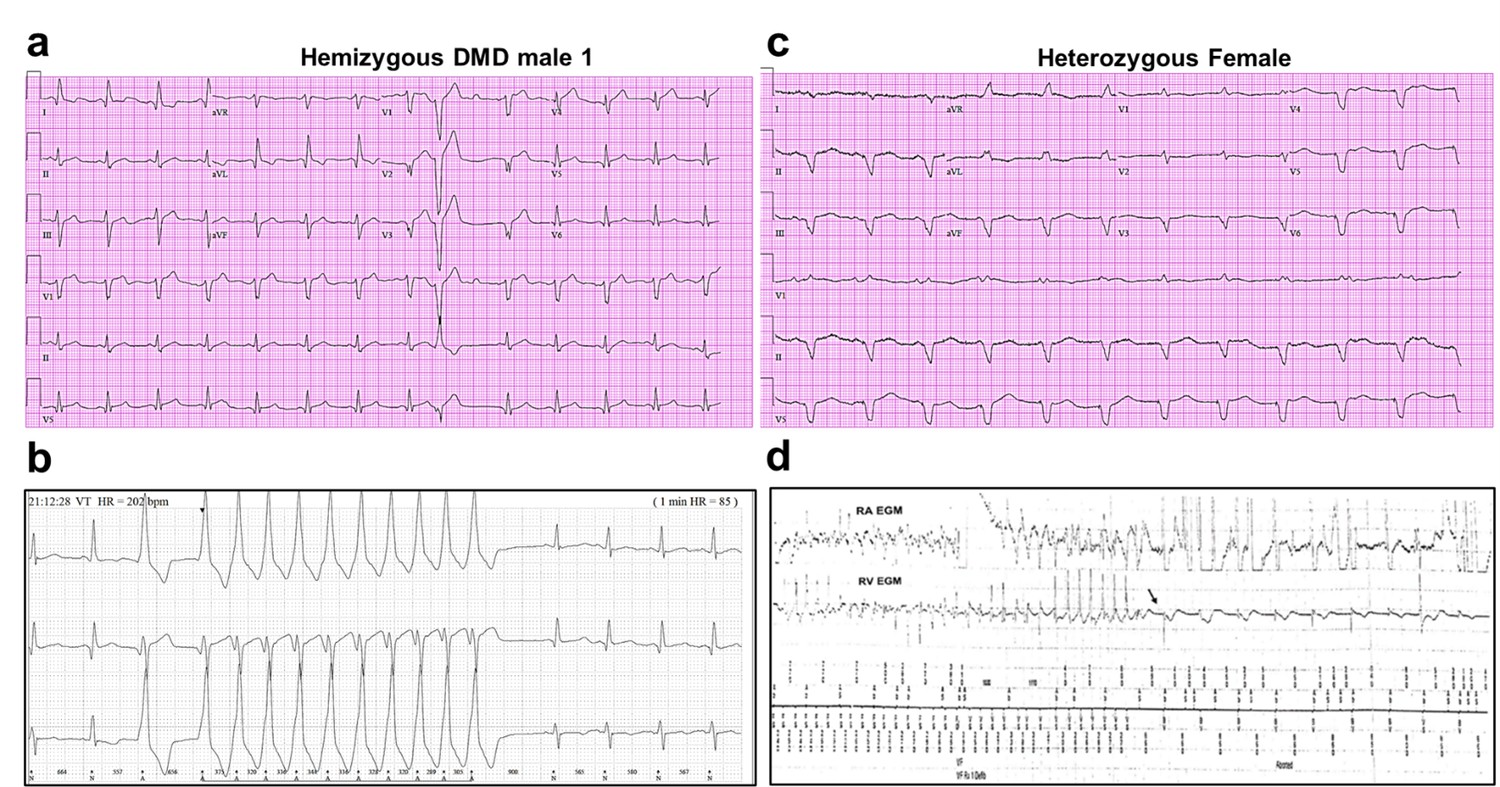
Altered ECG and arrhythmias in Duchenne Muscular Dystrophy (DMD) patients with cardiomyopathy.
(a) Abnormal ECG in a 34-year-old DMD male: PR interval, 116 ms; QRS, 120 ms; QT/QTc, 404/472 ms; and PRT axes, 18-16-90. (b) Holter recording from the same patient shows nonsustained monomorphic ventricular tachycardia. (c) Abnormal ECG from the heterozygous female at 50 years of age: left axis deviation; QRS, 178 ms; QT/QTc, 564/612 ms; and PRT axes, 55-263-85. (d) Holter atrial electrograms of the heterozygous female shows atrial fibrillation with complete AV block after AV nodal ablation. Ventricular electrogram shows polymorphic ventricular tachycardia with spontaneous termination (arrow) and resumption of ventricular pacing.
Figure 2
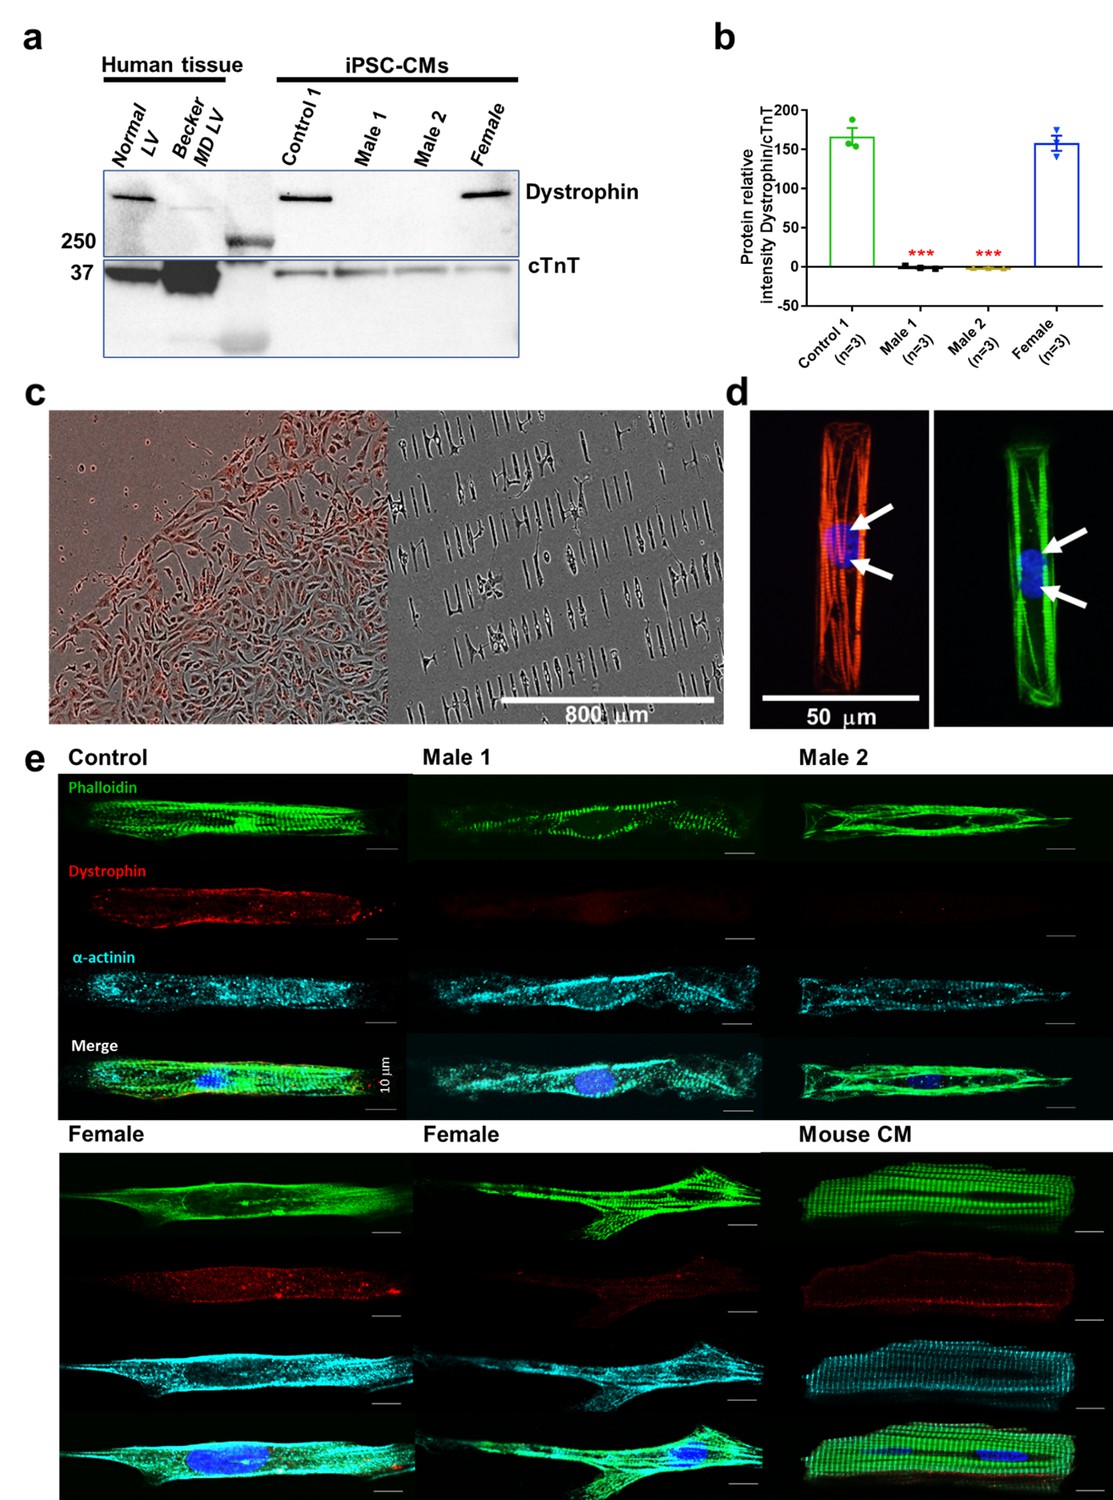
Duchenne Muscular Dystrophy (DMD) patient-specific iPSC-CMs do not express dystrophin.
(a) Top right, control and heterozygous female iPSC-CMs express dystrophin. iPSC-CMs from hemizygous dystrophic cell lines (Males 1 and 2) did not express the large dystrophin isoform. Top left, control tissue lysates from a normal individual and a patient with Becker MD. Dystrophic left ventricular tissue did express dystrophin, but to a lesser extent than normal left ventricle tissue. These tissues were generously provided by the Hypertrophic Cardiomyopathy Clinic, University of Michigan. (b) Quantitation of dystrophin in control and heterozygous female iPSC-CMs. Dystrophin was absent in DMD iPSC-CMs (p = 0.0001) compared to control iPSC-CMs. Heterozygous female cells exhibited nearly normal dystrophin expression (p = 0.5864). Protein concentration confirmed by western blot against troponin T. Two-tailed Mann–Whitney test. Errors bars, standard error of the mean (SEM). The n values are in parentheses. (c–e) iPSC-CMs plated onto Matrigel-coated micropatterned PDMS. (c) Male 1 iPSC-CMs plated as a monolayer on a Matrigel-coated PDMS (left) for 1 week, and then dissociated for replating onto micropatterned PDMS (right). (d) Control iPSC-CMs fixed and stained on micropatterns. Immunostaining for cardiac troponin I (red) and F-actin (green). Nuclei were stained with DAPI (white arrows). Scale bar, 50 µm. (e) Immunostaining for dystrophin in iPSC-CMs from control, dystrophic Males 1 and 2, female, and mature mouse cardiomyocytes. DMD cells did not express dystrophin compared to control. Heterozygous female iPSC-CMs showed variable expression of dystrophin. Scale bar, 10 µm.
-
Figure 2—source data 1
Full unedited gel.
- https://cdn.elifesciences.org/articles/76576/elife-76576-fig2-data1-v1.zip
Figure 3 with 2 supplements
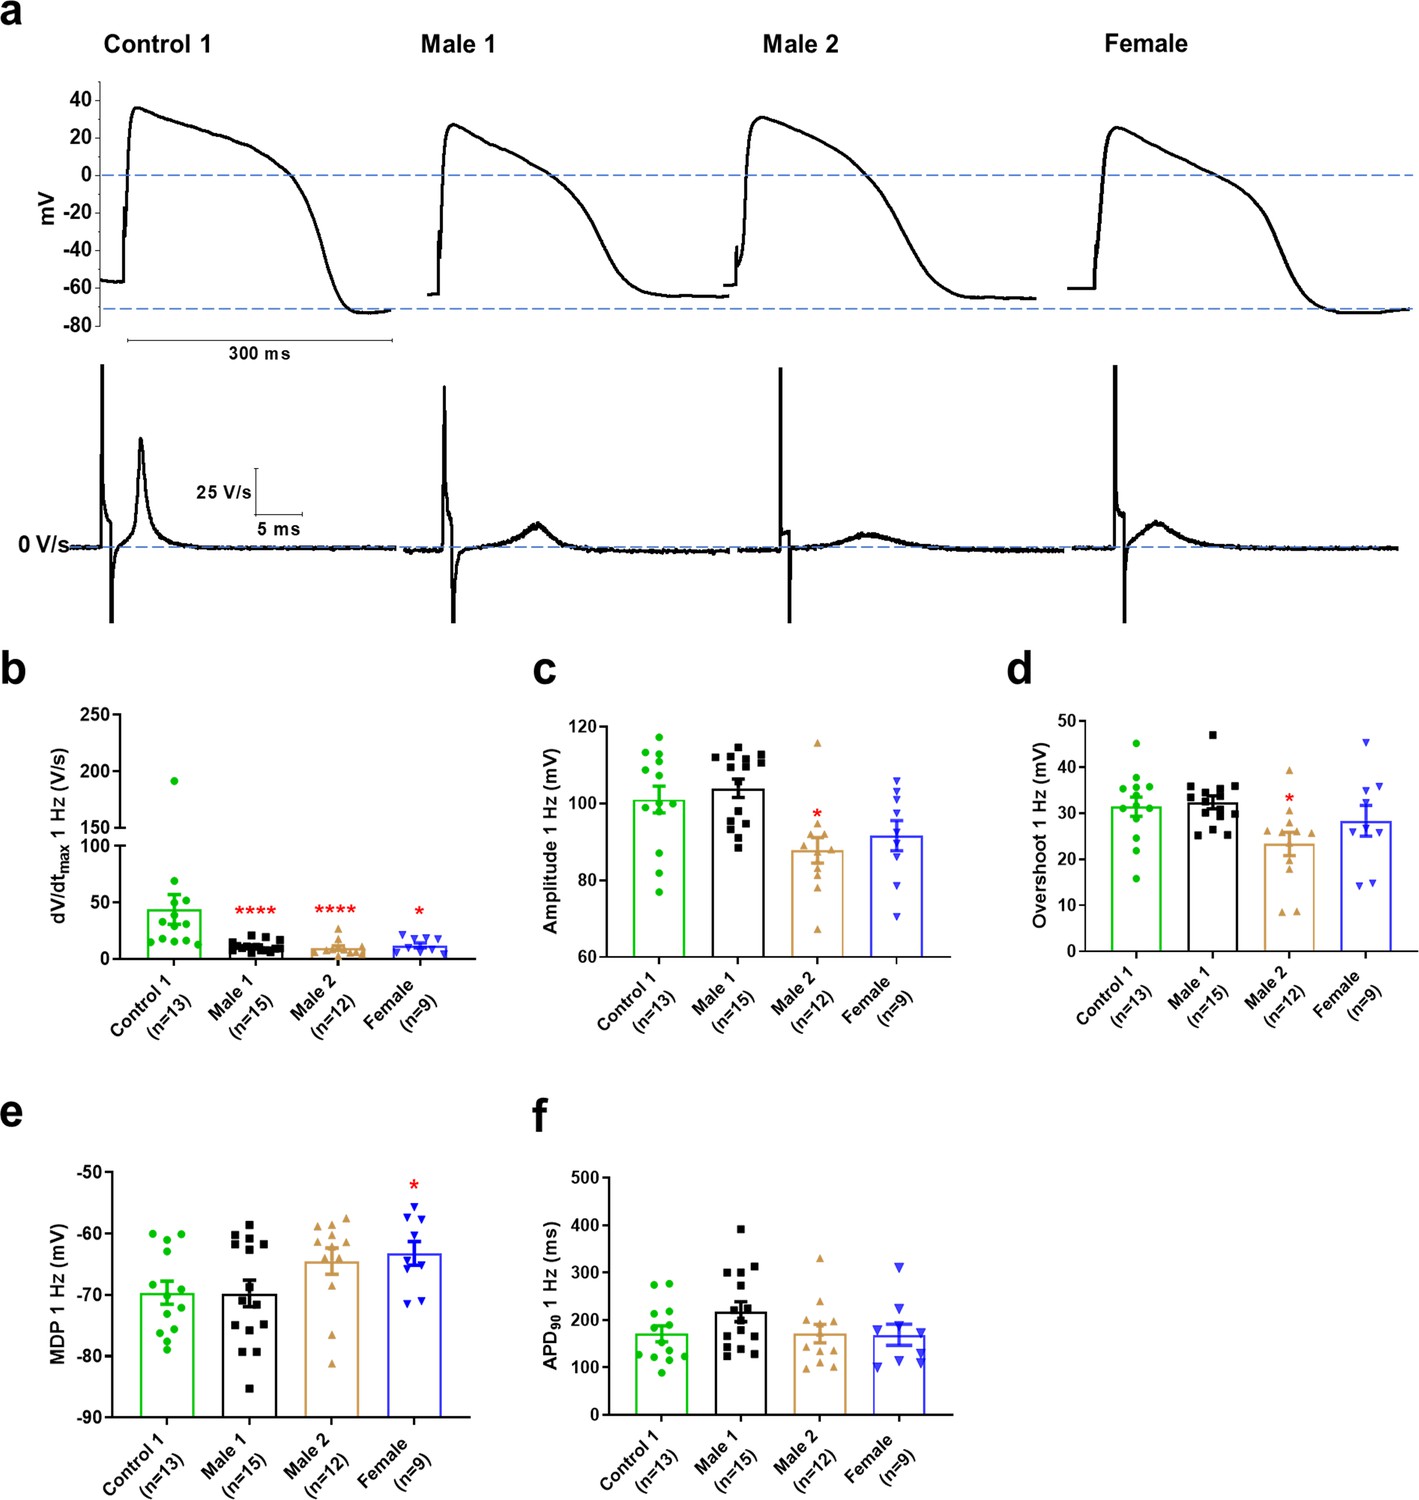
Action potential properties in control, Duchenne Muscular Dystrophy (DMD), and female iPSC-CMs.
(a) Representative action potentials of ventricular-like iPSC-cardiomyocytes from Control 1, heterozygous female, and DMD individuals. The respective dV/dt trace is shown below each action potential. (b) Mann–Whitney test revealed that dV/dtmax was reduced in both DMD compared to Control 1. dV/dtmax was also significantly reduced in the female cells. (c–e) Overshoot and amplitude were only affected in the Male 2 iPSC-CMs, while heterozygous female cells were significantly more depolarized compared to control. (f) APD90 was similar in all iPSC-CMs tested. Cells plated on micropatterns were paced at 1 Hz. Errors bars, standard error of the mean (SEM). The n values are in parentheses. Two-tailed Mann–Whitney test. ****p = 0.0001 and *p <0.05.
-
Figure 3—source data 1
Action potential parameters.
- https://cdn.elifesciences.org/articles/76576/elife-76576-fig3-data1-v1.zip
Figure 3—figure supplement 1
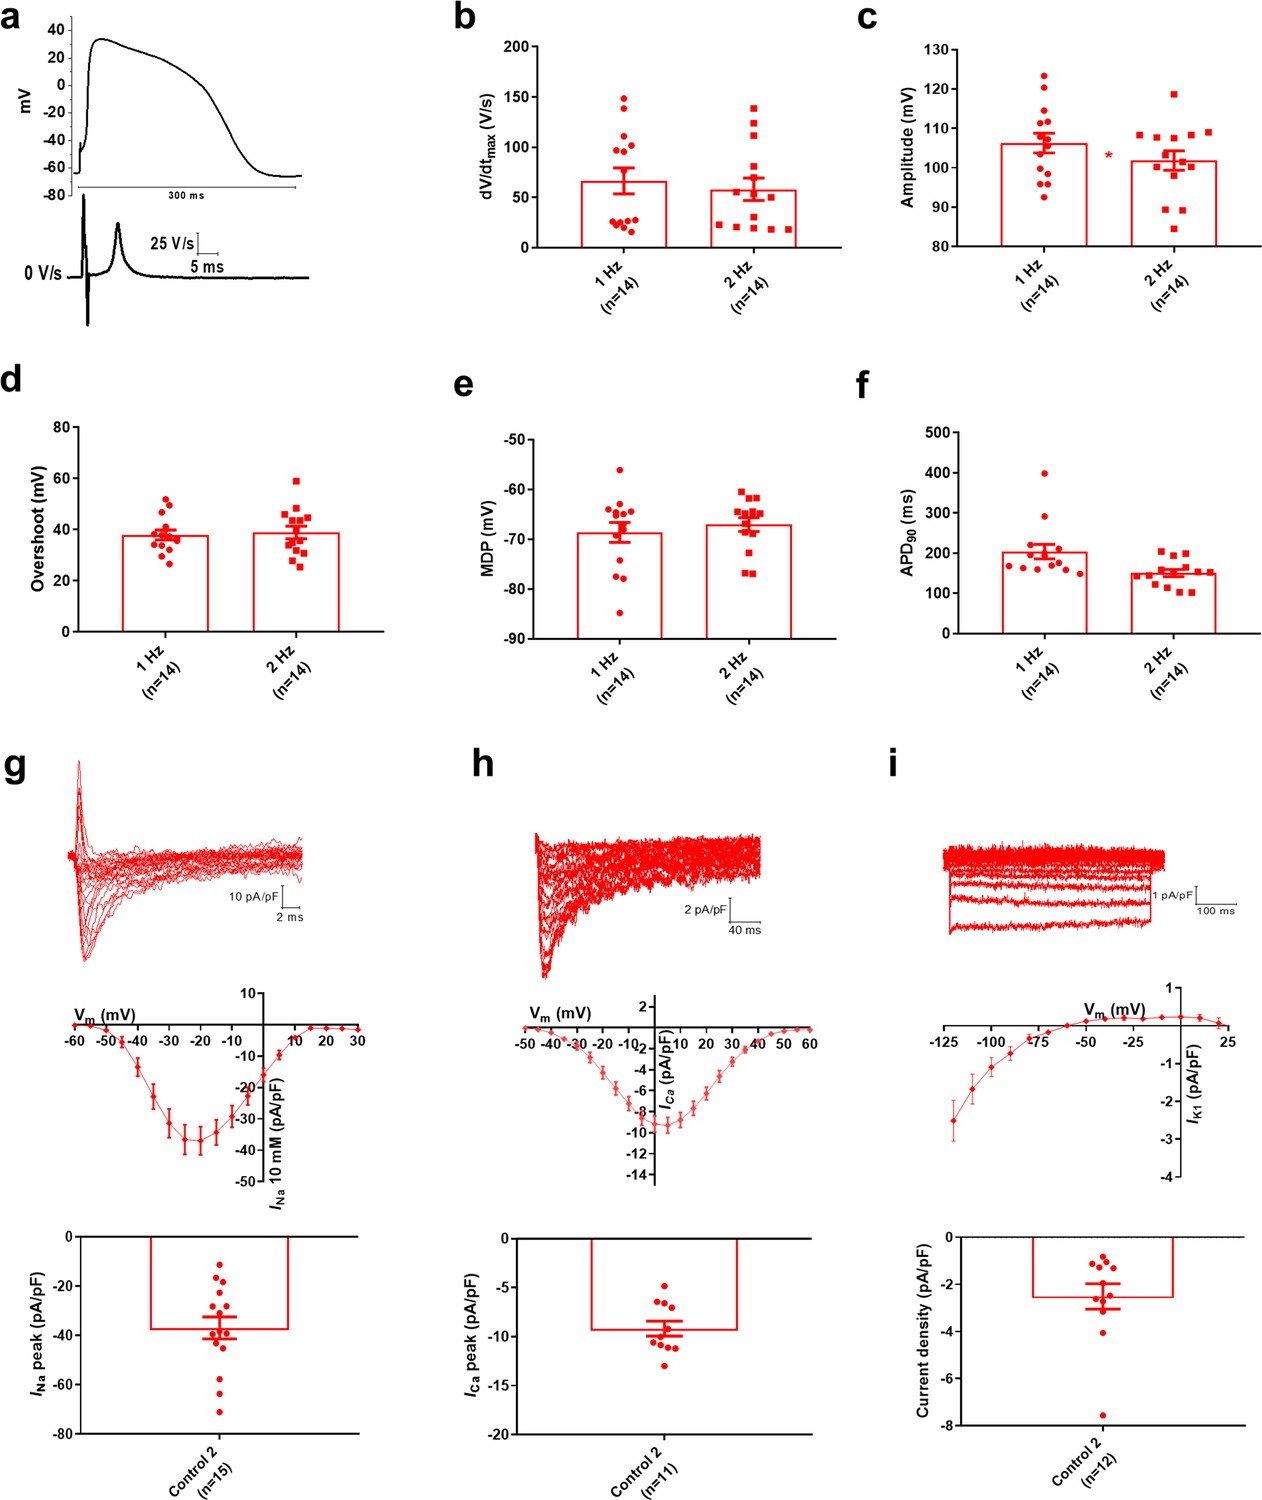
Electrophysiological analysis in Control 2 (human foreskin-derived BJ iPSC-CMs).
(a) Representative AP trace of ventricular-like control BJ iPSC-CMs obtained at 1 Hz of pacing. Inset. First derivative with respect to time (dV/dt). (b–f) Action potential properties. Recordings at 1 and 2 Hz were similar to those obtained from the healthy donor patient derived-iPSC-CMs (Control 1). (g–i) Current traces, I/V curves, and normalized current densities for NaV1.5, CaV1.2, and Kir2.1 ion channels, respectively. Data obtained from the control BJ iPSC-CMs (Control 2) were similar to the other control iPSC-CMs (Control 1).
Figure 3—figure supplement 2

Action potential properties of control, hemizygous, and heterozygous Duchenne Muscular Dystrophy (DMD) iPSC-CMs paced at 2 Hz.
(a) Maximal AP upstroke velocity was reduced in both hemizygous (****p < 0.0001), and the heterozygous female (***p = 0.0002) iPSC-CMs compared to control. (b–d) Overshoot values were similar among all tested groups (p = 0.2413 for Male 1 cells, p = 0.1121 for Male 2 cells, and p = 0.4115 for female cells). Amplitude and MDP were reduced significantly in the Male 2 iPSC-CMs (*p = 0.0109 and *p = 0.0267, respectively) compared to control, while the heterozygous iPSC-CMs showed a more depolarized MDP (**p = 0.0081). (e) APD90 was similar in all tested iPSC-CMs (p = 0.3699, p = 0.5196, and p = 0.8366 for Male 1, Male 2, and heterozygous iPSC-CMs, respectively). Cells plated on micropatterns were paced at 2 Hz. Two-tailed Mann–Whitney test. Errors bars represent standard error of the mean (SEM). The n values are in parentheses.
Figure 4 with 2 supplements
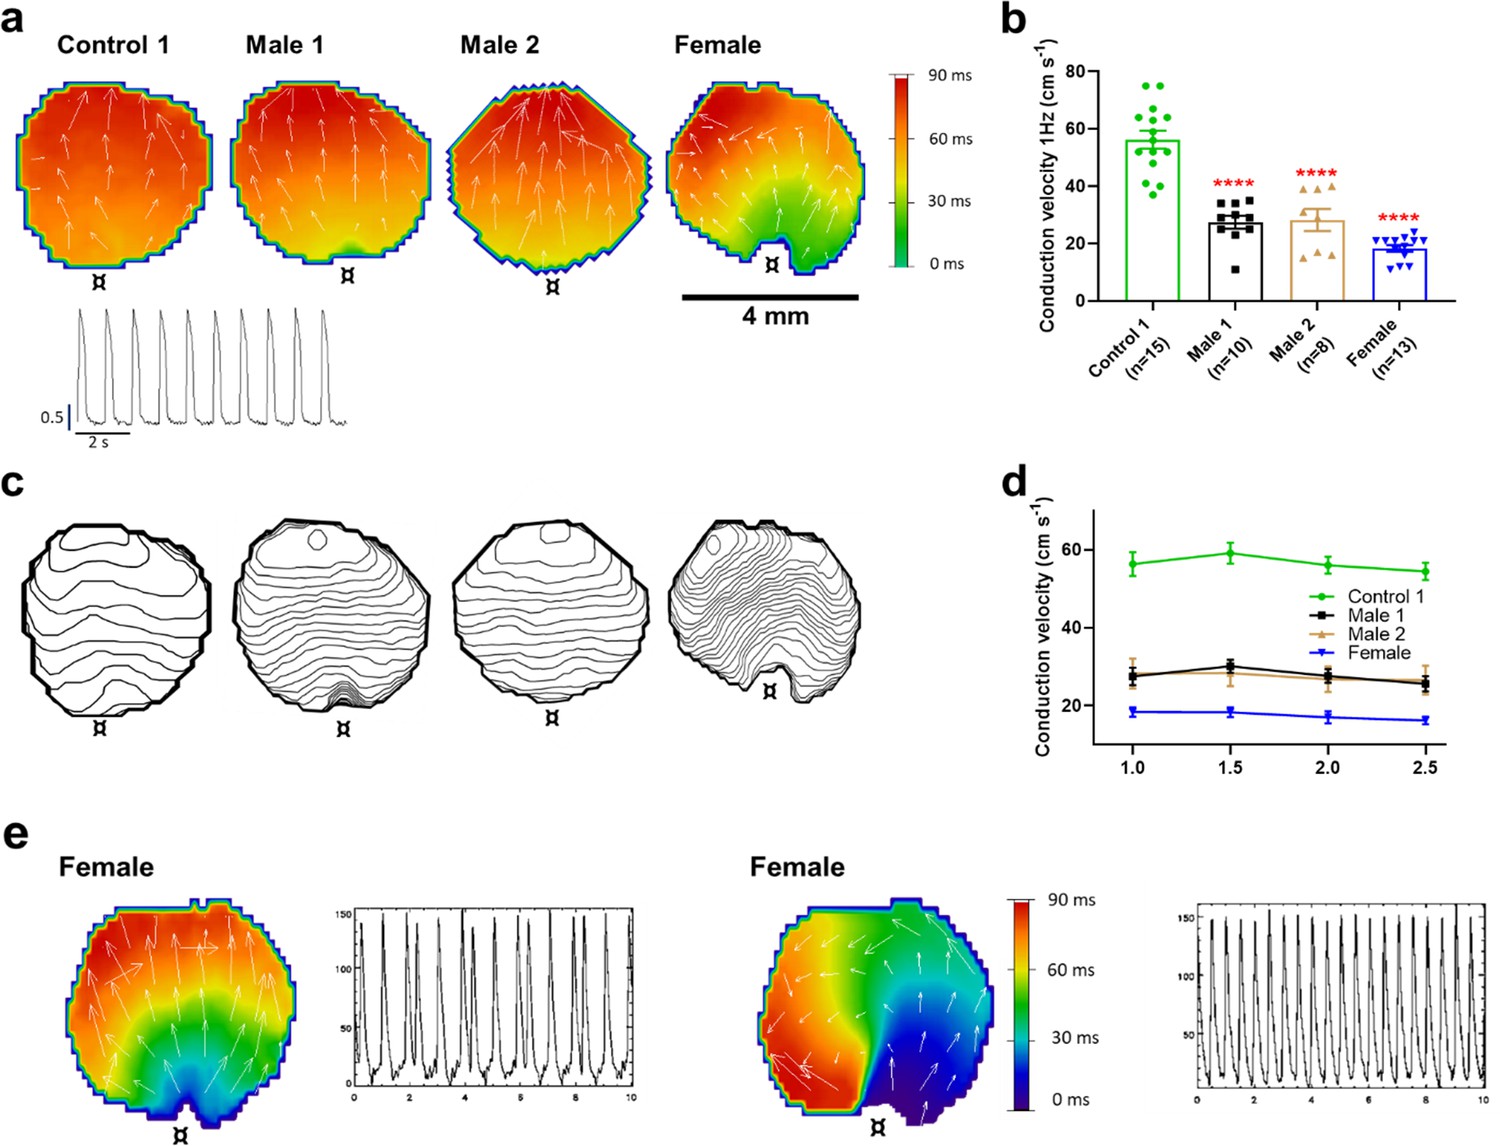
Conduction velocity (CV) is slower in iPSC-CM monolayers from Duchenne Muscular Dystrophy (DMD) hemizygous male and heterozygous female than control.
(a) Activation maps of action potential propagation at 1 Hz. Each color represents a different activation time with time zero appearing in green (¤ indicates the location of the stimuli for each monolayer). White vectors (↑) are a measure of local velocity and direction of the wave. Inset. Representative optical action potentials (APs) at 1 Hz. (b) Bar graphs of CV in each monolayer group, as indicated. Numbers in parenthesis are number of monolayers per group. (c) Averaged 2-ms contour isochrone maps for each representative monolayer above. Tighter averaged isochrone contours in the hemizygous and heterozygous iPSC-CM monolayers indicate slowed and more heterogeneous CV compared to control. (d) CV restitution tended to slow in all groups as pacing frequency increased. (e) Arrhythmias in heterozygous female iPSC-CMs monolayers. Left map, spontaneous pacemaker activity; Left inset, single pixel recording reveals premature ectopic discharges in a pattern of trigeminy; right map, high-frequency reentrant tachycardia maintained by a self-sustaining rotor; right inset, single pixel recording shows the interbeat interval (500 ms) of the reentrant tachycardia. Errors bars represent standard error of the mean (SEM). The n values are in parentheses. Two-tailed Mann–Whitney test. ****p < 0.0001.
Figure 4—figure supplement 1

Conduction velocity in control BJ iPSC-CM (Control 2) monolayer.
(a) Activation maps of action potential propagation at 1 Hz. Each color represents a different activation time with time zero appearing in green (¤ indicates the location of the stimuli for each monolayer). White vectors (↑) are a measure of local velocity and direction of the wave. Inset. Representative optical action potentials (APs) evoked by external stimulation at 1 Hz. (b) Averaged 2-s contour isochrone maps for the representative monolayer in A. (c) Bar graph of conduction velocity in the additional control BJ monolayers. Errors bars represent standard error of the mean (SEM). The n values are in parentheses.
Figure 4—figure supplement 2

Cx43 expression level in control, hemizygous, and heterozygous Duchenne Muscular Dystrophy (DMD) iPSC-CMs.
(a) Typical western blot for connexin43 expression. About 50 k cells were collected to quantify total dystrophin, connexin43, and actinin levels in iPSC-CMs. (b) Scatter plots of Cx43 detected in control, hemizygous, and heterozygous DMD iPSC-CMs. Cx43 protein levels normalized to actinin (loading control) were similar in all tested groups (p = 0.8857 for Male 1, p = 0.6857 for Male 2, and p = 0.1143 for female iPSC-CMs). Two-tailed Mann–Whitney test. Errors bars represent standard error of the mean (SEM). The n values are indicated in parentheses after the name of each group.
-
Figure 4—figure supplement 2—source data 1
Full unedited gel showing Dystrophin, Actinin and Cx43 expression levels by WB technique.
- https://cdn.elifesciences.org/articles/76576/elife-76576-fig4-figsupp2-data1-v1.zip
Figure 5 with 4 supplements
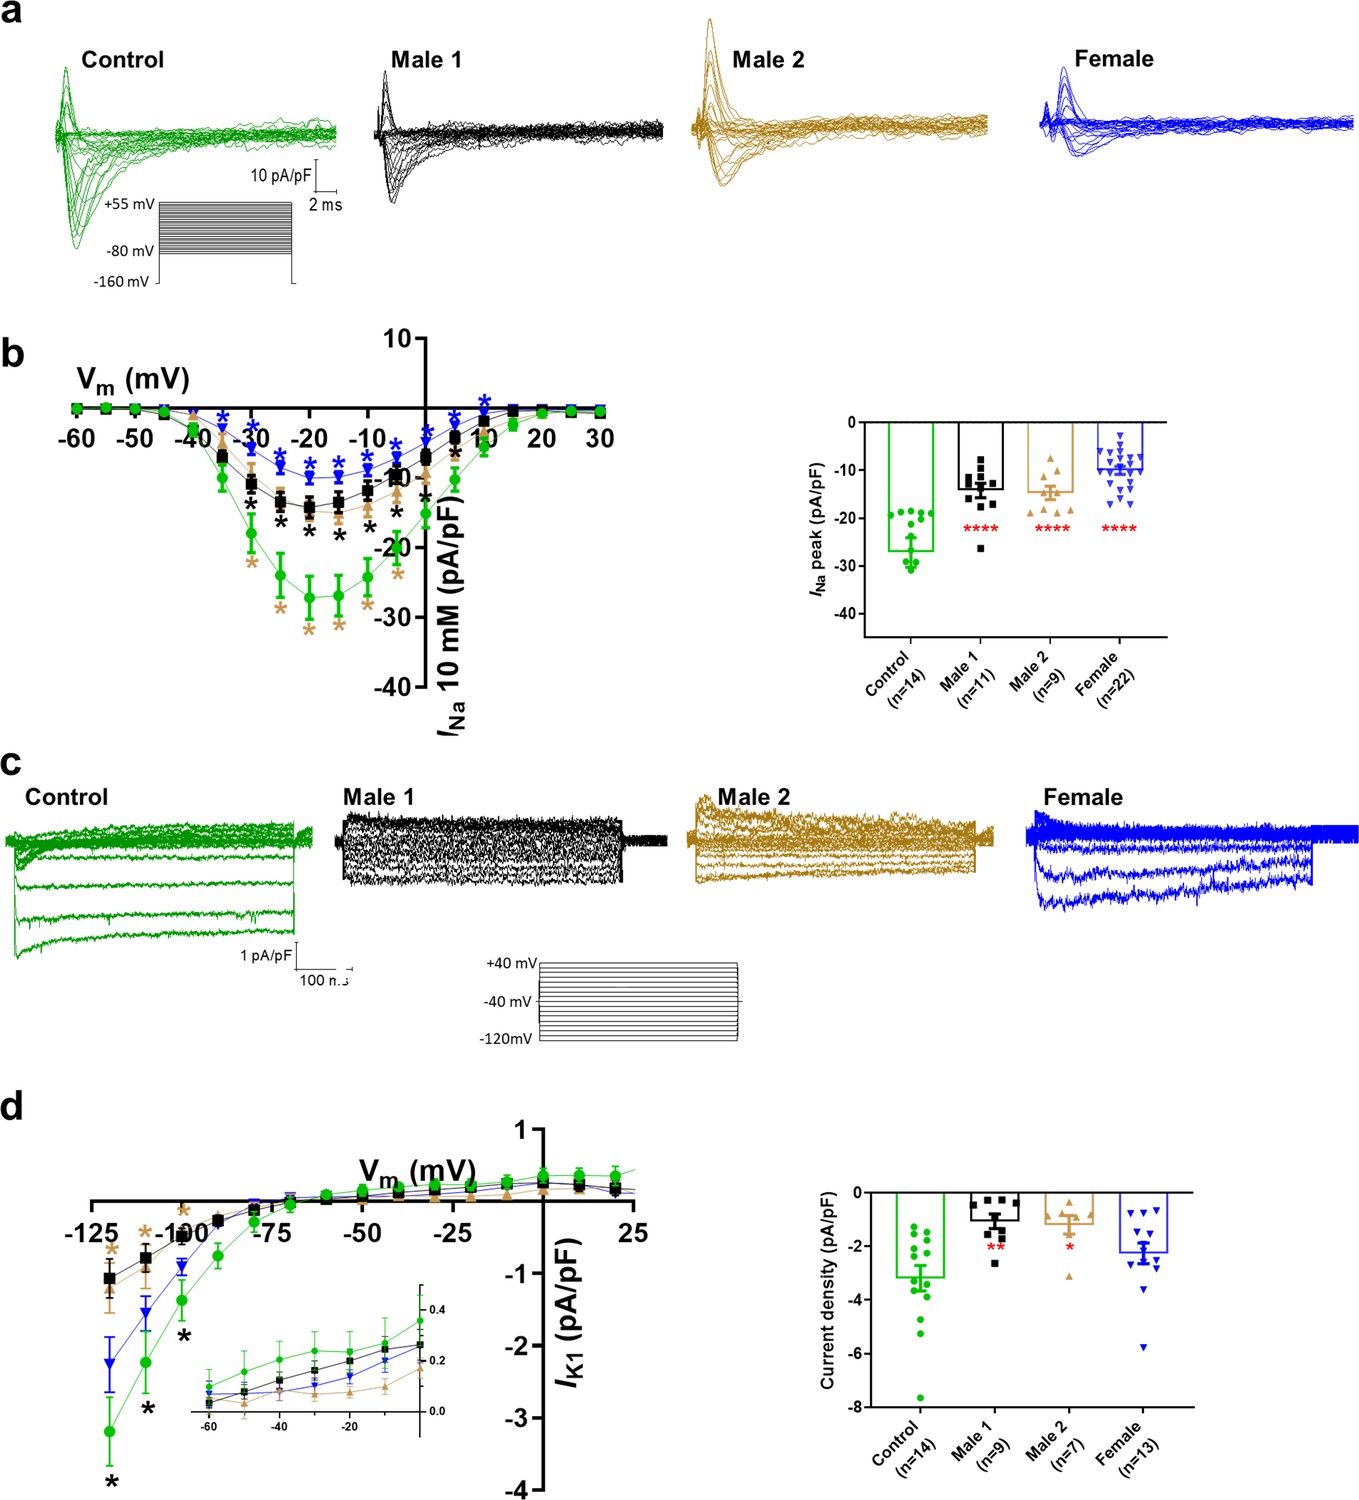
Sodium (INa) and Inward rectifier potassium (IK1) channel properties in control, Duchenne Muscular Dystrophy (DMD), and female iPSC-cardiomyocytes.
(a) Superimposed INa current traces for Control 1, hemizygous, and heterozygous iPSC-CMs elicited by the pulse protocol shown by the inset. (b) Left, normalized current–voltage (I/V) relationships. INa was significantly reduced in both Males 1 and 2 iPSC-CMs compared with control at the specified voltages. Heterozygous female iPSC-CMs showed also a very reduced current density from 35 to 10 mV. Two-way analysis of variance (ANOVA) followed by Sidak’s multiple comparisons test. Right, peak INa density at 20 mV was reduced in all three affected groups compared to control. (c) Typical IK1 density traces from control and DMD cells elicited by the pulse protocol in the inset. (d) Left, I/V relationships. IK1 was significantly reduced in both Males 1 and 2 iPSC-CMs compared with control at the specified voltages. Two-way ANOVA followed by Sidak’s multiple comparisons. Right, normalized current densities at −120 mV. IK1 was decreased in Males 1 and 2 cells compared to control cells. Two-tailed Mann–Whitney test. Errors bars represent standard error of the mean (SEM). The n values are in parentheses. ****p < 0.0001, **p < 0.005, and *p < 0.05 and *p < 0.056.
-
Figure 5—source data 1
Voltage clamp data.
- https://cdn.elifesciences.org/articles/76576/elife-76576-fig5-data1-v1.zip
Figure 5—figure supplement 1

Cell capacitance.
No statistically significant differences were observed among control (32 ± 2 pF), female (39 ± 3 pF; p = 0.0715), and Duchenne Muscular Dystrophy (DMD) iPSC-CMs (38 ± 3 pF, p = 0.3257 for Male 1; and 35 ± 2 pF, p = 0.3703 for Male 2 iPSC-CMs). Two-tailed Mann–Whitney test. Errors bars represent standard error of the mean (SEM). The n values are indicated in parentheses after the name of each group.
Figure 5—figure supplement 2

Calcium channel properties in control, Duchenne Muscular Dystrophy (DMD), and female iPSC-CMs.
(a) Original calcium current traces obtained from all iPSC-CMs elicited by depolarizing potential as shown in the inset. (b) Current–voltage relationships showing no significant differences among all tested groups. Two-way analysis of variance (ANOVA) followed by Sidak’s multiple comparisons. (c) Comparison of normalized current densities from all iPSC-CMs groups. The current values at 0 mV were similar in all analyzed cells (p = 0.5571 for Male 1, p = 0.8421 for Male 2, and p > 0.9999 for female iPSC-CMs). Two-tailed Mann–Whitney test. Errors bars represent standard error of the mean (SEM). The n values are indicated in parentheses after the name of each group.
Figure 5—figure supplement 3
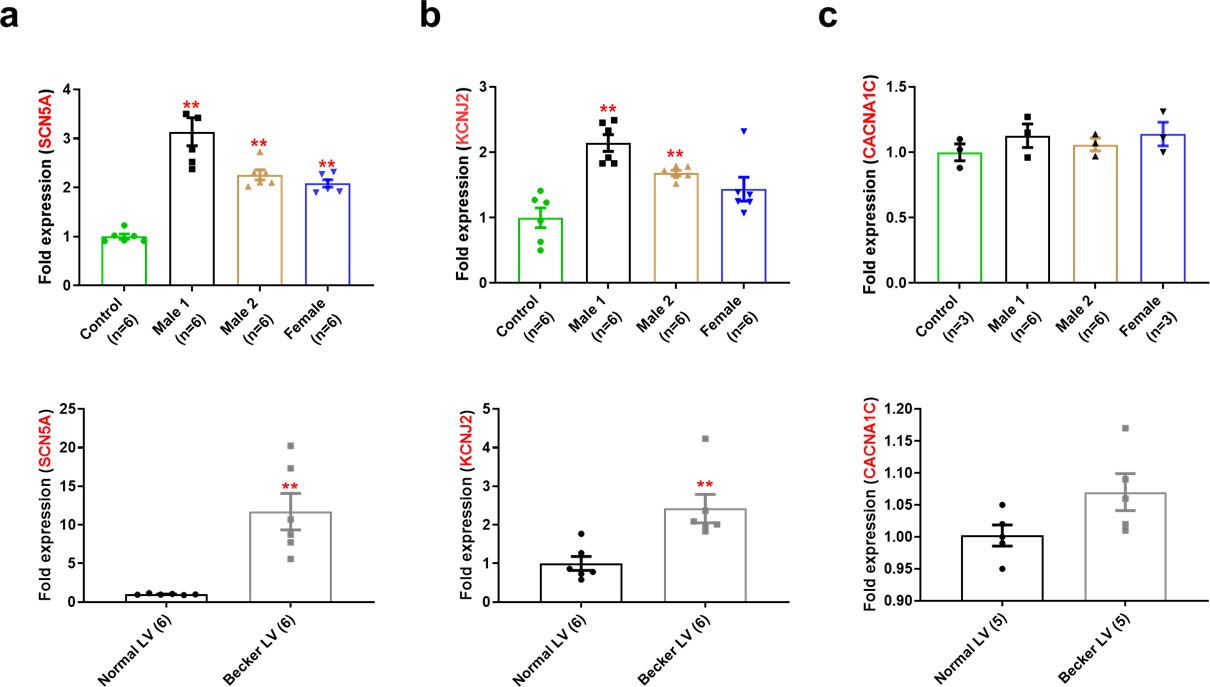
SCN5A, KCNJ2, and CACNA1C mRNA expression in control, Duchenne Muscular Dystrophy (DMD), and female iPSC-CMs.
(a) SCN5A mRNA expression was increased in iPSC-CMs from hemizygous and heterozygous DMD individuals (top), as well as in the human left ventricle heart tissue from a Becker MD individual compared to a healthy subject (bottom). (b) KCNJ2 mRNA levels were higher in both hemizygous and heterozygous iPSC-CMs (top), like those found in human left ventricle heart tissue from Becker DM patients (bottom) when compared to the corresponding control. (c) CACNA1C mRNA expression was not significant different among tested groups from either iPSC-CMs (top) or left ventricle tissues (bottom). mRNA levels were determined by qRT-PCR and calculated by the comparative Ct method (2−ddCt) normalized to the internal control 18S rRNA. Errors bars represent standard error of the mean (SEM). The n values are in parentheses. Two-tailed Mann–Whitney test. **p < 0.005.
Figure 5—figure supplement 4
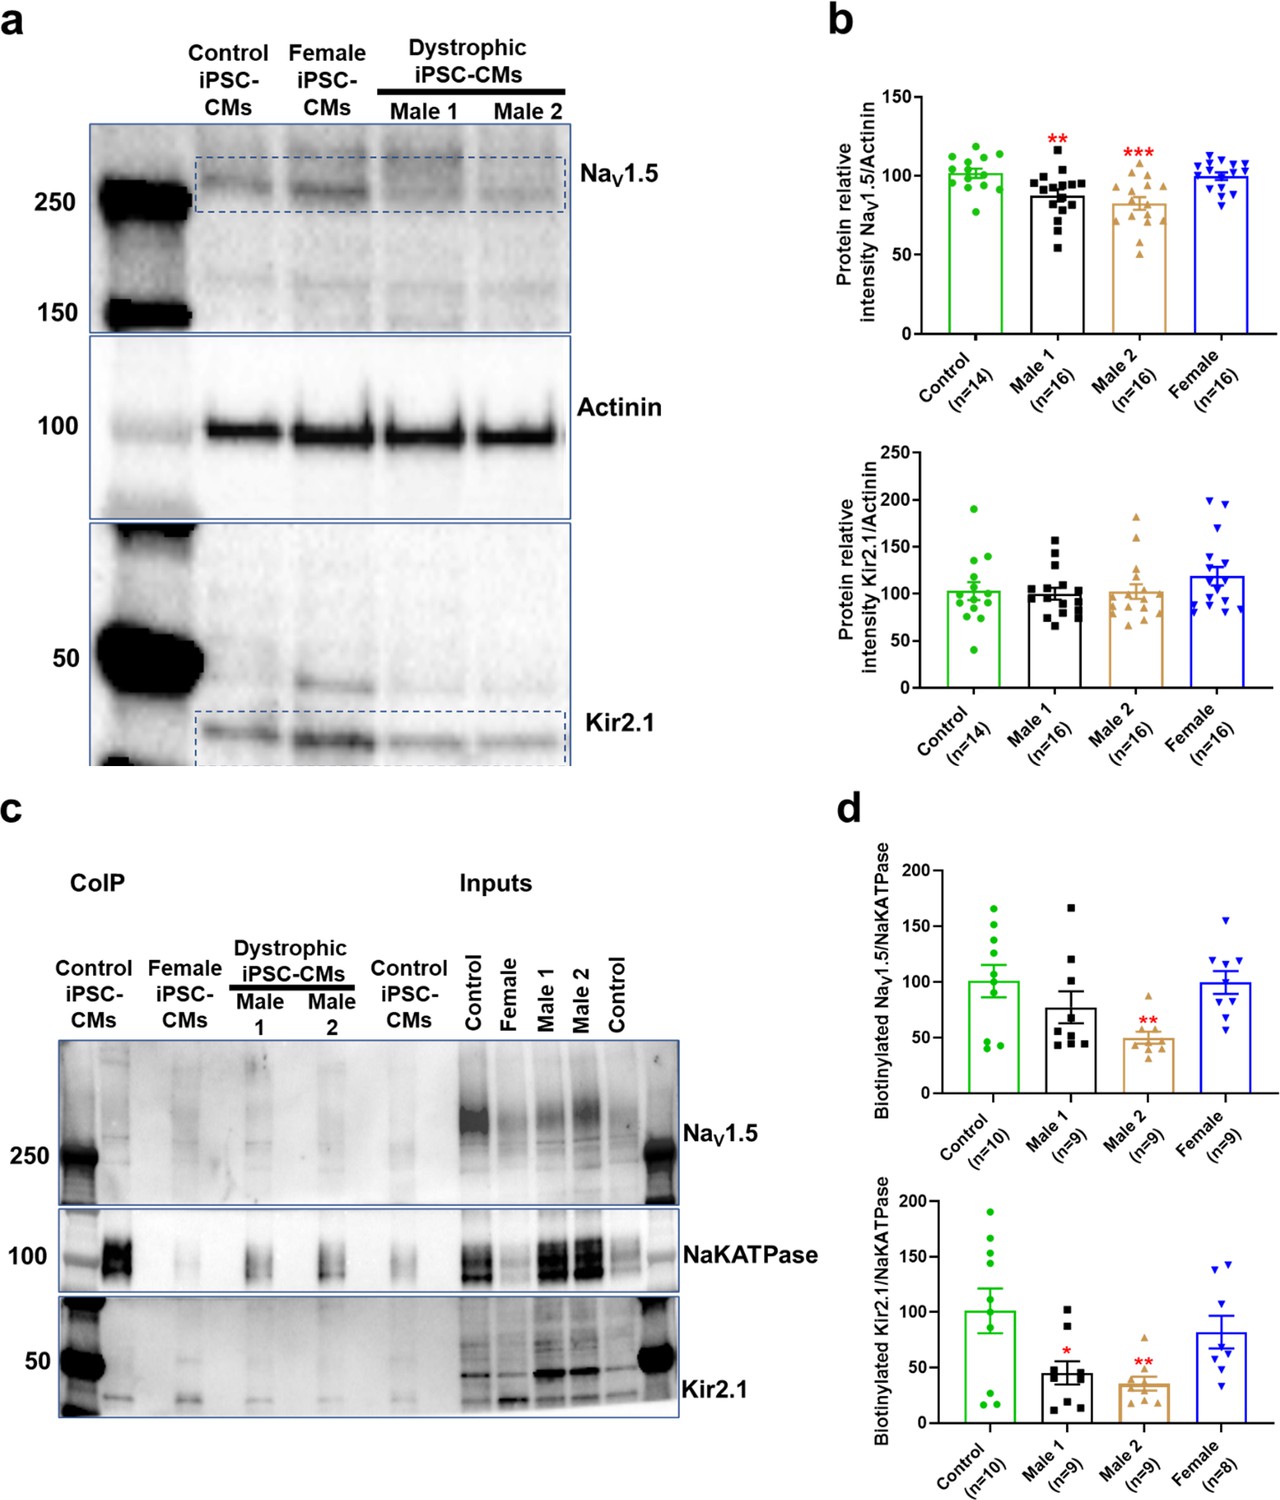
NaV1.5 protein level is significantly reduced in patient-specific Duchenne Muscular Dystrophy (DMD) iPSC-CMs.
(a) Representative western blot for each antibody used. The bands within the blue rectangles at ~250 KDa and below 50 KDa correspond to NaV1.5 and Kir2.1, respectively. About 50 k cells were collected to quantify total NaV1.5, Kir2.1, and actinin levels in control, heterozygous, and hemizygous DMD cells. (b) Scatter plots of NaV1.5 and Kir2.1 detected in control, female, and DMD iPSC-CMs. NaV1.5 and Kir2.1 protein levels were normalized to actinin (loading control). (c) Representative western blot after biotinylation and protein precipitation with streptavidin magnetic beads. (d) Scatter plots of biotinylated NaV1.5 and Kir2.1 from control, female, and DMD iPSC-CMs. Fifty µg of biotinylated protein was loaded. Errors bars represent standard error of the mean (SEM). The n values are in parentheses. Two-tailed Mann–Whitney test. ***p < 0.001, **p < 0.01, and *p < 0.05.
-
Figure 5—figure supplement 4—source data 1
Full unedited gel.
- https://cdn.elifesciences.org/articles/76576/elife-76576-fig5-figsupp4-data1-v1.zip
Figure 6
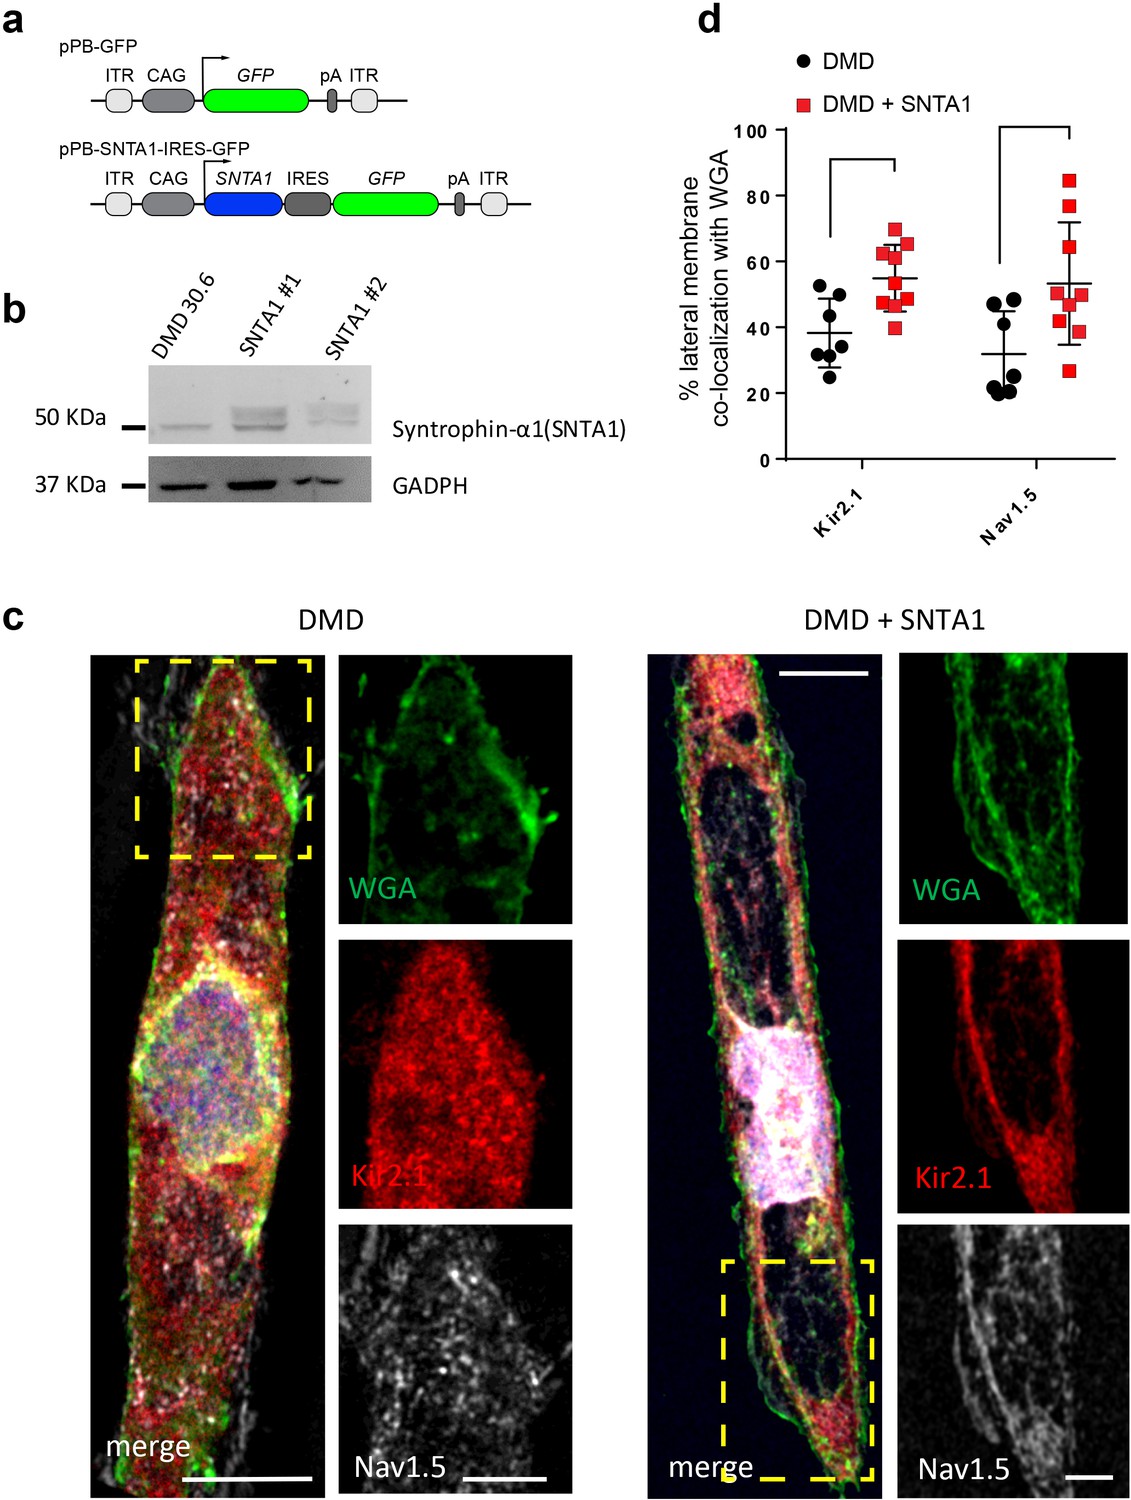
Transfection of SNTA1 rescues membrane levels of Kir2.1 and NaV1.5 proteins in iPSC-CMs from Male 1 patient.
(a) Cartoon illustrating nonviral piggy-bac vector encoding SNTA1 for transfection in Male 1 iPSC-CMs. SNTA1 coding region (CDS) is driven by the CAG promoter and followed by green fluorescence protein (GFP) after an internal ribosome entry site (IRES). Control vector only expresses GFP. (b) Western blot for α1-syntrophin expression normalized with GAPDH. (c) Immunostaining for Kir2.1 (red), NaV1.5 (white), and wheat germ agglutinin (WGA; green) in control Male 1 iPSC-CM (left) and Male 1 iPSC-CM transfected with SNTA1. Nuclei were stained with DAPI. Yellow arrows point to iPSC-CM membrane staining. Scale bar, 5 μm. (d) Quantification of Kir2.1 and NaV1.5 colocalization with WGA at the cell membrane shows significant increase of both Kir2.1 (*p < 0.05; n = 7–10 cells) and NaV1.5 (**p < 0.01; n = 7–10 cells).
-
Figure 6—source data 1
SNTA1 quantification (Figure 6d).
- https://cdn.elifesciences.org/articles/76576/elife-76576-fig6-data1-v1.zip
Figure 7
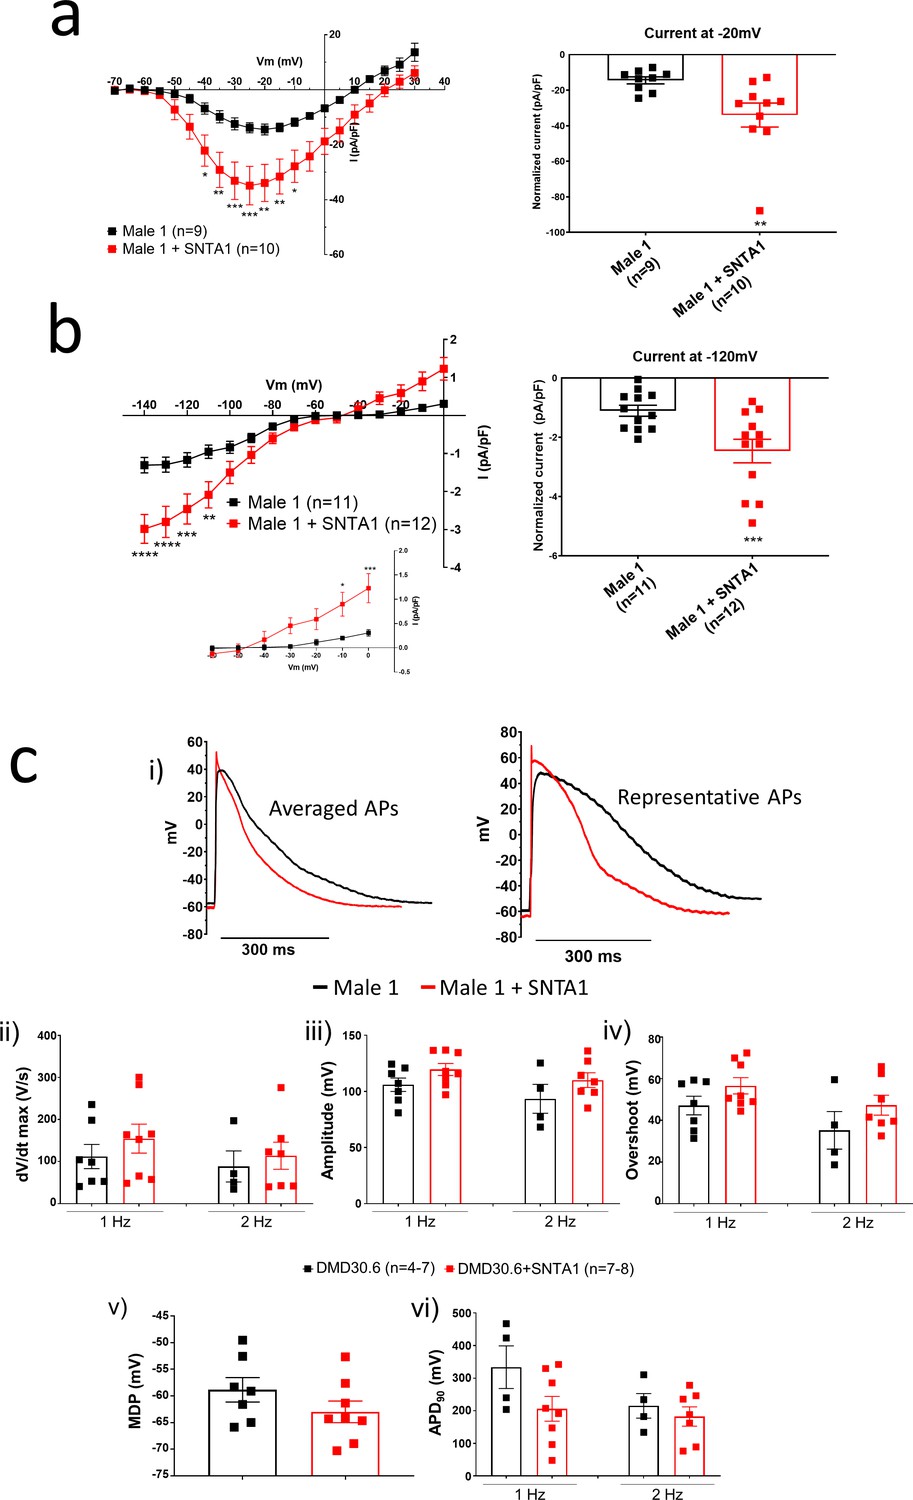
SNTA1 expression restores the electrophysiological deficiencies in Duchenne Muscular Dystrophy (DMD) iPSC-CMs.
(a, b) Normalized current–voltage (I/V) relationships for INa and IK1 in Male 1 before (black) and after (red) syntrophin expression at the specified voltages. Two-way analysis of variance (ANOVA) followed by Sidak’s multiple comparisons test. Graphs show peak INa density at −20 mV (a) and peak IK1 density at −120 mV (b). The inset in B highlights the increased outward component of IK1 at less negative potentials upon syntrophin expression. Two-tailed Mann–Whitney test. (c) Effect of syntrophin expression on AP showing: (i) Averaged (left) and representative (right) action potential traces of ventricular-like iPSC-cardiomyocytes derived from DMD cells before (black) and after (red) syntrophin expression, (ii) maximal AP upstroke velocity (dV/dtmax), (iii) amplitude, (iv) overshoot, (v) MDP, and (vi) APD90. Errors bars represent standard error of the mean (SEM). The n values are in parentheses. *p < 0.05; **p < 0.01; ***p < 0.001; and p < 0.0001.
-
Figure 7—source data 1
SNTA1 IV IK1 and IV INA (Figure 7A and B); and, Action potential properties (Figure 7C).
- https://cdn.elifesciences.org/articles/76576/elife-76576-fig7-data1-v1.zip
Figure 8 with 1 supplement
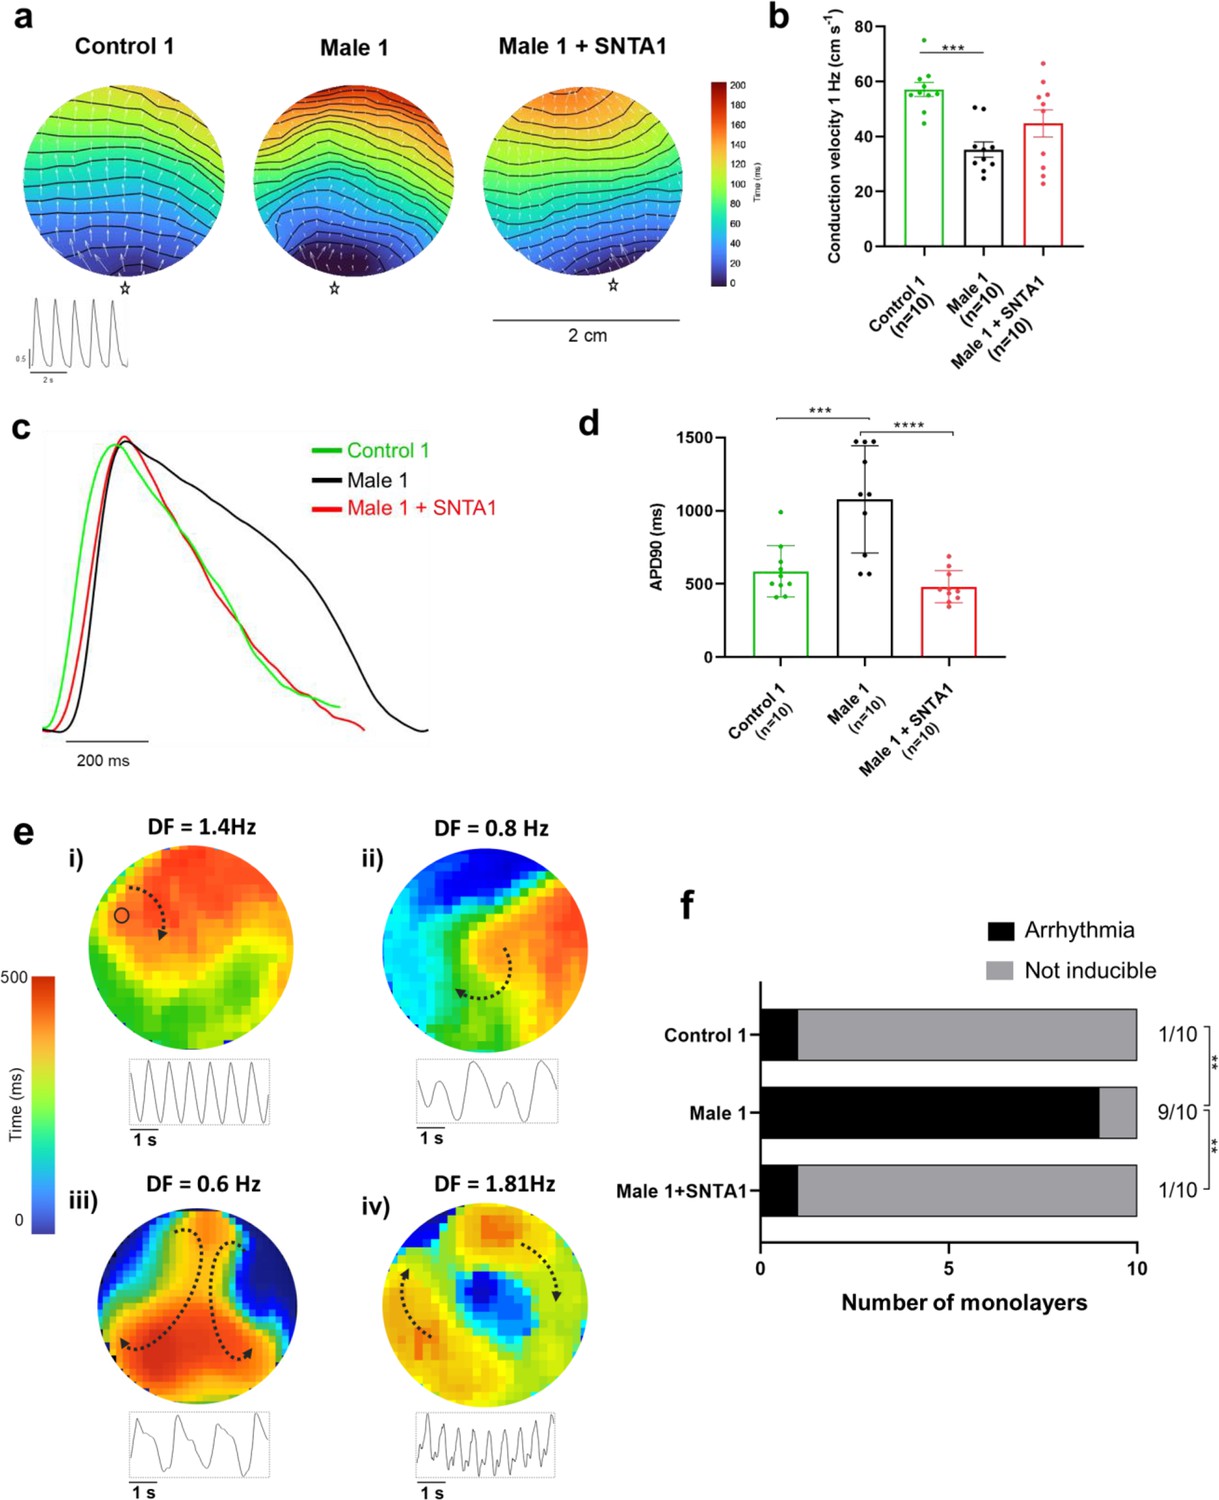
SNTA1 expression prevents reentrant arrhythmias in Duchenne Muscular Dystrophy (DMD) iPSC-CM monolayers.
(a) Optical maps of action potential propagation during pacing at 1 Hz. Each color represents a different activation time with time zero appearing in blue (star below each monolayer indicates the location of the stimuli). Horizontal wavy lines are 10-ms isochrones. White vectors (↑) are a measure of local velocity and direction of the propagation wave. Inset, five representative optical action potentials during 5 s. (b) Bar graphs of conduction velocity (CV) in each monolayer group, as indicated. Numbers in parenthesis are number of monolayers per group. (c) Superimposed mean action potential traces for each representative monolayer. (d) Bar graphs of action potential duration at 90% repolarization (APD90) for each group of monolayers. (e) Reentrant arrhythmias in iPSC-CMs monolayers from DMD hemizygous Male 1 (see also Video 1i–v). Below each map is a single pixel recording revealing varying patterns of monomorphic or polymorphic reentrant tachycardia maintained by one (maps i and ii) or more (maps iii and iv) self-sustaining rotors of varying rotation frequency. (f) Arrhythmia inducibility for each group shows a high rate of arrhythmia susceptibility in DMD male iPSC-CM monolayers. Error bars represent standard error of the mean (SEM). The n values are in parentheses. Two-way analysis of variance (ANOVA) followed by Sidak’s multiple comparisons test. Fisher’s exact test performed for the arrhythmia inducibility data. ***p < 0.001, ****p < 0.0001.
-
Figure 8—source data 1
Conduction Velocity and APD90 in the absence and in the presence of SNTA1 expression.
- https://cdn.elifesciences.org/articles/76576/elife-76576-fig8-data1-v1.zip
Figure 8—figure supplement 1
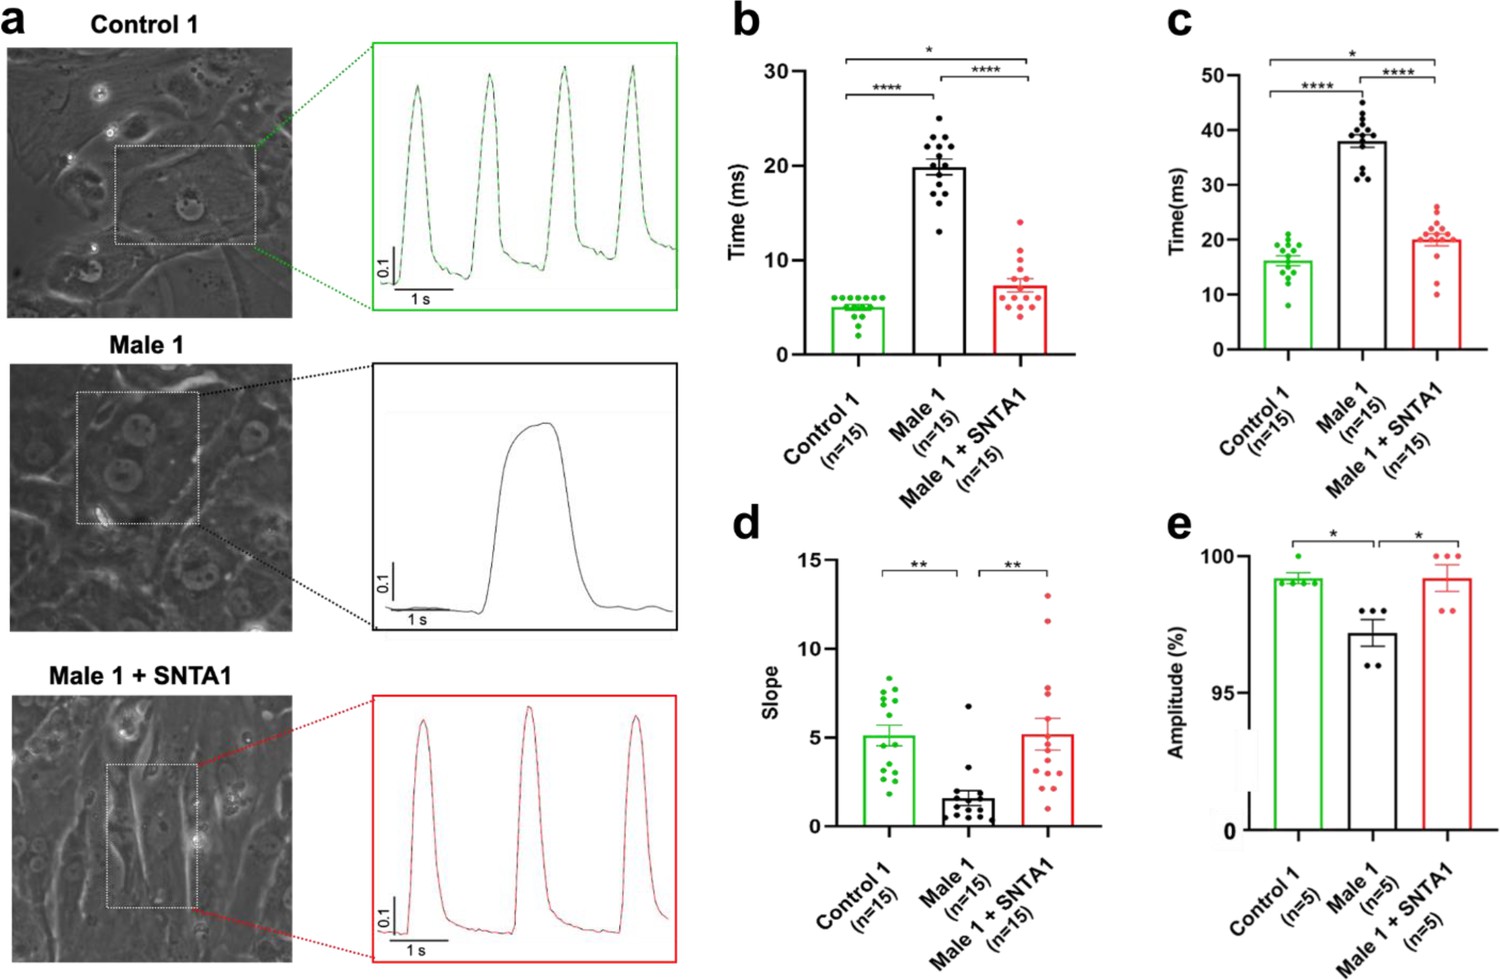
SNTA1 expression rescues contractility in Duchenne Muscular Dystrophy (DMD) iPSC-CM monolayers.
Contractility measured by cell shortening in spontaneously beating iPSC-CM monolayers from DMD hemizygous Male 1 is reduced with respect to control and rescued fully by SNTA1 expression. (a) Representative brightfield section of each monolayer. Inset, shortening tracings of single iPSC-CMs during 5 s. (b) Bar graphs comparing time taken from baseline to maximum shortening in each monolayer group. (c) Bar graphs comparing total duration of shortening in each group. (d) Slope of the shortening curve measured for each group of iPSC-CMs. DMD male 1 present a lower rise slope than control and rescued male 1 with SNTA1. (e) Normalized shortening amplitude in each iPSC-CMs monolayer group as measured on the whole monolayer plate. Errors bars represent standard error of the mean (SEM). The n values are in parentheses. Two-way analysis of variance (ANOVA) followed by Sidak’s multiple comparisons test. *p < 0.05, **p < 0.01 ****p < 0.0001.
Videos
Video 1
Duchenne Muscular Dystrophy (DMD) male arrhythmia patterns.
Movie # i Control iPSC-CM monolayer showing slow and organized spontaneous activity. Movies # ii–v. DMD hemizygous Male 1 iPSC-CM monolayers are inducible of high-frequency reentry maintained by one (videos # ii and iii) or more (videos # iv and v) self-sustaining rotors mimicking ventricular tachycardia patterns with varying degrees of complexity. Lower tracings in each movie are single pixel recordings from sites indicated by the inset.
Additional files
-
Supplementary file 1
Action potential parameters of iPSC-CMs paced at 1 and 2 Hz.
- https://cdn.elifesciences.org/articles/76576/elife-76576-supp1-v1.docx
-
Supplementary file 2
Action potential parameters of iPSC-CMs paced at 1 and 2 Hz.
- https://cdn.elifesciences.org/articles/76576/elife-76576-supp2-v1.docx
-
Supplementary file 3
Action potential parameters of iPSC-CMs at 1 and 2 Hz, Control 1 versus Control 2.
- https://cdn.elifesciences.org/articles/76576/elife-76576-supp3-v1.docx
-
Supplementary file 4
Biophysical parameters of DMD, and female iPSC-CMs versus Control 1.
- https://cdn.elifesciences.org/articles/76576/elife-76576-supp4-v1.docx
-
Supplementary file 5
Biophysical parameters of DMD, and female iPSC-CMs versus Control 2.
- https://cdn.elifesciences.org/articles/76576/elife-76576-supp5-v1.docx
-
Supplementary file 6
Biophysical parameters of iPSC-CMs, Control 1 versus Control 2.
- https://cdn.elifesciences.org/articles/76576/elife-76576-supp6-v1.docx
-
Supplementary file 7
Primers used in mRNA analysis.
- https://cdn.elifesciences.org/articles/76576/elife-76576-supp7-v1.docx
-
Transparent reporting form
- https://cdn.elifesciences.org/articles/76576/elife-76576-transrepform1-v1.pdf
Download links
A two-part list of links to download the article, or parts of the article, in various formats.
Downloads (link to download the article as PDF)
Open citations (links to open the citations from this article in various online reference manager services)
Cite this article (links to download the citations from this article in formats compatible with various reference manager tools)
SNTA1 gene rescues ion channel function and is antiarrhythmic in cardiomyocytes derived from induced pluripotent stem cells from muscular dystrophy patients
eLife 11:e76576.
https://doi.org/10.7554/eLife.76576


