Changes in transmission of Enterovirus D68 (EV-D68) in England inferred from seroprevalence data
- MRC Centre for Global Infectious Disease Analysis, School of Public Health, Imperial College London, United Kingdom
- Department of Computer Science, University of Oxford, United Kingdom
- Nuffield Department of Medicine, University of Oxford, United Kingdom
- Immunization Department, Public Health England, United Kingdom
- Infection and Immunity, University College of London, United Kingdom
Figures
Figure 1 with 3 supplements
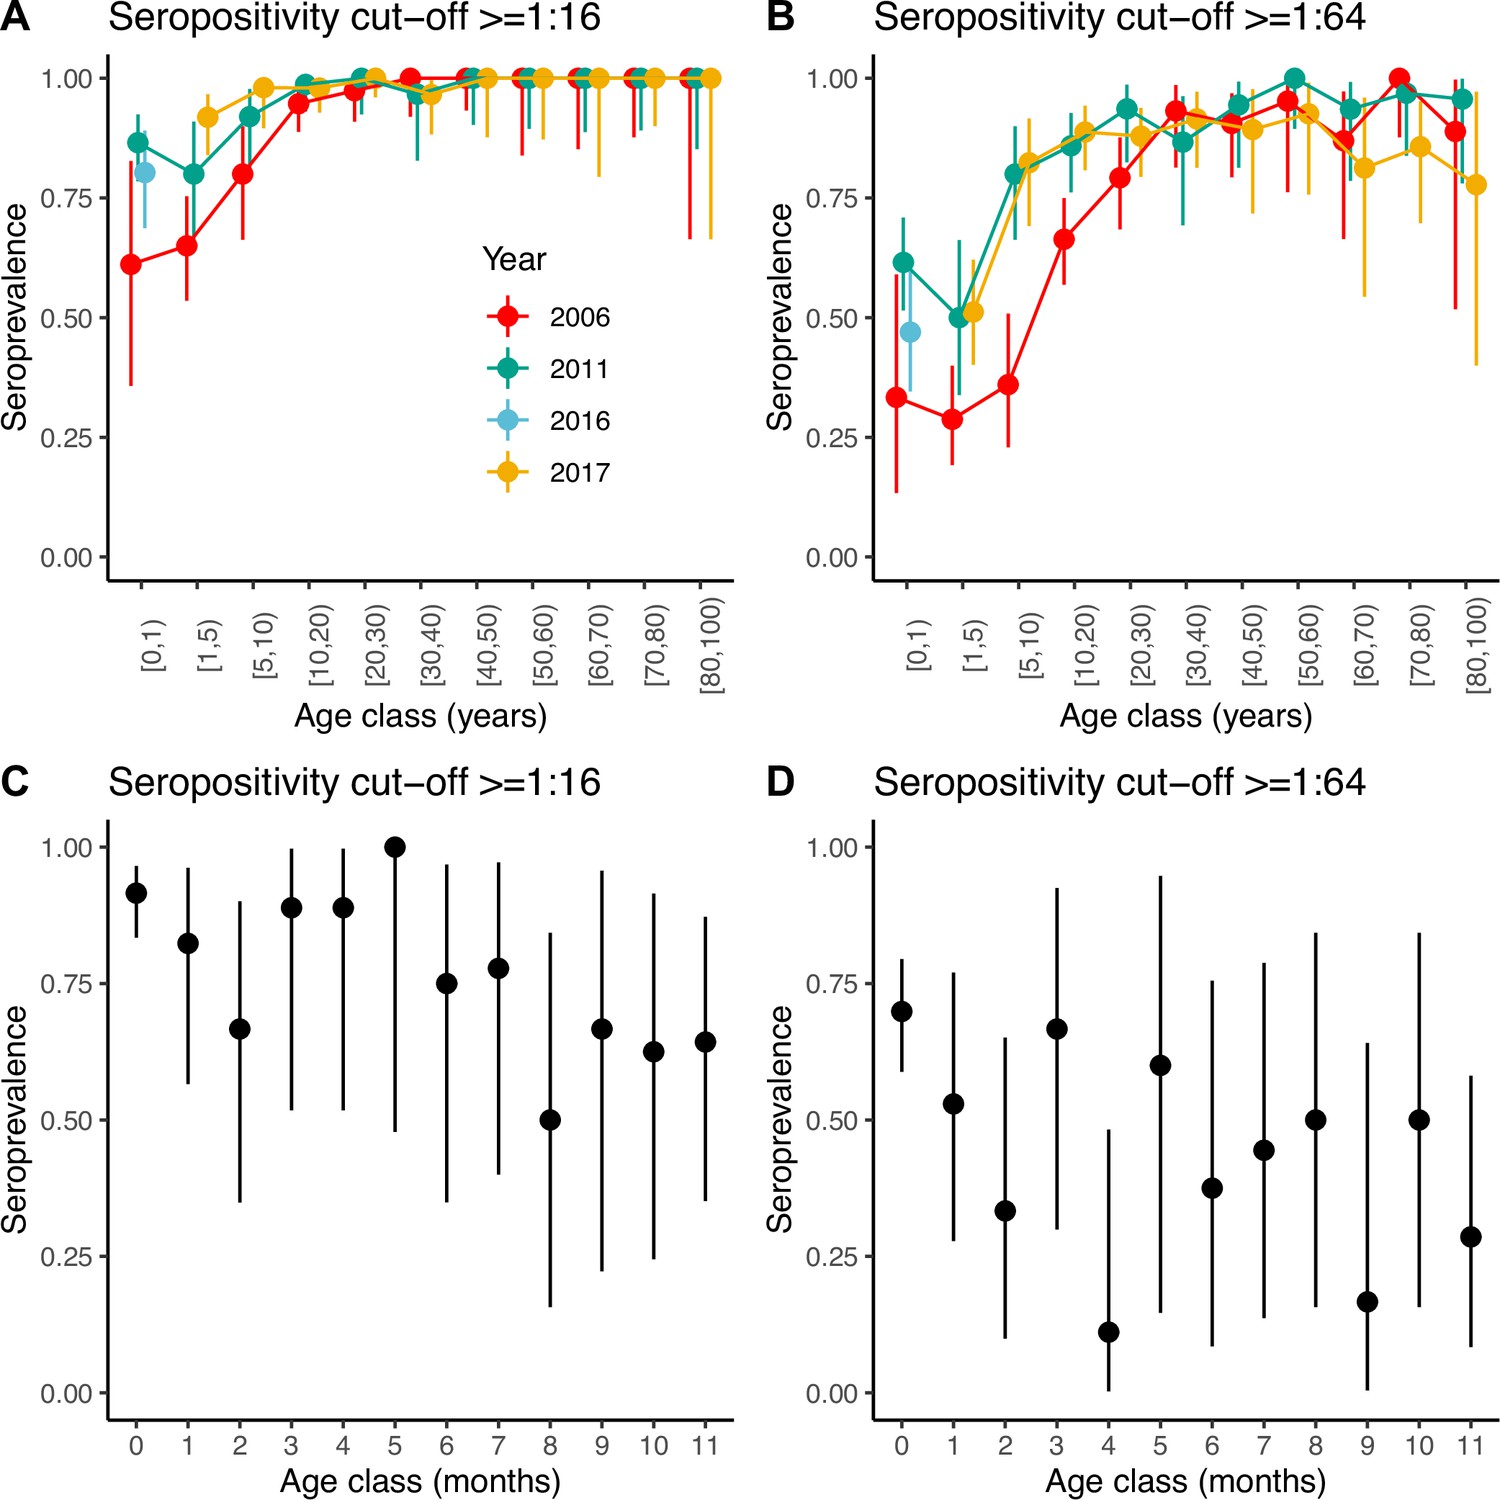
Seroprevalence by age.
Seroprevalence by age class in years for the three serosurveys and for two different cut-offs of neutralising antibody titre used to define positivity: (A) 1:16 and (B) 1:64. Seroprevalence by month during the first year of life for children across the three serosurveys combined and two seropositivity cut-offs: (C) 1:16 and (D) 1:64. Bars are 95% binomial confidence intervals. Note that in (A) and (B) individuals in the [0–1) age class from the 2017 serosurvey were in fact sampled in 2016 and as such, are shown with a different colour.
Figure 1—figure supplement 1
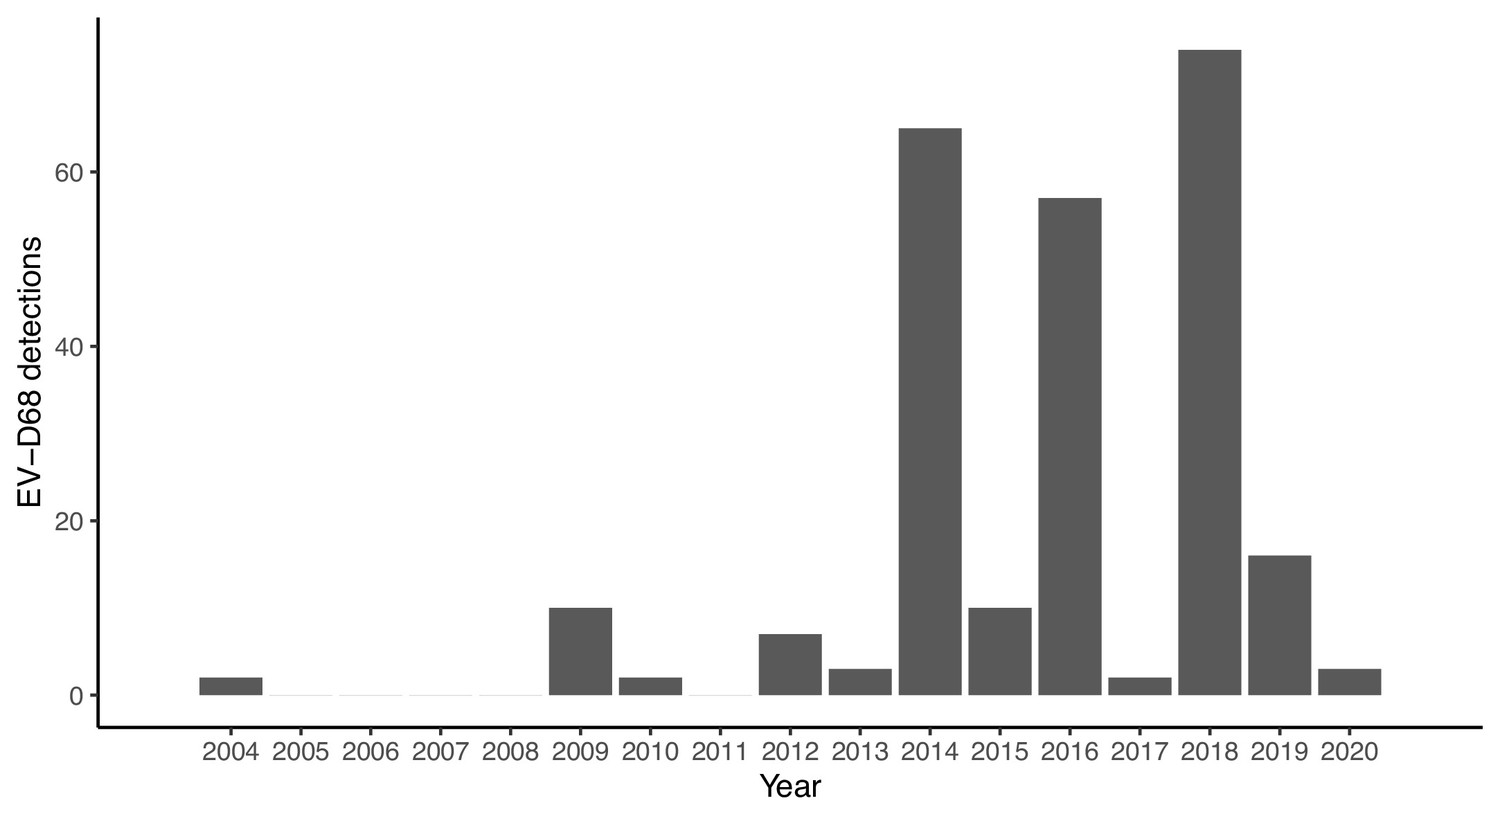
Annual number of Enterovirus D68 (EV-D68) detections reported by Public Health England (now UKHSA) between 2004 and 2020.
The data were extracted from three sources: for the years 2004–2011, from Kadambari et al., 2014; for 2012–2013, from a risk assessment report published by Public Health England, 2018; and for 2014–2020, we digitised data from Figure 2 in this website (Public Health England, 2023).
Figure 1—figure supplement 2
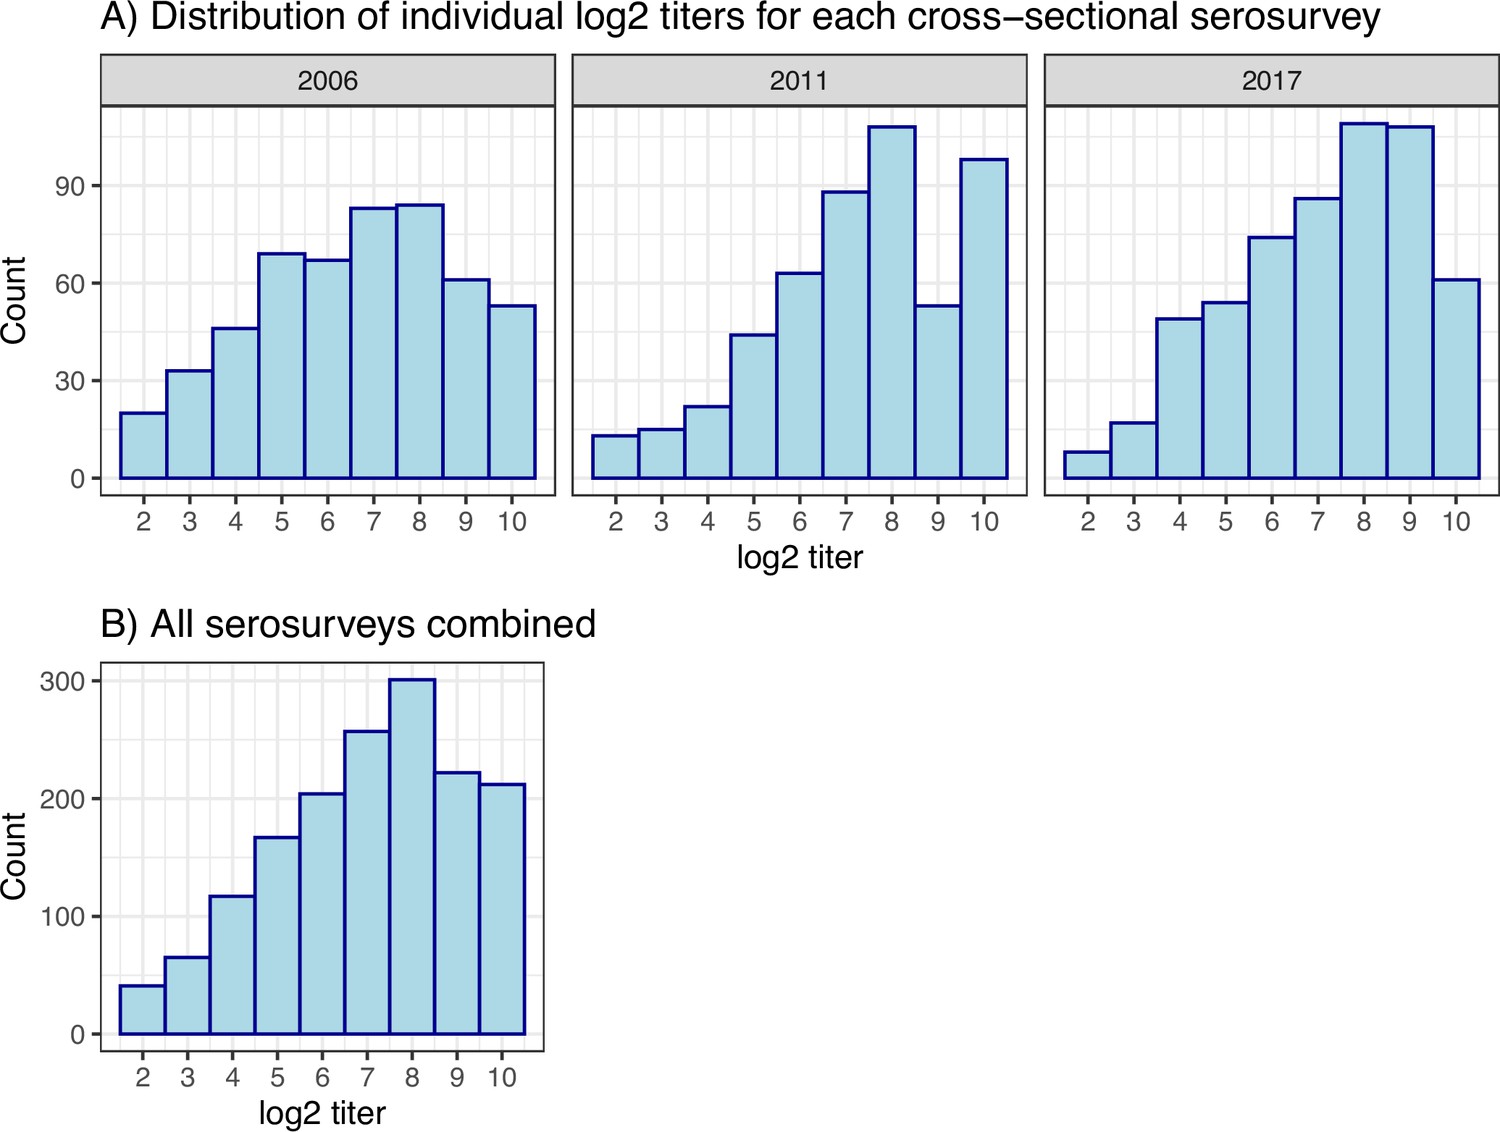
Individual log2 titre distributions.
(A) For each cross-sectional serosurvey. (B) For all three surveys combined.
Figure 1—figure supplement 3
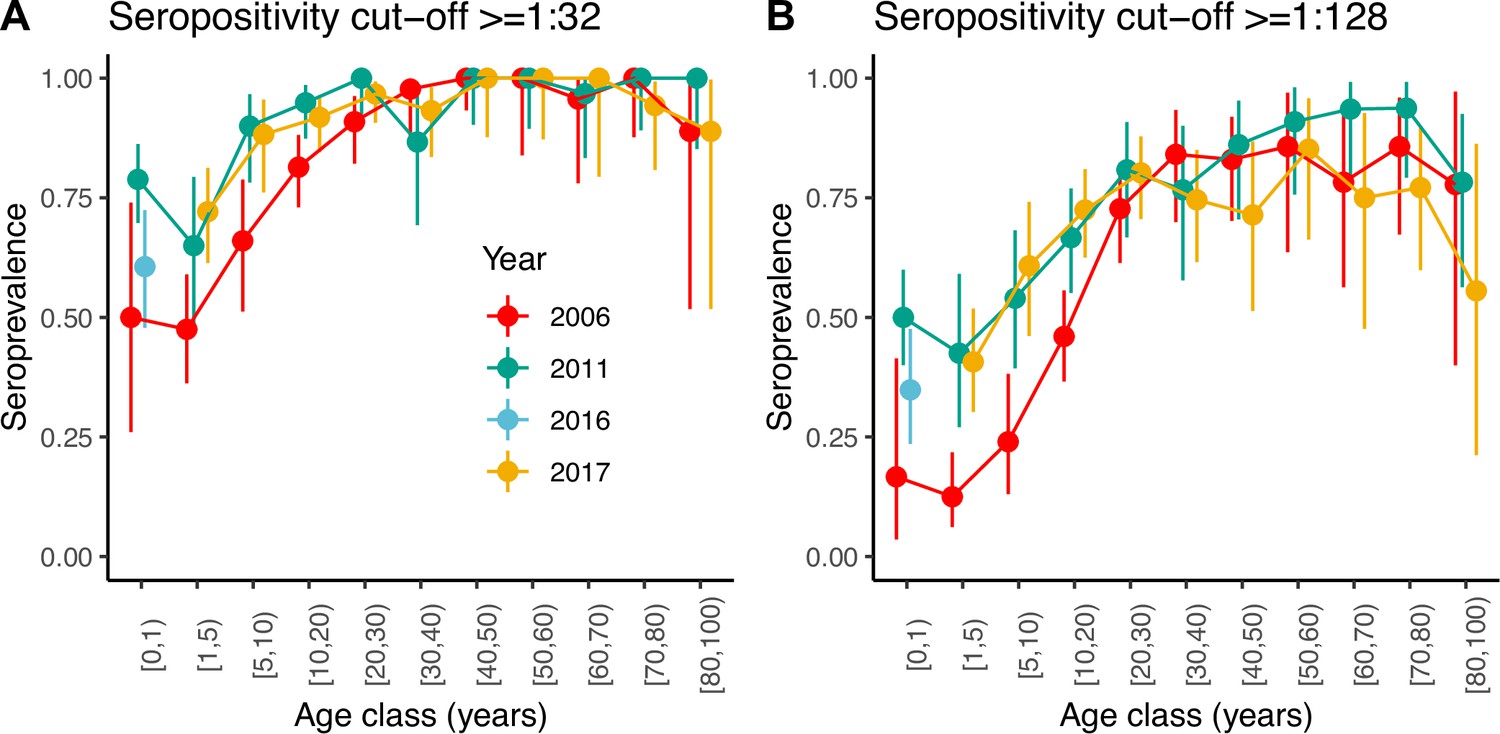
Seroprevalence by age class in years for the three serosurveys and two different cut-offs of neutralising antibody titre used to define positivity: (A) 1:32 and (B) 1:128.
Figure 2 with 3 supplements
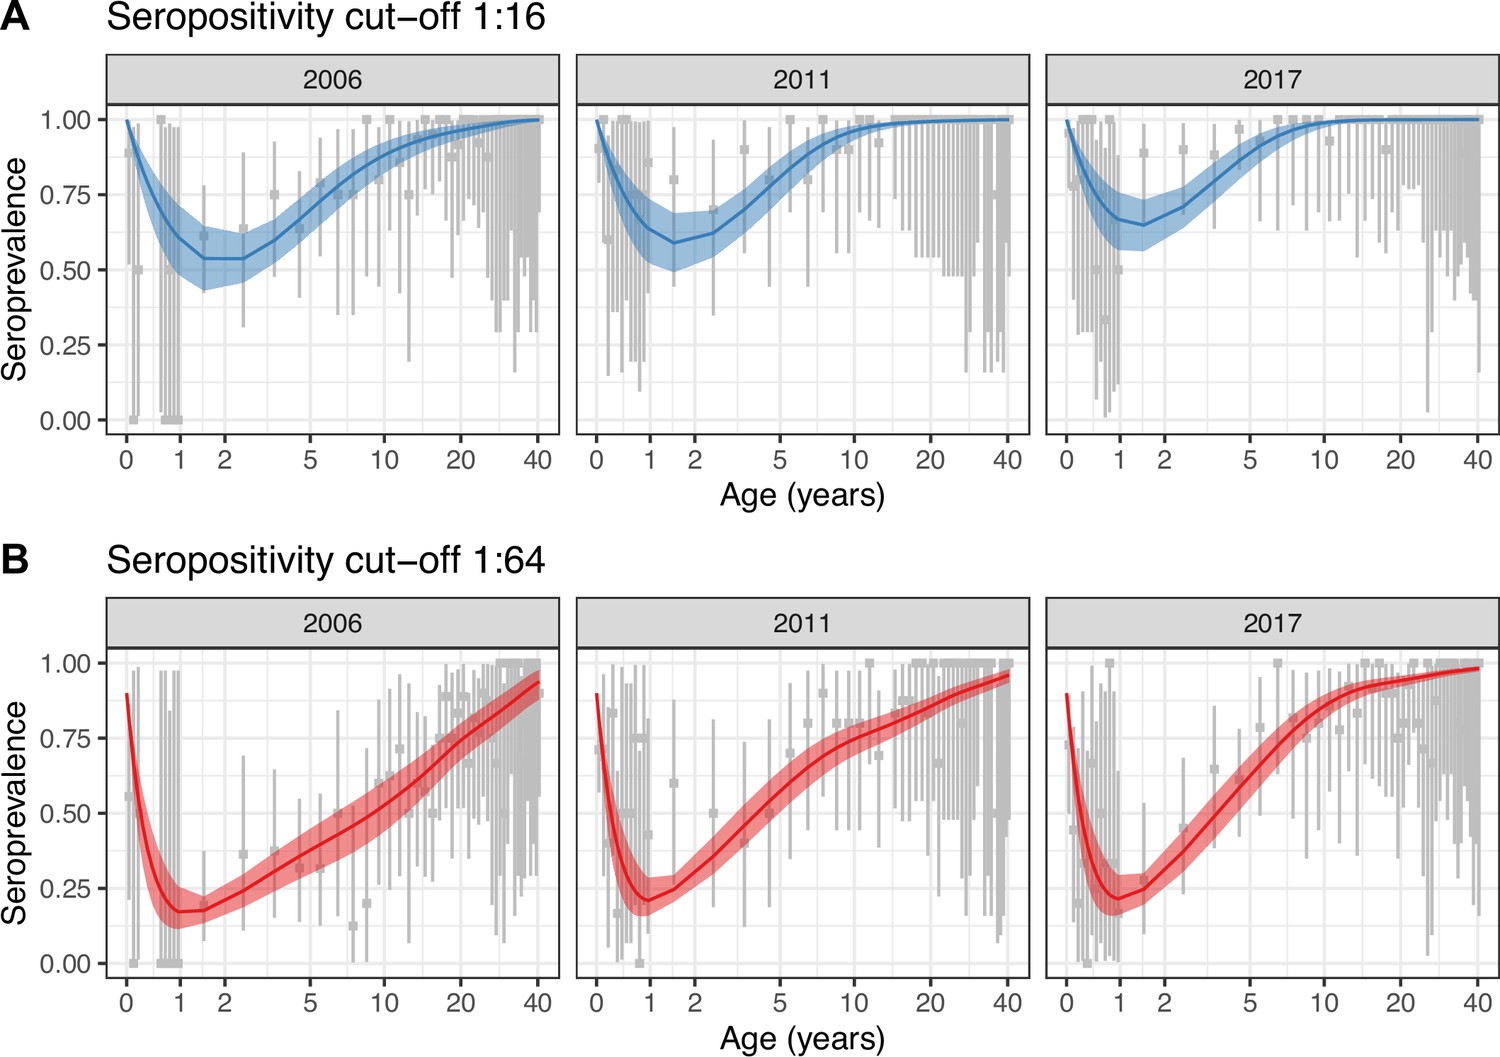
Best model fit to data.
Observed (gray) and estimated (blue and red) seroprevalence by age for the three cross-sectional serosurveys (2006, 2011, and 2017). Model fit is shown for the random walk model (Model 2) using the two seropositivity cut-offs, (A) 1:16 and (B) 1:64. Gray intervals indicate the 95% binomial confidence intervals around the observed proportion of seropositivity. The line and ribbons correspond to the median and 95% credible intervals of the posterior estimates of seroprevalence. Note that the age axis is log-transformed to better show the data in the younger age classes. The same plot with the age axis on a natural scale is shown in Figure 2—figure supplement 2. Note also that the data for <1 yo shown for 2017 were actually collected in 2016.
Figure 2—figure supplement 1
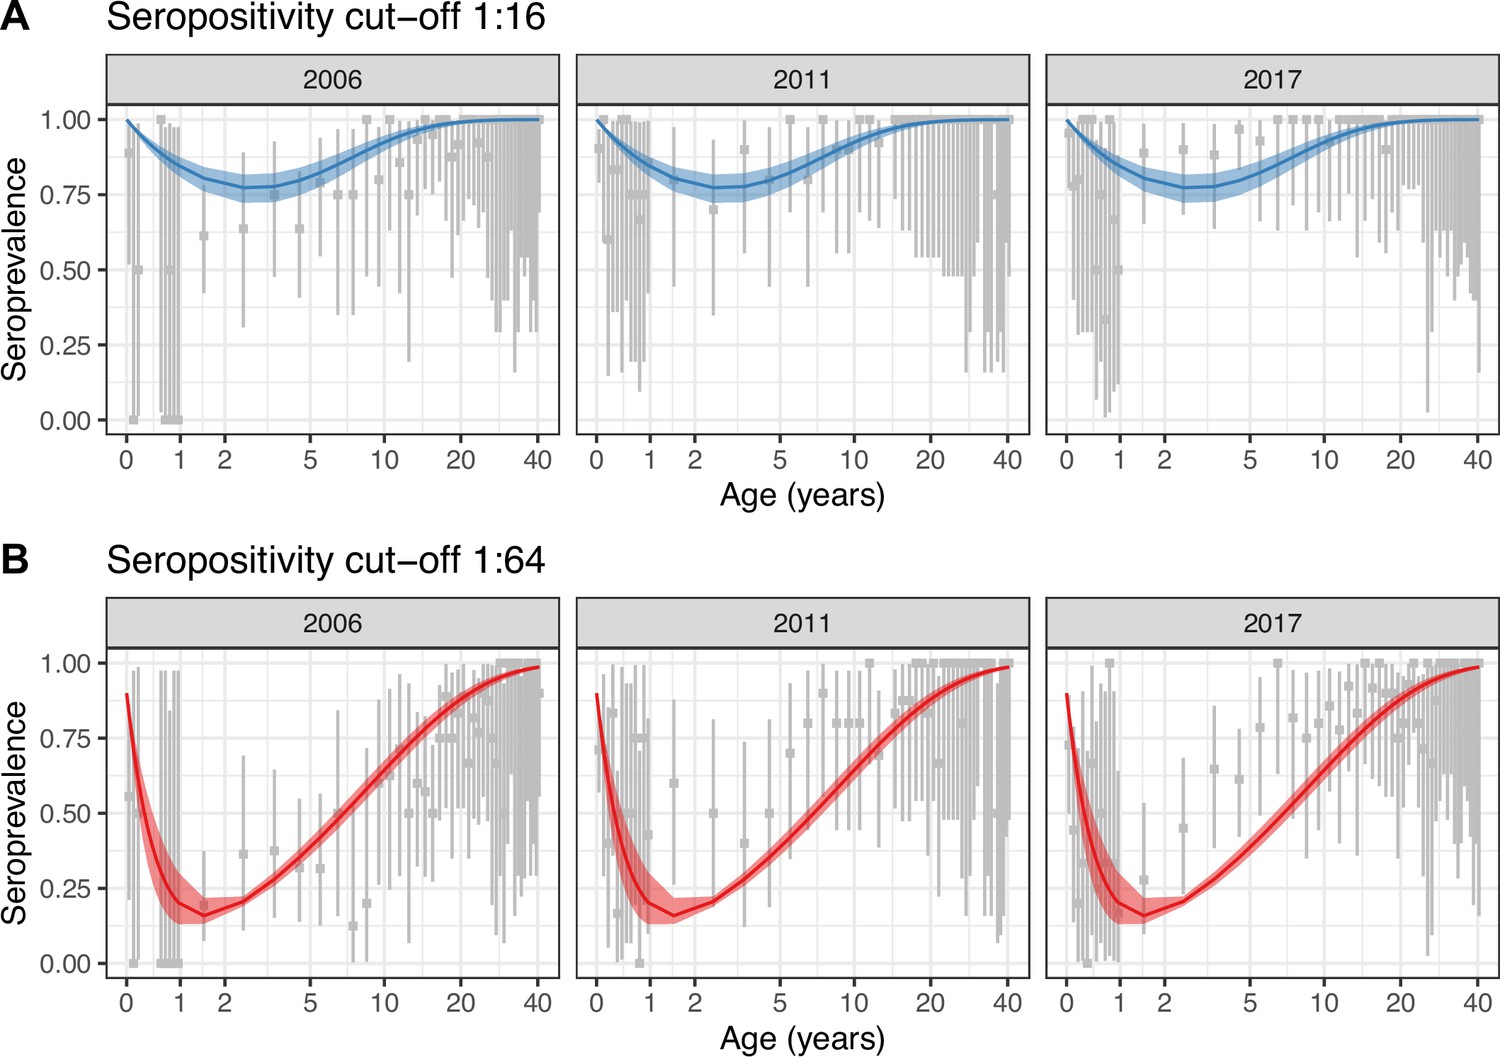
Constant model fit to data.
Observed (gray) and estimated (blue and red) seroprevalence by age for the three cross-sectional serosurveys (2006, 2011, and 2017). Model fit is shown for the constant model (Model 1) using the two seropositivity cut-offs, (A) 1:16 and (B) 1:64. Gray intervals indicate the 95% binomial confidence intervals around the observed proportion of seropositivity. The line and ribbons correspond to the median and 95% credible intervals of the posterior estimates of seroprevalence. Note that the age axis is log-transformed to better show the data in the younger age classes. The same plot with the age axis on a natural scale is shown in Figure 2—figure supplement 3. Note also that the data for <1 yo shown for 2017 were actually collected in 2016.
Figure 2—figure supplement 2
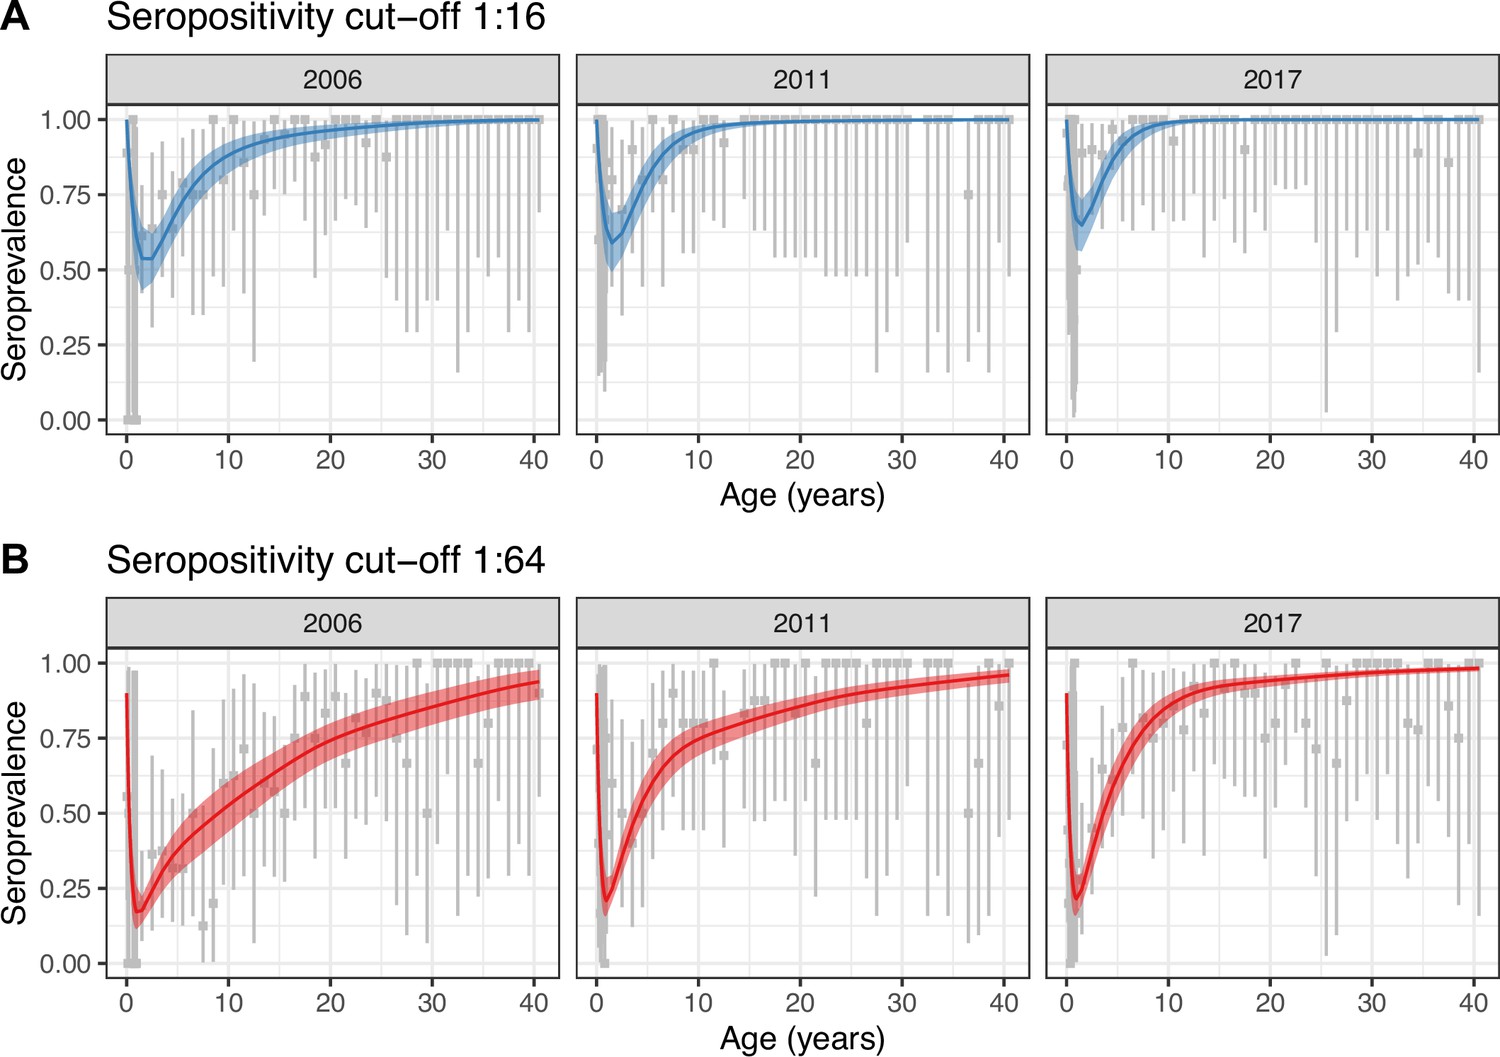
Same as Figure 2, with x-axis on a natural scale.
Figure 2—figure supplement 3
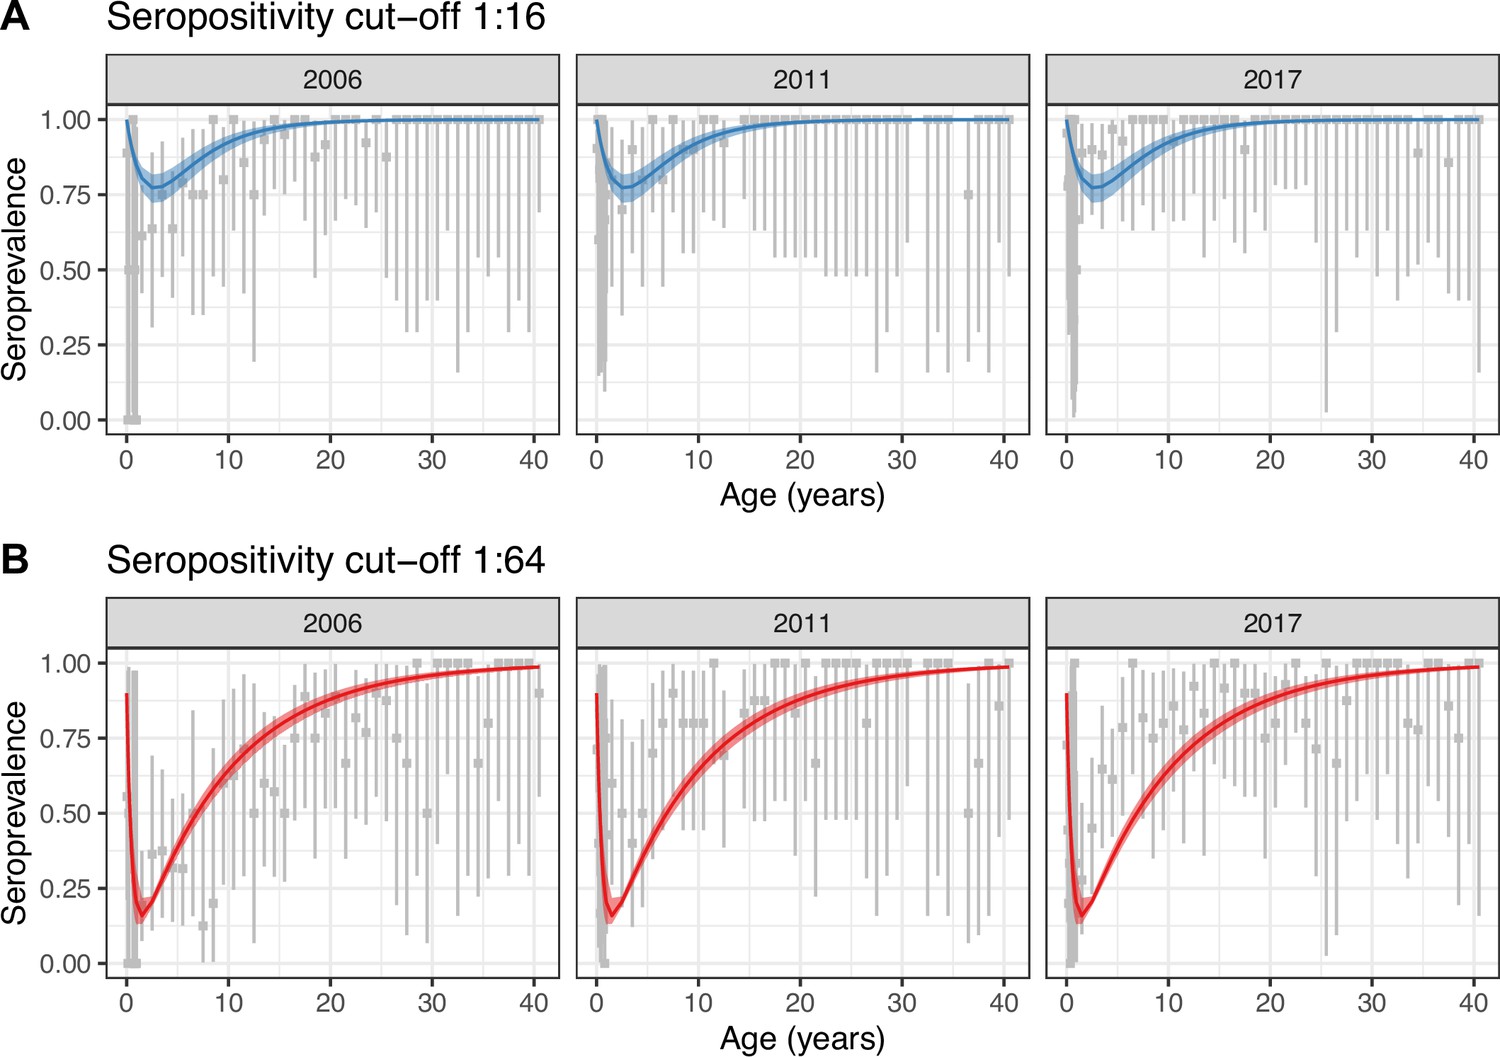
Same as Figure 2—figure supplement 1, with x-axis on a natural scale.
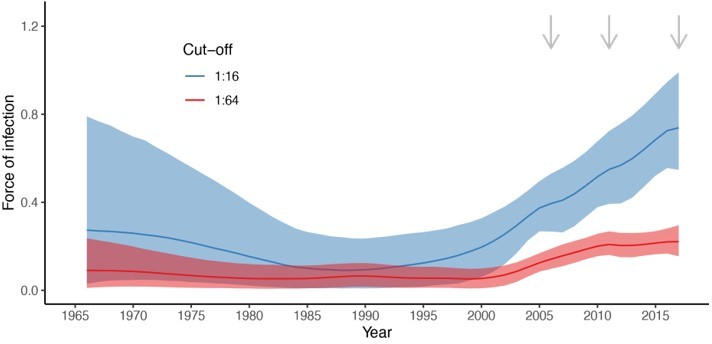
Figure 3
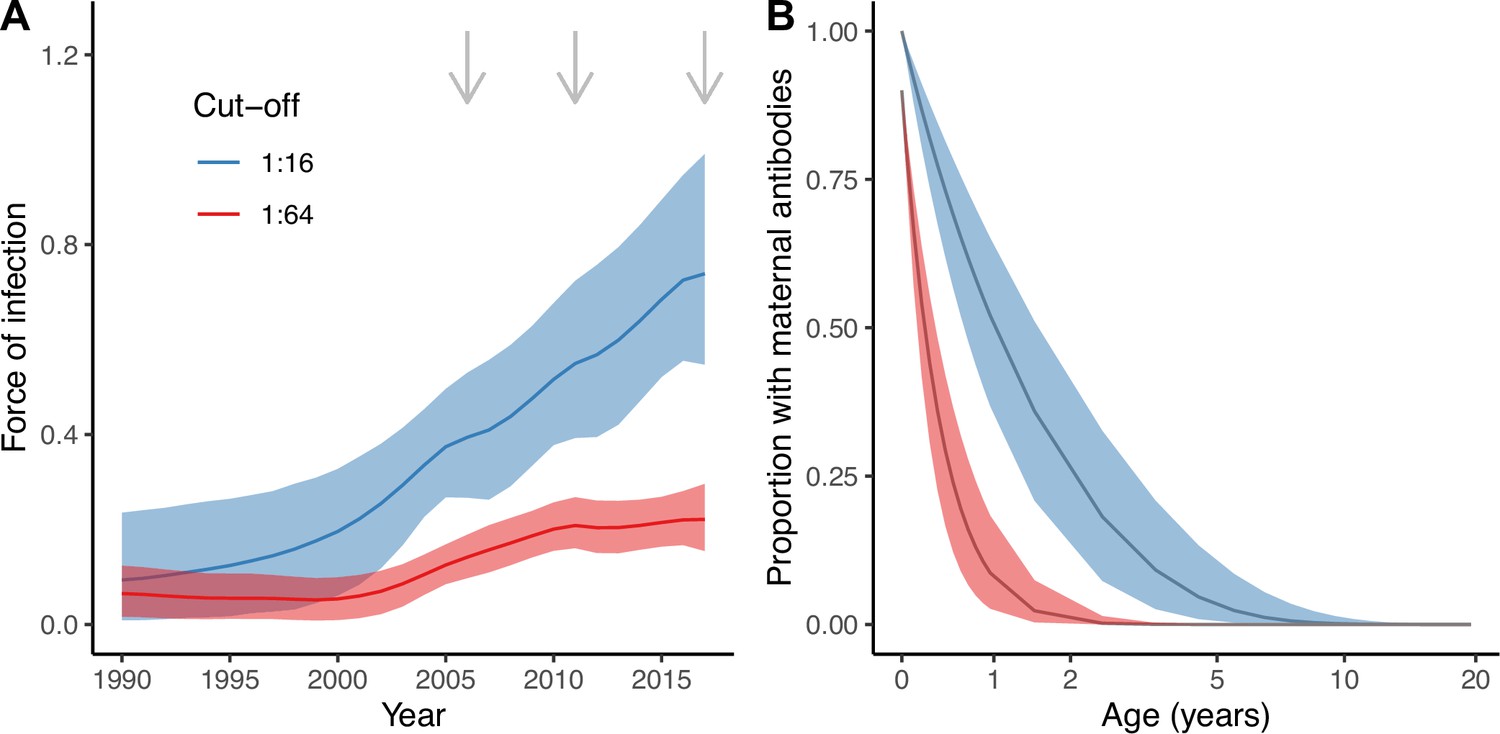
Estimates from the best model (Model 2).
Estimated force of infection (FOI) over time (A) and estimated proportion of individuals with detectable maternal antibodies through age (B) for the two seropositivity cut-offs considered. Median and 95% credible intervals are shown for both. In (A), gray arrows indicate the years for which there is cross-sectional seroprevalence data.
Figure 4
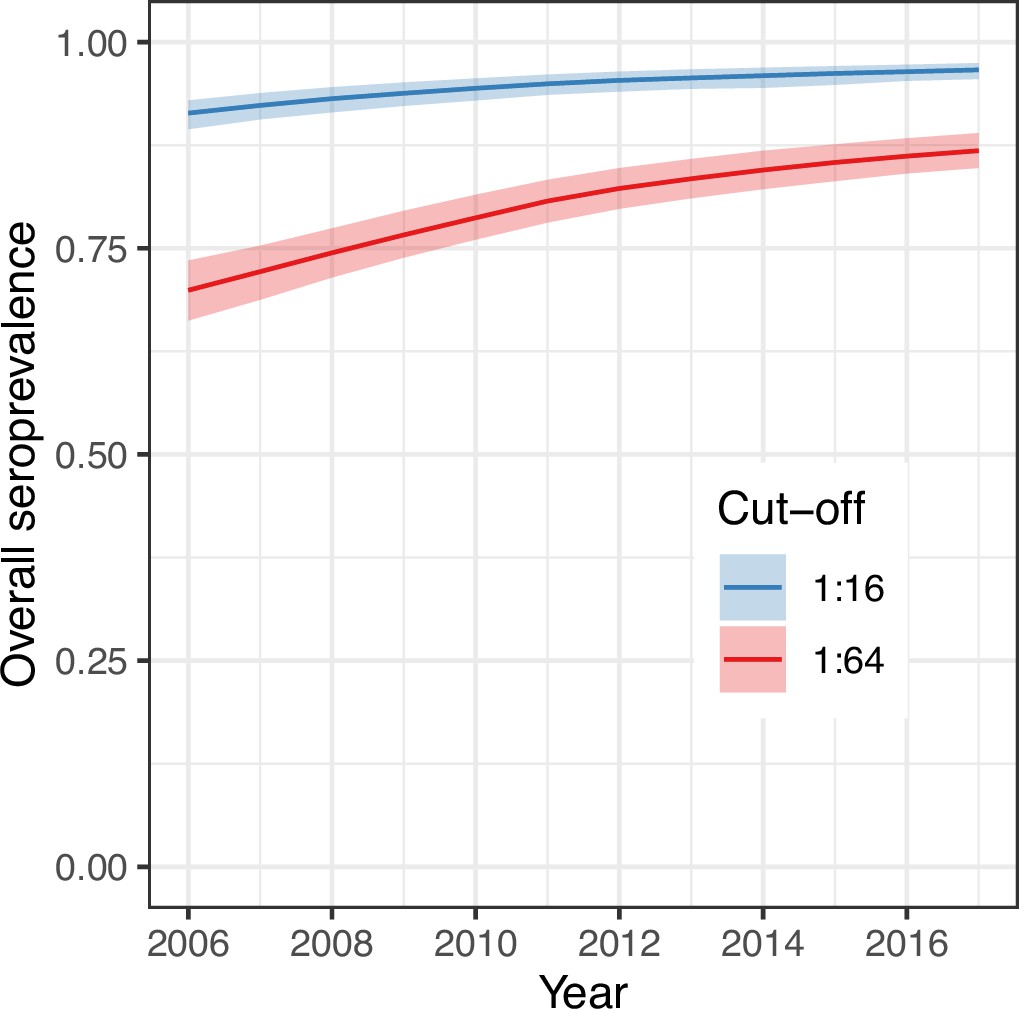
Overall (age-weighted) seroprevalence per year for the best model using the two different seropositivity cut-offs.
Median and 95% credible intervals are shown.
Figure 5
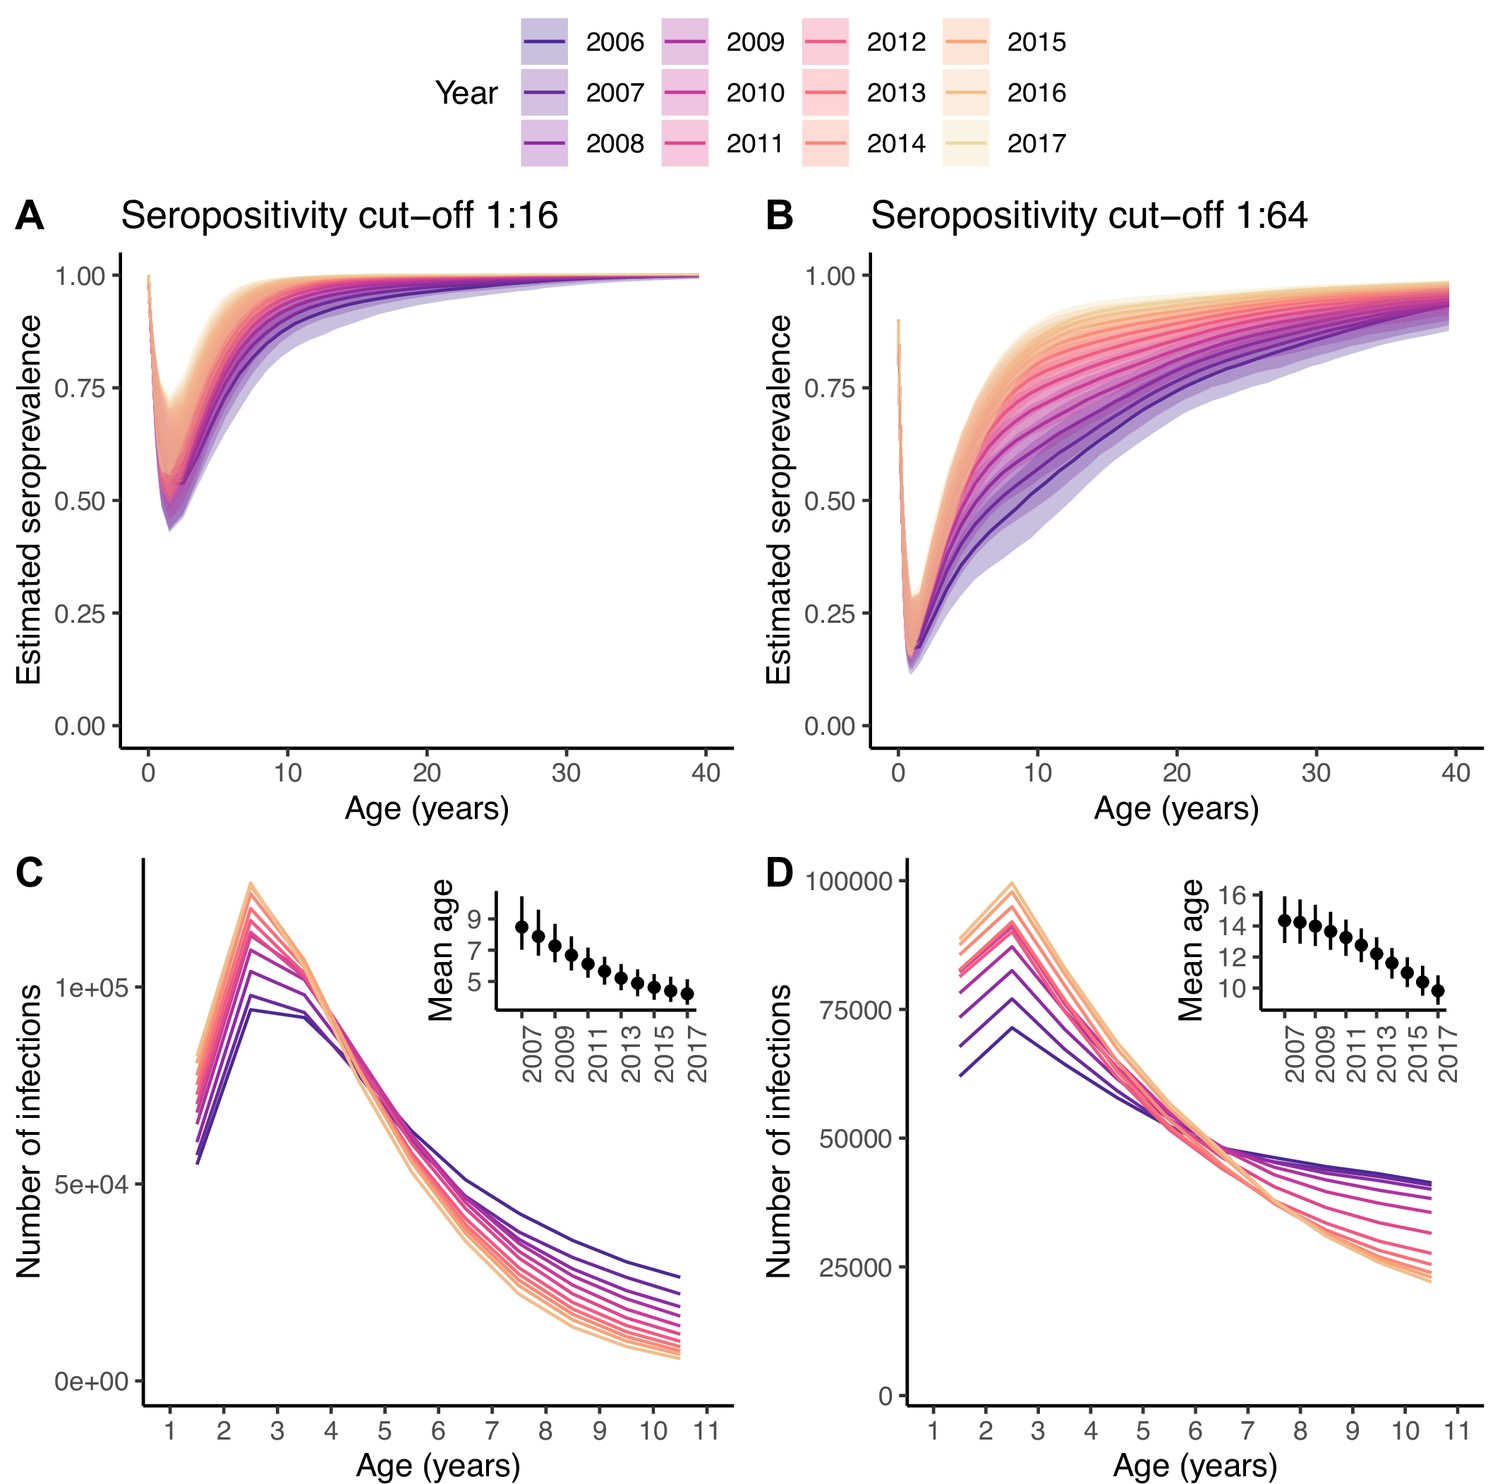
Changes in the number of infections.
Seroprevalence (A, B) and reconstructed number of infections (C, D) for each age class and year under the best model and for the two seropositivity cut-offs, 1:16 (A, C) and 1:64 (B, D). The insets in (C, D) show the mean age at infection for each year. In (A, B), the median and 95% credible intervals are shown, whereas in (C, D) only the median is shown, for clarity of the plots.
Author response image 1
Author response image 2
Additional files
-
Supplementary file 1
Supplementary results.
(a) Proportion of seropositive individuals in the 25–40 years old group. This proportion is used to fix the proportion of individuals born with maternal antibodies and is assumed constant across the study. (b) Model comparison for the two different datasets, corresponding to two different seropositivity cut-offs. For each model comparison, the first row corresponds to the model with the largest expected log pointwise density (ELPD), which measures the model expected predictive accuracy. For each model, its log-likelihood and the difference in the Bayesian leave-one-out (LOO) estimate of the ELPD compared to the best model are shown. (c) Model parameter estimates. Median and 95% credible intervals are presented.
- https://cdn.elifesciences.org/articles/76609/elife-76609-supp1-v1.docx
-
Transparent reporting form
- https://cdn.elifesciences.org/articles/76609/elife-76609-transrepform1-v1.docx
Download links
A two-part list of links to download the article, or parts of the article, in various formats.
Downloads (link to download the article as PDF)
Open citations (links to open the citations from this article in various online reference manager services)
Cite this article (links to download the citations from this article in formats compatible with various reference manager tools)
Changes in transmission of Enterovirus D68 (EV-D68) in England inferred from seroprevalence data
eLife 12:e76609.
https://doi.org/10.7554/eLife.76609


