On demand expression control of endogenous genes with DExCon, DExogron and LUXon reveals differential dynamics of Rab11 family members
- Wellcome Trust Centre for Cell-Matrix Research, School of Biological Sciences, Faculty of Biology Medicine and Health, Manchester Academic Health Science Centre, The University of Manchester, United Kingdom
Figures
Figure 1 with 2 supplements
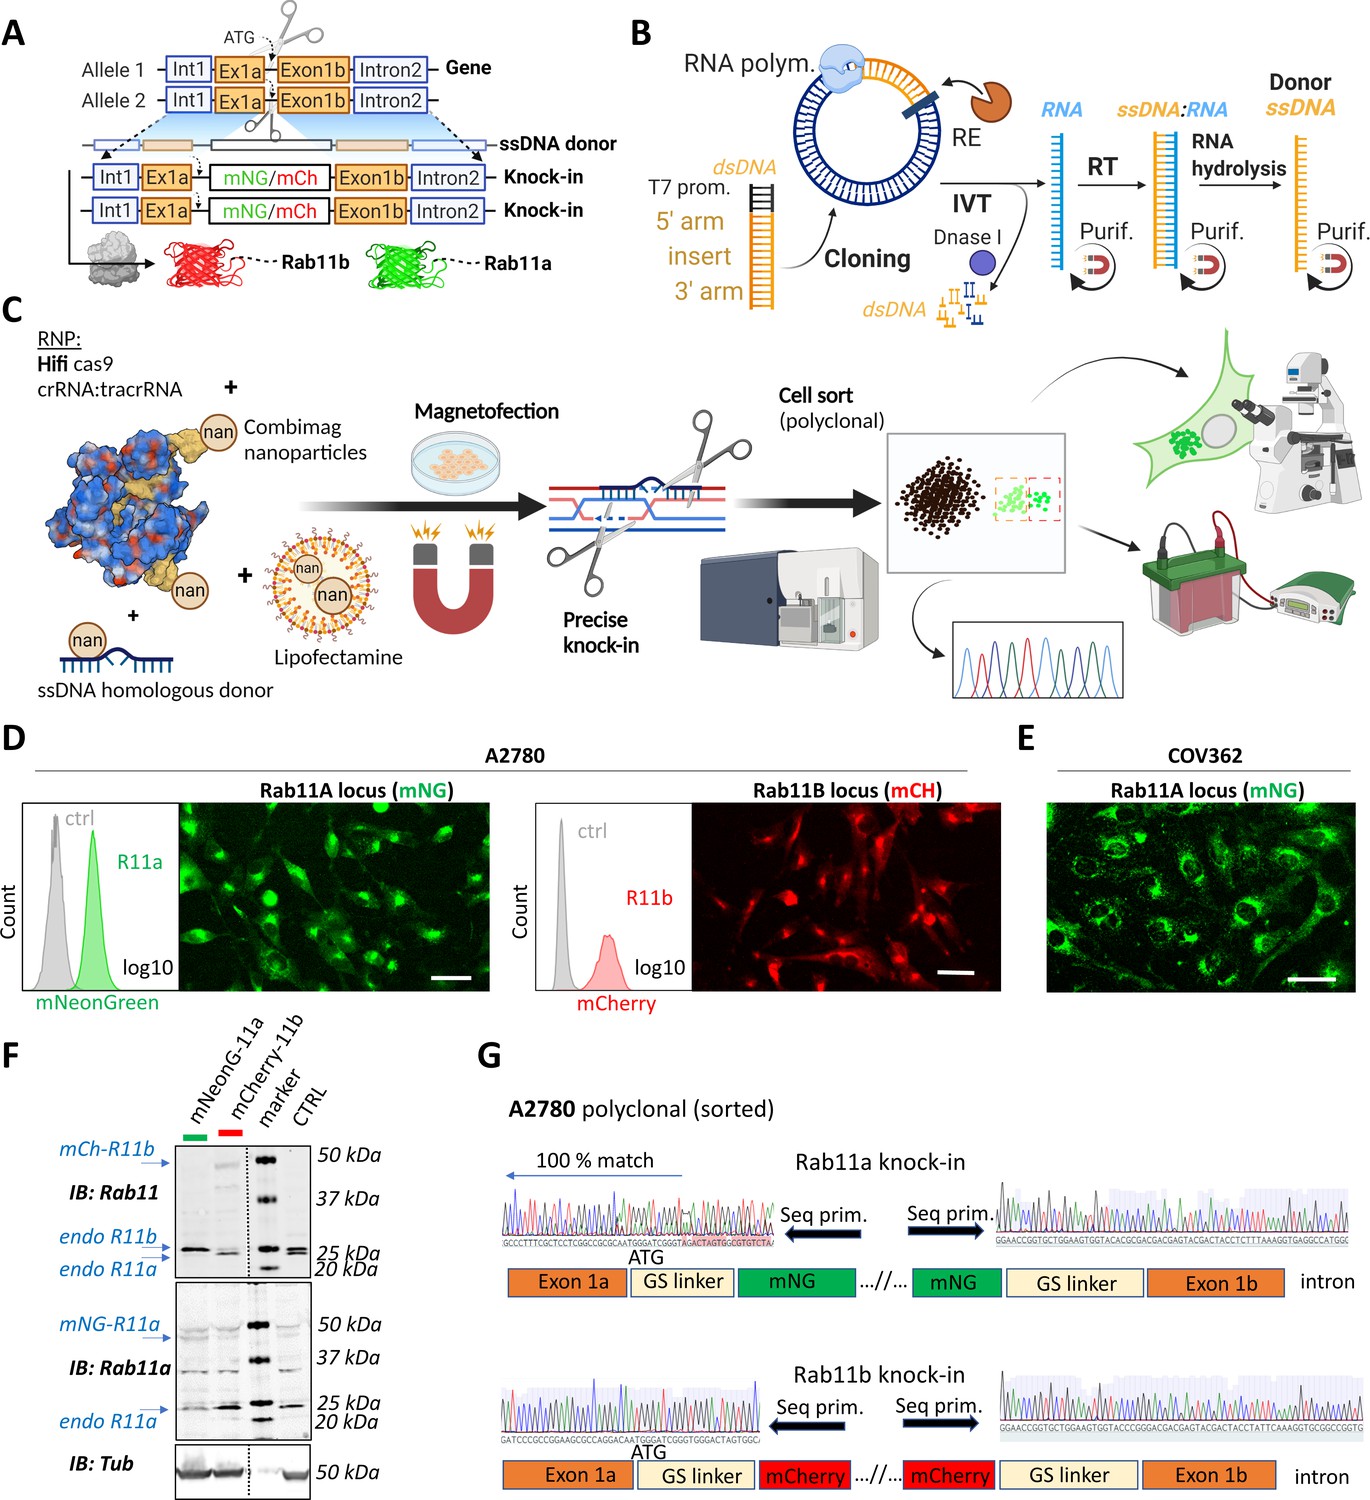
A rapid and efficient pipeline for CRISPR/Cas9 knock-in of fluorescent proteins at the endogenous locus of Rab11 family members.
(A–C) Schematic representation of single-stranded DNA (ssDNA) mediated knock-in strategy of different fluorophores with corresponding homologous arms (A), the ssDNA preparation technique (IVT=in vitro transcription; RT=reverse transcription; RE=restriction endonuclease; purif.=purification using magnetic SPRI beads) (B), and our optimized pipeline (RNP=ribonucleoprotein complex) (C). Illustrations were created with BioRender.com. FACS and fluorescence widefield images (background subtracted) of mNeonGreen or mCherry knock-ins to Rab11a or Rab11b loci of (D) A2780 or (E) COV362 ovarian cancer cell lines. Ctrl represent unmodified cells; scale bar=40 µm. (F) Immunoblots of mNeonGreen-Rab11a, mCherry-Rab11b, and unmodified (Ctrl) cells. Fluorescent antibodies, specific anti-Rab11a, or antibody targeting both Rab11a/b (Rab11) shown as black and white. Tubulin, loading control. (G) Chromatograms of mNeonGreen-Rab11a and mCherry-Rab11b cells with schematic of knock-in outcome (seq. prim=sequencing primer).
Figure 1—figure supplement 1
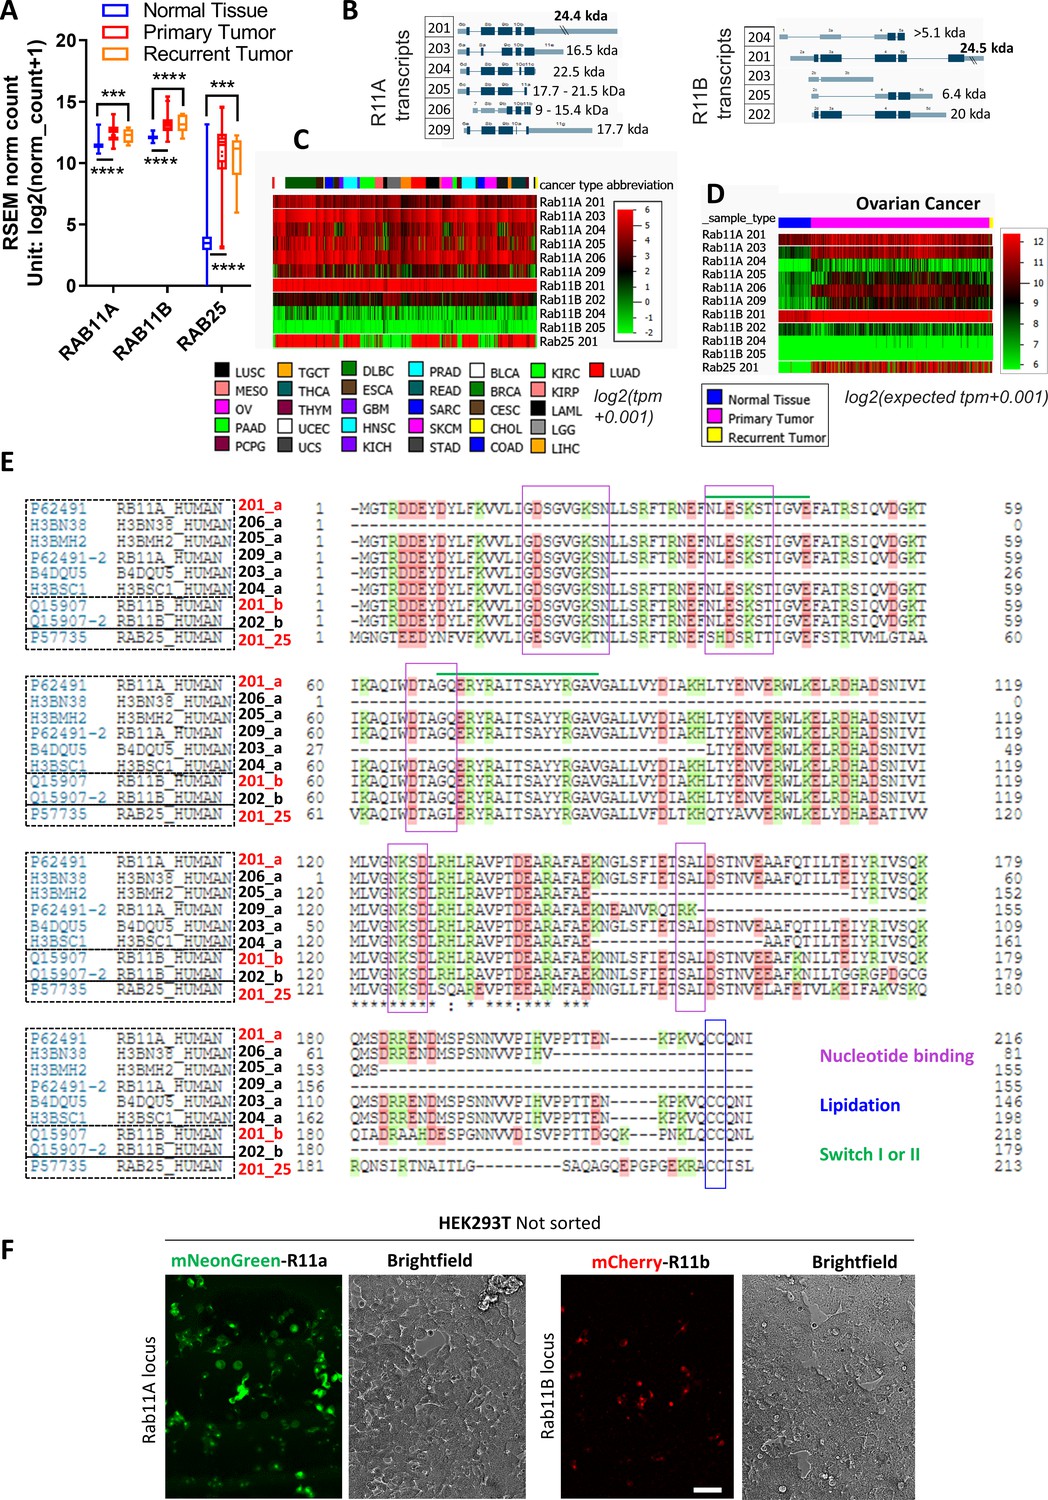
Rab11 family expression profiling.
(A) Comparison of Rab11s expression in normal healthy or primary and recurrent ovarian tumors (TCGA TARGET genotype-tissue expression [GTEx] study). One-way ANOVA Tukey post hoc test. (B) Schematic illustration of all predicted alternatively spliced protein coding variants of Rab11a/b transcripts with corresponding introns/exons (protein coding in dark blue). (C–D) Comparison of Rab11a/b/25 isoform expression levels (RNAseq) across multiple types of cancer (TCGA PanCan dataset) (C) and recurrent ovarian tumors from the TCGA TARGET GTEx study (D). (E) Multiple sequence alignment (made by UNIPROT) of the most abundant protein-coding Rab11s transcripts. Transcripts that contain all elements necessary to function as a Rab GTPase are in red. Sequences important for GTP/GDP binding or for the attachment to the membrane (CC) are highlighted. (F) Fluorescence widefield images of non-sorted mNeonGreen or mCherry knock-ins to Rab11a or Rab11b loci of human embryonic kidney (HEK)293T. Scale bar=100 µm.
Figure 1—figure supplement 2
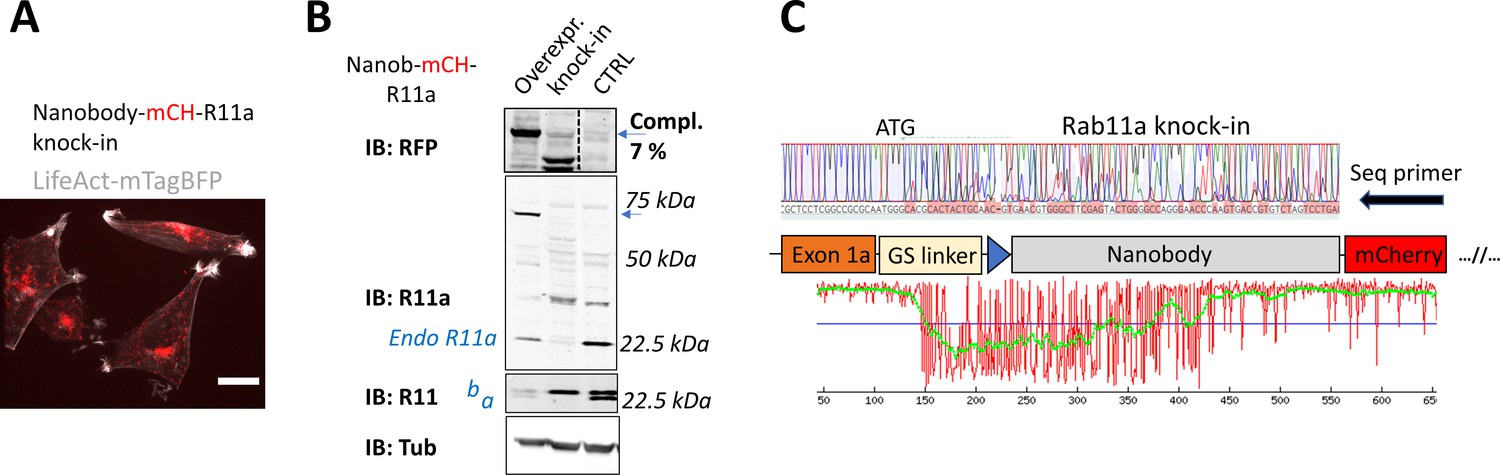
N-terminal knock-in of non-fluorescent coding elements.
(A) Spinning disk confocal image of A2780 cells with antiGFPnanobody-mCherry knock-in to Rab11a locus stably expressing LifeAct-mtagBFP (gray). Signal of mCherry (red; =mCH) reports full-length integration only of mCherry, not of antiGFPnanobody (scale bar=20 μm). (B) Immunoblots of wild-type (wt) A2780 control (CTRL), antiGFPnanobody-mCherry knock-in to Rab11a locus, or A2780 overexpressing stably integrated full-length antiGFPnanobody-mCherry-Rab11a (lentiviral transduction, expected protein size 69 kDa marked by blue arrow). Blots were probed with anti-mCherry (RFP), anti-Rab11a, or anti-Rab11 (targeting both Rab11a/b) antibodies (a=Rab11a; b=Rab11b). Tubulin (Tub), loading control. (C) Chromatogram of mCherry-antiGFPnanobody-Rab11a cells (classical knock-in) with schematic of knock-in outcome (seq. prim=sequencing primer). Graph, made by TIDER analysis, estimates the frequency of mutations/indels in knocked-in cells (Brinkman et al., 2018).
Figure 2 with 2 supplements
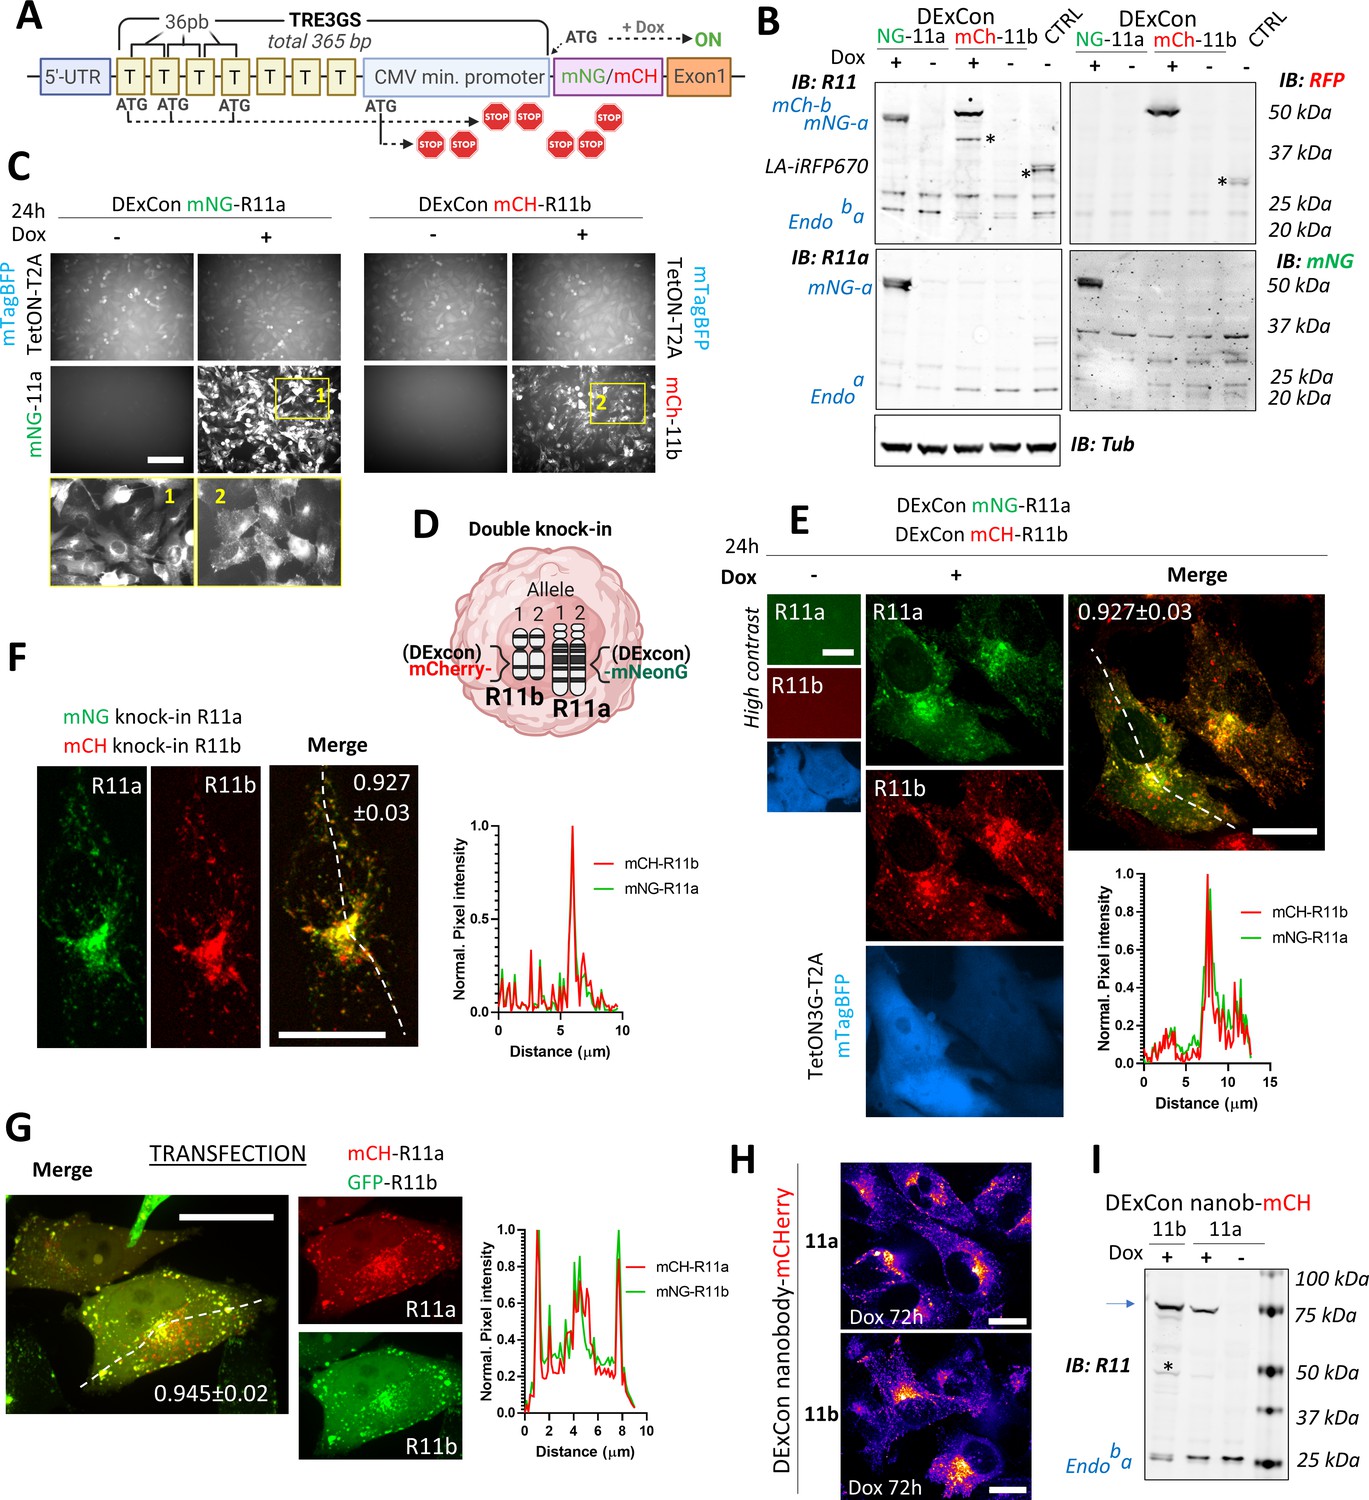
Reversible suppression of endogenous gene expression with DExCon (Doxycycline-mediated endogenous gene Expression Control).
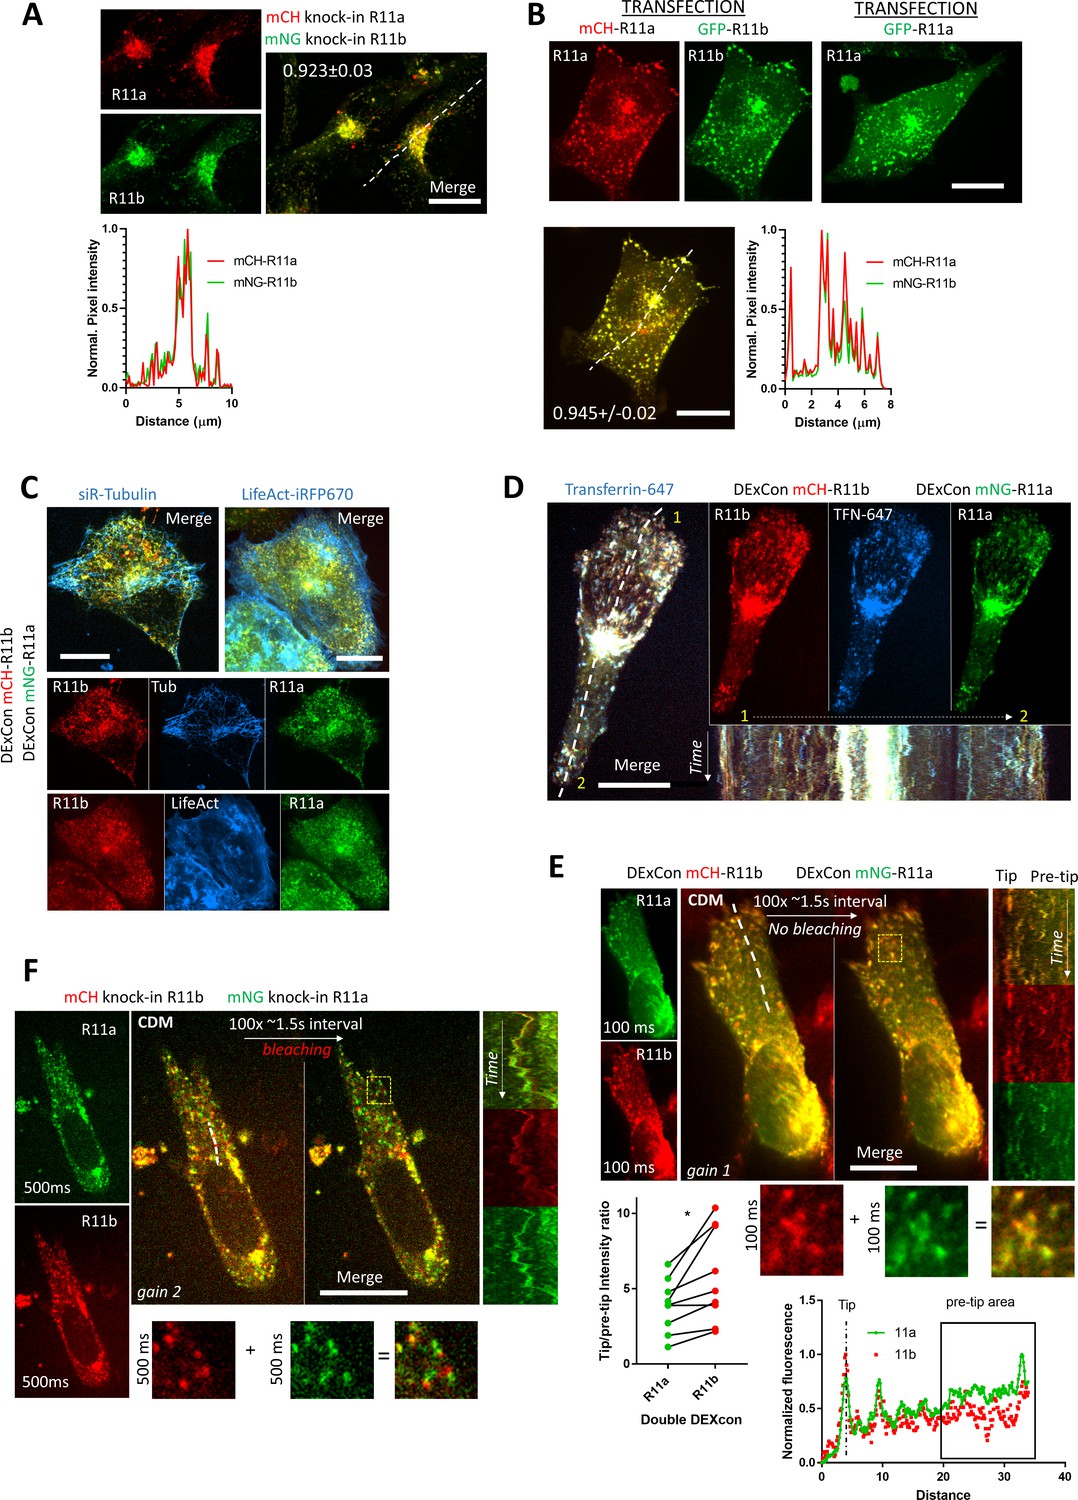
(A) DExCon schematic. (B) DExCon knock-in cells were doxycycline (dox) treated for 24–72 hr, sorted for mCherry or mNeonGreen fluorescence, and grown for 2 weeks without dox before re-analysis. Representative immunoblots of mNeonGreen-Rab11a or mCherry-Rab11b DExCon A2780 cells treated or not treated with dox for 48 hr (a=Rab11a; b=Rab11b) probed with anti-mNeonGreen (mNG), anti-mCherry (RFP), anti-Rab11a, or anti-Rab11 (targeting both Rab11a/b) antibodies shown as black and white. Tubulin (Tub), loading control. CTRL represents wt A2780 over-expressing Lifeact-iRFP670. Stars indicate mCherry/iRFP670 lower molecular weight band caused by fluorescent protein (FP) hydrolysis during sample preparation (Gross et al., 2000). For higher contrast, see Figure 2—figure supplement 1A. (C) Live fluorescence images of mNeonGreen-Rab11a or mCherry-Rab11b DExCon (A2780) cells ±dox treatment (24 hr). Scale bar=100 μm. Area in yellow rectangle (1 or 2) is shown at the bottom with higher resolution. (D) Schematic of double knock-in, classical or DExCon, within same cell. (E–G) Spinning disk confocal images of (E) double DExCon Rab11a/b expressing Teton3G-T2A-mtagBFP±dox, (F) classical double mNeonGreen or mCherry knock-ins to Rab11a or Rab11b as indicated, and (G) A2780 co-transfected (magnetofection) with cDNA for GFP-Rab11b and mCherry-Rab11a. Maximum intensity Z-projection are shown, scale bar=20 μm. Plot profiles correspond to the dashed line and numbers reflect Pearson’s cross-correlation coefficient (average ± SEM, n=14–22 cells). Spinning disk confocal images (H) or immunoblots (I) of antiGFPnanobody-mCherry DExCon cells (mCherry channel as ‘gem’ pseudocolor image Look-Up Table), modified in Rab11a or Rab11b locus treated ±dox for 72 hr. Scale bar=20 µm. Blue arrow points to the full-length fusion product.
Figure 2—figure supplement 1
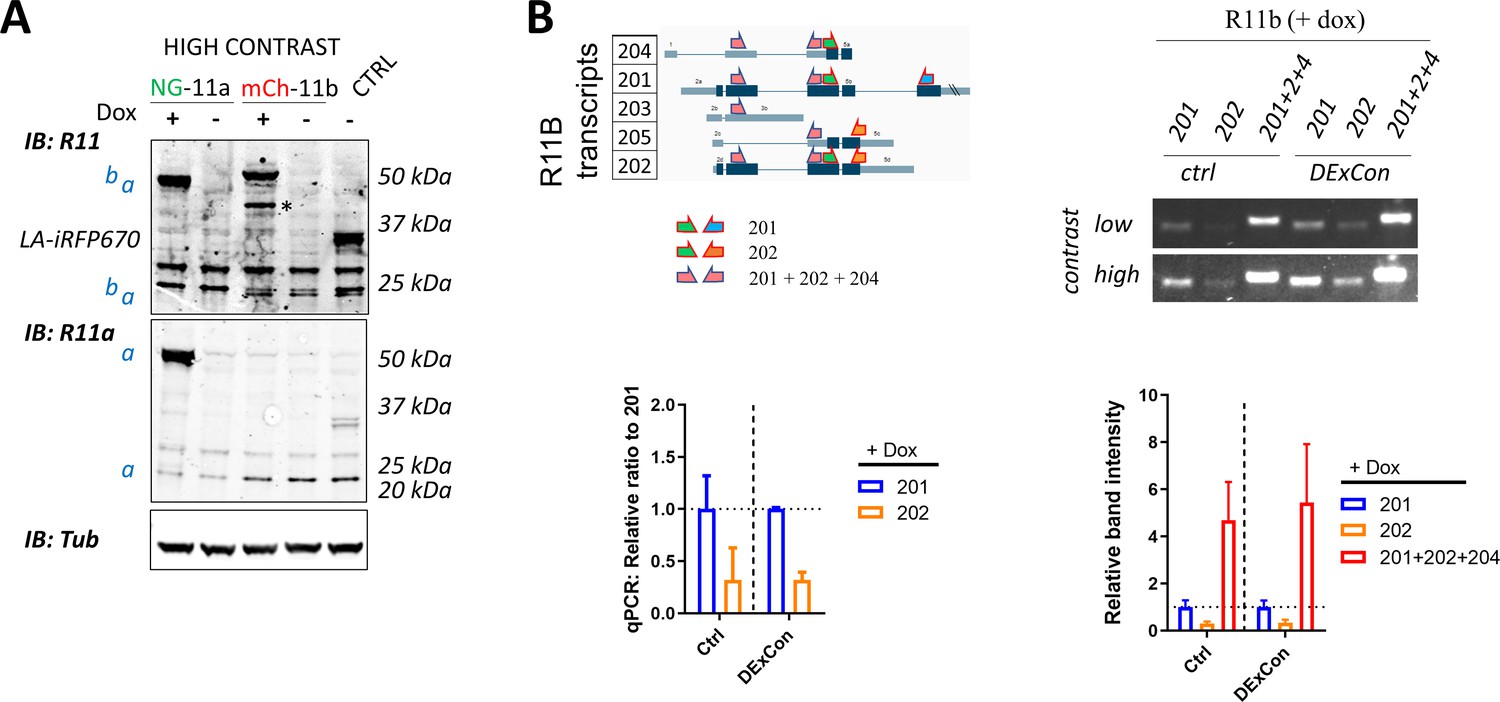
DExCon (Doxycycline-mediated endogenous gene Expression Control) system allows re-expression of splicing isoforms from the endogenous locus.
(A) Higher contrast immunoblots as in Figure 2B. (B) Schematic illustration (left) of all predicted alternatively spliced variants of Rab11b with corresponding introns/exons (protein coding in dark blue) and specific primers (listed in excel file S1), designed to amplify 201, 202, or as many Rab11b transcripts as possible. These primers were used for reverse transcription PCR or quantative PCR (qPCR) (A2780 Ctrl or mCherry-Rab11 DExCon cells) treated with doxycycline (dox) (72 hr) followed by loading products on 2% agarose gel and additional quantification. Relative fold change/band intensity is normalized always to 201 transcript independently of cells (separated by semisolid line) used as described in Materials and methods. Mean ± SD is shown from three independent biological replicates (qPCR run in technical triplicates).
Figure 2—figure supplement 2
DExCon (Doxycycline-mediated endogenous gene Expression Control) controls Rab11a and Rab11b expression and preserves physiological localization.
(A–F) Spinning disk confocal images; scale bar=20 μm; see Videos 1–4. (A) Classical double mNeonGreen or mCherry knock-ins to Rab11a or Rab11b as indicated. (B) A2780 co-transfected (magnetofected) with cDNA for mCherry-Rab11a and GFP-Rab11b; line profile corresponds to the yellow dashed line and number reflect Pearson’s cross-correlation coefficient (average ± SEM, n=24 cells; maximum intensity Z-projection). (C–D) Double DExCon mNeonGreen-Rab11a/mCherry-Rab11b stably expressing LifeAct-iRFP670 ([C], right) or treated with siR-Tubulin (400 nM, [C], left) or (D) following uptake of Alexa-647 labeled transferrin ([TFN-647]; kymograph corresponds to dashed line; total 5 min). (E–F) Spinning disk confocal images of cells migrating in Cell-Derived Matrix acquired with same settings (only gain and exposure settings different as indicated); see Video 4. (E) Double DExCon mNeonGreen-Rab11a/mCherry-Rab11b imaging of cells. Quantification (left bottom graph) was done from n=9 (three biological replicates) similarly as depicted in plot profile (right bottom); (ratio of 0–1 normalized signal intensity between protrusion [=‘Tip’] and the average signal from 20–40 μm proximal to protrusion [=‘pre-tip area’]). Paired t-test (two-tailed). (F) mNeonGreen-Rab11a/mCherry-Rab11b double knock-in A2780 with endogenous promoter. (E–F) Kymographs on the right correspond to the white dashed line similarly as plot profile in (E); total 4.4 min. (E–F) Bottom images (zoom of yellow rectangle) highlight the imaging delay artifact of vesicle de-colocalization (F) or improved DExCon colocalization (E). All DExCon cells were dox treated for 24-48 hr.
Figure 3 with 1 supplement
Spatiotemporal control of gene re-activation with DExCon (Doxycycline-mediated endogenous gene Expression Control) and LUXon (light responsive DExCon).
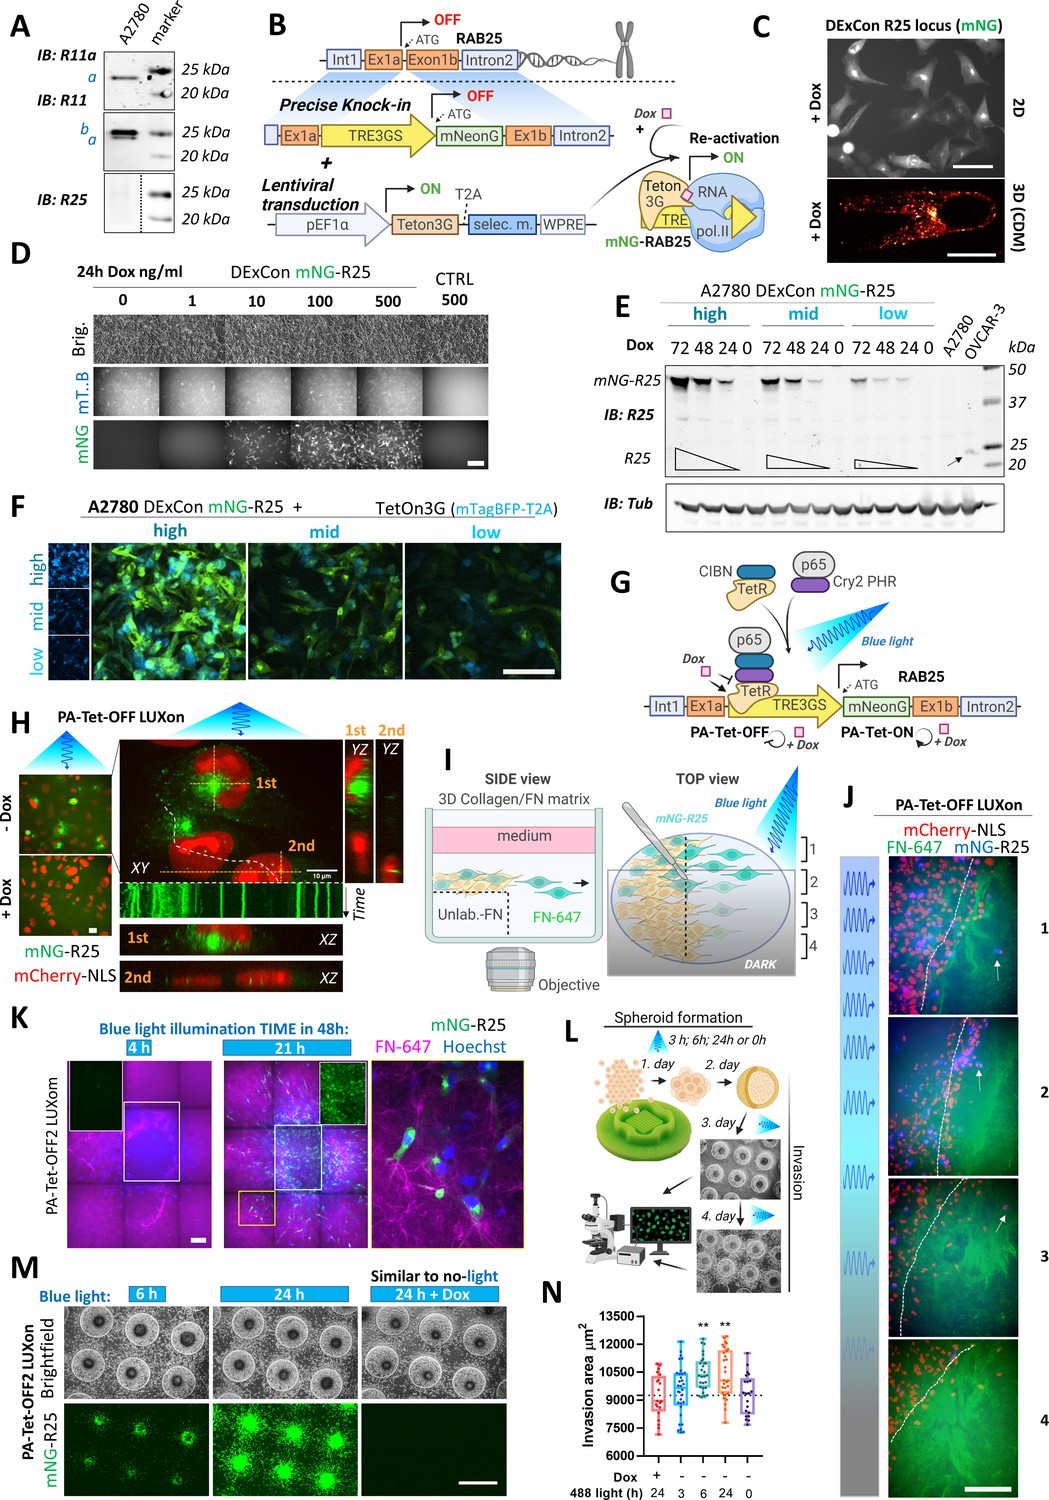
(A) Immunoblots of A2780 cells lysates probed with antibodies specific for anti-Rab11a, targeting both Rab11a/b (Rab11) or Rab25 (a=Rab11a; b=Rab11b). Tubulin, loading control. (B) Schematic of the DExCon-mNeonGreen knock-in strategy and lentiviral transduction for doxycycline (dox)-dependent re-activation of Rab25 expression. (C–D) Rab25 DExCon knock-in cells were dox treated for 24–72 hr, sorted for mNeonGreen fluorescence followed by cell growth 2 weeks without dox before re-analysis. Live fluorescence images of re-activated Rab25 fused to mNeonGreen (mNG) in A2780 24 hr after dox treatment (250 ng/ml). (C) Top: Cells on tissue culture-treated plastic (scale bar=100 µm). Bottom: Cell in cell-derived matrix (CDM) (spinning disc confocal image; scale bar=20 µm). (D) Cells exposed to increasing dox concentration imaged by brightfield and fluorescence microscopy (mT.B=Teton3G-T2A-mTagBFP; brig=brightfield; Ctrl=unmodified cells). Scale bar=100 μm. (E) Immunoblots of mNeonGreen-Rab25 DExCon re-sorted cells as indicated in Figure 3—figure supplement 1D and re-induced with dox (200 ng/ml). Lysates were probed with antibodies specific for Rab25 or Tubulin. Black arrow indicates endogenous Rab25 in OVCAR-3 cells. (F) Spinning disc confocal images of mNeonGreen-Rab25 DExCon cells (Rab25, green; Teton3G, blue), re-sorted as indicated in Figure 3—figure supplement 1D. Scale bar=100 μm. (G) Schematic illustration of the photoactivatable split PA-Tet-OFF and PA-Tet-ON constructs (Yamada et al., 2018) combined with DExCon (LUXon). (H) Spinning disc confocal images (20 × [left] or 63 × [right] objectives) of mNeonGreen-Rab25 LUXon cells (Rab25 in green) expressing PA-Tet-OFF with mCherry-NLS reporter (red) 18 hr after being illuminated by blue light (10 hr) with or without dox treatment. Orthogonaere imaged live while recycll views of top (1) or two bottom cells (2) are also shown with kymograph corresponding to white dashed line (1 s interval, total 1 min). Scale bar: 10 μm. See Videos 5–6. (I) Schematic of 3D cell-zone exclusion invasion assay; 1–4 indicate zones with different light illumination intensities across same well, and these zones are also indicated in (J): mNeonGreen-Rab25 LUXon cells (Rab25 in blue) expressing PA-Tet-OFF with mCherry-NLS as nuclear reporter (red) migrated for 24 hr into cell-free collagen matrix labeled by fibronectin (FN-647 shown as green) while being illuminated by blue light of varying intensity. Dashed line indicates scratch and white arrows indicate the most invasive cells. Scale bar=100 µm. See Video 7. (K) Spinning disc confocal images of spheroids formed by mNeonGreen-Rab25 LUXon (PA-Tet-OFF2) cells illuminated with blue light for different times across 2 days as indicated (total 4 hr vs 21 hr). Cells invading collagen matrix supplemented with FN-647 (magenta) were labeled with Hoechst 3342 (blue) for 1 hr prior imaging. Merge of all three channels, white rectangles for the mNeonGreen (Rab25, green) channel only, or zoom of the yellow rectangle is shown. Scale bar=100 µm. (L) Schematic of spheroid invasion assay ‘on chip’ and illumination protocol used in (M). mNeonGreen-Rab25 LUXon (PA-Tet-OFF2) cells (scale bar=1 mm) together with (N) quantification (n=20–32 from three independent experiments, one-way ANOVA Tukey post hoc test). All schematic illustrations were created with BioRender.com.
Figure 3—figure supplement 1
Re-activation of Rab25 expression.
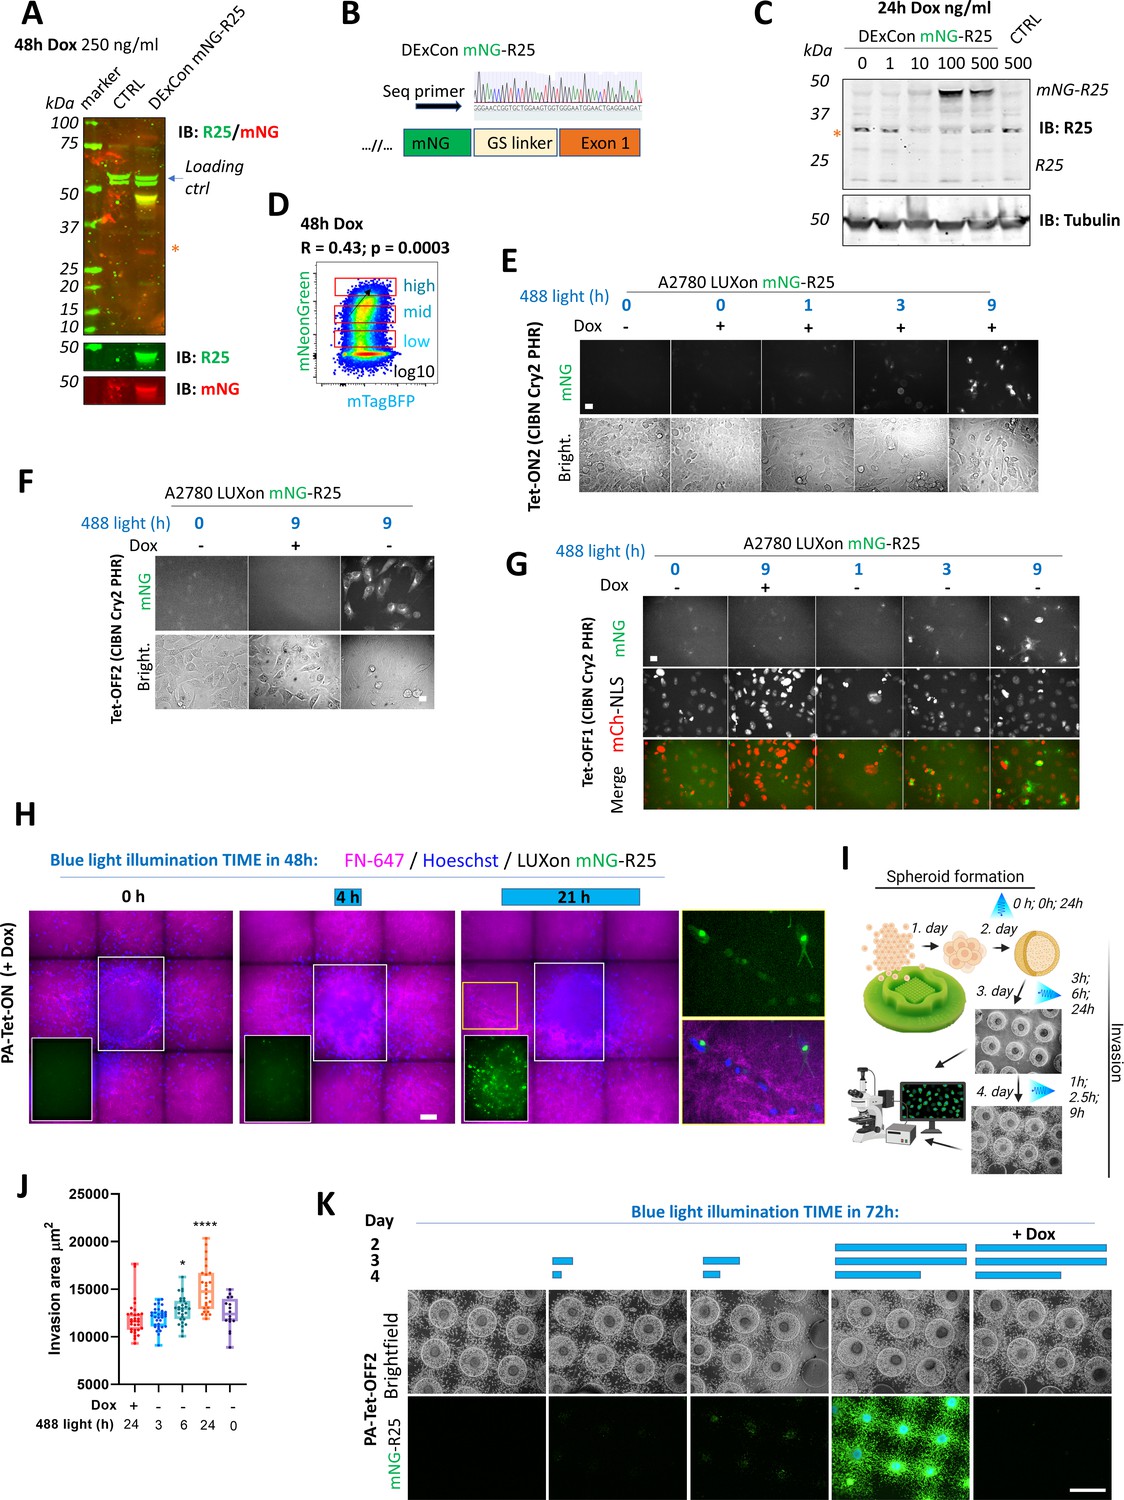
(A) Immunoblots of A2780 cell lysates (CTRL) or mNeonGreen-Rab25 DExCon (Doxycycline-mediated endogenous gene Expression Control) A2780 cells treated with doxycycline (dox) as indicated (250 ng/ml) probed with anti-Rab25 (unspecific bands here as loading control indicated by blue arrow) or anti-mNeonGreen (red stars indicate unspecific band always recognized by secondary antibody). CTRL unmodified A2780. (B) Chromatogram of mNeonGreen-Rab25 DExCon A2780 cells with schematic of knock-in outcome (seq. prim=sequencing primer). (C) Immunoblots as in (A) using different concentrations of dox to induce expression. (D) FACS of mNeonGreen-Rab25 DExCon cells re-sorted for different expression levels of Rab25. Black arrow indicates positive correlation of mNeonGreen (Rab25) and mTagBFP (Teton3G) levels; R = Pearson’s cross-correlation coefficient; p-value. (E–H) Spinning disc confocal images of mNeonGreen-Rab25 LUXon (light responsive DExCon) cells (Rab25 as mNG) expressing PA-Tet-ON or PA-Tet-OFF or their versions with an improved blue light sensitivity (ON2; OFF2) treated by dox and blue light (26.8 W/m2) as indicated. scale bar=20 μm. In case of (G) mCherry-NLS (nuclear reporter) was used. (H) Spheroids are labeled with Hoechst 3342 and allowed to invade (48 hr) collagen matrix supplemented with labeled fibronectin FN-647. Three conditions of blue light illumination (1st+2nd day) are shown as merge of all three channels, white rectangle for the mNeonGreen channel only, or zoom of the yellow rectangle. (I) Schematic of spheroid ‘on chip’ invasion assay with illumination protocol used in (J-K) with mNeonGreen-Rab25 LUXon (PA-Tet-OFF2) cells. (J) Quantification (n=16–34 per each condition from three independent experiments, one-way ANOVA Tukey post hoc test), (K) Representative fluorescence images (scale bar=1 mm). Schematic illustration was created with BioRender.com.
Figure 4 with 1 supplement
Simultaneous visualization of Rab11 family members.
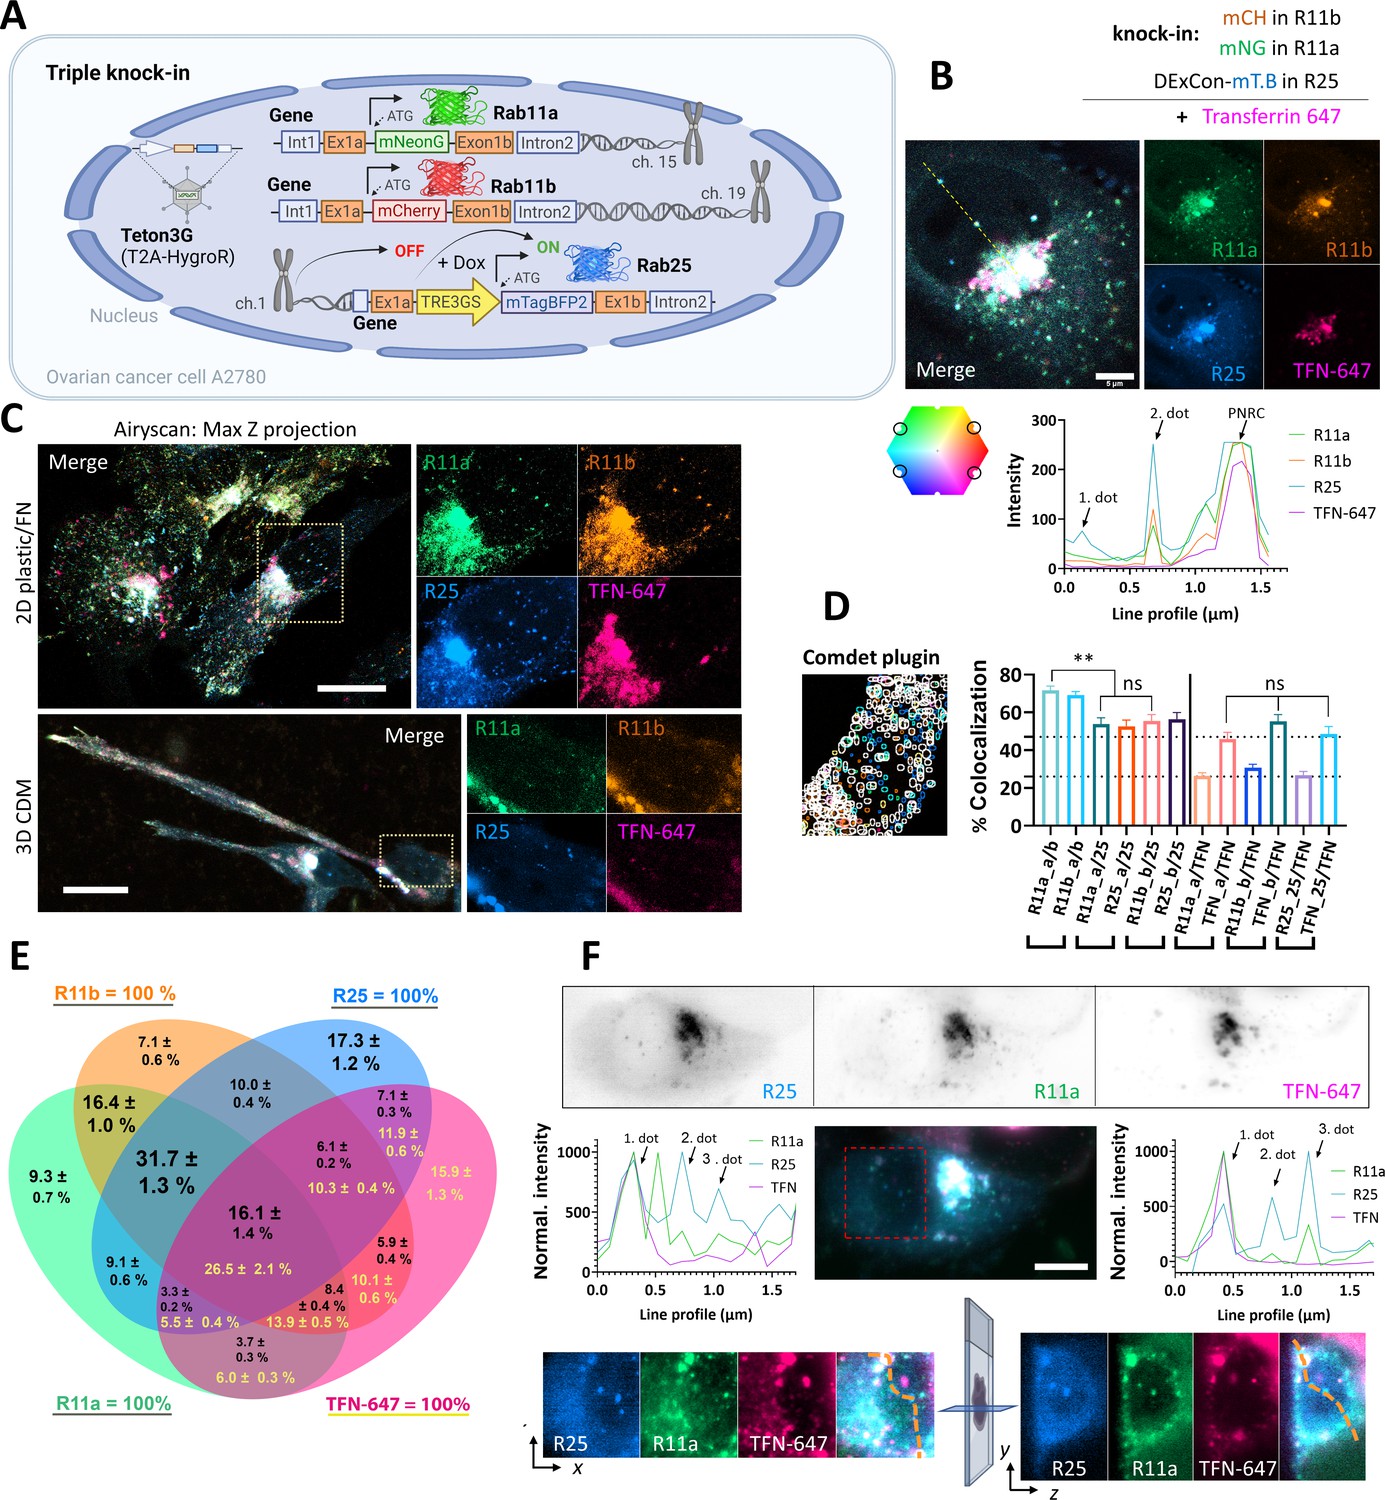
(A) Schematic of triple knock-in A2780 cells (mNeonGreen-Rab11a, mCherry-Rab11b, DExCon mTagBFP2-Rab25) created with BioRender.com. (B–D) mNeonGreen-Rab11a/mCherry-Rab11b knock-in A2708 cells were further modified with a DExCon-mTag-BFP2 module at the Rab25 locus (Tet-On transactivator introduced by lentivirus with hygromycin selection). Airyscan confocal fluorescence images of triple knock-in cells treated by doxycycline (dox) (>94 hr) trafficking Alexa-647 labeled transferrin (TFN-647, 15–60 min). Colors represent Rab11s as indicated and line profile corresponds to yellow dashed line. (B) Scale bar=5µm. (C) Maximum intensity Z-projections: top (2D, FN-coated), bottom (3D cell-derived matrix [CDM]). Scale bar=20µm; see also Videos 9–10. (D–E) dox induced (>94 hr) triple knock-in A2780 cells recycling TFN-647 were imaged and mNeonGreen/mCherry/mTagBFP2/TFN-647 positive vesicles tracked using Comdet plugin. (D) Bar graph representing the percentage of colocalizing vesicles (100 cells, 46,000 vesicles [Rab11s]; 23,000 vesicles [TFN]) and the contribution of individual channels (25- Rab25; TFN- transferrin; a- Rab11a; b- Rab11b). One-way ANOVA Tukey post hoc test used for statistical analysis. (E) Venn diagram with the percentage of colocalization for every channel as 100% total; black numbers for Rab11s; yellow for TFN-647. (F) Lattice light-sheet imaging of dox induced (>94 hr) triple knock-in A2780 cells recycling TFN-647 are shown in gray as individual channels (one focal plane) or as maximum intensity Z-projection for merged channels; scale bar=10 µm. Line profiles (normalized to maximal intensity, background subtracted) correspond to orange dashed lines, which connects the same vesicles (1. and 3. dot) in the 3D cell volume. See also Figure 4—figure supplement 1D,E and Videos 11 and 12.
Figure 4—figure supplement 1
mNeonGreen-Rab11a, mCherry-Rab11b, and DExCon-mTagBFP2-Rab25 triple knock-in.
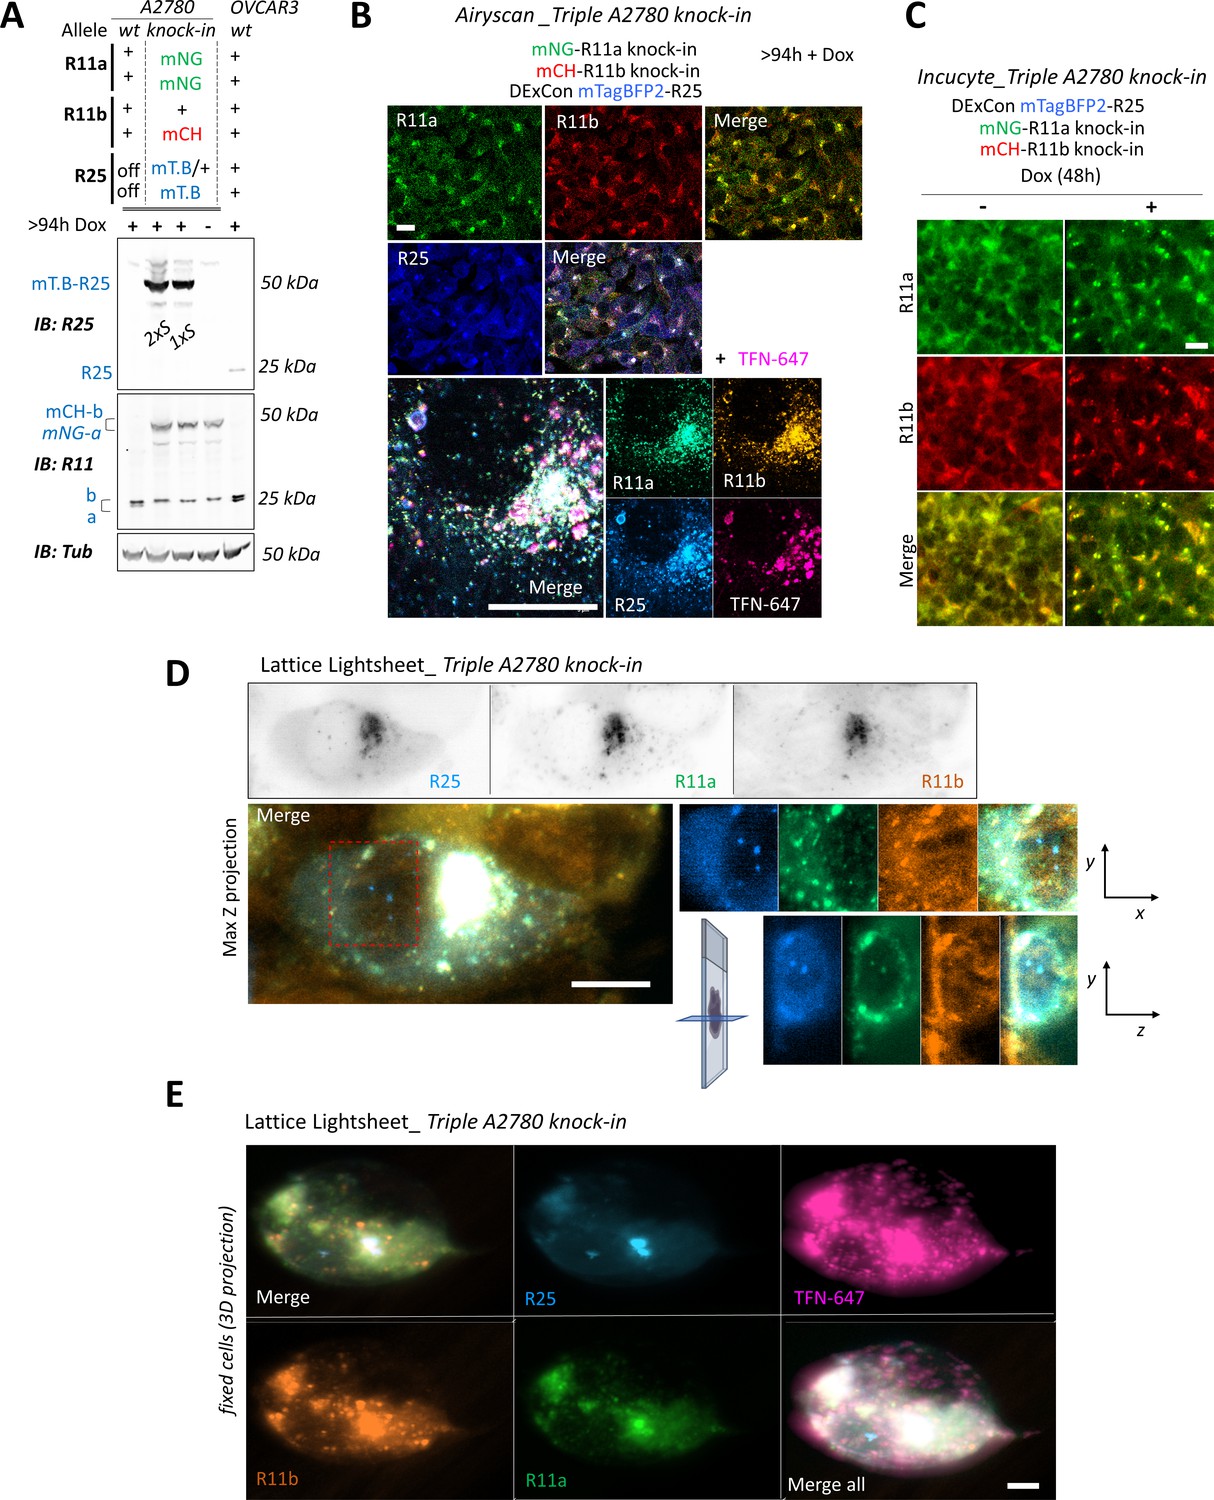
(A–E) Triple knock-in A2780 cells (mNeonGreen-Rab11a, mCherry-Rab11b, mTagBFP2-Rab25 DExCon) treated by doxycycline (dox) (>94 hr); (B–E) recycling Alexa-647 labeled transferrin (TFN-647, 30 min). (A) Immunoblots. Fluorescent antibodies: anti-Rab11 targeting both Rab11a/b (Rab11), anti-Rab25 (R25) shown as black and white; Tubulin (Tub), loading control. wt=unmodified A2780 or OVCAR3; a=Rab11a; b=Rab11b (heterozygote); R25=Rab25±fluorophore knock-in. Sorted (1 or 2×S). (B) AiryScan fluorescence images (LSM880, 63×; scale bar=20 µm). (C) Images obtained by Incucyte S3 system (scale bar=20 µm). (D) Lattice LightSheet images (3i, scale bar=10 µm; live cells); one focal plane or maximum intensity Z-projection for merged channels with increased contrast. See also Figure 4F and Video 11. (E) Lattice LightSheet images (3i, scale bar=5 µm) of fixed cells (3D projection using Imaris Cell Imaging Software); See also Video 12.
Figure 5 with 3 supplements
DExCon (Doxycycline-mediated endogenous gene Expression Control) reveals protein expression kinetics and dynamics of relocalization.
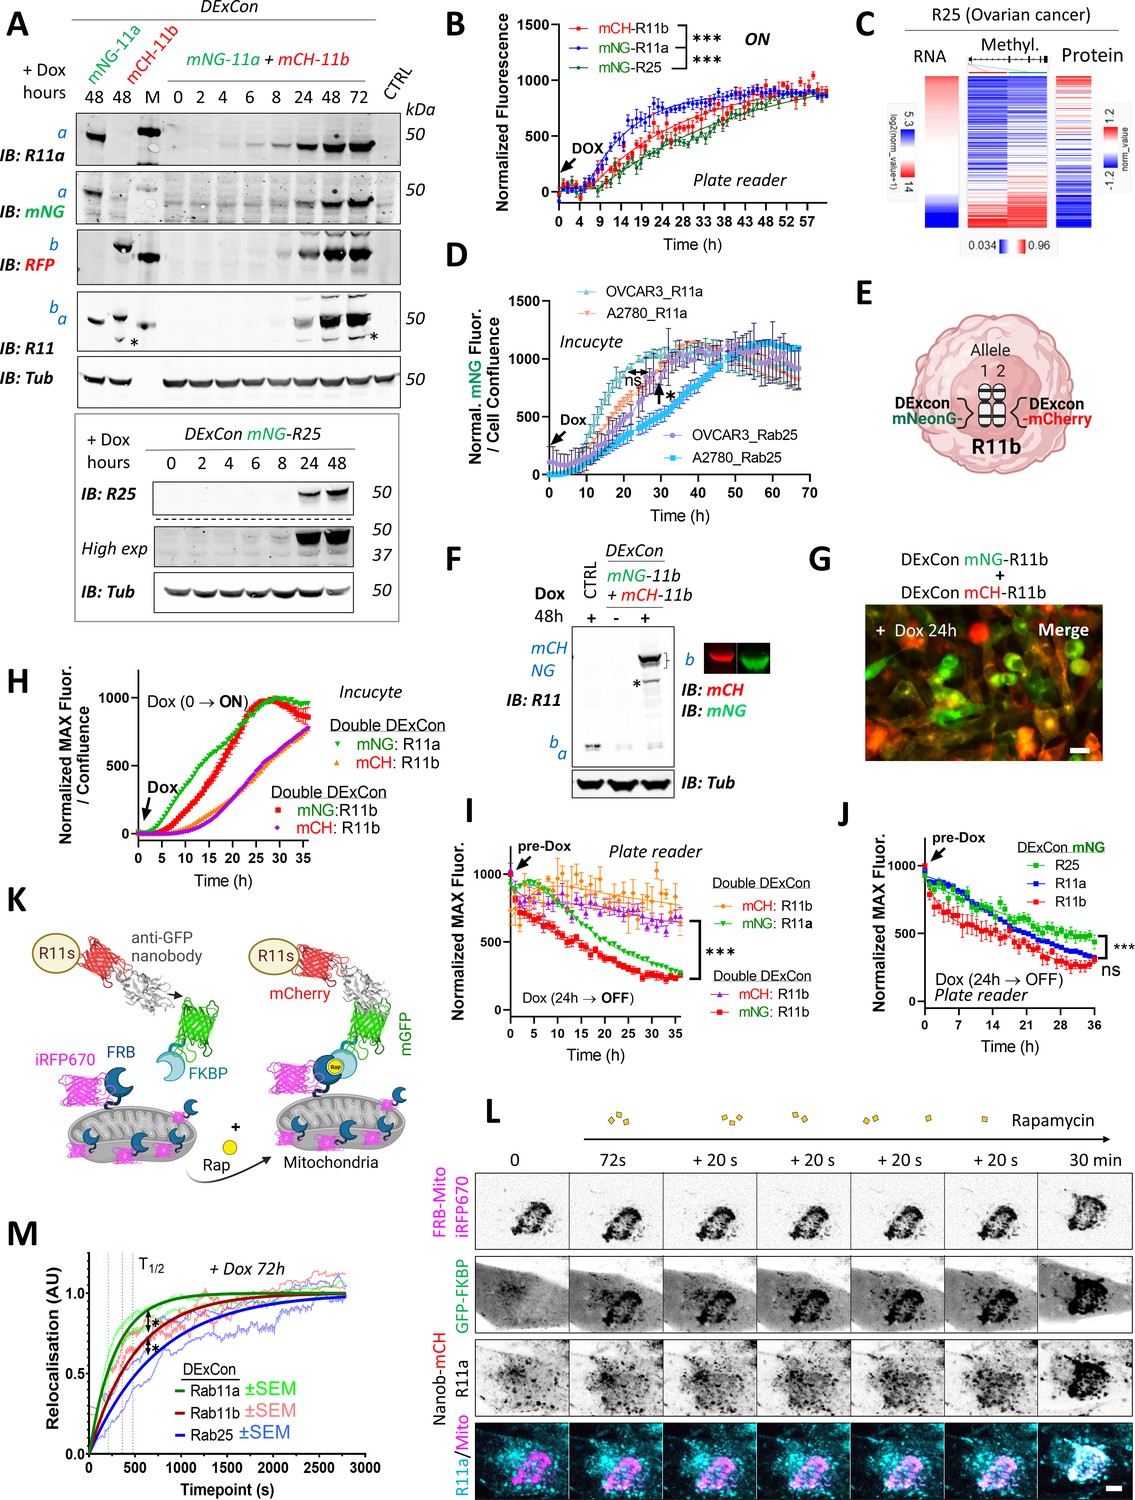
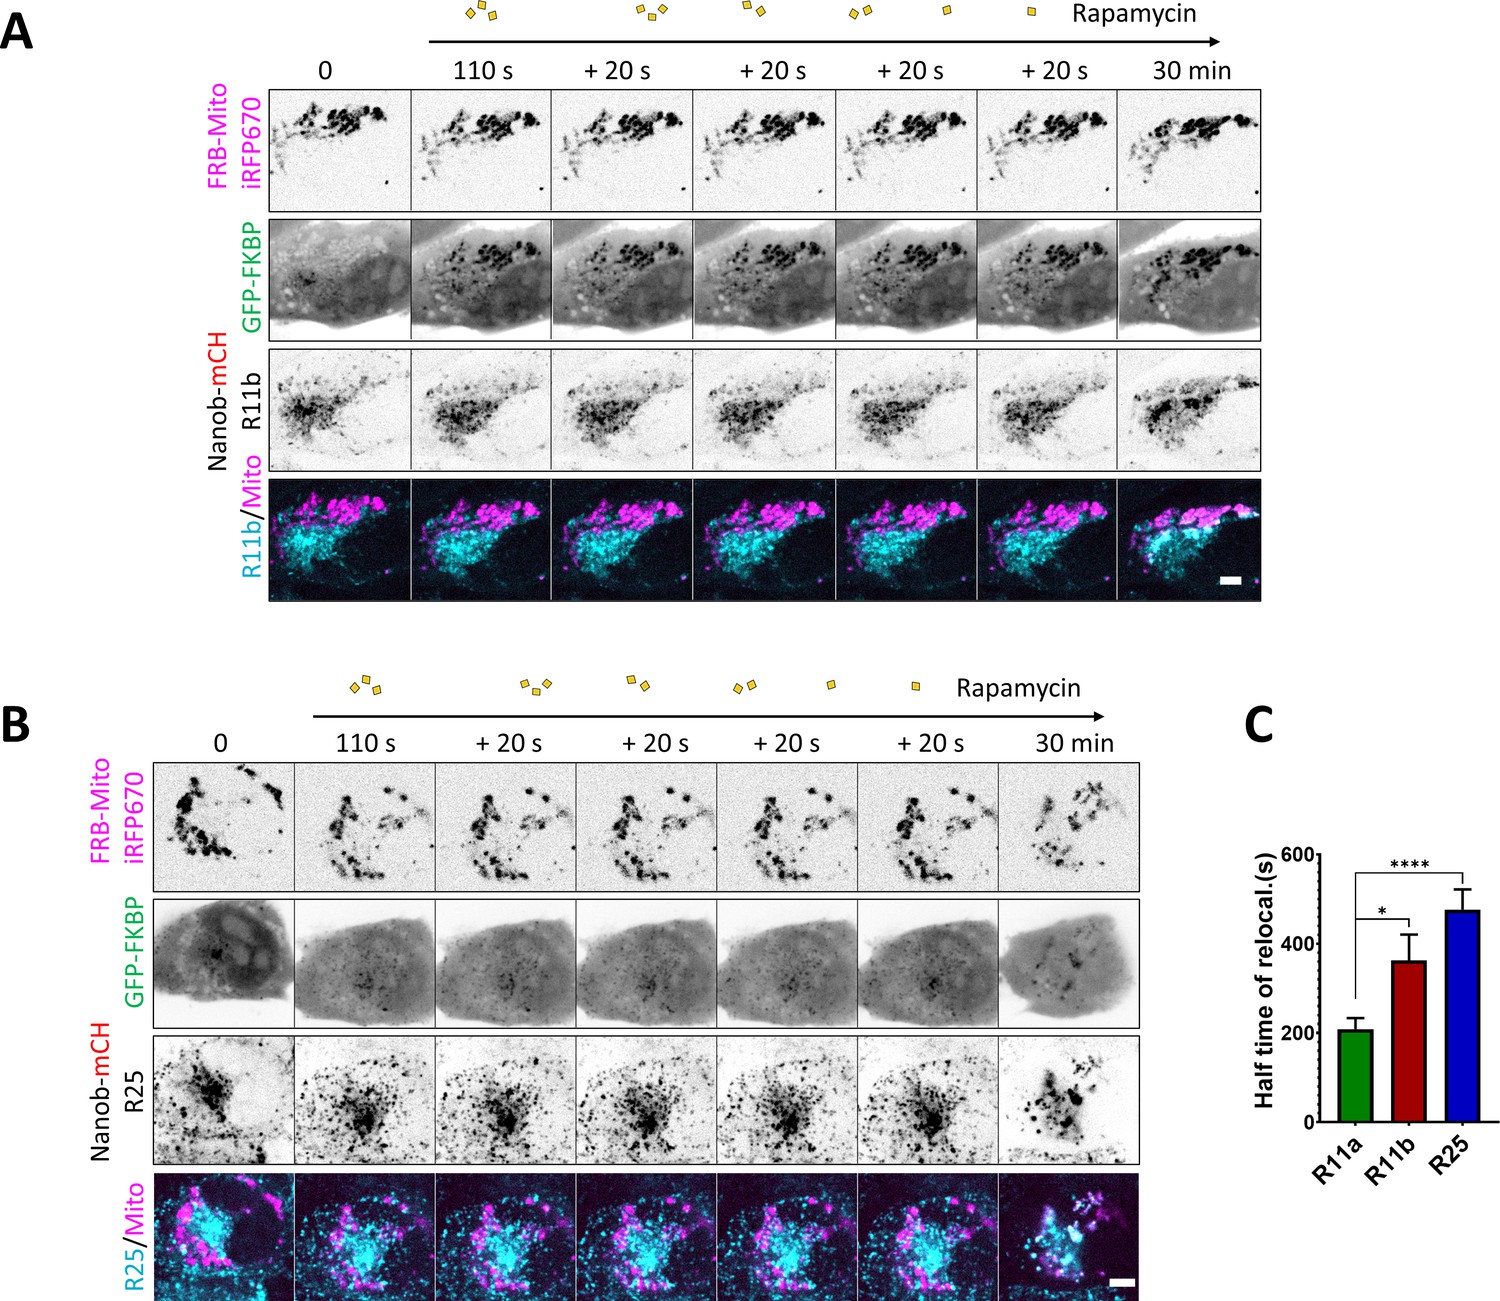
(A) Immunoblots of mNeonGreen-Rab11a and mCherry-Rab11b DExCon or double DExCon A2780 cells (top) and mNeonGreen-Rab25 DExCon cells (bottom) treated or not treated with doxycycline (dox) for the time indicated (hours). Anti-mNeonGreen (mNG), anti-mCherry (RFP; mCH), anti-Rab25, anti-Rab11a, or anti-Rab11 targeting both Rab11a/b (Rab11) were used to probe expression levels. Tubulin (Tub), loading control. M=marker; CTRL=unmodified wt A2780; a=Rab11a, b=Rab11b, c=Rab25±fluorophore knock-in. Stars indicate mCherry/iRFP670 lower molecular weight band caused by hydrolysis during sample preparation Gross et al., 2000. (B) Comparison of expression kinetics of DExCon-modified mNeonGreen-Rab11a/mCherry-Rab11b/mNeonGreen-Rab25 (dox added at t=0, arrow) using a BioTek Synergy H1 microplate reader. Cells were seeded confluent and fluorescence normalized to the maximal intensity. One-way ANOVA and Holm-Sidak post hoc tests were used for statistical analysis: n=6–9 from three independent experiments comparing normalized fluorescence intensity at 24 hr. (C) Bioinformatic analysis of DNA promoter methylation (Methylation27K) of Rab25 and its expression (RNAseq; RPPA) in ovarian cancer (OV) using UCSC Xena (TCGA Pan-Cancer study). (D) Comparison of expression kinetics of DExCon modified mNeonGreen-Rab11a or mNeonGreen-Rab25, generated in A2780 or OVCAR-3 cells, induced by dox at t=0 (left arrow) and analyzed using Incucyte S3 imaging system. Readings were normalized to maximal fluorescence intensity and cell confluence (representative graph is shown with mean ± SD; one-way ANOVA and Tukey post hoc test used for statistical analysis). (E) Schematic of double DExCon modification, targeting both Rab11b alleles/loci with different fluorophores within the same cell. (F) Immunoblots or (G) fluorescence images (scale bar=100 µm) of mNeonGreen/mCherry-Rab11b double DExCon cells A2780 treated±dox. Blots were probed with anti-mNeonGreen (mNG), anti-mCherry (RFP), and anti-Rab11 targeting both Rab11a/b (Rab11)-specific antibodies. Tubulin (Tub), loading control. CTRL=unmodified wt A2780; a=Rab11a; b=Rab11b±knock-in fluorophore. (H–I) Comparison of mNeonGreen-Rab11a/mCherry-Rab11b or mNeonGreen-Rab11b/mCherry-Rab11b double DExCon expression kinetics (H) triggered by dox (arrow; normalized and shown as in D) or their protein stability (I). (J) Comparison of DExCon induced mNeonGreen-Rab11a/Rab11b/Rab25 protein stability. (I–J) Cells pre-induced with dox for 24 hr followed by dox removal (see arrow; microplate reader BioTek Synergy H1). Cells were seeded confluent and fluorescence normalized to the maximal intensity. Mean ± SEM (9–18 repeats gathered from three to six independent experiments). Curves were fitted by fifth-order polynomial function; one-way ANOVA with Tukey post hoc test used for statistical analysis. (K) Schematic of knocksideways combined with DExCon antiGFPnanobody-mCherry-Rab11 family modification. (L) Representative confocal fluorescence timelapse images of antiGFPnanobody-mCherry-R11a DExCon modified cells induced with dox for 72 hr (scale bar=5 µm; see Figure 5—figure supplement 3A,B for Rab11b and Rab25). Cells were co-magnetofected with FRB-Mito-iRFP670 and GFP-FKBP on 96 well ibidi imaging plate 24 hr before imaging and their heterodimerization induced by 200 nM rapamycin as indicated. Halftime of Rab11a/b/25 relocalization fitted and quantified (M); for statistics see Figure 5—figure supplement 3C, n=10–18 from three to four independent experiments.
Figure 5—figure supplement 1
Protein expression kinetics and stability are revealed using DExCon (Doxycycline-mediated endogenous gene Expression Control).
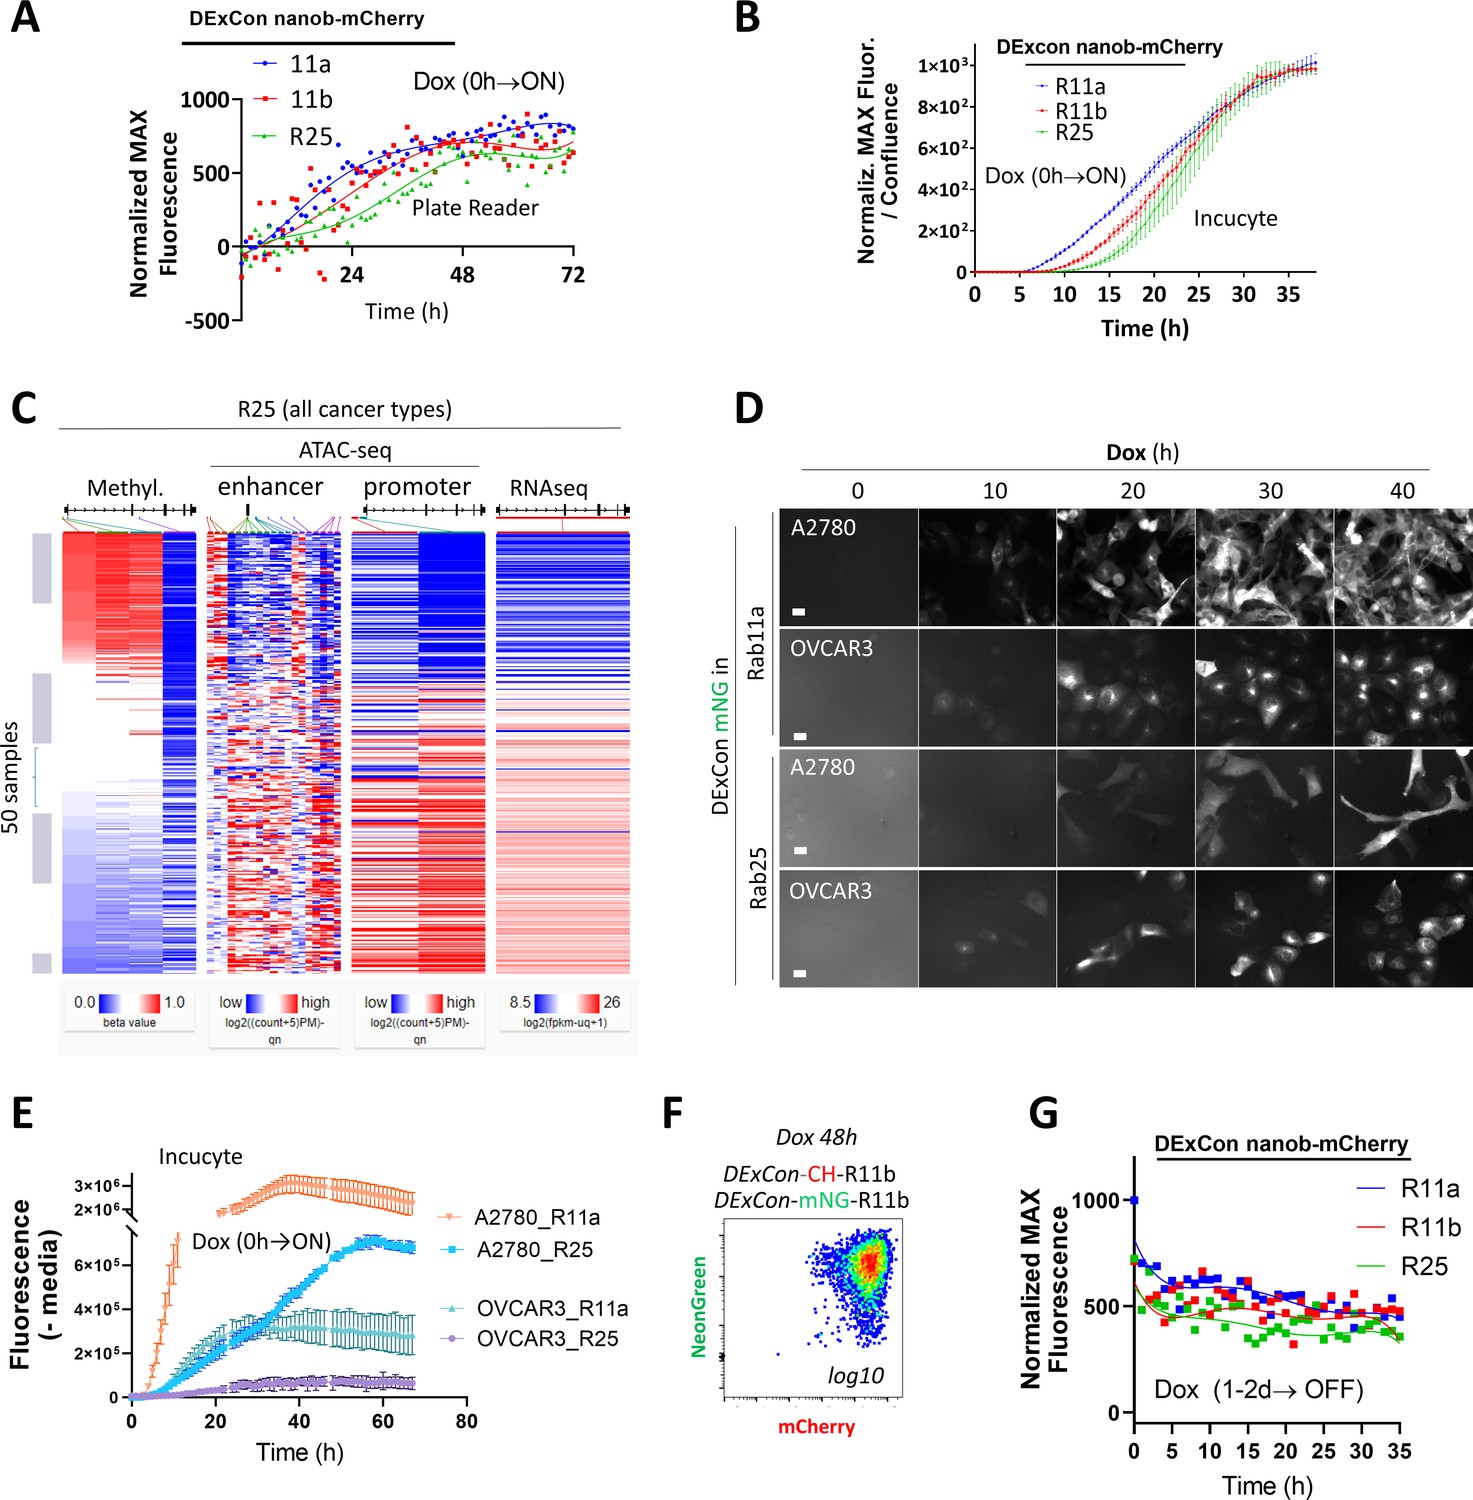
(A–B) Comparison of expression kinetics of DExCon antiGFPnanobody-mCherry-Rab11s by microplate reader (A) or Incucyte S3 (B). Representative examples are shown from three independent experiments; (A) fitted by fifth order polynomial function; cells seeded confluent fluorescence normalized to the maximal intensity. (B) Mean ± SEM; normalized to maximal fluorescence intensity and cell confluence. (C) Bioinformatic analysis of Rab25 in all cancer types using UCSC Xena; GDC Pan-Cancer (PANCAN) study: DNA promoter methylation (Methylation450K), RNA expression (RNAseq), and compactness of chromatin structure in its promoter and enhancer regions (ATAC-seq). (D) Representative fluorescence timelapse images of DExCon mNeonGreen-Rab11a or -Rab25, generated in A2780 or OVCAR-3 cells, following dox induction (Incucyte S3) and (E) absolute fluorescence intensity quantification normalized to cell confluence (Incucyte S3). See also Figure 5D. (F) FACS of mNeonGreen/mCherry Rab11b double DExCon cells (dox 48 hr; 2× sorted). See also Figure 5G. (G) Comparison of DExCon antiGFPnanobody-mCherry-Rab11s (A2780) protein stability. Cells pre-induced by dox for 24–48 hr followed by dox removal and fluorescence determined by microplate reader. Cells were seeded confluent and fluorescence normalized to the maximal intensity (1000). Curves fitted by fifth order polynomial function are shown (n=12; four independent experiments).
Figure 5—figure supplement 2
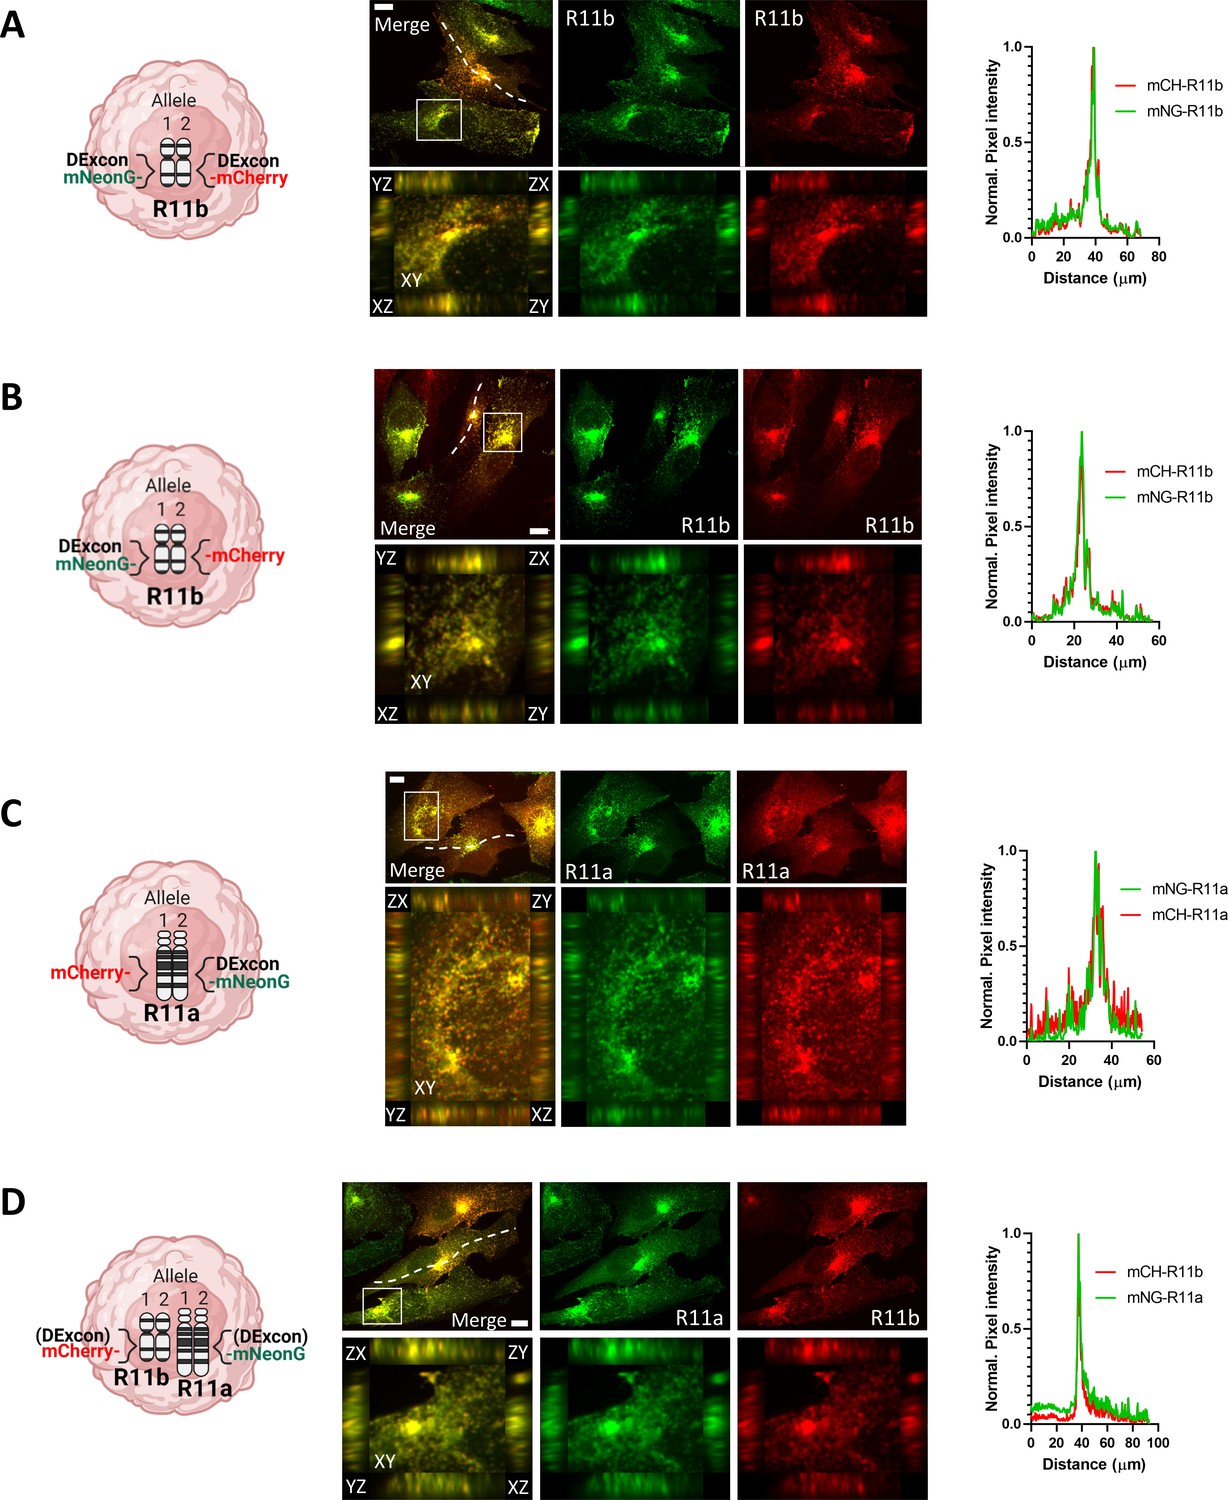
Simultaneous visualization of different alleles of the same Rab11 gene by using DExCon (Doxycycline-mediated endogenous gene Expression Control).
(A–D) Spinning disk confocal images of fixed knock-in A2780 cells as indicated in the figure (knock-in cells were doxycycline [dox] pre-induced for 24 hr, sorted, left for 3–4 weeks in dox-free media before reinduction with dox for 24 hr); immunostained as described in Materials and methods (anti-RFP/Alexa-594; anti-mNeonGreen/ALEXA-488); one focal plane or orthogonal views of 3D projections in zoom area; plot profiles corresponds with the dashed lines; scale bar=10 μm.
Figure 5—figure supplement 3
Protein dynamics are revealed using DExCon (Doxycycline-mediated endogenous gene Expression Control).
(A–B) Representative confocal fluorescence timelapse images of antiGFPnanobody-mCherry-R11b (A) or -Rab25 (B) DExCon cells induced with dox for 72 hr (see also Figure 5K and L). Cells were co-magnetofected with FRB-Mito-iRFP670 and GFP-FKBP on 96 well ibidi imaging plate 24 hr before imaging and their heterodimerization induced by 200 nM rapamycin as indicated. Scale bar=5 µm. (C). Halftime of Rab11a/b/25 relocalization were fitted (see Figure 5M) and quantified. Bars represent mean ± SEM; n=10–18 from three to four independent experiments, one-way ANOVA with Tukey post hoc test used for statistical analysis.
Figure 6 with 4 supplements
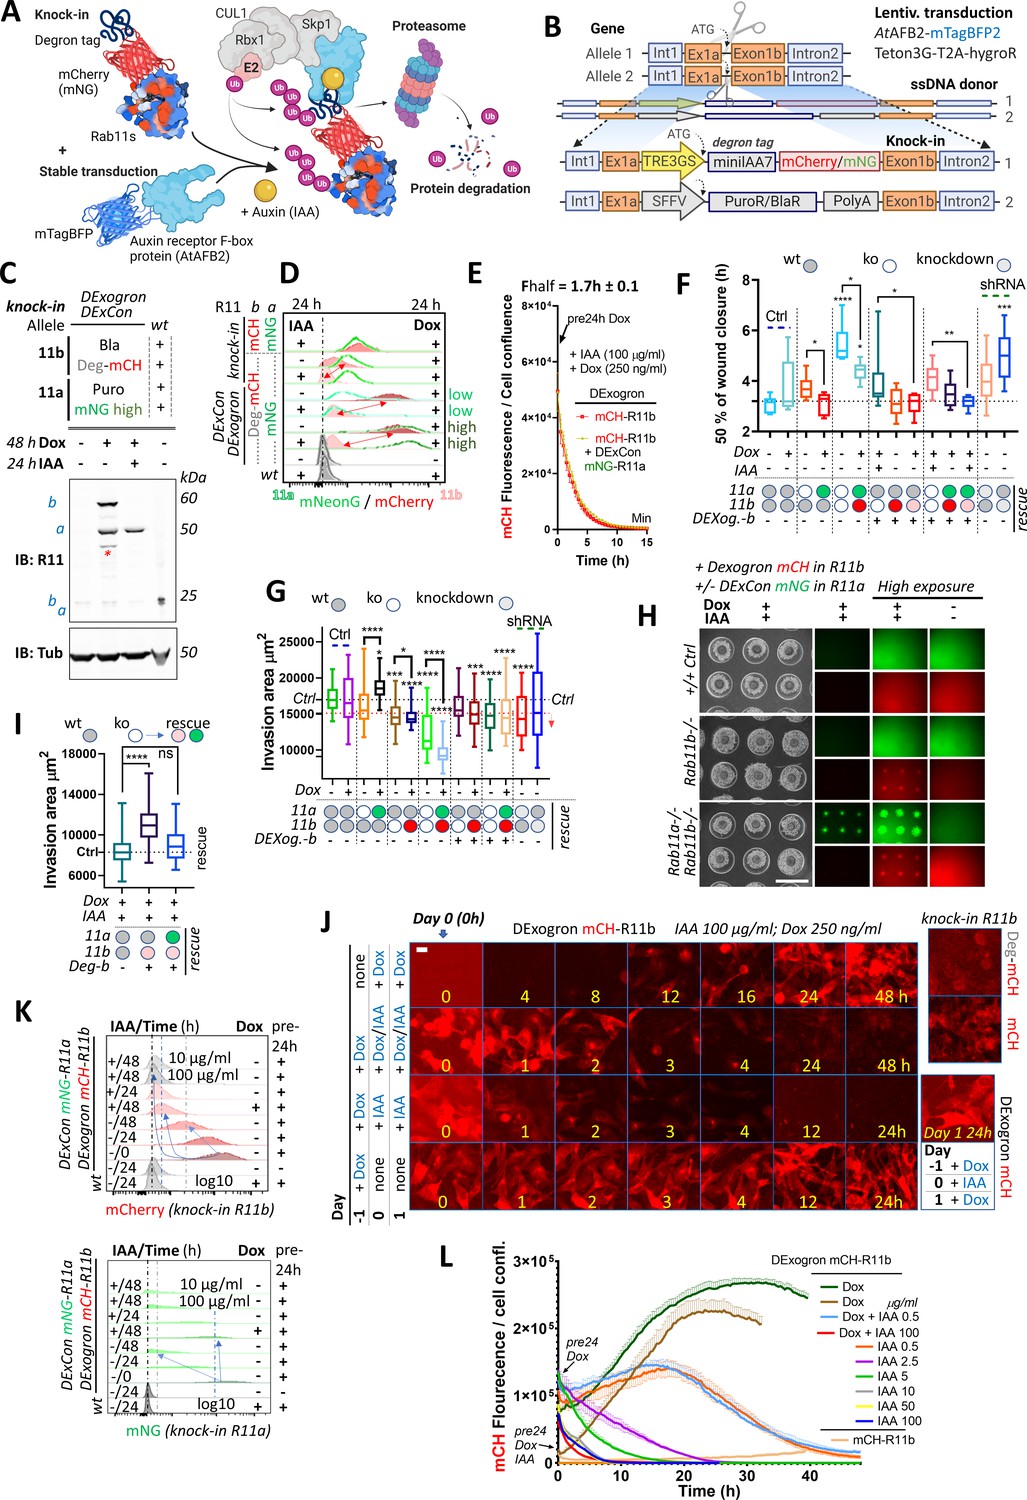
DExogron (DExCon combined with auxin-mediated targeted protein degradation): a tunable approach to modify protein levels within cells.
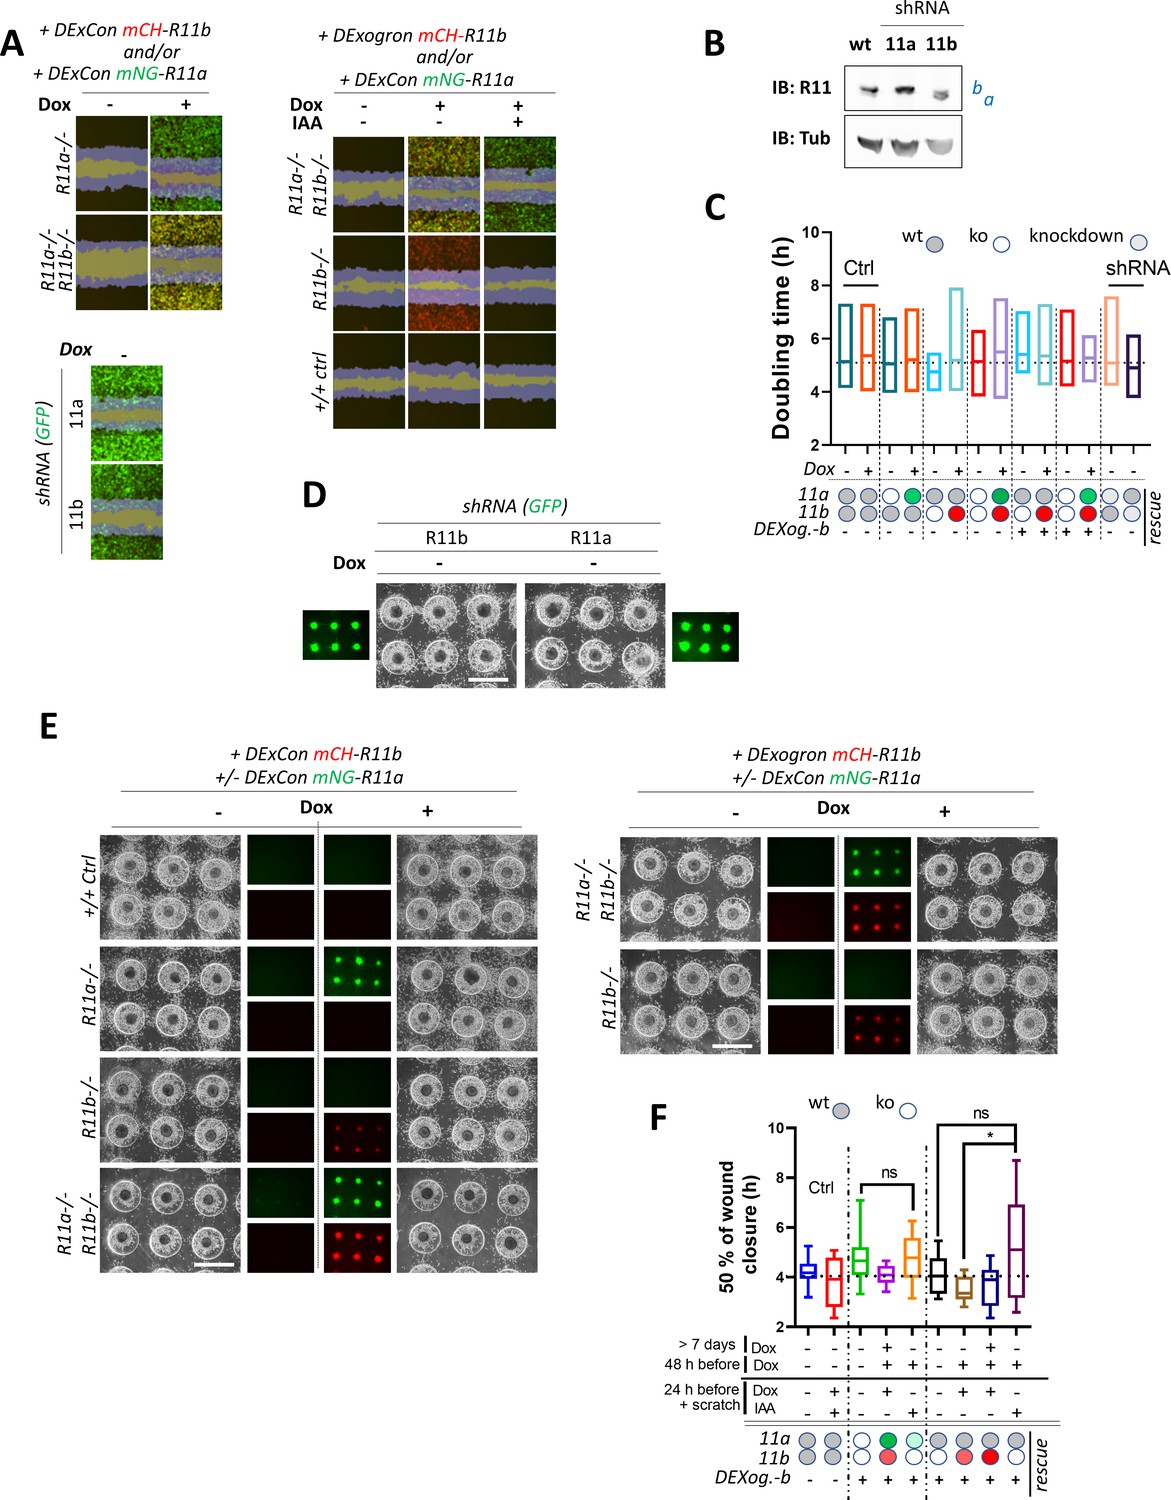
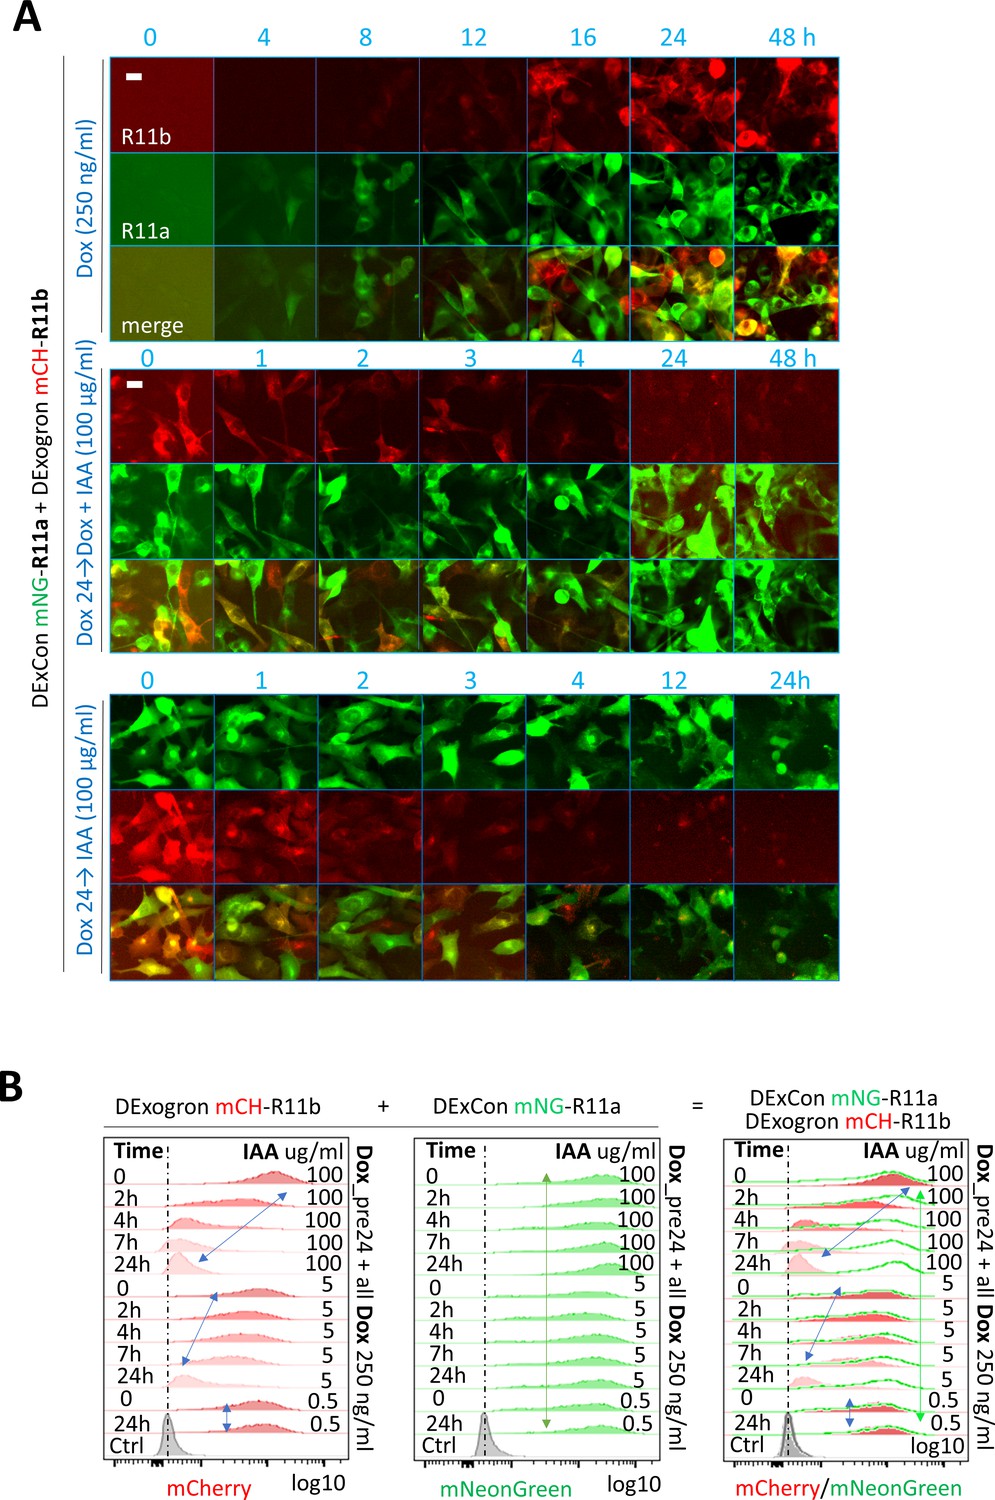
(A) Schematic illustration of an improved auxin-inducible degron system with low-basal degradation (Li et al., 2019) used in this study. Degron tag=miniIAA7. (B) Schematic of components of knock-in cassette used for DExogron, together with second donor cassette (providing antibiotic resistance) independently targeting another allele. A2780 cells stably expressing AtAFBP2 and Teto3G-T2A-HygroR were used for knock-in; mCH=mCherry (red); mNG=mNeonGreen (green). All schematic illustrations were created with BioRender.com. (C) Immunoblots of mNeonGreen-Rab11a DExCon (sorted for high; the full blot with also cells sorted for low in Figure 6—figure supplement 1F)/miniIAA7(=Deg)-mCherry-Rab11b DExogron cells treated or not treated with doxycycline (dox) (250 ng/ml)±IAA (Indole-3-acetic acid as a source of auxin; 100 μg/ml). Bla/Puro represents Puromycin or Blasticidine resistance given by additional knock-in outcomes. Blots were probed with anti-Rab11 antibody targeting both Rab11a/b (Rab11). Tubulin (Tub), loading control. wt=unmodified A2780; a=Rab11a; b=Rab11b ±fluorophore knock-in. Stars indicate mCherry/iRFP670 lower molecular weight band caused by hydrolysis during sample preparation (Gross et al., 2000). (D) FACS analysis of DExogron-mCherry-Rab11b/DExCon-mNeonGreen-Rab11a (sorted for high or low) A2780 cells or classical Rab11a/Rab11b double knock-in cells±miniIAA7 (=Deg) without the TRE3GS promoter are shown. Cells were treated ±dox (250 ng/ml) ±IAA (100 μg/ml) for 24 hr as indicated. Red arrows indicate the dynamic range of mCherry intensity change. wt=unmodified A2780. Dashed line indicates negative Ctrl. Log10 scale shown. (E) Degradation kinetics of DExogron-mCherry-Rab11b (±DExCon-mNeonGreen-Rab11a; See also Figure 6—figure supplement 1G) analyzed by Incucyte imaging. Cells were pre-treated by dox for 24 hr followed by dox/IAA co-treatment as indicated and half-time of mCherry fluorescence decrease calculated. The mean of six replicates from three independent experiments is shown ± SEM. (F) Confluent cells were pre-treated for 24±dox (250 ng/ml)±IAA (100 μg/ml), scratch wounds introduced and imaged in phenol red-free RPMI ±dox/IAA as indicated. a-/- or b-/- knock-out shown as white circle; DExCon-mNeonGreen-Rab11a (rescue shown as green oval); DExCon- or DExogron(=Dexog.)-mCherry-Rab11b (rescue shown as red or pink oval indicating low mCherry expression) Box and whisker plot of 2D scratch wound migration (n=3–9 repeats from three independent experiments), shown as time required to close 50% of the normalized wound area. One-way ANOVA analysis Tukey post hoc test used for statistical analysis. (G–I) On-chip spheroid invasion assay of cells described in (F), migrating (72 hr) in collagen matrix supplemented with FN and treated ±dox (250 ng/ml)±IAA (100 μg/ml) as indicated (pre-induced for 24 hr). (G) Quantification of spheroid invasion ±dox (n=48–76 from three independent experiments). Black dotted line indicates Ctrl, red line is the threshold of statistical significance (see right arrow; statistics as described in F). See also Figure 6—figure supplement 2D-F. (H) Brightfield and fluorescence images of spheroids with lower or higher exposures (scale bar=1 mm) co-treated by ±dox/IAA and quantification of their invasion capacity (I). (J) Timelapse images of DExogron-mCherry-Rab11b A2780 cells (Incucyte, scale bar=20 µm). Cells were treated with dox/IAA as indicated. mCherry fluorescence intensity compared with classical endogenous Deg-mCherry-Rab11b or mCherry-Rab11b tagging (on the right). See Video 14. (K) FACS of DExCon/DExogron-Rab11a/Rab11b cells treated as indicated (dox 250 ng/ml; IAA 100 μg/ml if not stated otherwise). Pre-24 hr=dox pre-treatment for 24 hr prior analysis; wt=A2780 without CRISPR knock-in. Blue arrows and dashed lines indicate the rate at which signal intensity decreases. log10 scale is shown. (L) The effect of different dox, dox/IAA, or IAA levels (as indicated cells were dox or dox/IAA pre-treated for 24 hr) on fluorescence of DExogron-mCherry-Rab11b (conventional mCherry-Rab11b knock-in for comparison without any treatment; top right) analyzed by Incucyte S3 system from images as shown in (J). Representative curves of mCherry fluorescence normalized to cell confluence (three replicates ± SEM) are shown.
Figure 6—figure supplement 1
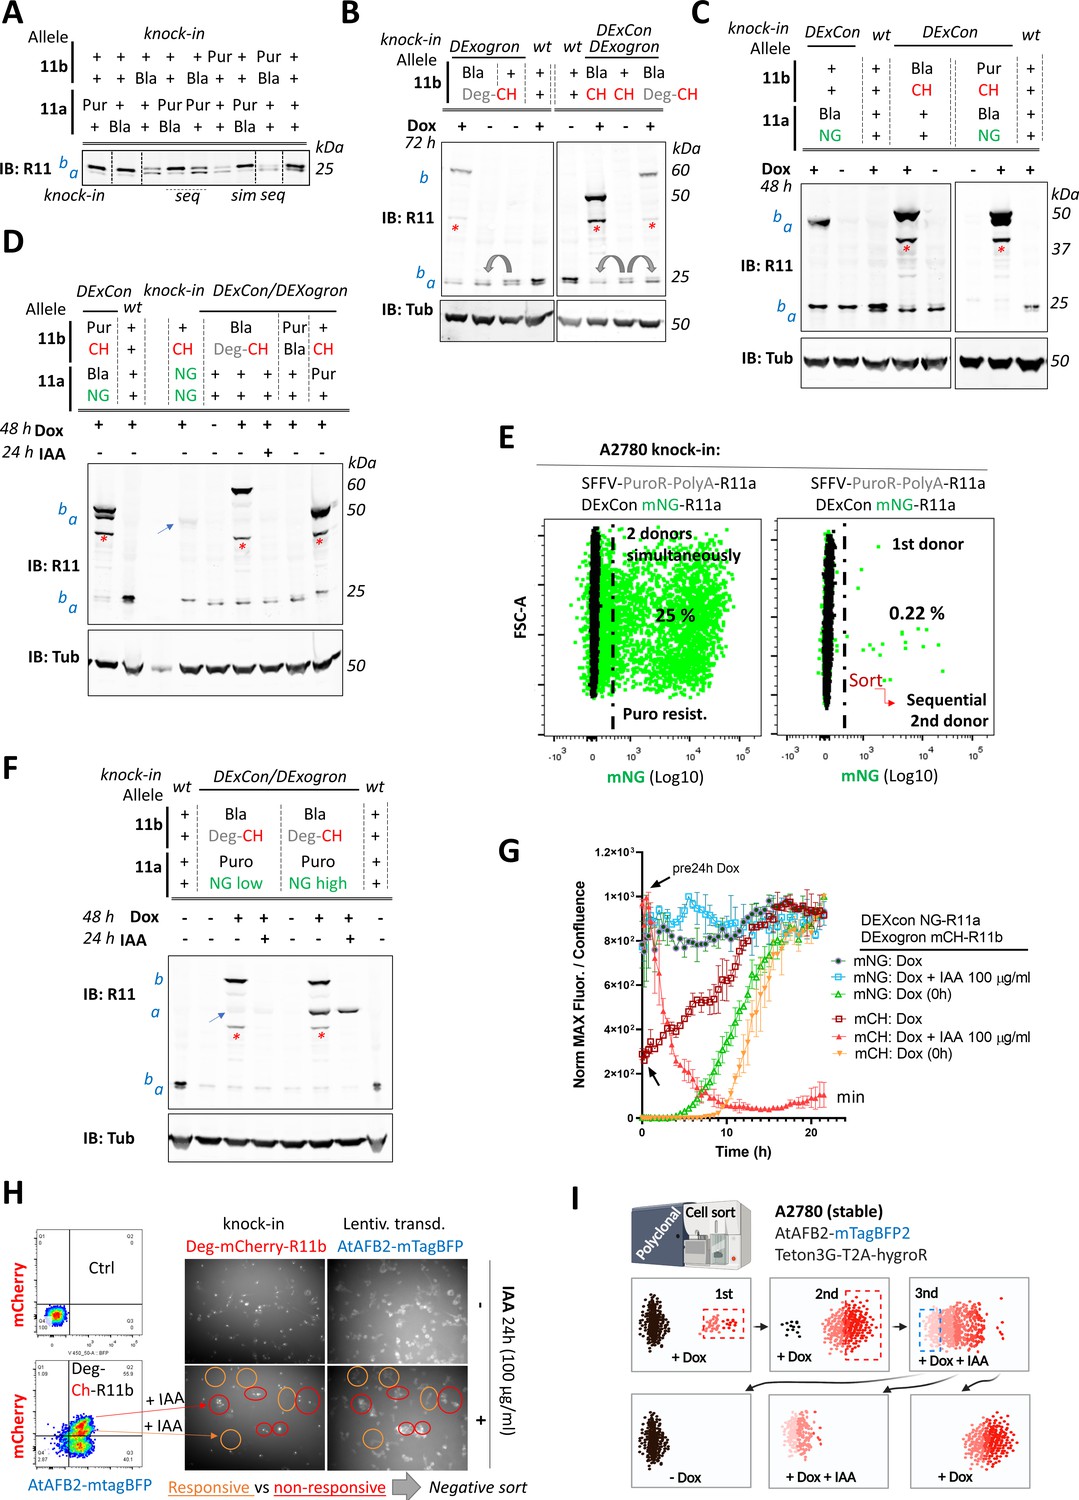
The DExogron (DExCon combined with auxin-mediated targeted protein degradation) module can tune protein levels within cells.
(A–D, F) A2780 cells were CRISPR modified to introduce different cassettes to Rab11a, Rab11b, or both loci. Different alleles were targeted as indicated (±DExCon); Puro/Bla: Puromycin or Blasticidine resistance was introduced with SFFV promoter and PolyA (see Figure 6B) and led to DExCon or DExogron knock in improvement (gray arrows). Immunoblots were probed with anti-Rab11 antibody targeting both Rab11a/b (Rab11). Tubulin (Tub), loading control. wt=unmodified A2780; a=Rab11a; b=Rab11b ±FP knock-in (blue arrows indicate mNeonGreen-Rab11a DExCon band sorted for low or endogenously tagged mNeonGreen/mCHerry-Rab11a or b). Red stars indicate mCherry/iRFP670 lower molecular weight band caused by hydrolysis during sample preparation (Gross et al., 2000). miniIAA7=Deg; CH=mCherry; NG=mNeonGreen. Cells were treated ±dox ±Indole-3-acetic acid (IAA) as indicated. Sequential (seq) or simultaneous (sim) knock-in of two different donors is highlighted in (A) and compared for percentage of cells expressing mNeonGreen-Rab11a DExCon by FACS (E). Percentage of mNeonGreen positive cells (left selected for puromycin resistance) is shown after CRISPR based knock-in in green. Black: unmodified A2780 Ctrl. (G) Expression and degradation kinetics of Dexogron-mCherry-Rab11b/DExCon-mNeonGreen-Rab11a cells (A2780) analyzed by Incucyte imaging. Cells treated ±dox (250 ng/ml) ± IAA as indicated (arrows indicate dox stimulation, 24 hr before analysis). Curves normalized to maximal fluorescence intensity and cell confluence, mean of three independent experiments ± SD is shown. (H) FACS and fluorescence images of miniIAA7-mCherry-Rab11b knock-in A2780 cells stably expressing AtAFB2-mTagBFP (2× sorted)±IAA as indicated. IAA responsive (middle population, left bottom, and orange ovals) and non-responsive cells (top population, left bottom, and red ovals) are indicated. Ctrl=unmodified A2780. (I) Pipeline that maintains polyclonal CRISPR modified cells (three cycles of sort, first two for the knock-in cell enrichment followed by negative sort to obtained IAA responsive cells). Illustration created with BioRender.com.
Figure 6—figure supplement 2
DExCon (Doxycycline-mediated endogenous gene Expression Control)/DExogron (DExCon combined with auxin-mediated targeted protein degradation) reveal the contribution of Rab11a/b to migration and invasion.
(A–F) a-/- or b-/- knock-out shown as white circle; DExCon-mNeonGreen-Rab11a (rescue shown as green oval); DExCon- or DExogron(=Dexog.)-mCherry-Rab11b (rescue shown as red or pink oval indicating low mCherry expression); Ctrl A2780 targeted by short hairpin RNA (shRNA) anti-Rab11a or b (see arrows). (A) Confluent cells were pre-treated for 24±dox (250 ng/ml)±Indole-3-acetic acid (IAA) (100 μg/ml), scratch wounds introduced and imaged in phenol-free RPMI±dox/IAA as indicated. Scratch wound migration experiments were imaged and analyzed by Incucyte (blue mask shown based on brightfield image taken at time 0 and 6 hr after the scratch together with mCherry=red/mNeonGreen=green; fluorescence; yellow = double rescue). For quantification see Figure 6F and Video 16. (B) Immunoblot of Rab11a/b shRNA in A2780 cells. Blots were probed with anti-Rab11 antibody targeting both Rab11a/b (Rab11). (C) Proliferation rate calculated as doubling time (h) from brightfield images generated and automatically analyzed as cell confluence area change (0–72 hr) using Incucyte. (D–E) On-chip spheroid invasion assays. Cells migrated into collagen matrix supplemented with FN and treated ±dox (250 ng/ml) as indicated (24 hr pre-induced). See also Figure 6H and for quantification Figure 6G1. Brightfield and fluorescence images (scale bar=1 mm). (F) Confluent cells were pre-treated for 24 or >days ± dox (250 ng/ml), switched to ± IAA (10 µg/ml) or ± dox and scratch wounds introduced and imaged in phenol-free RPMI±dox/IAA as indicated. Box and whisker plot of 2D scratch wound migration (n=7–20 repeats from three independent experiments), shown as time required to close 50% of the normalized wound area. One-way ANOVA analysis Tukey post hoc test used for statistical analysis. See also Figure 6F.
Figure 6—figure supplement 3
Characterization of DExCon-Rab11a/DExogron-Rab11b cells.
(A–B) DExCon-Rab11a/DExogron-Rab11b cells treated with Indole-3-acetic acid (IAA), dox or dox/IAA as indicated; dox=250 ng/ml, IAA=100 µg/ml unless otherwise stated. Dox (pre)24=dox stimulation 24 hr before analysis. mCH=mCherry; mNG=mNeonGreen. (A) Timelapse fluorescence images obtained automatically by Incucyte (scale bar=20 µm). (B) FACS analysis, arrows indicate dynamic range and change in fluorescence intensity of mCherry or mNeonGreen; Ctrl=unmodified A2780 highlighted by black (max. peak) and blue dashed lines (Gaussian signal distribution).
Figure 6—figure supplement 4
Characterization of DExogron-Rab11a/DExCon-Rab11b cells.
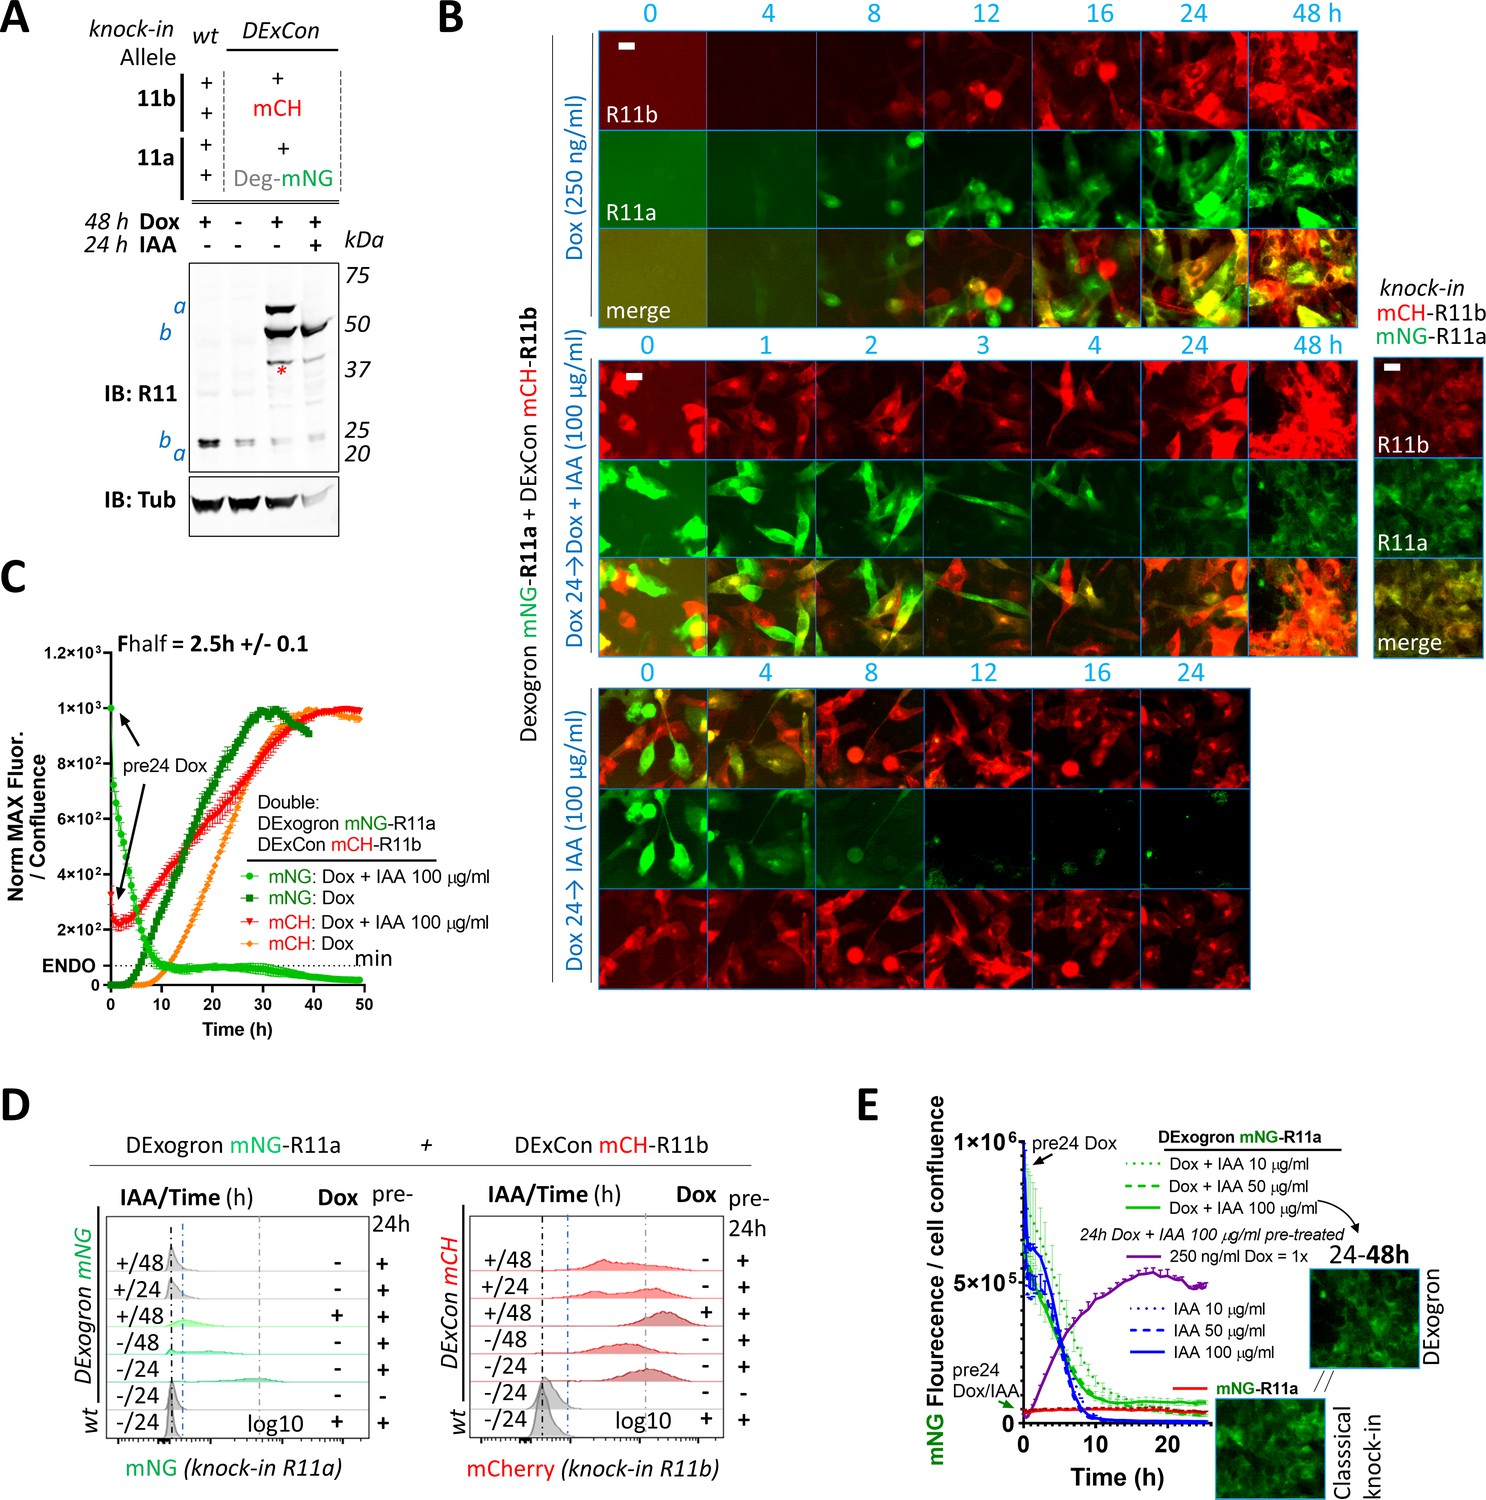
(A–E) DExogron-mNeonGreen-Rab11a/DExCon-mCherry-Rab11b A2780 (single clone) cells treated with Indole-3-acetic acid (IAA), doxycycline (dox) or dox/IAA as indicated; dox=250 ng/ml, IAA=100 µg/ml unless otherwise stated. Dox (pre)24=dox stimulation 24 hr before analysis. mCherry-Rab11b/mNeonGreen-R11a conventional knock-ins are shown for comparison (right). mCH=mCherry; mNG=mNeonGreen; miniIAA7=Deg. (A) Immunoblots probed with anti-Rab11 antibody targeting both Rab11a/b (Rab11); Tubulin (Tub), loading control. wt=unmodified A2780; a=Rab11a; b=Rab11b ± fluorophore knock-in. Red stars indicate mCherry/iRFP670 lower molecular weight band caused by hydrolysis during sample preparation (Gross et al., 2000). (B) Timelapse fluorescence images obtained using Incucyte (scale bar=20 µm). (C) Expression and degradation kinetics analyzed by Incucyte. Arrows indicate dox stimulation 24 hr before analysis. Curves were normalized to maximal fluorescence intensity and cell confluence, mean of three independent experiments ± SD shown. Half-time of mNeonGreen fluorescence decrease to the fluorescence intensity of conventional mNeonGreen-Rab11a knock-in (dotted line marked as ENDO, see also E) calculated as 1.7 hr±0.1 (mean of three independent experiments ± SEM) (D). FACS analysis of fluorescence intensity of mCherry or mNeonGreen (gray dashed line for 24 hr pre-induced reference); Ctrl=unmodified A2780 highlighted by black (max. peak) and blue dashed lines (Gaussian signal distribution). (E) Expression and degradation kinetics analyzed by Incucyte. Curves were normalized to cell confluence, mean of three independent experiments ± SEM shown. See Video 17. Images represent conventional mNeonGreen-R11a knock-in fluorescence intensity (bottom) and DExogron-mNeonGreen-Rab11a co-stimulated with dox/IAA for 24–48 hr (on the right).
Figure 7
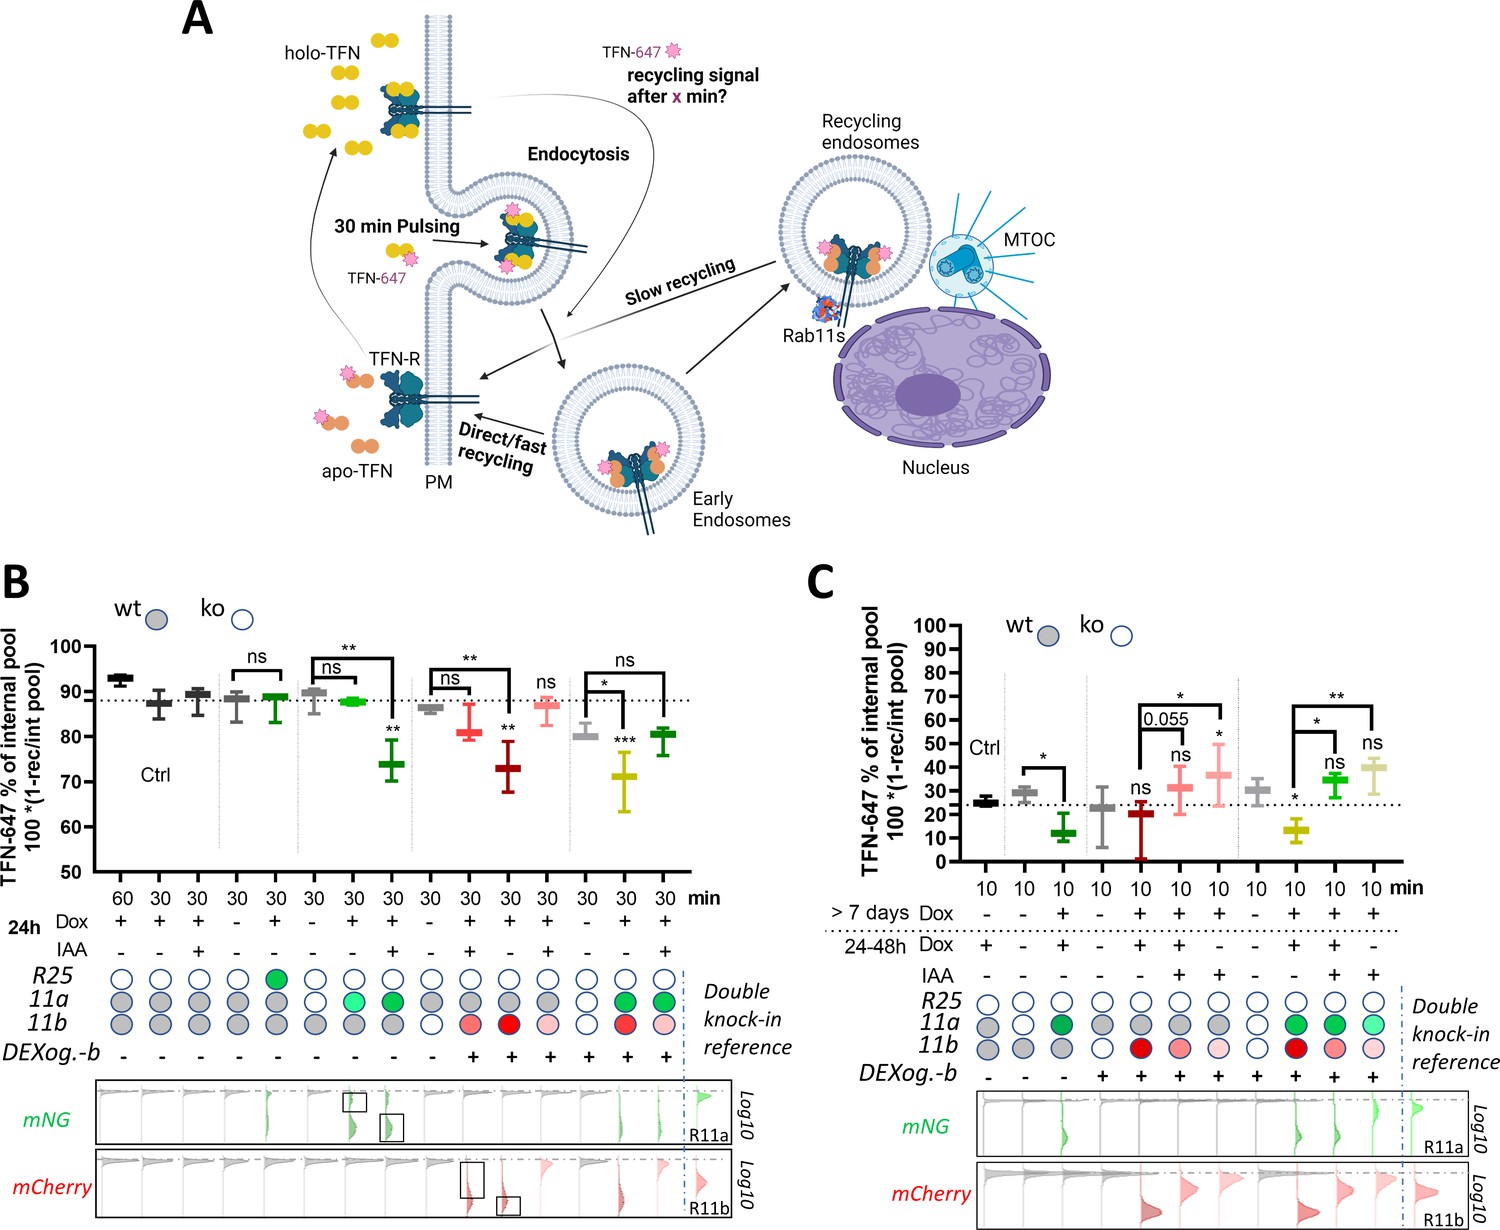
Rab11 expression levels modulate transferrin (TFN) receptor recycling.
(A) Schematic illustration (created with Biorender.com) of TFN-647 recycling assay with depicted pathways: rapid direct route from early endosomes to the plasma membrane and a slower/longer route through perinuclear recycling endosomes via Rab11. (B–C) TFN-647 recycling assay with A2780 DExogron-mCherry-Rab11b, DExCon-mNeonGreen-Rab11a cells or their combination described previously in Figure 6, mNeonGreen-Rab25 DExcon cells sorted for high as shown in Figure 3—figure supplement 1D. Cells doxycycline (dox) pre-treated follow by ±dox/Indole-3-acetic acid (IAA) or their combinations as described; dox (250 ng/ml); IAA (100 in B or 10 μg/ml in C). TFN-647 recycled levels were measured at 30 min (B) or 10 min (C) by flow cytometry and normalized to TFN-647 internalization levels (reached in 30 min) as % of internal pool. IAA or dox/IAA condition in (C) required extra normalization based on the wt control to subtract the negative effect of IAA. wt=CRISPR unmodified A2780 cells stably expressing AtAFBP2 and Teto3G-T2A-HygroR. FACS analysis of mNeonGreen/mCherry fluorescence levels shown below graphs (B–C), dashed line indicates negative Ctrl. Log10 scale shown. Black rectangles indicate subpopulations (high/low) analyzed for TFN-647 recycling rate. Classical Rab11a/Rab11b double knock-in cells used as reference for mNeonGreen/mCherry brightness. Box and whiskers (geometrical mean) are shown from three independent biological replicates (B–C). One-way ordinary or repeated-measures ANOVA analysis Tukey post hoc test used for statistical analysis and compared to Ctrl (B; 30 min recycling) or among different conditions across modified Rab11a/b/25 toward untreated cells or as indicated (B–C).
Figure 8
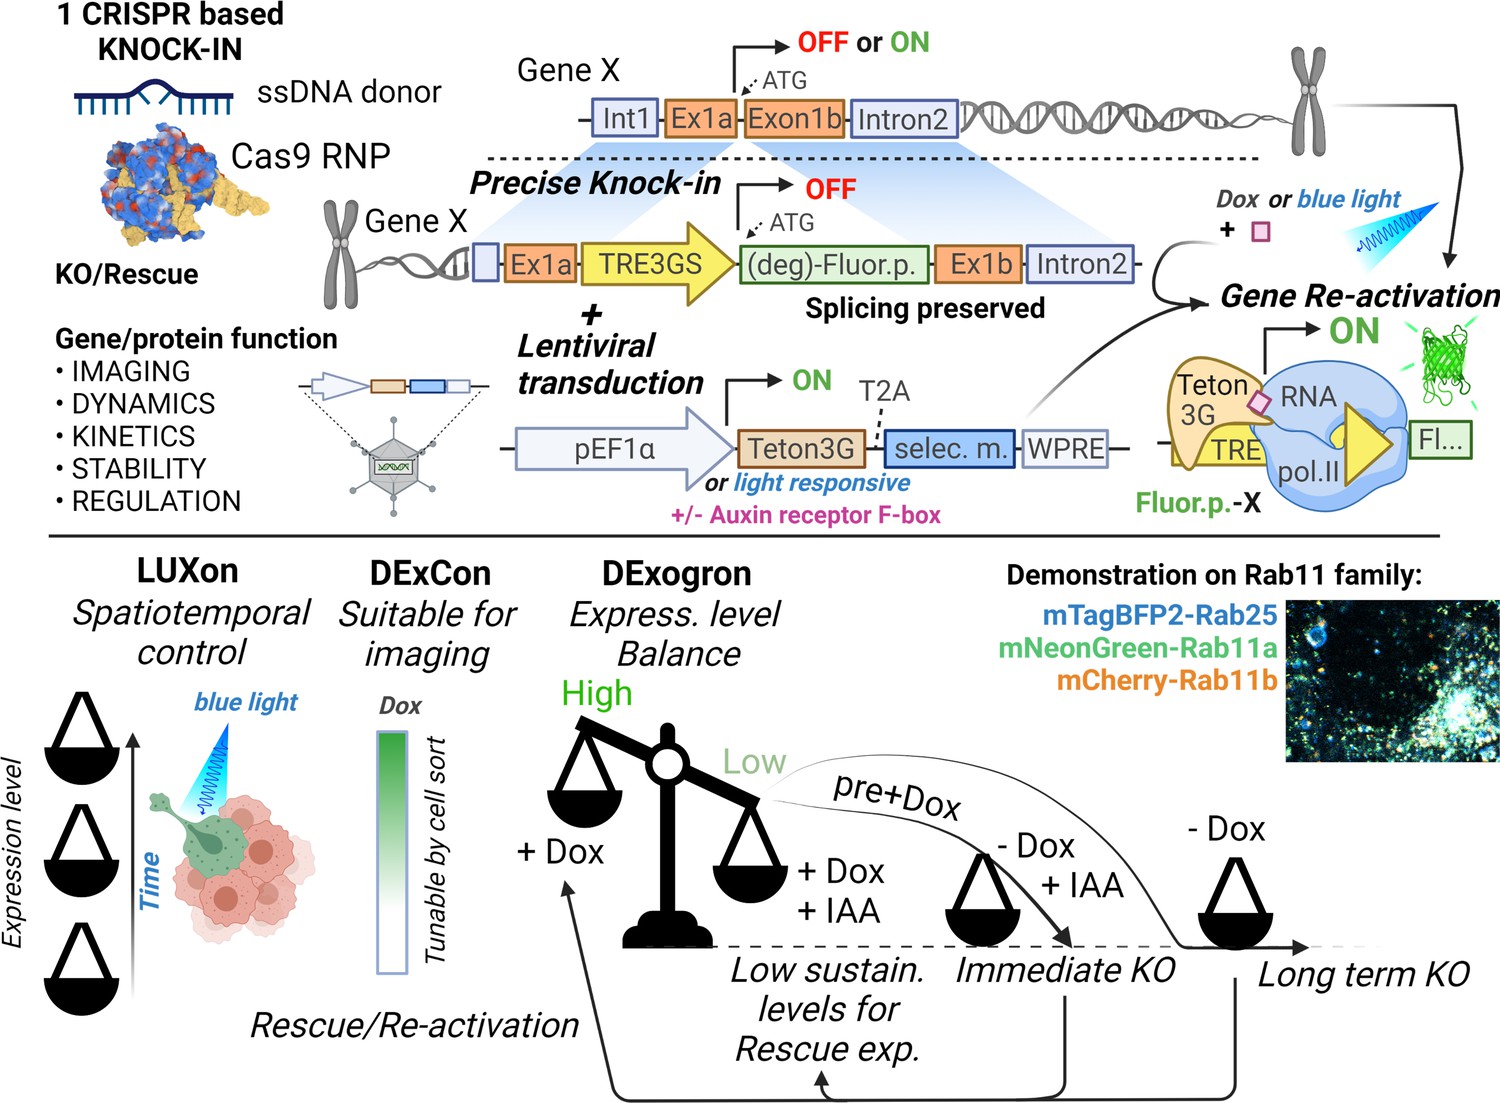
Tools for on-demand expression control of endogenous genes.
Schematic illustration (created with Biorender.com) of DExCon(Doxycycline-mediated endogenous gene Expression Control), DExogron (DExCon combined with auxin-mediated targeted protein degradation), and LUXon (light responsive DExCon) approaches, where a single CRISPR/Cas9-mediated gene editing event can block endogenous gene expression, with the ability to re-activate expression encoded such that even silent genes can be expressed. Expression can be controlled systematically using doxycycline, or spatiotemporally by light, tuned to physiological levels by auxin, allowing fluorescent tagging of endogenous proteins and quantification of expression kinetics, protein dynamics, and stability for highly similar genes such as members of the Rab11 family.
Videos
Video 1
Timelapse (Spinning disc 3i, 63×) of mNeonGreen-Rab11a/mCherry-Rab11b double DExCon (Doxycycline-mediated endogenous gene Expression Control) cells (A2780, dox for 24 hr) treated by siR-Tubulin (400 nM).
Timelapse covers total 5 min with frame taken every 2.67 s (∼10.3 s elapsed time per second of the movie); µ-Plate 96 Well Black (Ibidi cat.No 89626; #1.5 polymer coverslip, tissue culture treated; Opti-Klear Live Cell Imaging Buffer). Selected frame from this video is shown in Figure 2—figure supplement 2C.
Video 2
Timelapse (Spinning disc 3i, 63×) of mNeonGreen-Rab11a/mCherry-Rab11b double DExCon (Doxycycline-mediated endogenous gene Expression Control) cells (A2780, dox for 24 hr) stably expressing LifeAct-iRFP670.
Timelapse covers total 7 min with frame taken every 2 s (∼14.5 s elapsed time per second of the movie); µ-Plate 96 Well Black (Ibidi cat.No 89626; #1.5 polymer coverslip, tissue culture treated; Opti-Klear Live Cell Imaging Buffer). Selected frame from this video is shown in Figure 2—figure supplement 2C.
Video 3
Timelapse (Spinning disc 3i, 63×) of mNeonGreen-Rab11a/mCherry-Rab11b double DExCon (Doxycycline-mediated endogenous gene Expression Control) cells (A2780, doxycycline [dox] for 24 hr) recycling Alexa-647 labeled transferrin (25 µg/ml).
Timelapse covers total 5 min with frame taken every 2.67 s (∼16.2 s elapsed time per second of the movie); µ-Plate 96 Well Black (Ibidi cat.No 89626; #1.5 polymer coverslip, tissue culture treated; Opti-Klear Live Cell Imaging Buffer). Selected frame from this movie is shown in Figure 2—figure supplement 2D.
Video 4
Timelapse (Spinning disc 3i, 63×) of mNeonGreen-Rab11a/mCherry-Rab11b double knock-in A2780 cells±TRE3GS promoter (DExCon [Doxycycline-mediated endogenous gene Expression Control]; ±dox 24 hr) migrating in 3D cell-derived matrix.
Timelapse covers total 2.25 min (left) or 4.4 min (right) with frame taken every ~1.5 s for both (∼10.1 s elapsed time per second of the movie); µ-Plate 96 Well Black (Ibidi cat.No 89626; #1.5 polymer coverslip, tissue culture treated; Opti-Klear Live Cell Imaging Buffer). Selected frames from this movie are shown in Figure 2—figure supplement 2E,F.
Video 5
Timelapse (Spinning disc 3i, 63×) of mNeonGreen-Rab25 LUXon (light responsive DExCon) cells (Rab25 as green) expressing PA-Tet-OFF with mCherry-NLS reporter (red) 18 hr after being illuminated by blue light (10 hr).
Timelapse covers total 1 min with frame taken every 1 s (∼6.7 s elapsed time per second of the movie); µ-Plate 96 Well Black (Ibidi cat.No 89626; #1.5 polymer coverslip, tissue culture treated; Opti-Klear Live Cell Imaging Buffer). Selected frame from this video is shown in Figure 3H.
Video 6
3D projection (Spinning disc 3i, 63×) of mNeonGreen-Rab25 LUXon (light responsive DExCon) cells (Rab25 as green) expressing PA-Tet-OFF with mCherry-NLS reporter (red) 18 hr after being illuminated by blue light (10 hr).
µ-Plate 96 Well Black (Ibidi cat.No 89626; #1.5 polymer coverslip, tissue culture treated). Selected frame from this movie is shown in Figure 3H.
Video 7
3D projection (Spinning disc 3i, 63×) of mNeonGreen-Rab25 LUXon (light responsive DExCon) cells (Rab25 as blue) expressing PA-Tet-OFF with mCherry-NLS reporter (red) 20 hr after being spatiotemporally illuminated by blue light (10 hr).
Cells are invading to cell-free collagen matrix labeled by FN-647 (green) while being illuminated by blue light of varying intensity (see experimental set-up, right corner). µ-Plate 96 Well Black (Ibidi cat.No 89626; #1.5 polymer coverslip, tissue culture treated) partly covered by black plasticine. Selected frame from this movie is shown in Figure 3J.
Video 8
3D projection of triple knock-in A2780 cells (mNeonGreen-Rab11a, mCherry-Rab11b, mTagBFP2-Rab25 DExCon) treated by doxycycline (dox) (>94 hr).
µ-Plate 96 Well Black (Ibidi cat.No 89626; #1.5 polymer coverslip, tissue culture treated; Opti-Klear Live Cell Imaging Buffer). AiryScan LSM880 (63×). Selected frames from this movie are shown in Figure 4—figure supplement 1B.
Video 9
3D rendered model (ZEN black software) of triple knock-in A2780 cells (mNeonGreen-Rab11a, mCherry-Rab11b, mTagBFP2-Rab25 DExCon) treated by doxycycline (dox) (>94 hr).
Cells were imaged live while recycling Alexa-647 labeled transferrin (30 min) on glass-bottom dish (MatTek, Ashland, MA, USA; Opti-Klear Live Cell Imaging Buffer) coated with 10 µg/ml fibronectin (FN) using AiryScan LSM880 (63×). Selected frames from this movie, raw un-rendered, are shown in Figure 4C.
Video 10
3D projection of triple knock-in A2780 cells (mNeonGreen-Rab11a, mCherry-Rab11b, mTagBFP2-Rab25 DExCon) treated by doxycycline (dox) (>94 hr).
Cells were imaged live while recycling Alexa-647 labeled transferrin (30 min) and migrating in Cell Derived Matrix (3D). AiryScan LSM880 (63x); Glass-bottom dish (MatTek, Ashland, MA, USA); Opti-Klear Live Cell Imaging Buffer. Selected frames from this movie are shown in Figure 4C.
Video 11
Triple knock-in A2780 cells (mNeonGreen-Rab11a; mCherry-Rab11b; mTagBFP2-Rab25 DExCon) treated by doxycycline (dox) (>94 hr).
Cells were imaged live while recycling Alexa-647 labeled transferrin (30–60 min) on FN-coated 5 mm coverslip. 3D projections and optical sections are shown. Opti-Klear Live Cell Imaging Buffer; 3i Lattice LightSheet microscope. Selected frames from this movie are shown in Figure 4F and Figure 4—figure supplement 1D.
Video 12
Triple knock-in A2780 cells (mNeonGreen-Rab11a; mCherry-Rab11b; mTagBFP2-Rab25 DExCon) treated by doxycycline (dox) (>94 hr) with Alexa-647 labeled transferrin recycled for 30 min.
Cells were imaged fixed on FN-coated 5 mm coverslip. 3D projection animation generated using Imaris Cell Imaging Software. Opti-Klear Live Cell Imaging Buffer; 3i Lattice LightSheet microscope. Selected frames from this animation are shown in Figure 4—figure supplement 1E.
Video 13
Timelapse (Incucyte S3 system, 20x) of protein expression kinetics of mNeonGreen-Rab11a/mCherry-Rab11b or mNeonGreen-Rab11b/mCherry-Rab11b double DExCon cells (A2780) treated by doxycycline (dox) (from time 0).
Timelapse covers total 49 hr with frame taken every 30 min (∼30 min elapsed time per second of the movie); 96 well tissue culture plates (Corning); RPMI fenol-free media. Selected frames from this movie are shown in Figure 5G.
Video 14
Timelapse (Incucyte S3 system, 20×) of expression and degradation kinetics of miniIAA7-mCherry-Rab11b DExogron cells (A2780, comparison with the classical endogenous mCherry-Rab11b tagging) treated by ±doxycycline (dox ±Indole-3-acetic acid IAA) (from time 0 or cells pre-treated 24 hr with dox).
Timelapse (mCherry channel is shown) covers total 49 hr with frame taken every 30 min (∼30 min elapsed time per second of the movie); 96 well tissue culture plates (Corning); RPMI fenol-free media. Selected frames from this movie are shown in Figure 6J.
Video 15
Timelapse (Incucyte S3 system, 20×) of expression and degradation kinetics of miniIAA7-mCherry-Rab11b DExogron/mNeonGreen-Rab11a DExCon cells (A2780, comparison with the classical double endogenous mCherry/mNeonGreen-Rab11b/Rab11a tagging) treated by ±doxycycline (dox) ±Indole-3-acetic acid (IAA) (from time 0 or cells pre-treated 24 hr with dox).
Timelapse (merge of mCherry/mNeonGreen channel is shown) covers total 49 hr with frame taken every 30 min (∼30 min elapsed time per second of the movie); 96 well tissue culture plates (Corning); RPMI fenol-free media. Selected frames from this movie are shown in Figure 6—figure supplement 3A.
Video 16
A2780 (Ctrl; stably expressing AtAFBP2); Rab11s DExCons/DExogrons cells or cells with shRNA anti-Rab11a or b as indicated.
Wound healing experiment automatically imaged and analyzed in real time by Incucyte S3 system (blue mask determined based on brightfield image taken at time 0 and every other frame taken after the scratch). Confluent cells were pre-treated for 24±doxycycline (dox) (250 ng/ml)±Indole-3-acetic acid (IAA) (100 μg/ml), scratch by wound the WoundMaker and imaged in RPMI fenol-free media ± dox/IAA as indicated. Timelapse (merge of brightfield with highlighted blue mask and true mNeonGreen/mCherry fluorescence) covers total 24 hr with frame taken every 1 hr (∼1 hr elapsed time per second of the movie); ImageLock 96-well Plates; RPMI fenol-free media. Selected frames from this movie are shown in Figure 6—figure supplement 2A.
Video 17
Timelapse (Incucyte S3 system, 20x) of expression and degradation kinetics of miniIAA7-mNeonGreen-Rab11a DExogron/mCherry-Rab11b DExCon cells (clone of A2780, comparison with the classical double endogenous mCherry/mNeonGreen-Rab11b/Rab11a tagging) treated by ±doxycycline (dox) ±Indole-3-acetic acid (IAA) (from time 0 or cells pre-treated 24 hr with dox).
Timelapse (merge of mCherry/mNeonGreen channel is shown) covers total 49 hr with frame taken every 30 min (∼30 min elapsed time per second of the movie); 96 well tissue culture plates (Corning); RPMI fenol-free media. Selected frames from this movie are shown in Figure 6—figure supplement 4B.
Tables
Key resources table
| Reagent type (species) or resource | Designation | Source or reference | Identifiers | Additional information |
|---|---|---|---|---|
| Cell line (Homo sapiens) | Ovarian cancer | ATCC | OVCAR-3 | Cell line maintained in RPMI-1640 media |
| Cell line (H. sapiens) | Ovarian cancer | DOI:10.1038/nm1125 | A2780-DNA3 | Cell line maintained in RPMI-1640 media |
| Cell line (H. sapiens) | Ovarian cancer | ECACC | COV362 | Cell line maintained in Dulbecco’s Modified Eagles Medium (DMEM) (D5796) media |
| Cell line (H. sapiens) | Telomerase immortalized fibroblasts | DOI:10.1016/j.devcel.2007.08.012 | Telomerase immortalized fibroblasts | Cell line maintained in DMEM (D5796) media |
| Cell line (H. sapiens) | Embryonic kidney cells | ATCC | human embryonic kidney (HEK)293T | Cell line maintained in DMEM (D5796) media |
| Antibody | anti-Rab11 (Rabbit polyclonal) | Thermofisher | Cat# PA5-31348 | WB (1:1000) |
| Antibody | anti-α-tubulin (Mouse monoclonal) | Abcam | Cat# ab7291 | WB (1:25000) |
| Antibody | anti-Rab11a (Rabbit polyclonal) | Cell signaling (CST) | Cat# 2,413 S | WB (1:1000) |
| Antibody | anti-Rab25 (Rabbit monoclonal) | Cell signaling (CST) | Cat# 13,048 S | WB (1:1000) |
| Antibody | anti-RFP (5F8) (Rat monoclonal) | Chromotek | Cat# 5f8-100 | IF(1:200), WB (1:750) |
| Antibody | anti-mNeonGreen (Mouse monoclonal) | Chromotek | Cat# 32F6-100 | IF(1:200), WB (1:400) |
| Transfected construct (human) | pCDH-antiGFPnanobody-mCherry-Rab11a | this paper | Lentiviral construct | |
| Transfected construct (synthetic) | PAtetOFF_L317_C1634=_ CSII-CAG-MCS-IRES-mCherry | DOI:10.1016/j.celrep.2018.09.026 | Lentiviral construct for photoactivatable TetOFF system | |
| Transfected construct (synthetic) | PAtet2OFF_L395_CSII-CAG=T89 T2A=MCS-IRES-Snap-Bsd | DOI:10.1016/j.celrep.2018.09.026 | Lentiviral construct for photoactivatable Tet2OFF system | |
| Transfected construct (synthetic) | PAtetON_L321_C1673=_ CSII-CAG-MCS-IRES-Snap-Bsd | DOI:10.1016/j.celrep.2018.09.026 | Lentiviral construct for photoactivatable TetON system | |
| Transfected construct (synthetic) | pLenti Lifeact-iRFP670 BlastR | DOI:10.1038/s41467-018-05367-2 | RRID:Addgene_84385 | Lentiviral construct to transfect and express LifeAct. |
| Transfected construct (synthetic) | pLenti Lifeact-mTagBFP2 PuroR | Ghassan Mouneimne lab | RRID:Addgene_101893 | Lentiviral construct to transfect and express LifeAct. |
| Transfected construct (human) | pGIPZ-PuroR-IRES-GFP_shRNA anti Rab11b | Dharmacon | Cat# RHS4531-EG9230 clone id:V3LHS_365285 | Lentiviral construct to transfect and express the shRNA. |
| Transfected construct (human) | pGIPZ-PuroR-IRES-GFP_shRNA anti Rab11a | Dharmacon | Cat# RHS4430-200301210 clone id:V3LHS_411101 | Lentiviral construct to transfect and express the shRNA. |
| Recombinant DNA reagent | pCDH-TRE3GS-EF1a-tagBFP-T2A-TetOn3G | Andrew Gilmore lab | Lentiviral tetracycline inducible backbone | |
| Transfected construct (synthetic) | pCDH-EF1a-tagBFP-T2A-TetOn3G | this paper | RRID:Addgene_179888 | Lentiviral construct to express TetOn3G |
| Transfected construct (synthetic) | pCDH-EF1a-HygroR-T2A-TetOn3G | this paper | RRID:Addgene_179887 | Lentiviral construct to express TetOn3G |
| Transfected construct (human) | mCherry-Rab11a | Michael Davidson lab | RRID:Addgene_55124 | Mammalian Expression vector for transfection |
| Transfected construct (human) | GFP-Rab11b | Marci Scidmore lab | Mammalian Expression vector for transfection | |
| Transfected construct (human) | GFP-Rab11a | DOI:10.1016/j.devcel.2007.08.012 | Mammalian Expression vector for transfection | |
| Transfected construct (Arabidopsis thaliana) | pSH-EFIRES-P-AtAFB2 | DOI:10.1038/s41592-019-0512-x | RRID:Addgene_129715 | Mammalian Expression, CRISPR, and TALEN |
| Transfected construct (A. thaliana) | pCDH-AtAFB2-mTagBFP2 | this paper | RRID:Addgene_179889 | Lentiviral construct |
| Transfected construct (synthetic) | pMito-mCherry-FRB | DOI:10.1242/jcs.124834 | RRID:Addgene_59352 | Mammalian Expression vector for transfection |
| Transfected construct (synthetic) | GFP-FKBP | Stephen Royle lab | Mammalian Expression vector for transfection | |
| Transfected construct (synthetic) | pMito-iRFP670-FRB | this paper | Mammalian Expression vector for transfection | |
| Transfected construct (human) | pJET-50-DExogron-mCherry-R11b | this paper | RRID:Addgene_179904 | CRISPR and knock-in donor |
| Transfected construct (human) | pJET-49-DExogron-mNeonGreen-R11a | this paper | RRID:Addgene_179903 | CRISPR and knock-in donor |
| Transfected construct (human) | pJET-42-DExCon-antiGFPnanobody-mCherry-R11a | this paper | RRID:Addgene_179902 | CRISPR and knock-in donor |
| Transfected construct (human) | pJET-41-DExCon-antiGFPnanobody-mCherry-R11b | this paper | RRID:Addgene_179901 | CRISPR and knock-in donor |
| Transfected construct (human) | pJET-59-DExCon-mTagBFP2-R25 | this paper | RRID:Addgene_179900 | CRISPR and knock-in donor |
| Transfected construct (human) | pJET-67-DExCon-mNeonGreen-R11b | this paper | RRID:Addgene_179899 | CRISPR and knock-in donor |
| Transfected construct (human) | pJET-23-DExCon-mCherry-R11b | this paper | RRID:Addgene_179898 | CRISPR and knock-in donor |
| Transfected construct (human) | pJET-22-DExCon-mNeonGreen-R11a | this paper | RRID:Addgene_179897 | CRISPR and knock-in donor |
| Transfected construct (human) | pMKRQ_11_DExCon-mNeonGreen-R25 | this paper | RRID:Addgene_179896 | CRISPR and knock-in donor |
| Transfected construct (human) | pJET-64-SFFV-T2A-BlaR-polyA-R11b | this paper | RRID:Addgene_179895 | CRISPR and knock-in donor |
| Transfected construct (human) | pJET-63-SFFV-T2A-BlaR-polyA-R11a | this paper | RRID:Addgene_179894 | CRISPR and knock-in donor |
| Transfected construct (human) | pJET-62-SFFV-T2A-PuroR-polyA-R11b | this paper | RRID:Addgene_179893 | CRISPR and knock-in donor |
| Transfected construct (human) | pJET-61-SFFV-T2A-PuroR-polyA-R11a | this paper | RRID:Addgene_179892 | CRISPR and knock-in donor |
| Transfected construct (human) | pJET-10-mCherry-R11b | this paper | RRID:Addgene_179891 | CRISPR and knock-in donor |
| Transfected construct (human) | pJET-07-mNeonGreen-R11a | this paper | RRID:Addgene_179890 | CRISPR and knock-in donor |
| Transfected construct (human) | pJET-60-mNeonGreen-R11b | this paper | CRISPR and knock-in donor | |
| Transfected construct (human) | pJET-24-DExCon-antiGFPnanobody-mCherry-R25 | this paper | CRISPR and knock-in donor | |
| Transfected construct (human) | pJET_28_mCherry-minilaa7-Rab11b | this paper | CRISPR and knock-in donor | |
| Chemical compound and drug | doxycycline hydrochloride | Sigma | #D3447 | |
| Chemical compound and drug | SiR-Tubulin | Cytoskeleton | Cat# CY-SC002 | |
| Peptide, recombinant protein | Alt-R S.p. HiFi Cas9 Nuclease V3 | IDT | Cat#: 1081061 | |
| Chemical compound and drug | Lipofectamine CRISPRMAX Cas9 Transfection Reagent | Thermo | CMAX00008 | |
| Peptide, recombinant protein | Transferrin labeled 647 1 mg | Thermo | #T23366 | |
| Chemical compound and drug | Indole-3-acetic acid sodium salt | Cambridge Biosc. | 16954–1 g-CAY | |
| Chemical compound and drug | Rapamycin | Sigma | #R8781-200UL | |
| Sequence-based reagent | tracrRNA | IDT | Cat#: 1072532 | |
| Sequence-based reagent | crRNA_Rab11a | IDT | crRNA | GGTAGTCGTACTCGTCGTCG |
| Sequence-based reagent | crRNA_Rab11b | IDT | crRNA | CCGGAAGCGCCAGGACAATG |
| Sequence-based reagent | crRNA_Rab25 | IDT | crRNA | CCTCCATGCGGAGCCAAGAT |
| Software and algorithm | Macro for relocalization to mitochondria | this paper | https://doi.org/10.6084/m9.figshare.17085632 | |
| Software and algorithm | Macro for spheroid invasion assay | this paper | https://doi.org/10.48420/16878829 | |
| Software and algorithm | Python script for colocalization mapping | this paper | https://doi.org/10.6084/m9.figshare.16810546 |
Additional files
-
Transparent reporting form
- https://cdn.elifesciences.org/articles/76651/elife-76651-transrepform1-v1.pdf
-
Source data 1
Annotated uncropped blots.
Annotated uncropped blots for Figures 1—3, Figure 5, Figure 6, Figure 1—figure supplement 2, Figure 2—figure supplement 1, Figure 3—figure supplement 1, Figure 4—figure supplement 1, Figure 6—figure supplements 1 and 2, Figure 6—figure supplement 4.
- https://cdn.elifesciences.org/articles/76651/elife-76651-data1-v1.pdf
Download links
A two-part list of links to download the article, or parts of the article, in various formats.
Downloads (link to download the article as PDF)
Open citations (links to open the citations from this article in various online reference manager services)
Cite this article (links to download the citations from this article in formats compatible with various reference manager tools)
On demand expression control of endogenous genes with DExCon, DExogron and LUXon reveals differential dynamics of Rab11 family members
eLife 11:e76651.
https://doi.org/10.7554/eLife.76651


