Repressor element 1-silencing transcription factor deficiency yields profound hearing loss through Kv7.4 channel upsurge in auditory neurons and hair cells
- Department of Pharmacology, The Key Laboratory of New Drug Pharmacology and Toxicology, Hebei Medical University, China
- Center for Innovative Drug Research and Evaluation, Institute of Medical Science and Health, Hebei Medical University, China
- The Key Laboratory of Neural and Vascular Biology, Ministry of Education, Hebei Medical University, China
- Lab of Pathology, Hebei Medical University, China
- Department of Psychiatry, University of Oxford, United Kingdom
- Kavli Institute for Nanoscience Discovery, University of Oxford, United Kingdom
- Faculty of Biological Sciences, University of Leeds, United Kingdom
- Department of Physiology and Cell Biology, School of Medicine, University of Nevada, United States
- The Hebei Collaboration Innovation Center for Mechanism, Diagnosis and Treatment of Neurological and Psychiatric Disease, Hebei Medical University, China
Figures
Figure 1 with 2 supplements
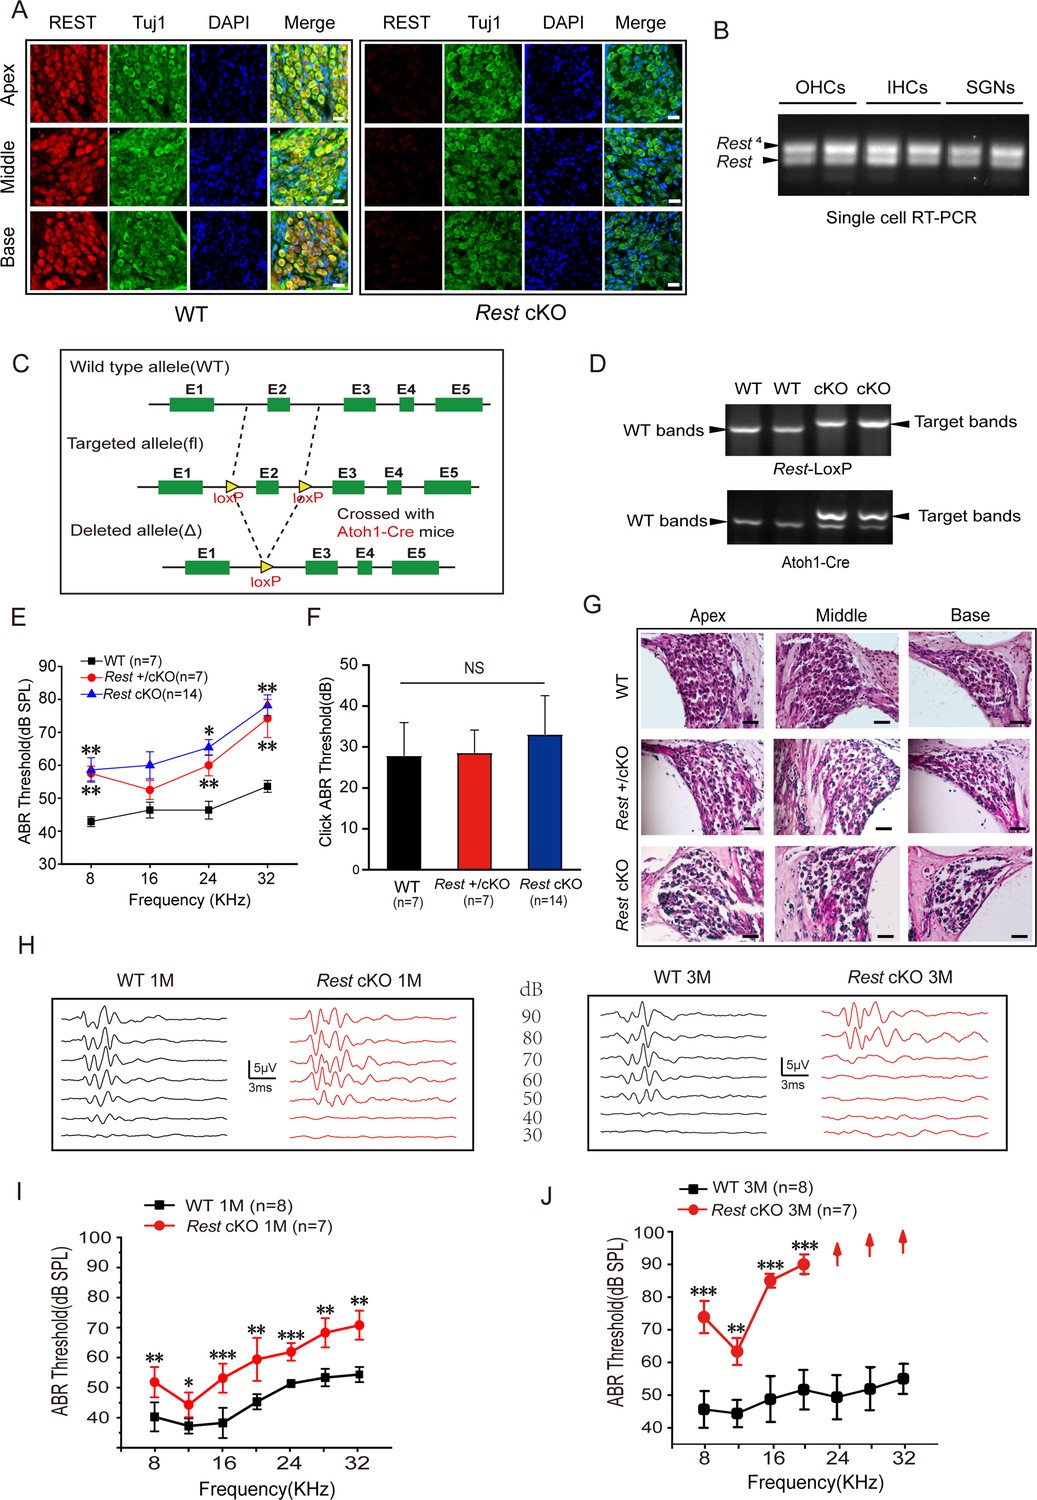
Repressor element 1-silencing transcription factor (REST) expression in the inner ear is essential for hearing.
(A) Expression of REST in spiral ganglion neurons (SGNs) from the apical, middle, and basal cochlea of 1-month-old wild-type (WT) and Rest conditional knockout (cKO) mice. SGNs were stained using anti-REST (red) and anti-Tuj1, a neuron marker (green). The nuclei were stained with DAPI (blue). Scale bar: 20 μm. (B) Single-cell RT-PCR analysis of Rest expression in SGNs of WT mice at P40, outer hair cells (OHCs) at P13, and inner hair cells (IHCs) at P20. (C) Schematic diagram of Rest cKO generation process. Two LoxP sites were inserted into both alleles of REST, flanking the coding sequence of exon 2. Cre recombinase expression is activated by the specific Atoh1 promoter in the cochlea and the exon 2 region between the homodromous LoxP sites, resulting in the loss of REST function cochlea. (D) PCR genotyping of WT and Rest cKO mice using genomic DNA prepared from tail biopsies. Rest cKO mice were identified by two-step PCR, first screening for the Rest-loxP target band and then further identifying for mice containing the Atoh1-Cre target band. (E, F) Auditory brainstem response (ABR) thresholds and click values were measured in WT, Rest +/cKO mice, and Rest cKO mice at 1–2 months old. (G) Morphometry changes in SGNs were observed in WT, Rest +/cKO, and Rest cKO mice. Scale bar: 50 μm. (H) Representative ABR waveforms in response to clicking (90–30 dB) sound pressure levels in 1- and 3-month-old WT and Rest cKO mice. (I, J) ABR threshold statistics of WT and Rest cKO mice at 1 month (I) and 3 months (J) of age in response to pure tone stimuli (8–32 kHz). Data are means ± SEM, **p<0.01, ***p<0.001.
-
Figure 1—source data 1
Expression of REST in the inner ear and the hearing function in WT and Rest cKO mice.
- https://cdn.elifesciences.org/articles/76754/elife-76754-fig1-data1-v2.zip
Figure 1—figure supplement 1
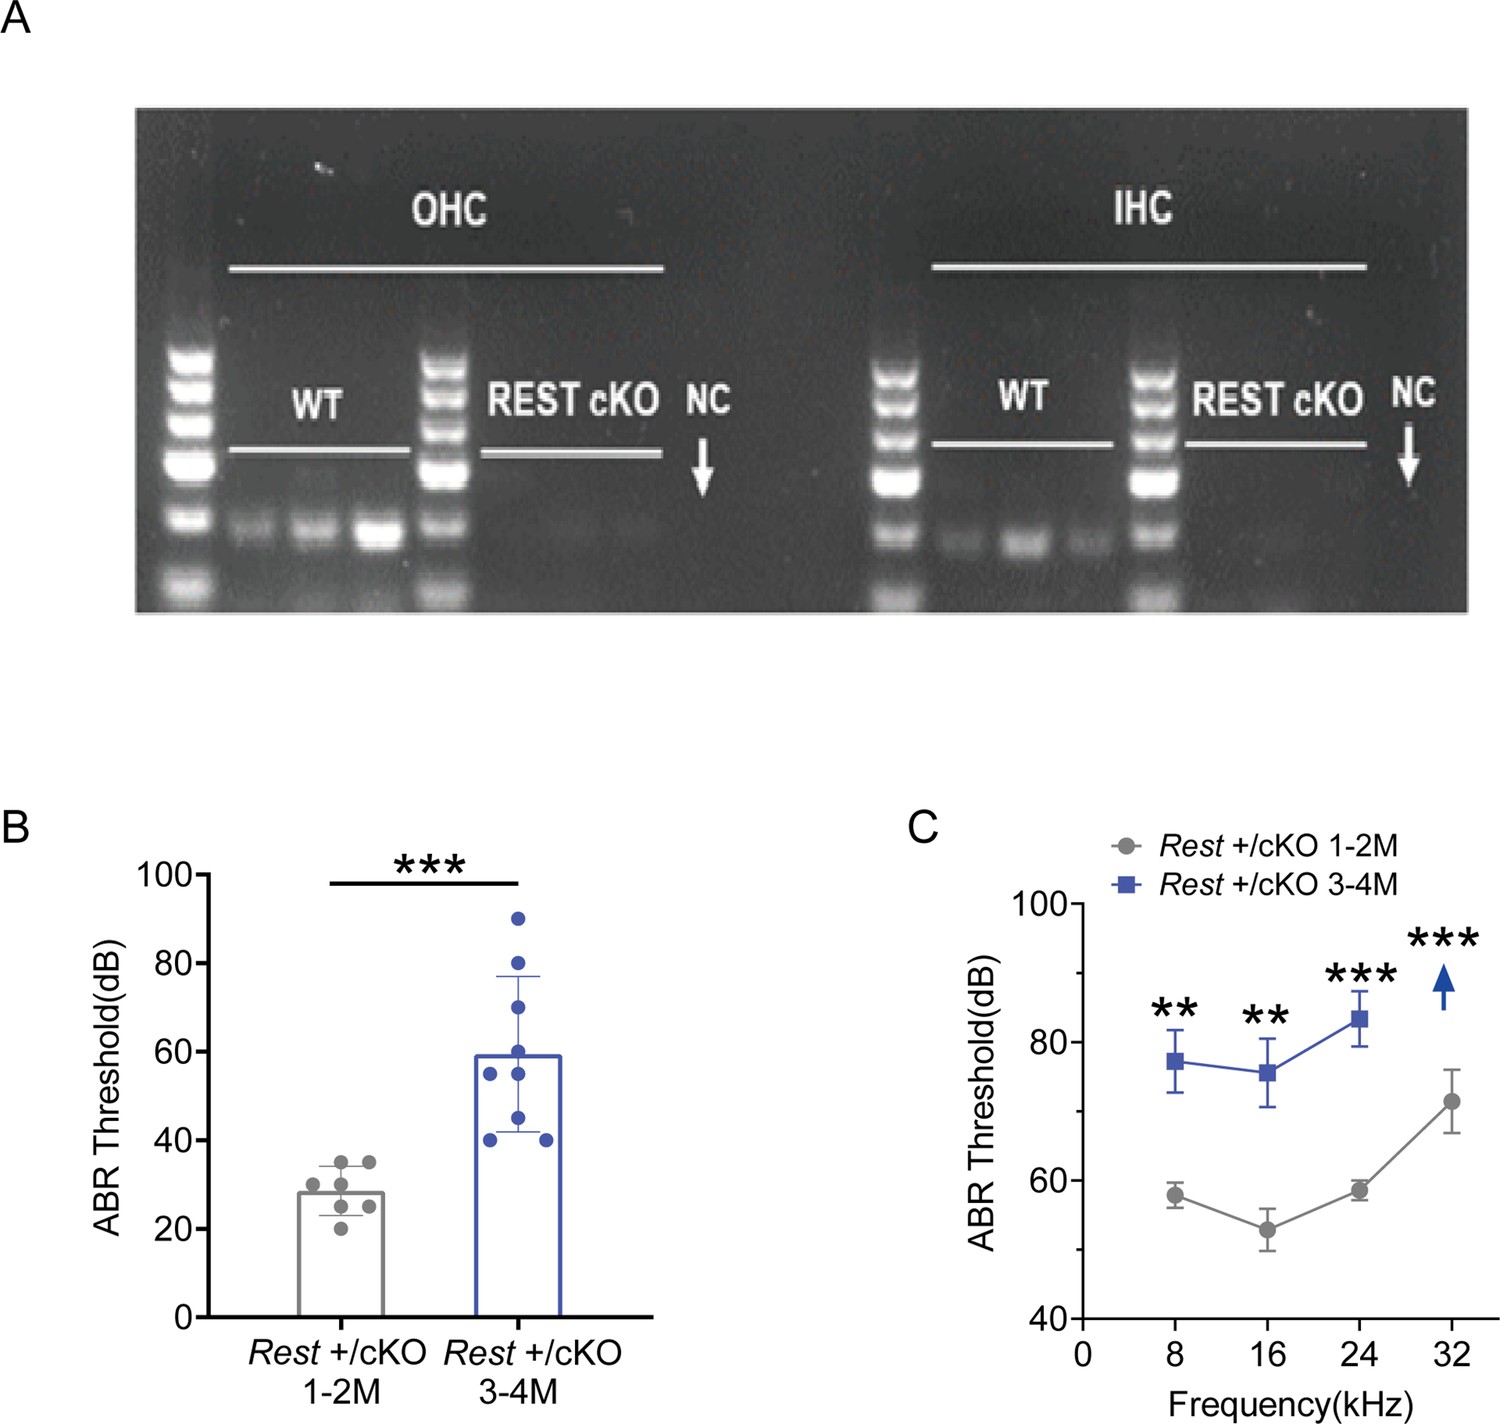
Identification of REST in HCs of WT and Rest cKO mice and hearing changes with age in Rest +/cKO mice.
(A) Single-cell RT-PCR analyses of Rest in outer hair cells (OHCs) and inner hair cells (IHCs) of wild-type (WT) and Rest conditional knockout (cKO) mice. NC: negative control. (B, C) auditory brainstem response (ABR) thresholds were measured following click (B) and pure-tone (C) stimuli in Rest +/cKO mice at 1–2 months (n = 7) and 3–4 months old (n = 9).
-
Figure 1—figure supplement 1—source data 1
Raw data of Single-cell RT-PCR and ABR from Rest +/cKO mice.
- https://cdn.elifesciences.org/articles/76754/elife-76754-fig1-figsupp1-data1-v2.zip
Figure 1—figure supplement 2
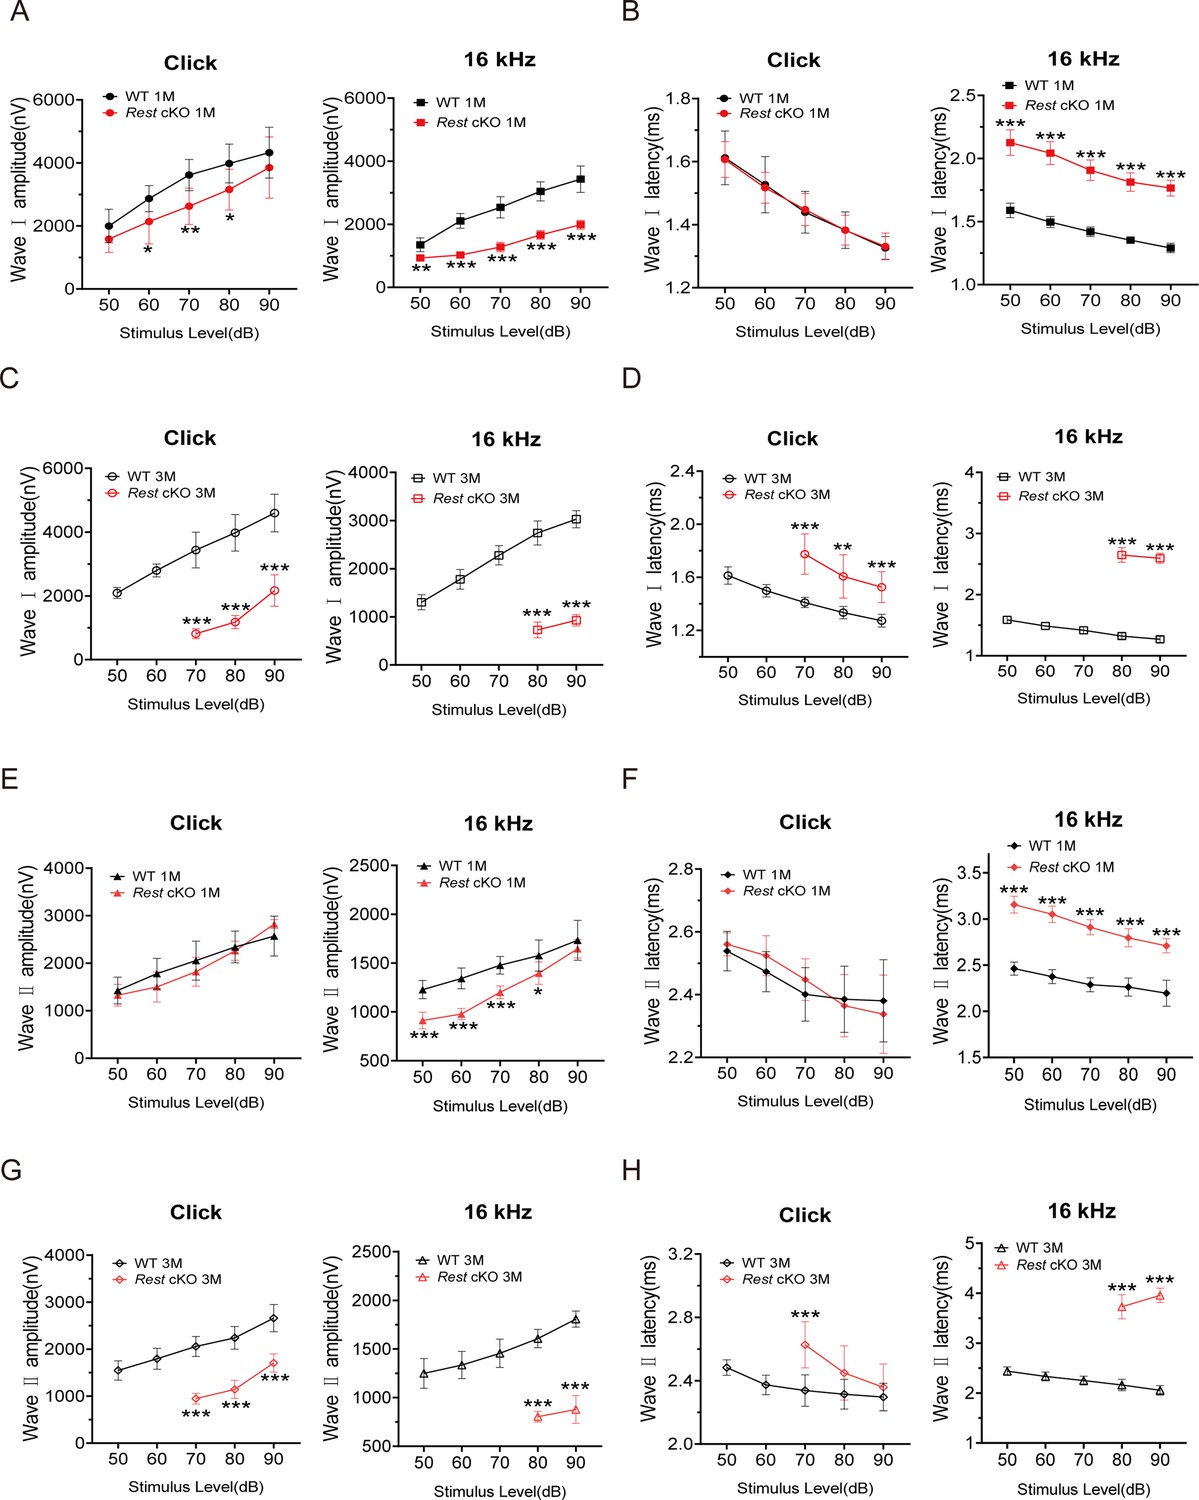
Amplitudes and latencies of auditory brainstem response (ABR) waves Ⅰ and Ⅱ in 1- and 3-month-old wild-type (WT) and Rest conditional knockout (cKO) mice.
(A, B) ABR amplitudes (A) and latencies (B) of wave I were measured with click and 16 kHz pure-tone stimuli in 1-month-old WT (n = 8) and Rest cKO (n = 6) mice. (C, D) ABR amplitudes (C) and latencies (D) of wave I were measured with click and 16 kHz pure-tone stimuli in 3-month-old WT (n = 7) and Rest cKO (n = 7) mice. (E, F) ABR amplitudes (E) and latencies (F) of wave II were measured with click and 16 kHz pure-tone stimuli in 1-month-old WT (n = 8) and Rest cKO (n = 6) mice. (G, H) ABR amplitudes (G) and latencies (H) of wave II were measured with click and 16 kHz pure-tone stimuli in 3-month-old WT (n = 8) and Rest cKO (n = 8) mice. Data are means ± SEM, *p<0.05, **p<0.01, ***p<0.001.
-
Figure 1—figure supplement 2—source data 1
Data of ABR waveform analysis in 1- and 3-month-old WT and Rest cKO mice.
- https://cdn.elifesciences.org/articles/76754/elife-76754-fig1-figsupp2-data1-v2.zip
Figure 2 with 1 supplement
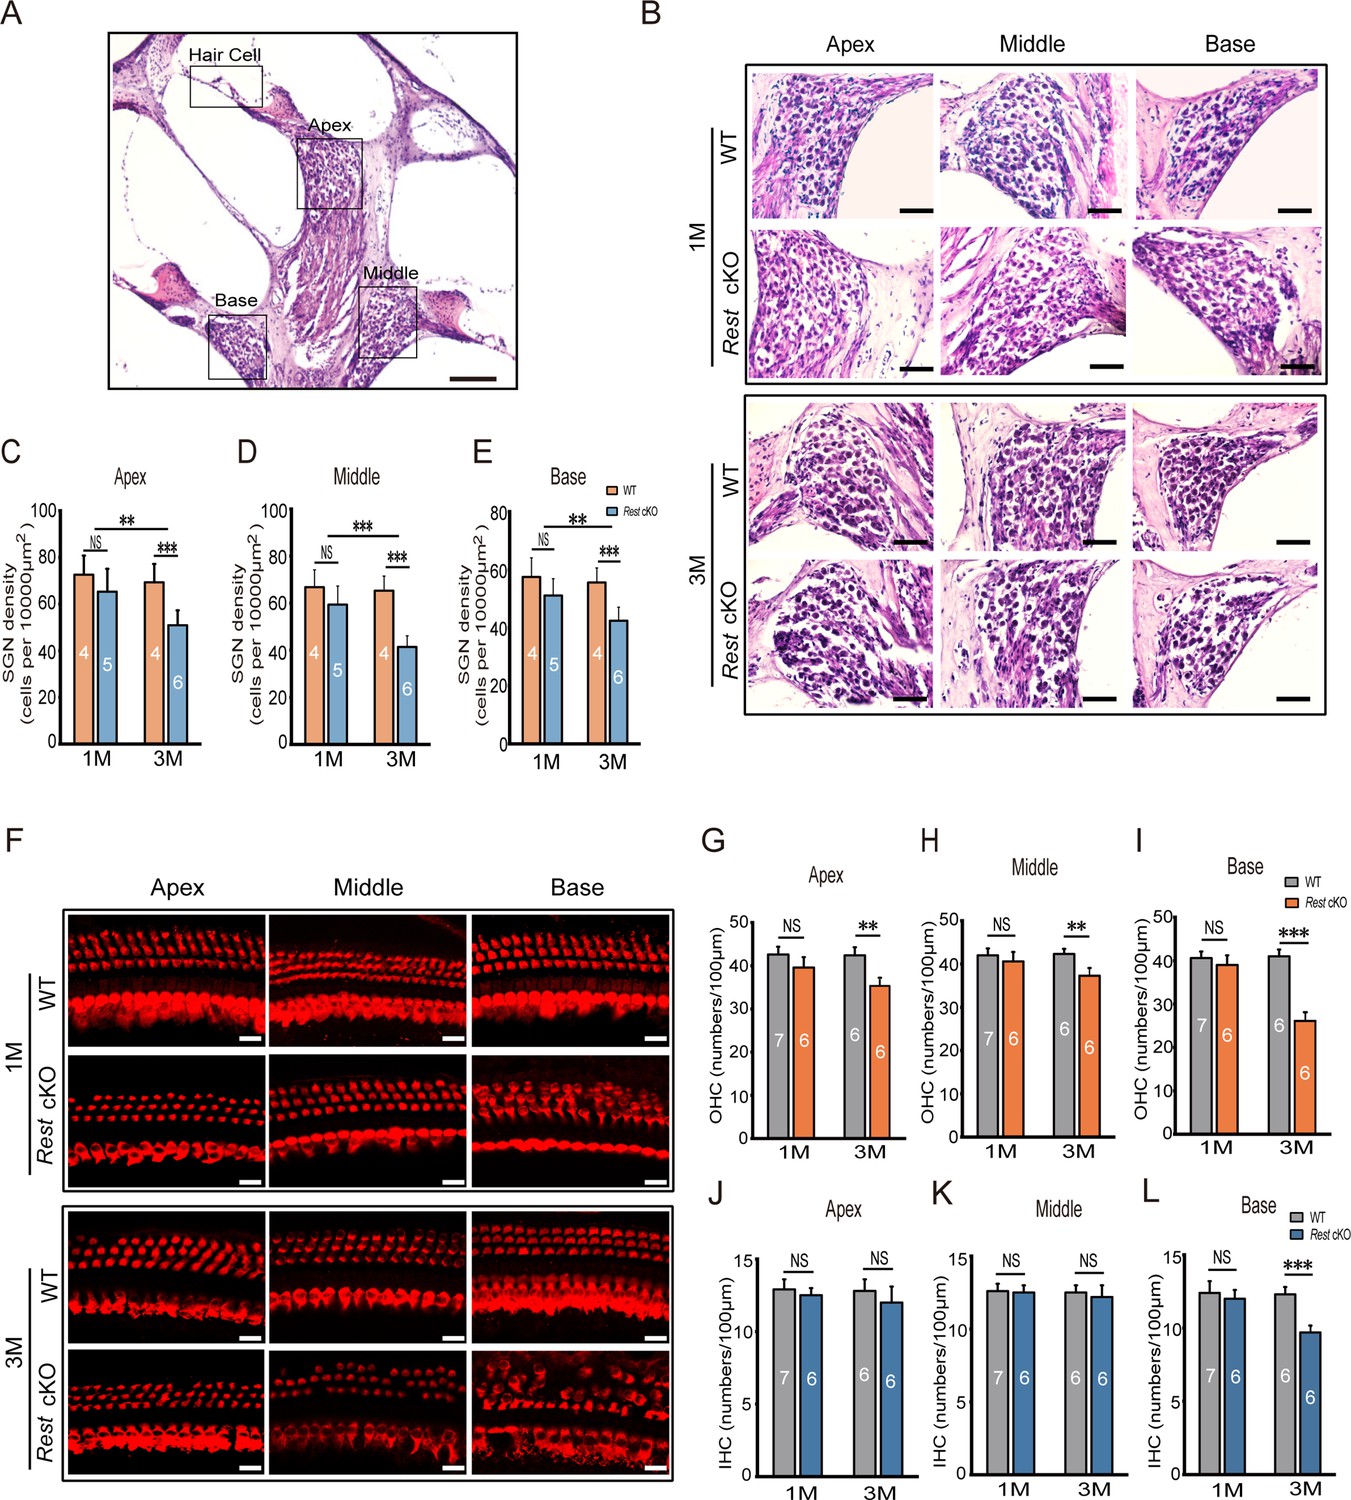
Degeneration of spiral ganglion neurons (SGNs) and hair cells (HCs) is observed in 3-month-old Rest conditional knockout (cKO) mice but not in 1-month-old mice.
(A, B) Morphometry changes in SGNs were observed in the apical, middle, and basal cochlea of 1- and 3-month-old wild-type (WT) and Rest cKO mice. Scale bar: 200 μm in (A) and 50 μm in (B). (C–E) SGNs were quantified in all three regions of the cochlea. (F) Myo7a-stained HCs from 1- and 3-month-old WT and Rest cKO mice. Scale bar: 20 μm. (G–I) Quantification of outer hair cells (OHCs) at the cochlea’s apical middle and basal regions in WT and Rest cKO mice (1M and 3M). (J–L) Quantification data of inner hair cells (IHCs) in WT and Rest cKO mice. Data are means ± SEM, **p<0.01, ***p<0.001.
-
Figure 2—source data 1
Original images and quantitative data of SGNs and HCs in WT and Rest cKO mice.
- https://cdn.elifesciences.org/articles/76754/elife-76754-fig2-data1-v2.zip
Figure 2—figure supplement 1
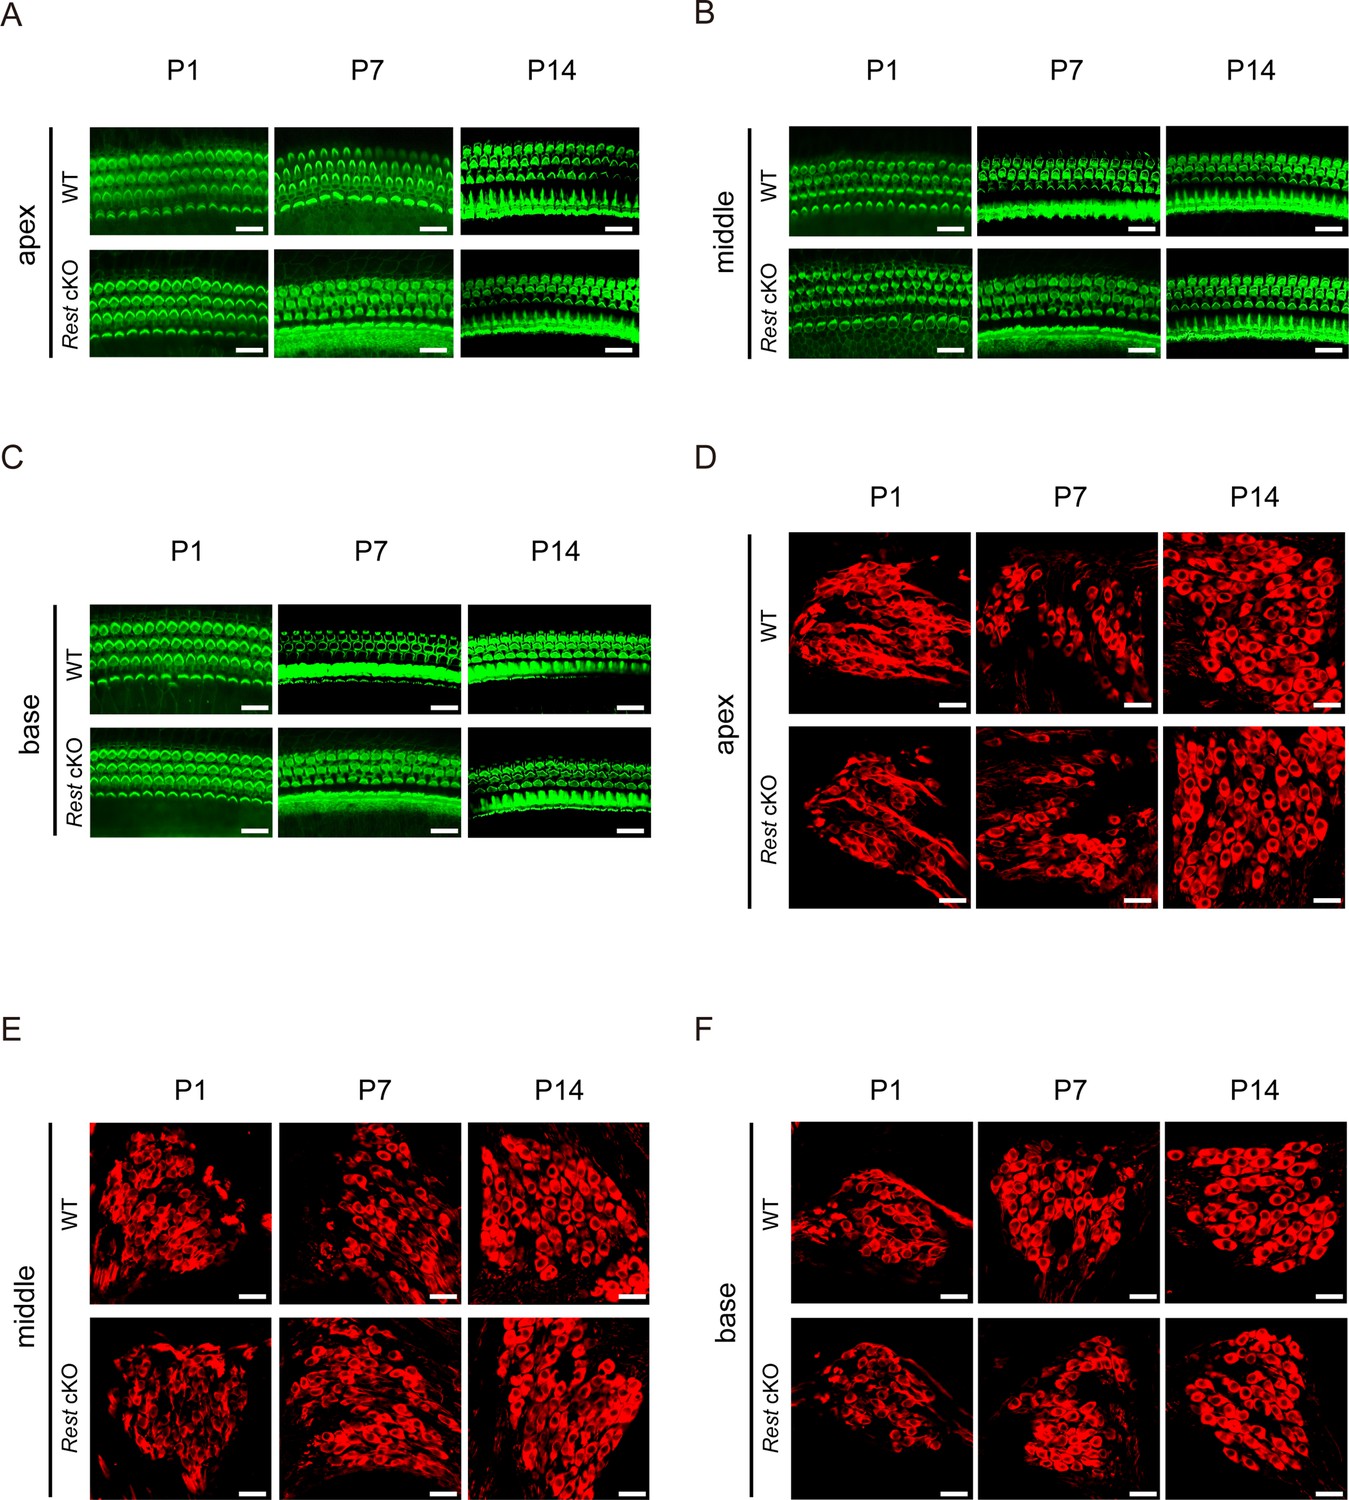
There are no detectable alterations in hair cell (HC) and spiral ganglion neuron (SGN) morphology in Rest conditional knockout (cKO) mice at P1, P7, and P14.
(A–C) Morphology of HCs in the apex, middle, and base of the cochlea of wild-type (WT) and Rest cKO mice at P1, P7, and P14. HCs were stained with phalloidin. Scale bar: 20 μm. (D–F) Morphology of SGNs in the apex, middle, and base of the WT and Rest cKO mice cochlea at P1, P7, and P14. SGNs were stained with Tuj1. Scale bar: 20 μm.
-
Figure 2—figure supplement 1—source data 1
Original images of SGNs and HCs in WT and Rest cKO mice at P1,P7 and P14.
- https://cdn.elifesciences.org/articles/76754/elife-76754-fig2-figsupp1-data1-v2.zip
Figure 3

Reduced excitability of spiral ganglion neurons (SGNs) in Rest conditional knockout (cKO) mice.
(A) Representative traces show spike patterns of SGNs in the apical and basal cochlea, recorded with whole-cell patch clamps. Spikes were generated by 0.4 nA current injection. (B) Pie charts illustrating the percentage abundance of the different spike patterns of SGNs in wild-type (WT) and Rest cKO mice. (C–F) The resting membrane potentials (RMPs) (C), action potential thresholds (D), latencies (E), and rheobases (F) were recorded from apical and basal SGNs in WT and Rest cKO mice at P14, 1, and 3 months. Data are means ± SEM, *p<0.05, **p<0.01,***p<0.001.
-
Figure 3—source data 1
Data of excitability of SGNs in WT and Rest cKO mice.
- https://cdn.elifesciences.org/articles/76754/elife-76754-fig3-data1-v2.zip
Figure 4
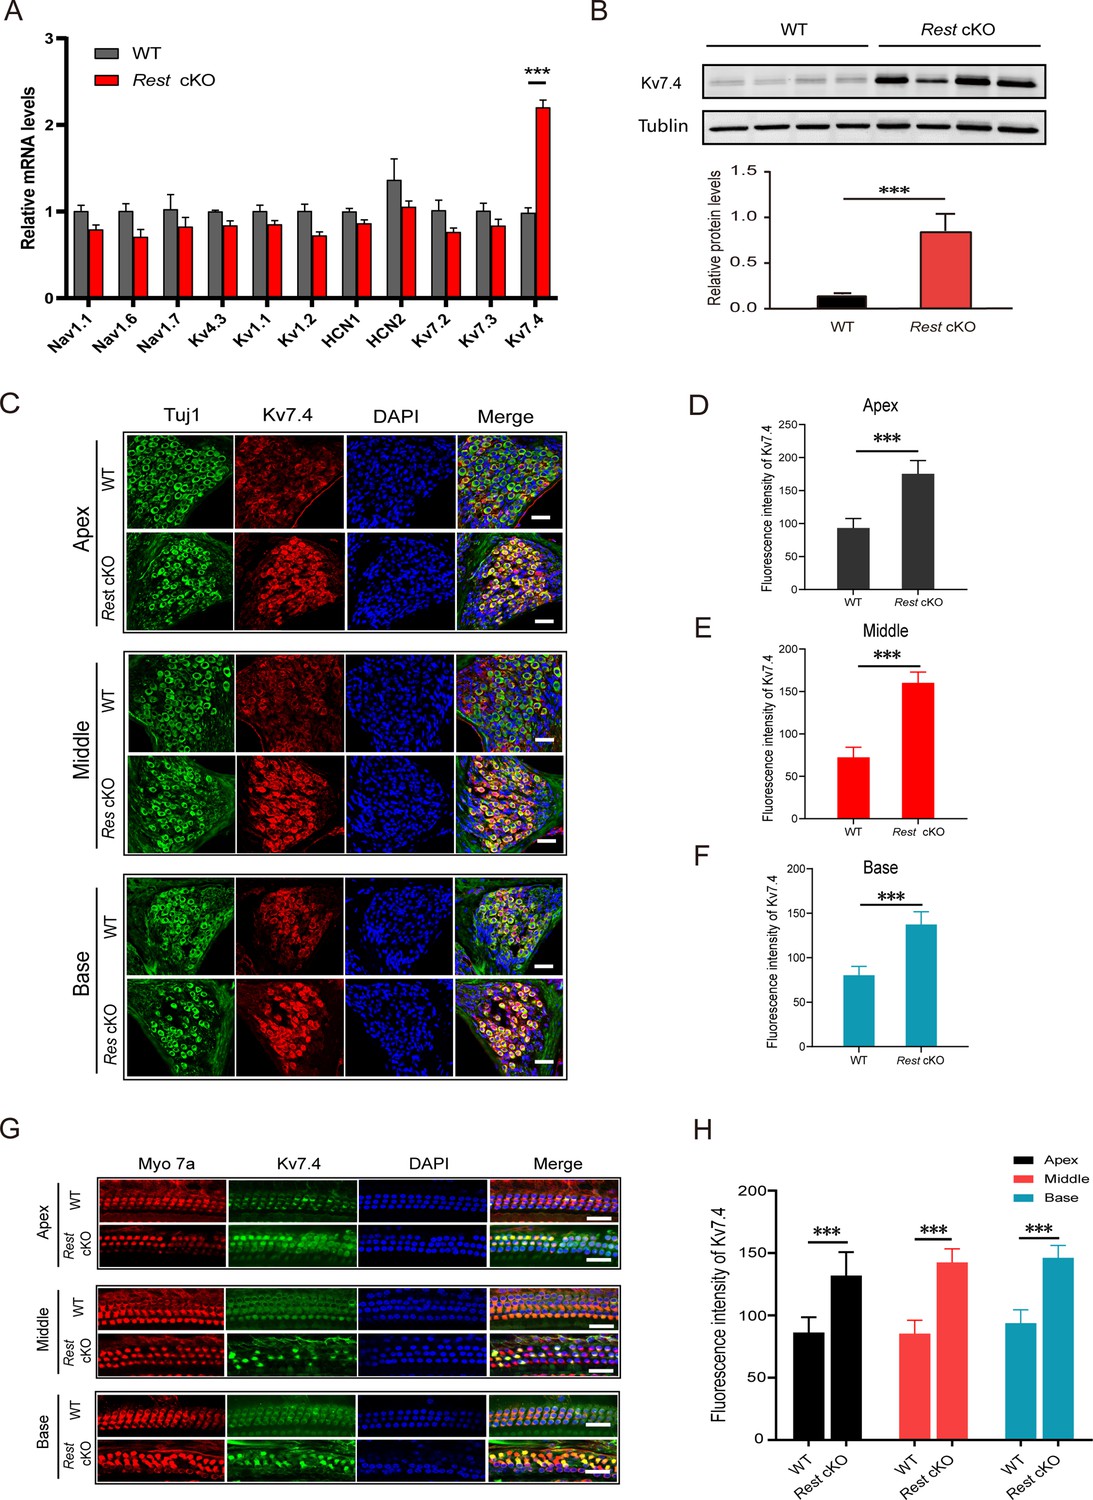
Kv7.4 expression is increased in spiral ganglion neurons (SGNs) and hair cells (HCs) of Rest conditional knockout (cKO) mice.
(A, B) Kcnq4 expression is significantly increased in the cochlea of Rest cKO mice at the mRNA and protein (Kv7.4) levels as determined by real-time PCR (A) and Western blotting (B). (C–F) Immunofluorescence shows increased Kv7.4 (red) expression in the SGNs from apical, middle, and basal cochlea in Rest cKO mice. Scale bar: 20 μm in (C, G). (G, H) Kv7.4 expression increases in HCs of Rest cKO mice. Data are means ± SEM, ***p<0.001.
-
Figure 4—source data 1
Data for Kv7.4 expression in SGNs and OHCs in WT and Rest cKO mice.
- https://cdn.elifesciences.org/articles/76754/elife-76754-fig4-data1-v2.zip
Figure 5 with 2 supplements

Increased Kv7 currents in the spiral ganglion neurons (SGNs) of Rest conditional knockout (cKO) mice.
(A) Whole-cell Kv7 currents were recorded in wild-type (WT) and Rest cKO SGNs. Representative Kv7 currents were calculated as XE991-sensitive currents upon voltage step from –20 mV to –60 mV. Arrowheads indicate the points at which XE99-sensitive currents were measured (A1). (B) Time course of outward K+ current inhibition by XE991 (3 μM). (C) Comparison of outward K+ current at –20 mV in individual SGNs from the apex (black) and base (red) of the cochlea in the absence (basal) and presence of XE991 (3 μM). (D, E) Summary data show that XE991-sensitive currents (Kv7 current) density is significantly increased in the apical and basal SGNs of 1- and 3-month-old Rest cKO mice compared to WT mice. Data are means ± SEM, *p<0.05, **p<0.01, ***p<0.001.
-
Figure 5—source data 1
Data of Kv7.4 channel currents recorded in SGNs of WT and Rest cKO mice.
- https://cdn.elifesciences.org/articles/76754/elife-76754-fig5-data1-v2.zip
Figure 5—figure supplement 1
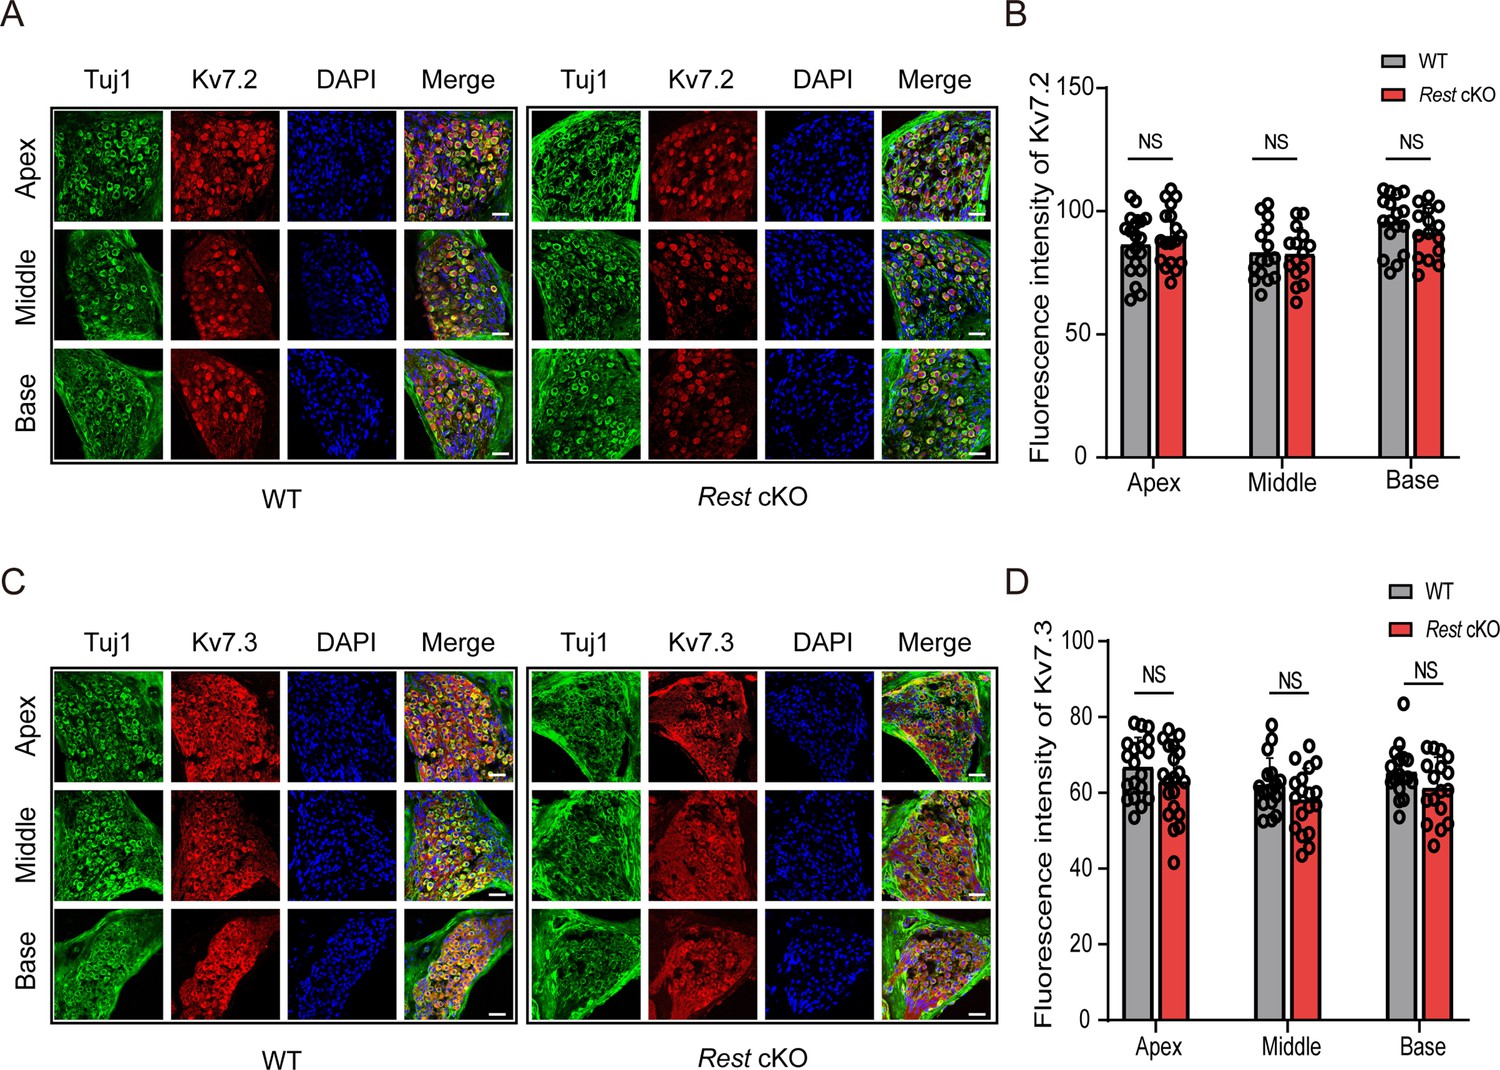
Expression of Kv7.2 and Kv7.3 in the spiral ganglion neurons (SGNs) of wild-type (WT) and Rest conditional knockout (cKO) mice.
(A) Expression of Kv7.2 (red) in the SGNs (green) of 1-month-old WT and Rest cKO mice. (B) Quantification of Kv7.2 expression in the SGNs of WT and Rest cKO mice. (C) Expression of Kv7.3 (red) in the SGNs of 1-month-old WT and Rest cKO mice. Scale bar: 20 μm in (A, C). (D) Quantification of Kv7.3 expression in the SGNs of WT and Rest cKO mice.
-
Figure 5—figure supplement 1—source data 1
Images and quantitative data of Kv7.2 and Kv7.3 expression in SGNs of WT and Rest cKO mice.
- https://cdn.elifesciences.org/articles/76754/elife-76754-fig5-figsupp1-data1-v2.zip
Figure 5—figure supplement 2
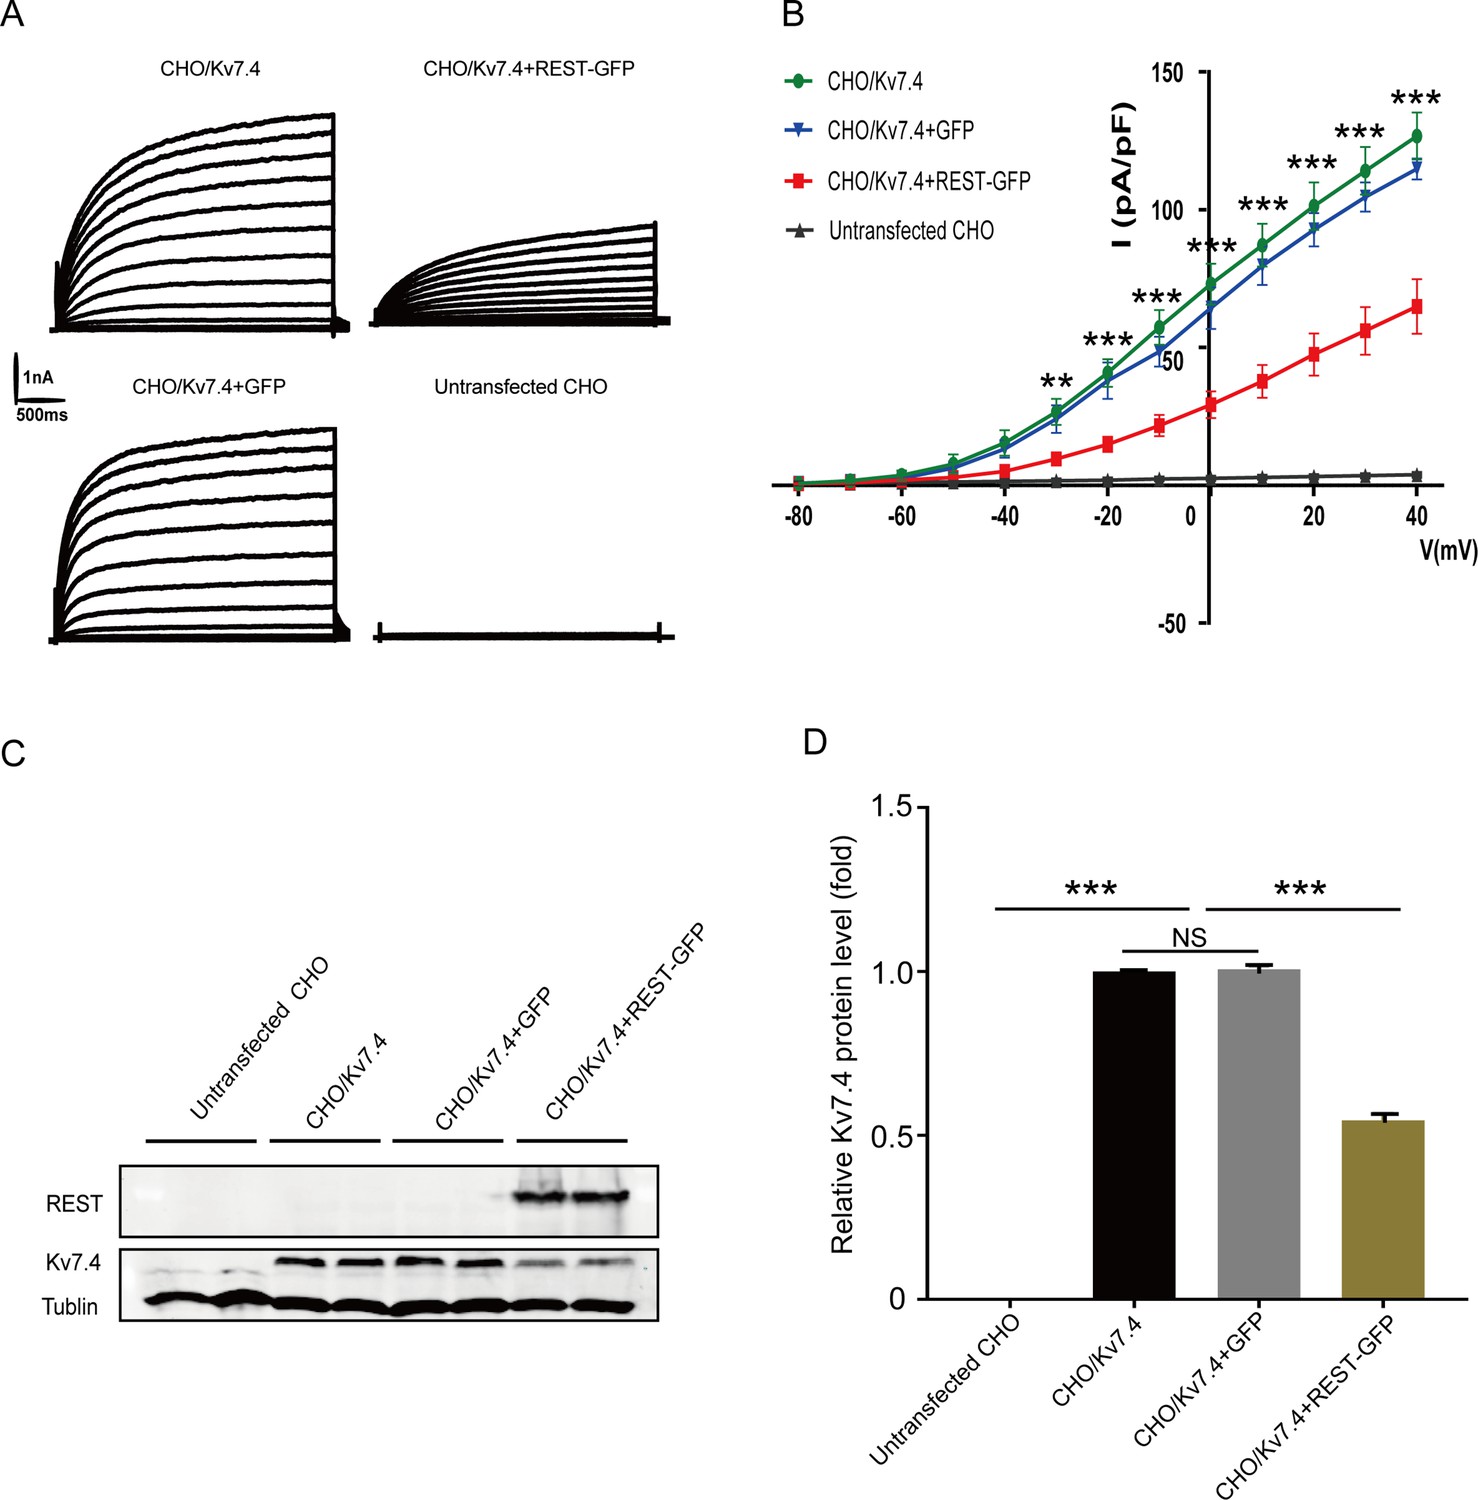
Repressor element 1-silencing transcription factor (REST) inhibited Kv7.4 channels in Kv7.4-transfected Chinese hamster ovary (CHO) cells.
(A) Representative current traces were recorded from CHO cells. Cell types included untransfected CHO cells, CHO cells stably expressing the Kv7.4 channel (CHO/Kv7.4), CHO/Kv7.4 cells that were transfected with the REST-GFP plasmid (CHO/Kv7.4 + REST-GFP), or transfected with GFP only (CHO/Kv7.4 + GFP). Cells were held at –80 mV and increased to +40 mV in 10 mV increments. (B) Corresponding current density–voltage relationships of the cells described in (A). (C) Western blotting of Kv7.4 expression in the untransfected CHO, CHO/Kv7.4, CHO/Kv7.4 + REST-GFP, and CHO/Kv7.4 + GFP groups. (D) Summary data in (C) show that Kv7.4 expression is inhibited by transfection with REST. Data are presented as means ± SEM, ***p<0.001.
-
Figure 5—figure supplement 2—source data 1
Voltage clamp and Western Blotting data of Kv7.4 inhibited by REST in CHO cells.
- https://cdn.elifesciences.org/articles/76754/elife-76754-fig5-figsupp2-data1-v2.zip
Figure 6
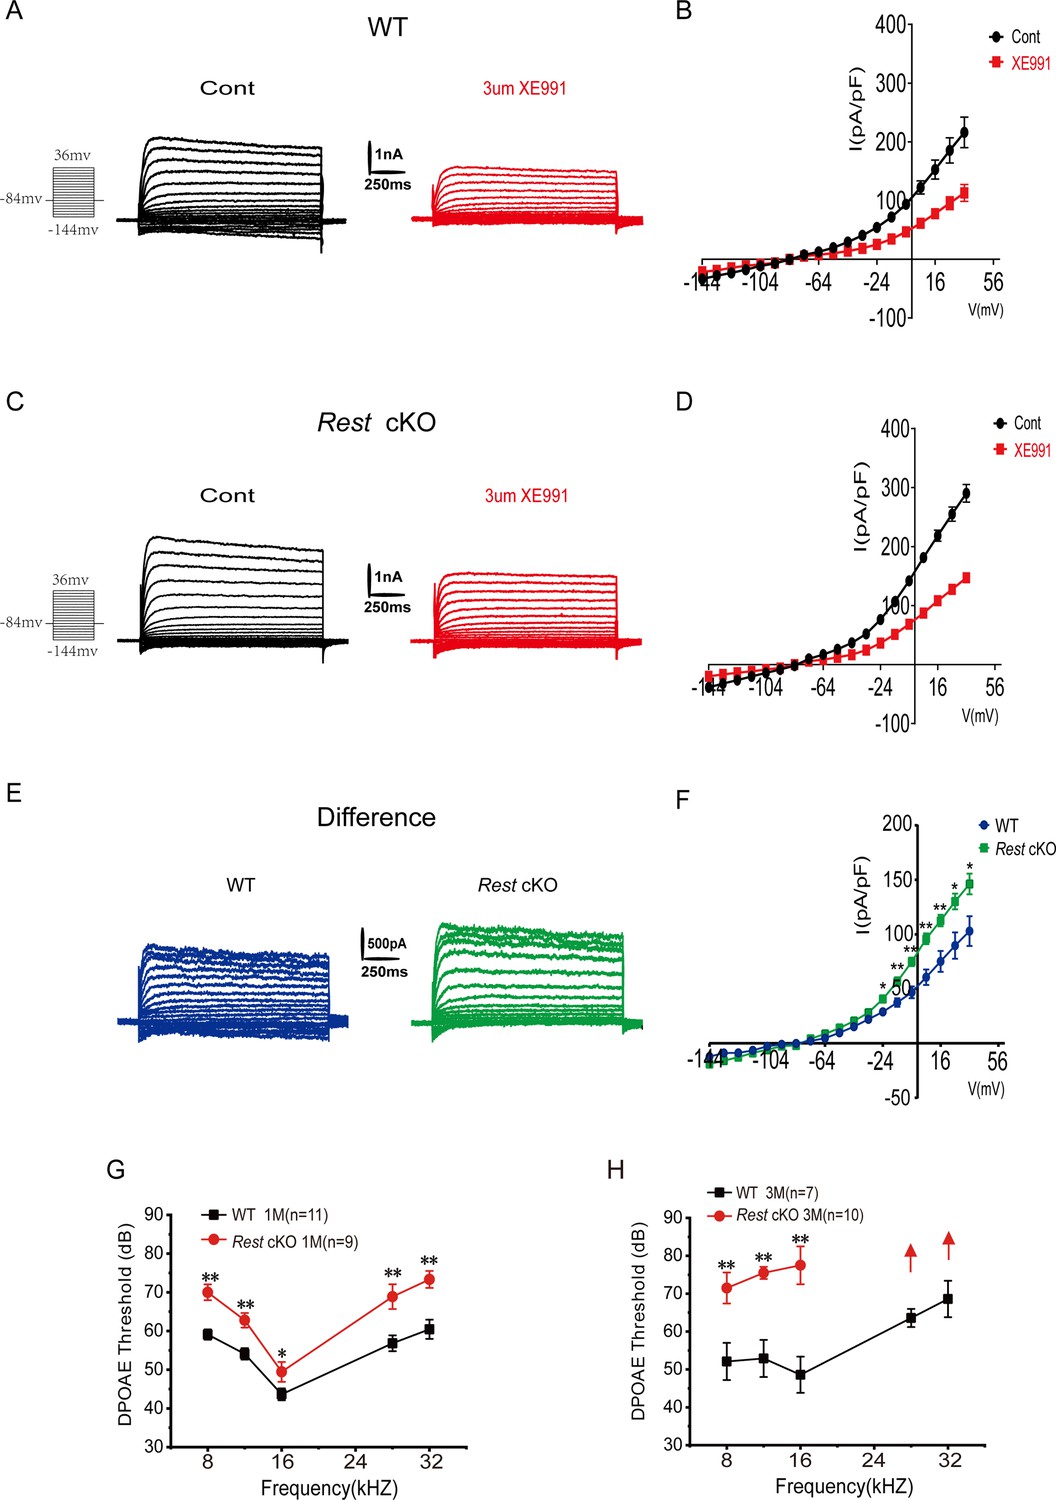
Increased Kv7 currents in the outer hair cells (OHCs) of Rest conditional knockout (cKO) mice.
(A) Representative current traces recorded from the OHCs of P13 wild-type (WT) mice and the resulting traces after application of XE991. K+ currents were obtained from a holding potential of –84 mV and stepped up from –144 to +34 mV, with 10 mV increments (left panel). (B) Current density–voltage curves are shown before and after XE991 (3 μM) application in WT mice. (C) Similar data was obtained from the OHCs of Rest cKO mice in the control condition, and after XE991 (3 μM), current traces were applied. (D) Current density–voltage curves are shown before and after the application of XE991 in Rest cKO mice. (E) The difference current traces, which represent the XE991-sensitive currents. (F) Difference current density–voltage curve obtained from OHCs in WT and Rest cKO mice. (G, H) Distortion product otoacoustic emission (DPOAE) threshold measurement of 1- and 3-month-old WT and Rest cKO mice. Data are means ± SEM, *p<0.05, **p<0.01.
-
Figure 6—source data 1
Data of Kv7.4 channel currents recorded in OHCs of WT and Rest cKO mice.
- https://cdn.elifesciences.org/articles/76754/elife-76754-fig6-data1-v2.zip
Figure 7 with 2 supplements
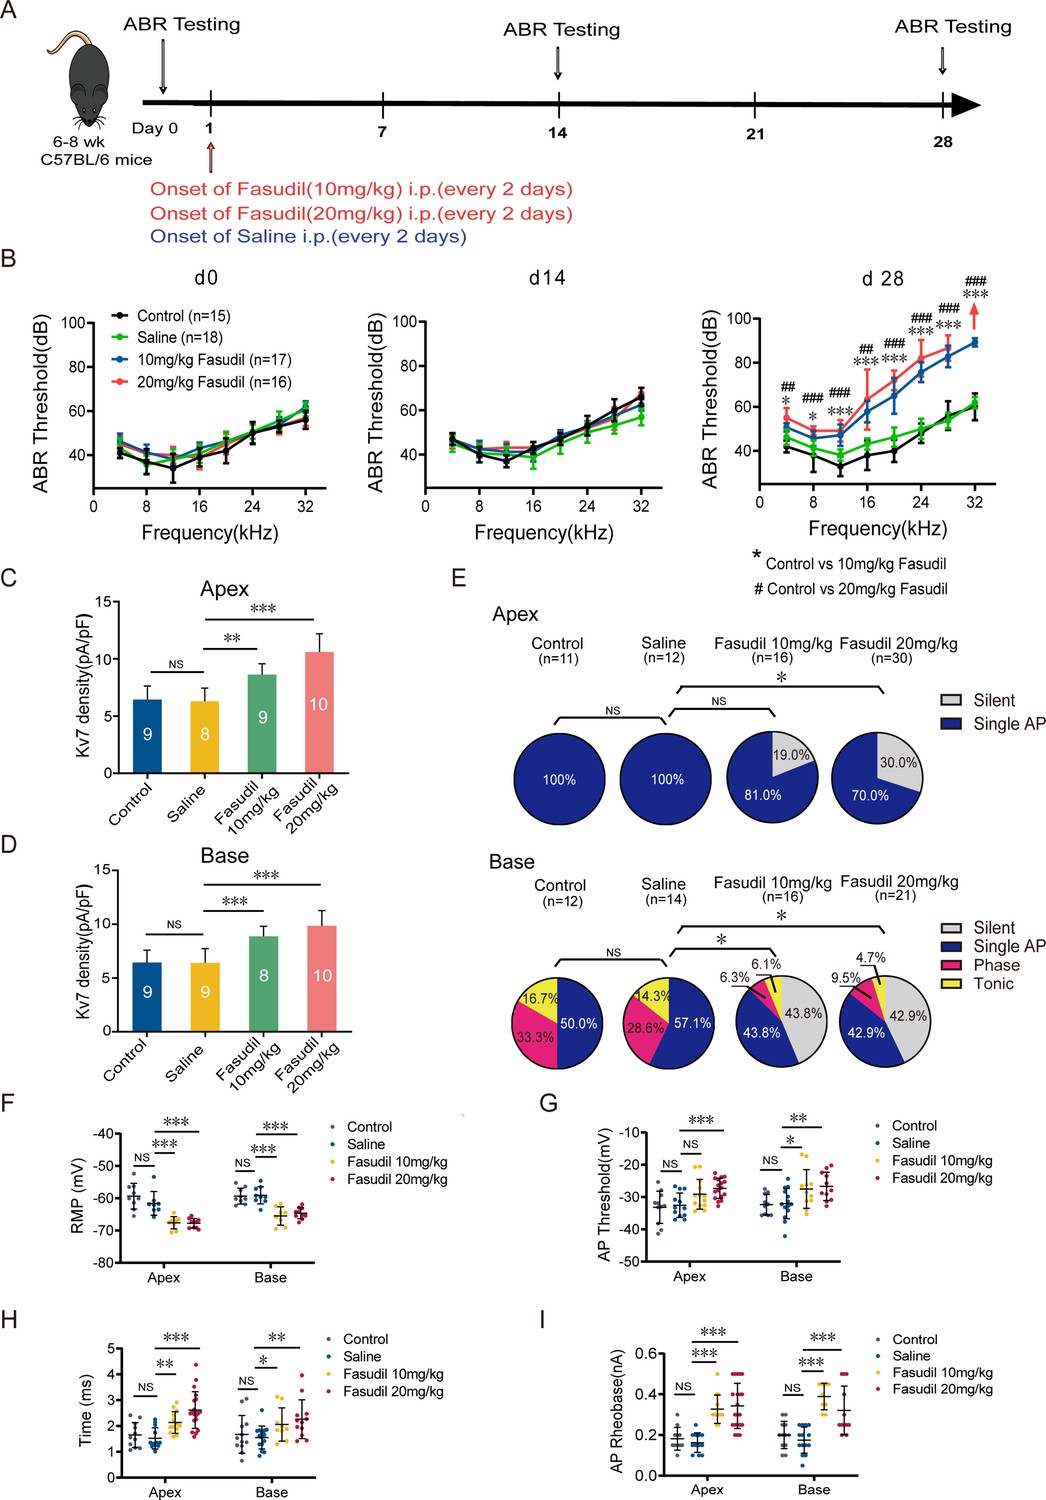
Kv7.4 channel activation induced hearing impairments.
(A) Timeline for auditory brainstem response (ABR) testing and drug treatment. Fasudil was administered to 6–8-week-old wild-type (WT) mice intraperitoneally at 10 mg/kg or 20 mg/kg every other day for 28 days. (B) ABR thresholds in control, saline, and fasudil (10 mg/kg, 20 mg/kg) treatment groups on days 0, 14, and 28. (C, D) Summary data show increased Kv7 current density in the apical and basal spiral ganglion neurons (SGNs) of fasudil (10 mg/kg, 20 mg/kg)-treated mice. (E) Summary of spike patterns recorded in SGNs from control, saline, and fasudil (10 mg/kg, 20 mg/kg)-treated mice. (F–I) Resting membrane potentials (RMPs), action potential thresholds, latencies, and rheobases were recorded from mice’s apical and basal SGNs. Data are means ± SEM, *p<0.05, **p<0.01, ***p<0.001.
-
Figure 7—source data 1
Data of the effect of fasudil on hearing function and excitability of SGNs in WT mice.
- https://cdn.elifesciences.org/articles/76754/elife-76754-fig7-data1-v2.zip
Figure 7—figure supplement 1
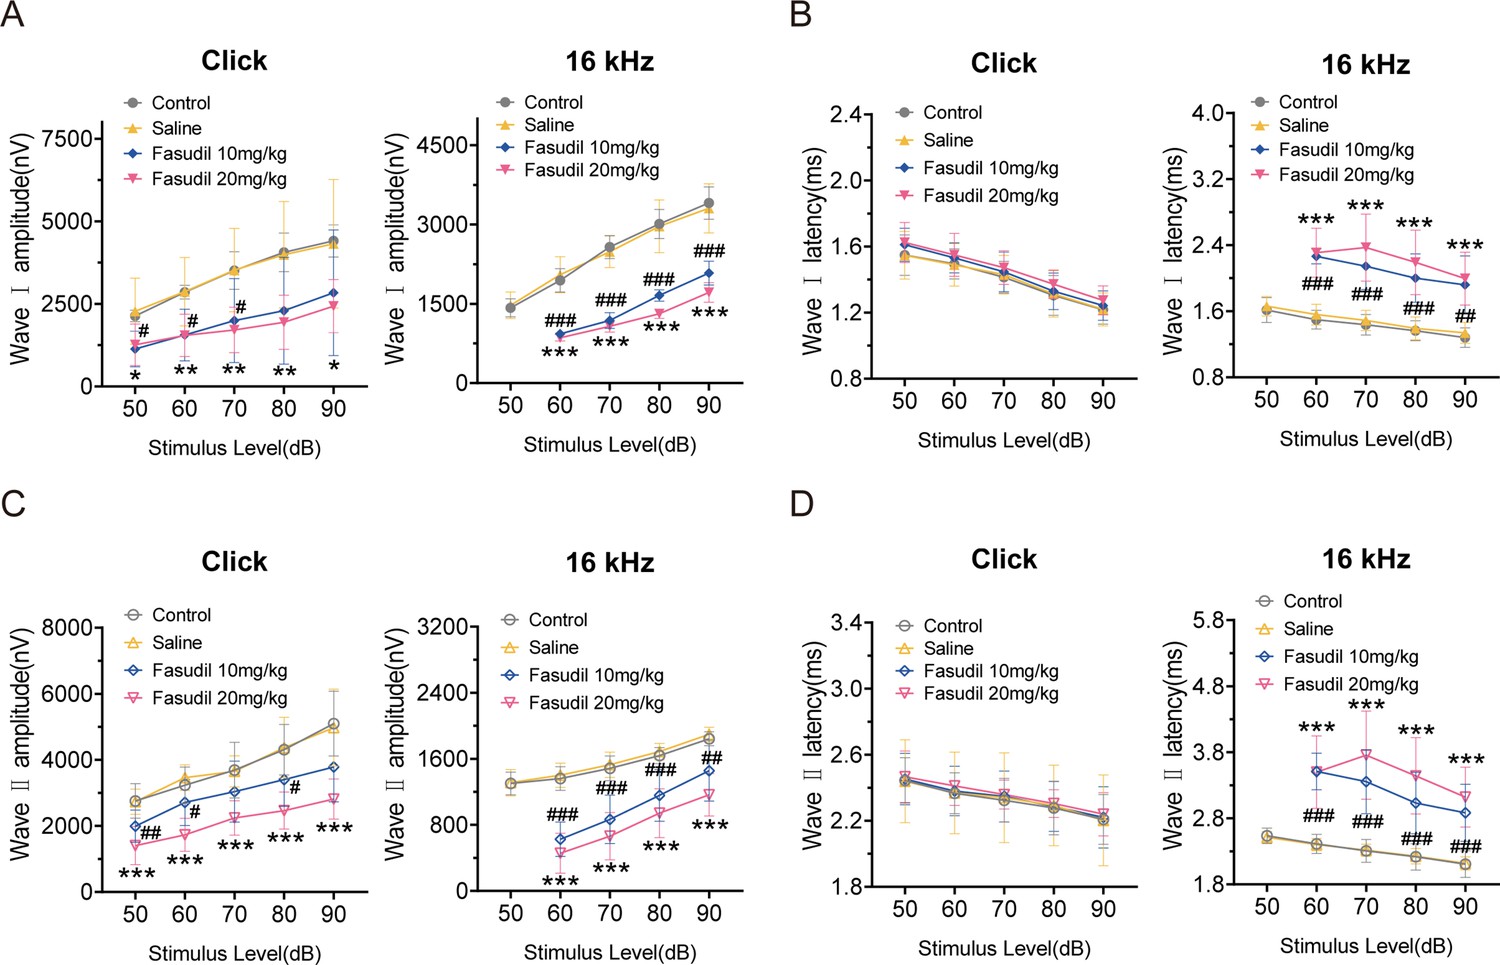
Amplitudes and latencies of auditory brainstem response (ABR) waves Ⅰ and Ⅱ in control, saline, and fasudil-treated mice.
(A, B) ABR amplitudes (A) and latencies (B) of wave I were measured with click and 16 kHz pure-tone stimuli in the control, saline, and fasudil (10 mg/kg, 20 mg/kg) treatment groups. (C, D) ABR amplitudes (C) and latencies (D) of wave II were measured with click and 16 kHz pure-tone stimuli in the control, saline, and fasudil (10 mg/kg, 20 mg/kg) treatment groups. Control, n = 7; saline, n = 7; fasudil 10 mg/kg, n = 8; fasudil 20 mg/kg, n = 8. #Fasudil 10 mg/kg vs. control, *fasudil 20 mg/kg vs. control. Data are means ± SEM, *p<0.05, **p<0.01, ***p<0.001.
-
Figure 7—figure supplement 1—source data 1
Data of latencies and amplitudes of ABR waves in fasudil-treated mice.
- https://cdn.elifesciences.org/articles/76754/elife-76754-fig7-figsupp1-data1-v2.zip
Figure 7—figure supplement 2
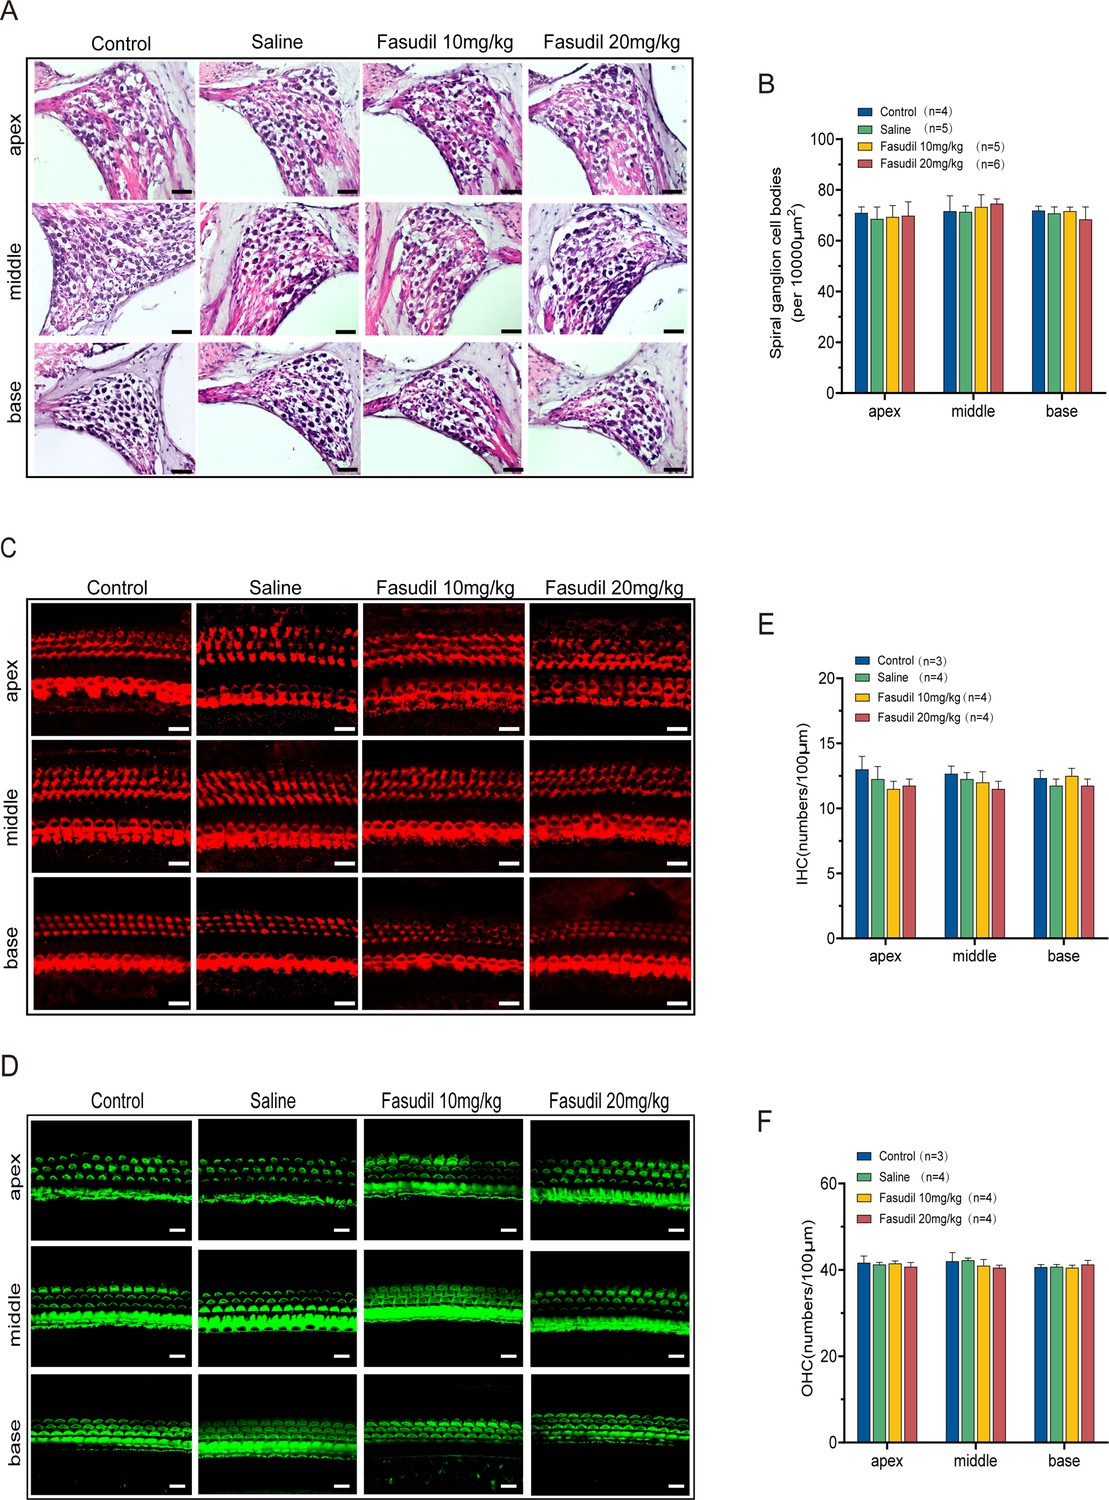
Fasudil did not alter the morphometry of spiral ganglion neurons (SGNs) and hair cells (HCs).
(A) Morphometry of SGNs in the control, saline, and fasudil (10 mg/kg, 20 mg/kg) treatment groups. Scale bar: 50 μm. (B) Quantifying SGNs in the apical, middle, and basal regions of the cochlea of the different groups. (C, D) HC bodies (C) and bundles (D) are shown in mice from the control, saline, and fasudil (10 mg/kg, 20 mg/kg) treatment groups. Scale bar: 20 μm. (E, F) The inner hair cells (IHCs) and outer hair cells (OHCs) were counted at the cochlea’s apex, middle, and base from the control, saline, and fasudil (10 mg/kg, 20 mg/kg) treatment groups, respectively. Data are presented as means ± SEM.
-
Figure 7—figure supplement 2—source data 1
Morphological data of cochlear cells in fasudil-treated mice.
- https://cdn.elifesciences.org/articles/76754/elife-76754-fig7-figsupp2-data1-v2.zip
Figure 8 with 1 supplement
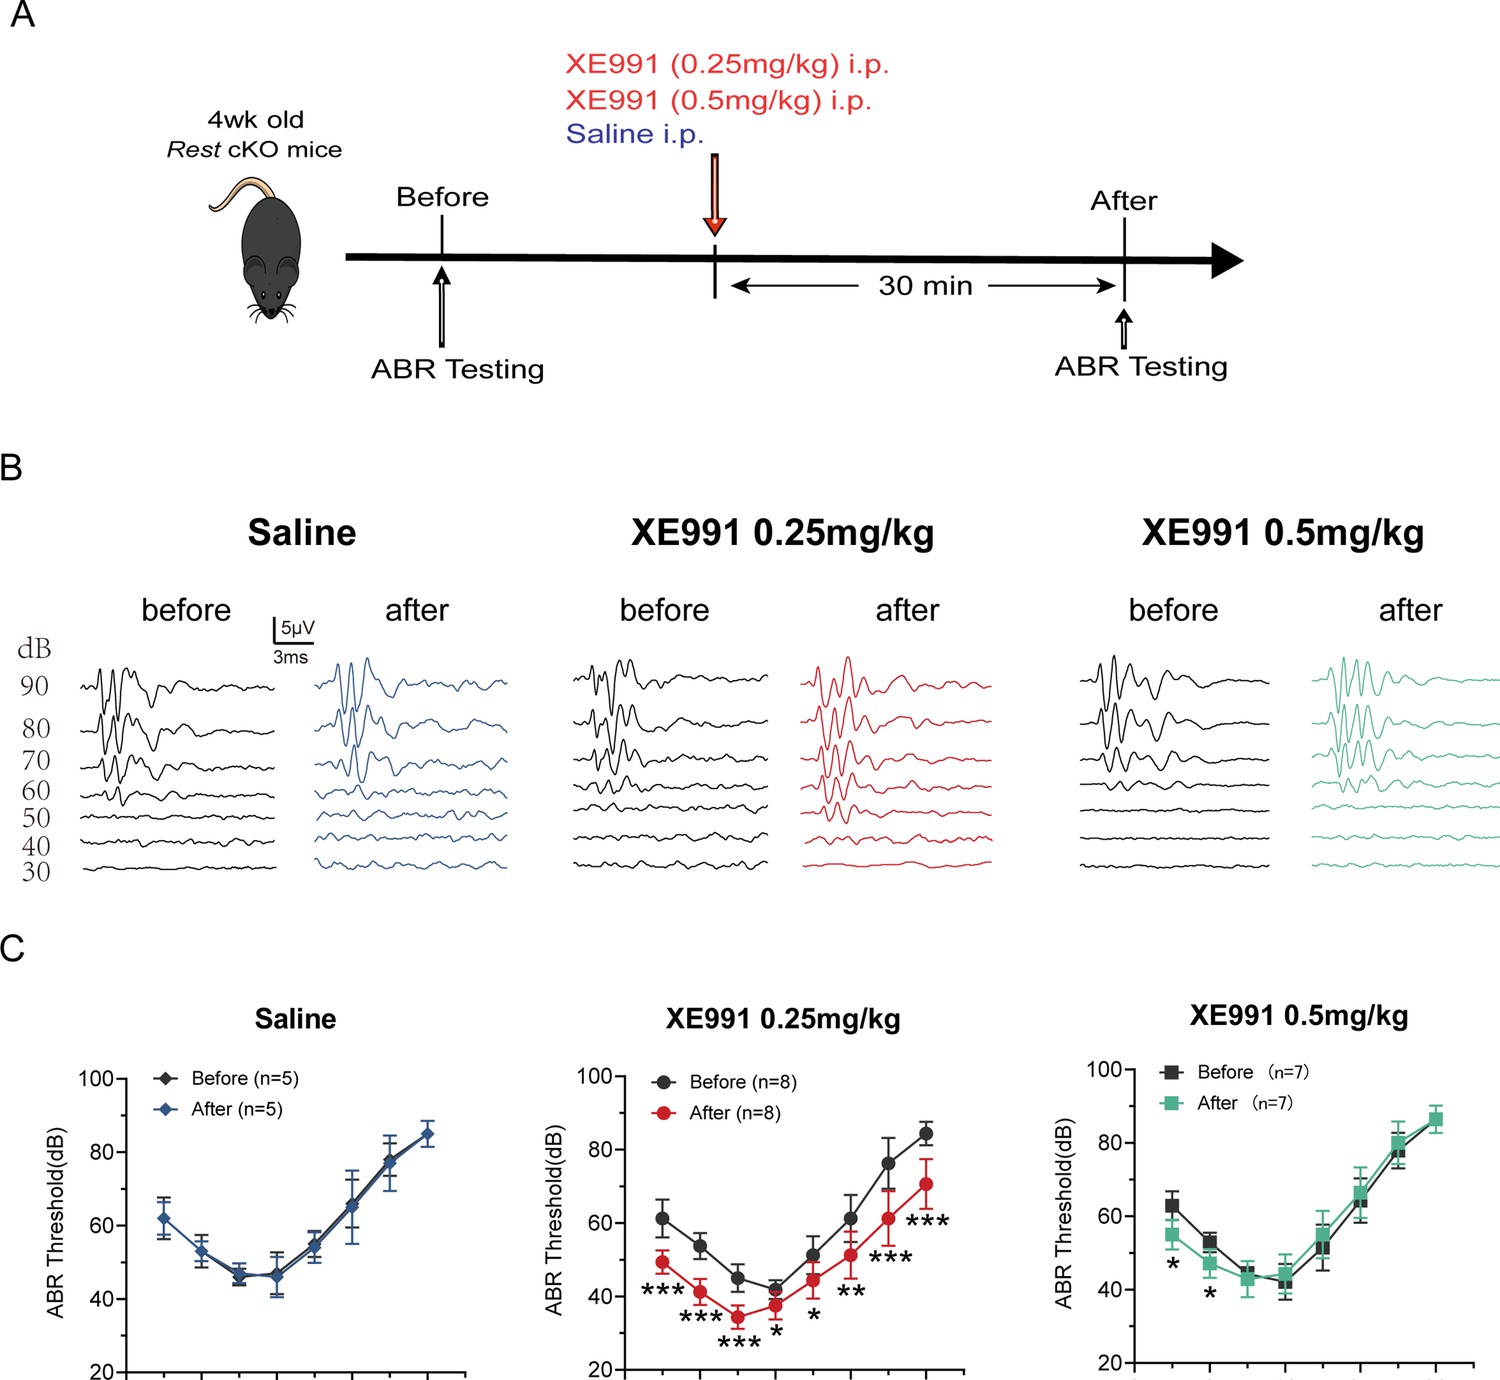
Kv7 channel blocking rescues hearing of Rest conditional knockout (cKO) mice.
(A) Timeline for auditory brainstem response (ABR) testing and drug treatment. XE991 was administered to 1-month-old Rest cKO mice intraperitoneally at 0.25 mg/kg or 0.5 mg/kg. (B) Representative ABR waveforms in response to clicking (90–30 dB) sound pressure levels in the saline and XE991-treated groups mice. (C) ABR thresholds in the saline and XE991 (0.25, 0.5 mg/kg) treatment groups. Data are means ± SEM, *p<0.05, **p<0.01, ***p<0.001.
-
Figure 8—source data 1
ABR data in control and XE991-treated mice.
- https://cdn.elifesciences.org/articles/76754/elife-76754-fig8-data1-v2.zip
Figure 8—figure supplement 1
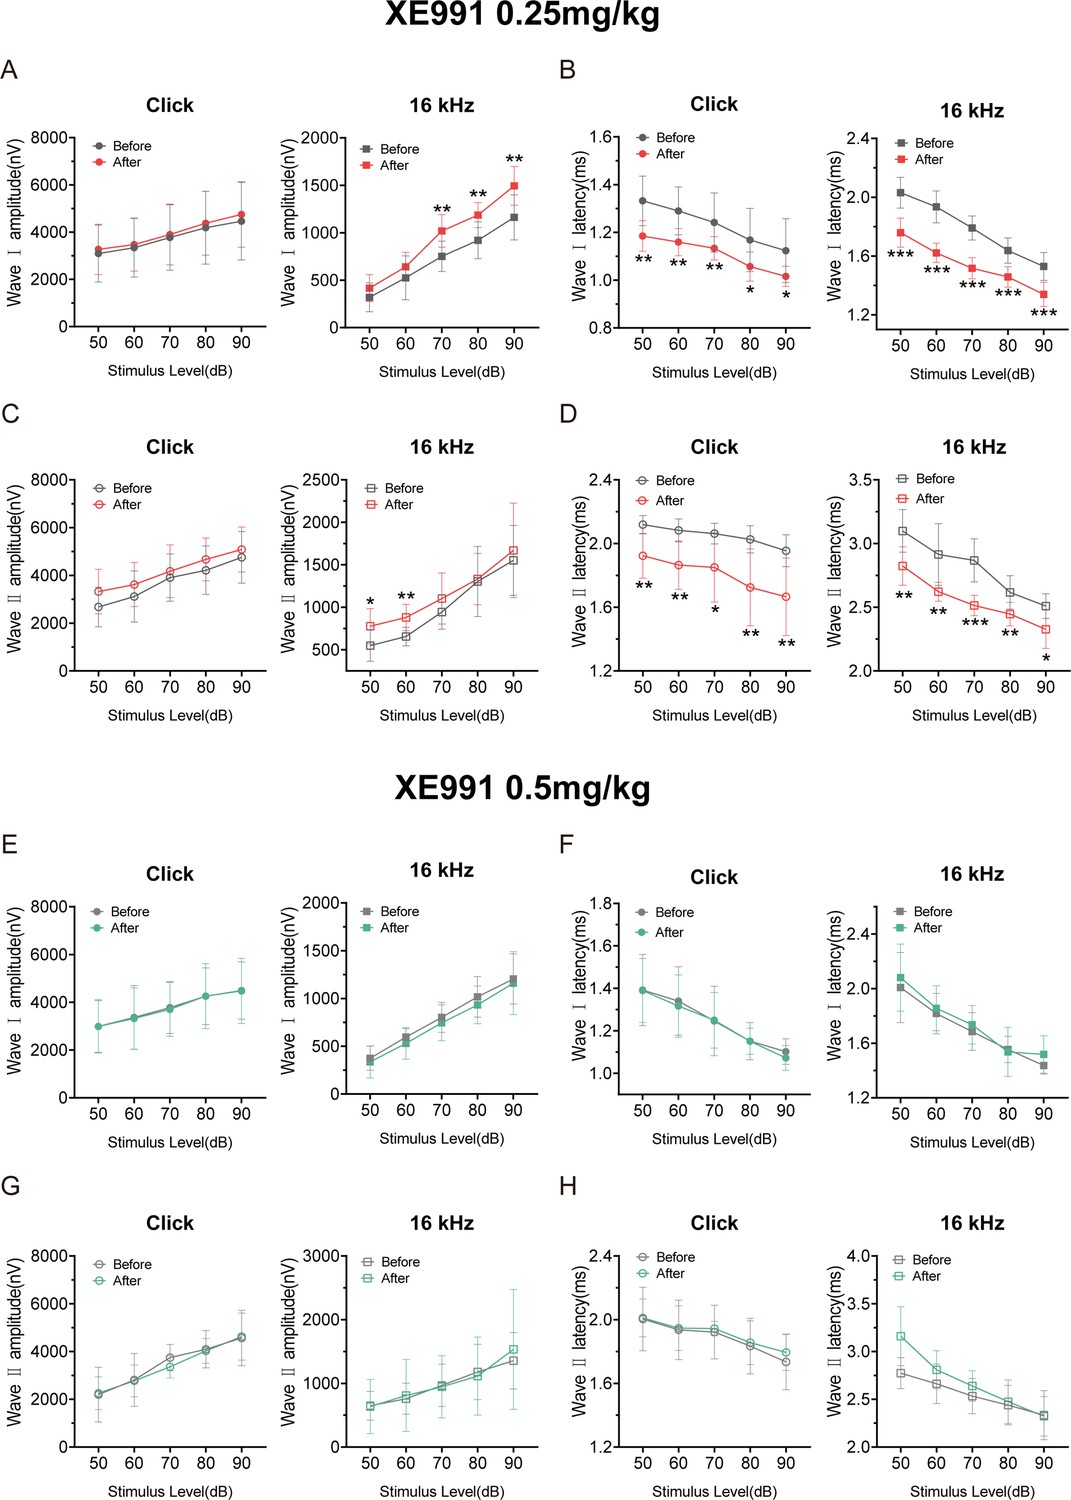
Amplitudes and latencies of auditory brainstem response (ABR) waves Ⅰ and Ⅱ in saline and XE991-treated mice.
(A–D) ABR amplitudes (A, C) and latencies (B, D) of wave I (A, B) and wave II (C, D) were measured with click and 16 kHz pure-tone stimuli before and after administration of XE991 (0.25 mg/kg, n = 8). (E–H) ABR amplitudes (E, G) and latencies (F, H) of wave I (E, F) and wave II (G, H) were measured with click and 16 kHz pure-tone stimuli before and after administration of XE991 (0.5 mg/kg, n = 7). Data are means ± SEM, *p<0.05, **p<0.01, ***p<0.001.
-
Figure 8—figure supplement 1—source data 1
Data of latencies and amplitudes of ABR waves in saline and XE991-treated mice.
- https://cdn.elifesciences.org/articles/76754/elife-76754-fig8-figsupp1-data1-v2.zip
Author response image 1

Author response image 2
Additional files
-
Transparent reporting form
- https://cdn.elifesciences.org/articles/76754/elife-76754-transrepform1-v2.docx
-
Source data 1
Primer information for genotyping of the mouse tails and single-cell RT-PCR and quantitative real-time PCR.
- https://cdn.elifesciences.org/articles/76754/elife-76754-data1-v2.docx
Download links
A two-part list of links to download the article, or parts of the article, in various formats.
Downloads (link to download the article as PDF)
Open citations (links to open the citations from this article in various online reference manager services)
Cite this article (links to download the citations from this article in formats compatible with various reference manager tools)
Repressor element 1-silencing transcription factor deficiency yields profound hearing loss through Kv7.4 channel upsurge in auditory neurons and hair cells
eLife 11:e76754.
https://doi.org/10.7554/eLife.76754


