Understanding drivers of phylogenetic clustering and terminal branch lengths distribution in epidemics of Mycobacterium tuberculosis
- Department of Plant and Microbial Biology, University of Zurich, Switzerland
Figures
Figure 1
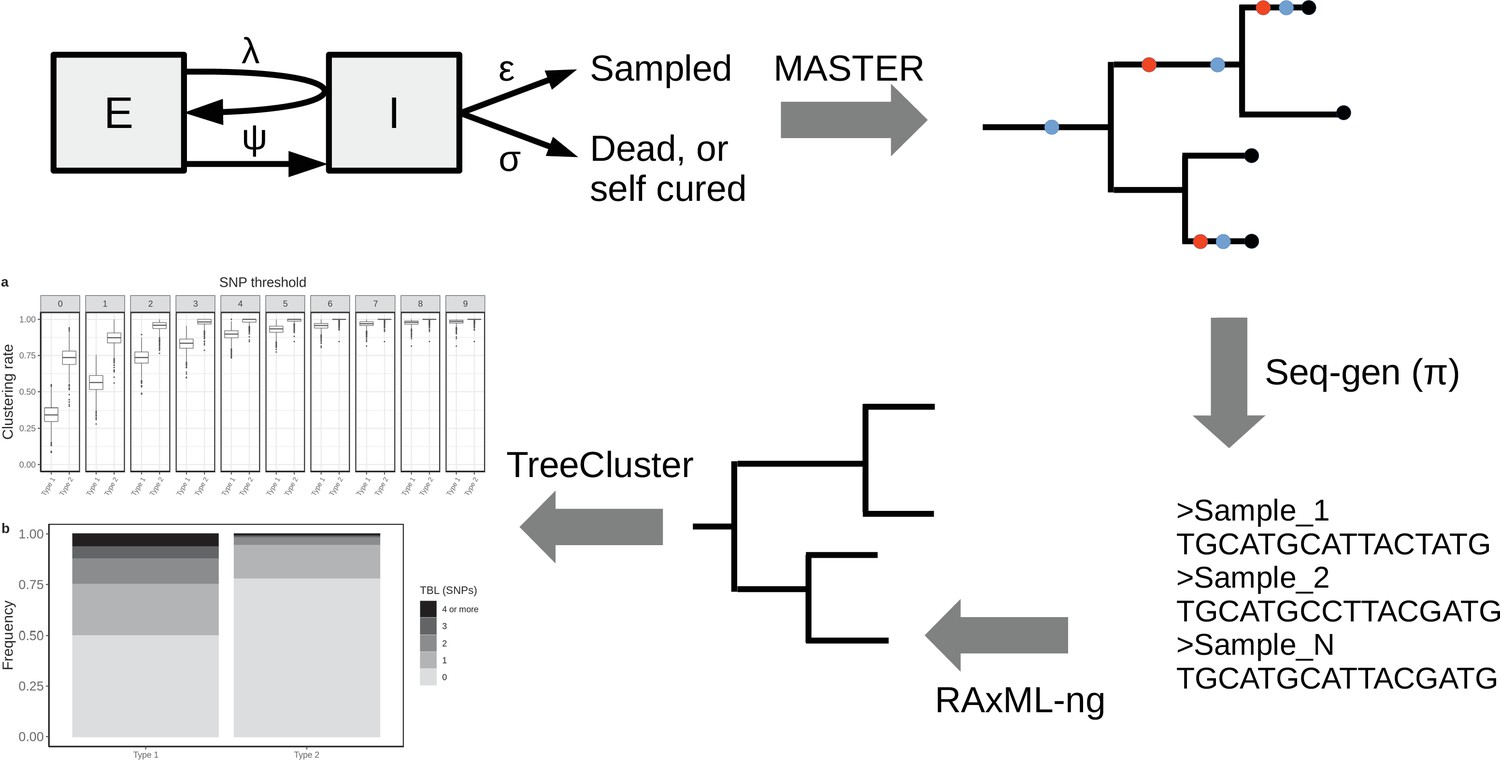
Simplified workflow, not all steps are depicted (see the Materials and methods section for details).
A transmission tree is simulated by MASTER, given the represented epidemiological model and a set of parameters (λ, ψ, σ, and ε). Seq-gen is used to simulate the evolution of MTB genome sequences along the tree, given a clock rate (π). RAxML-ng is used to estimate the phylogenetic tree from the sequence data, and TreeCluster to perform clustering.
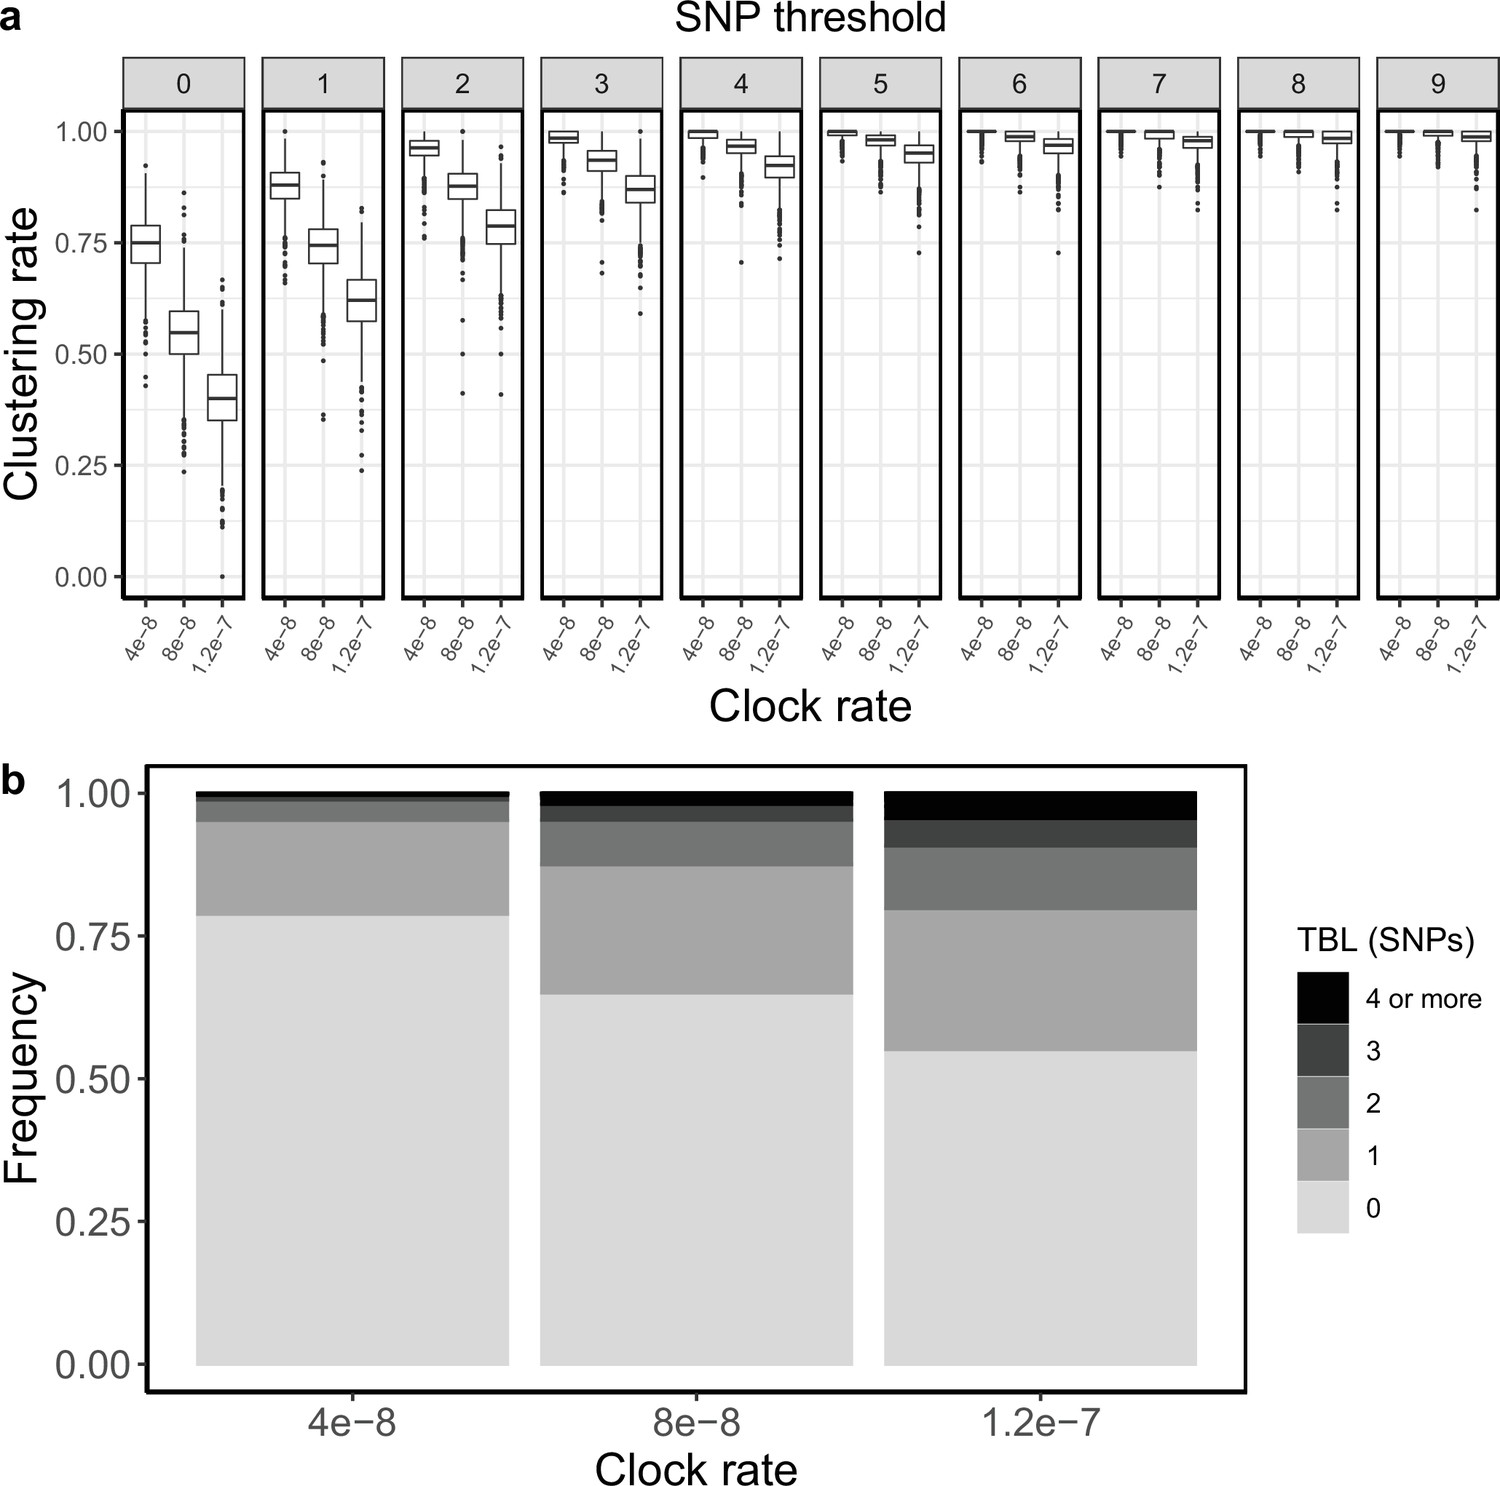
Figure 2

Clustering rates and TBL distributions for different rates of progression to infectiousness, and therefore latency period.
(a) Clustering rates with different SNP thresholds. Only SNP thresholds up to the highest 95% sensitivity threshold are plotted (i.e. for thresholds higher than 10 SNPs more than 95% of samples are clustered in more than 95% of simulations for all settings). (b) Overall TBL distributions computed by merging all simulations.
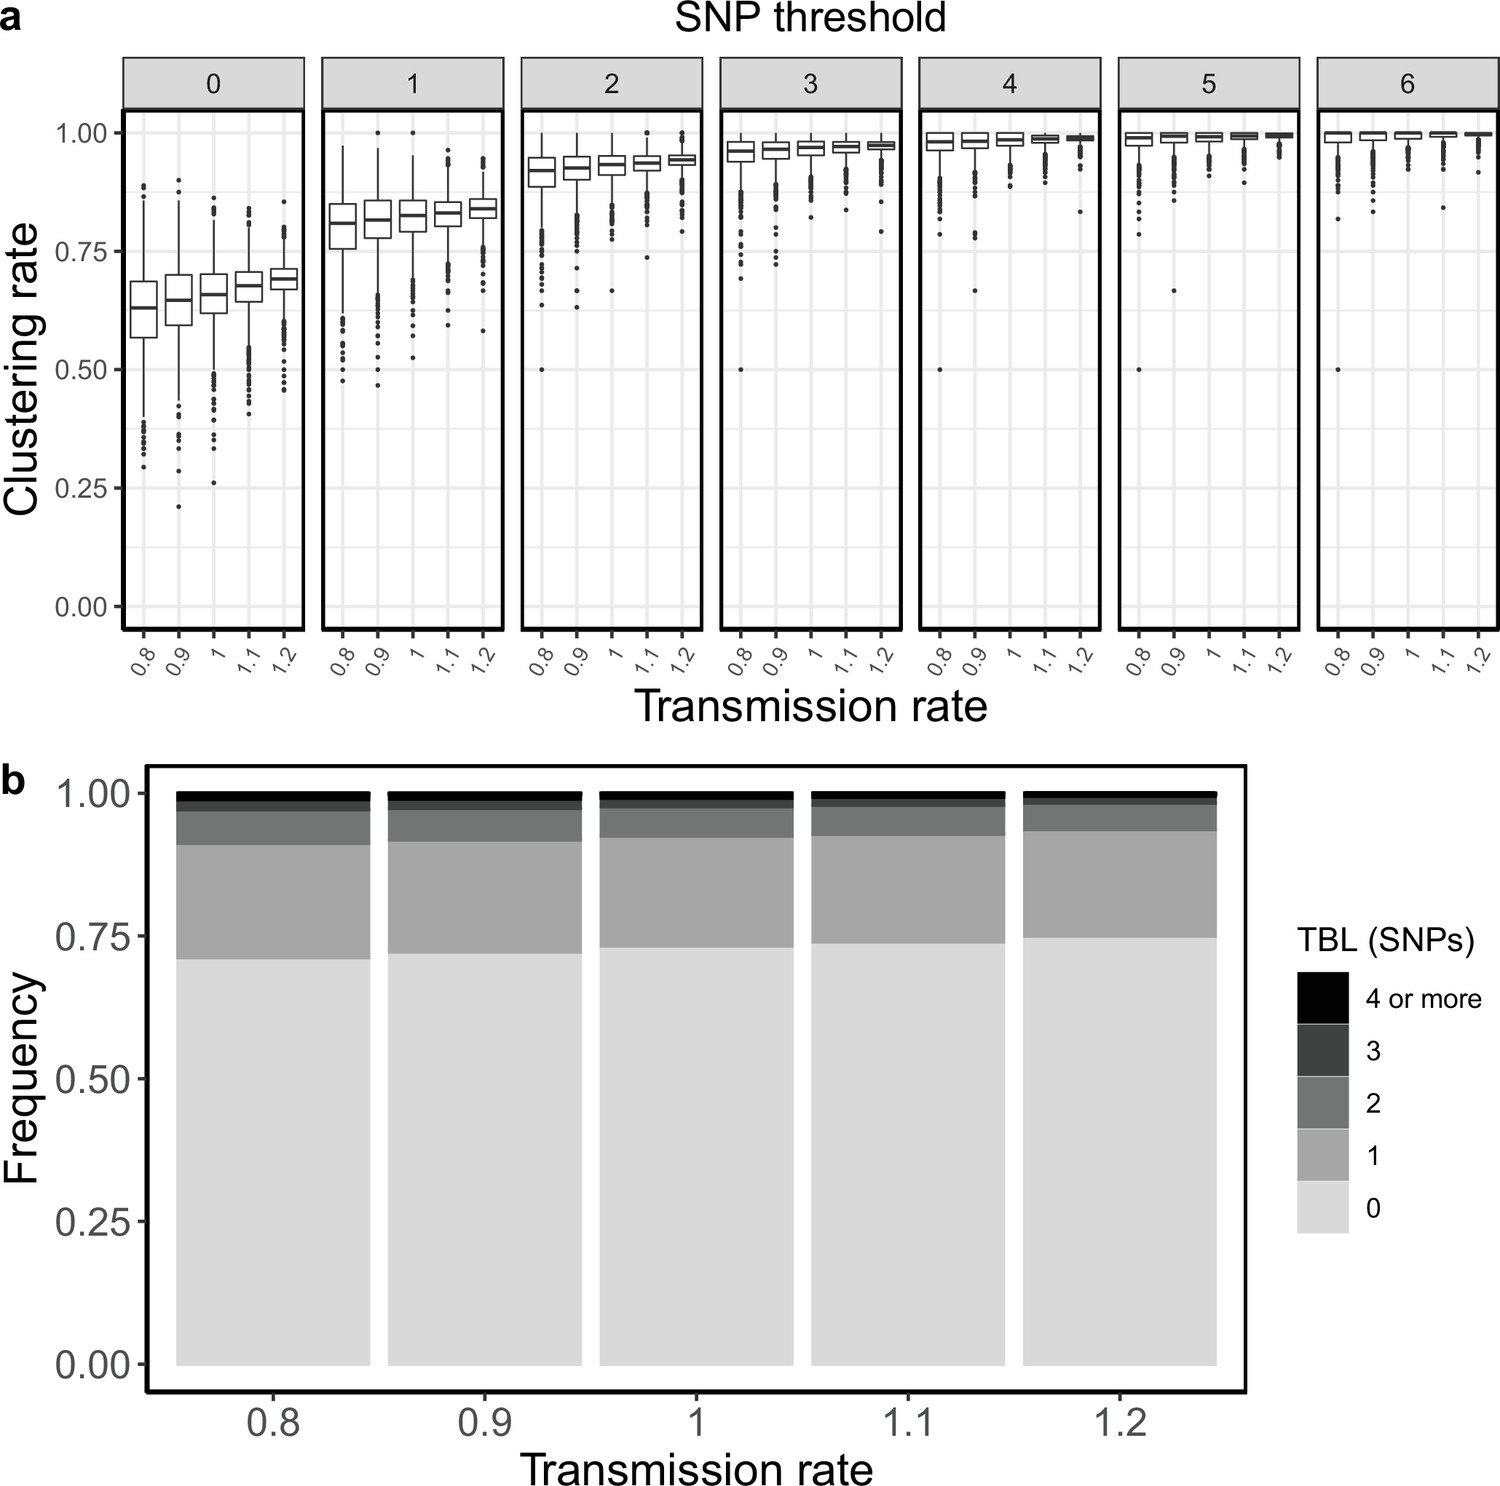
Figure 3

Clustering rates and TBL distributions for different transmission and sampling rates.
(a) Clustering rates with different SNP thresholds. Only SNP thresholds up to the highest 95% sensitivity threshold are plotted (i.e. for thresholds higher than 7 SNPs more than 95% of samples are clustered in more than 95% of simulations for all settings). (b) Overall TBL distributions computed by merging all simulations.
Figure 4

Clustering rates and TBL distributions for two different hypothetical sub-populations.
Type 1 is expanding (R0=1.1), it has a long latency period (median:~12 months), and a clock rate of 1 × 10⁻⁷. Type 2 has a R0=0.9, a short latency period (median:~5 months), and a clock rate of 7 × 10⁻⁸. (a) Clustering rates for the two types with different SNP thresholds. Only SNP thresholds up to the highest 95% sensitivity threshold are plotted (i.e. for higher thresholds more than 95% of samples are clustered in more than 95% of simulations for all settings). (b) Overall TBL distributions computed by merging all simulations.
Appendix 1—figure 1
Clustering rates and TBL distributions for different molecular clock rates.
(a) Clustering rates with different SNP thresholds. Only SNP thresholds up to the highest 95% sensitivity threshold are plotted (i.e. for higher thresholds more than 95% of samples are clustered in more than 95% of simulations for all settings). (b) Overall TBL distributions computed by merging all simulations.
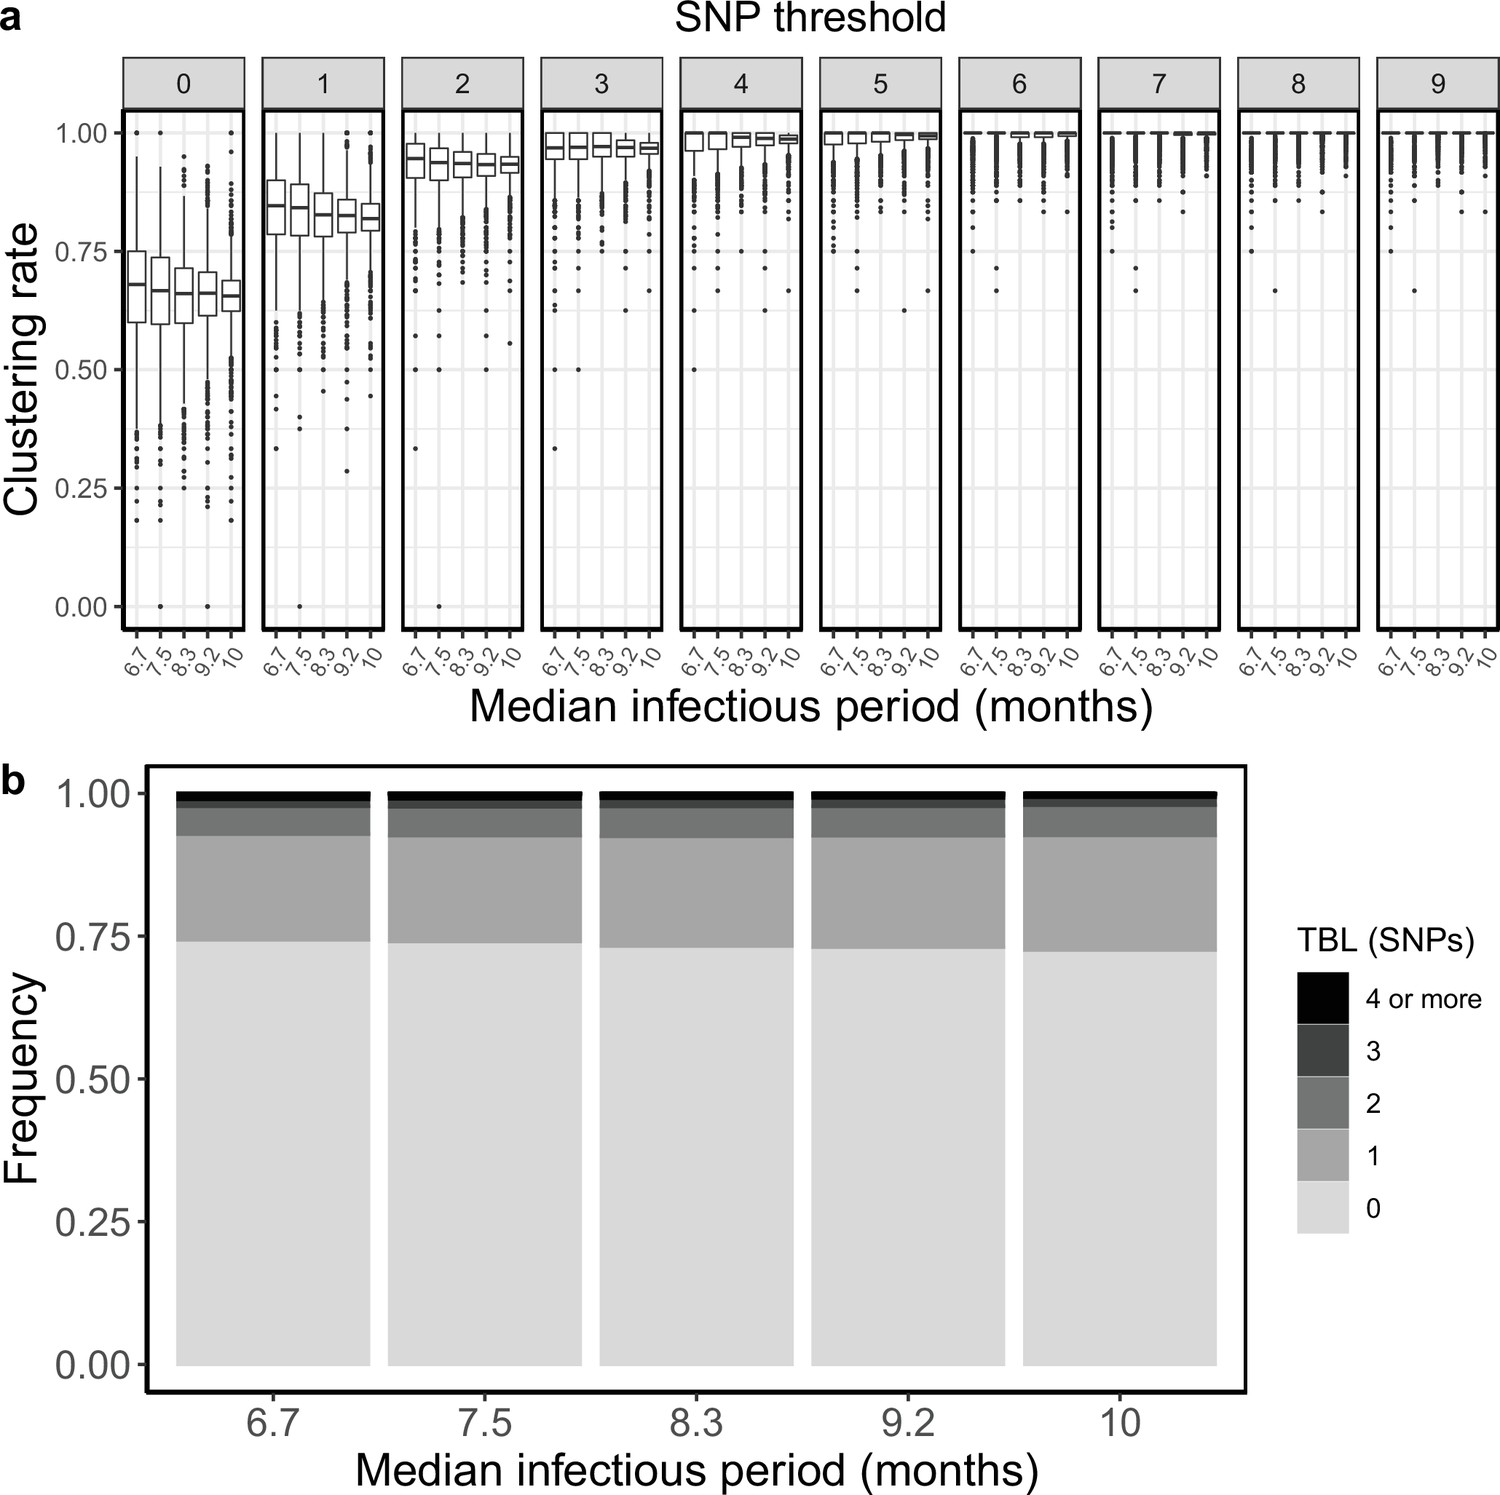
Appendix 2—figure 1
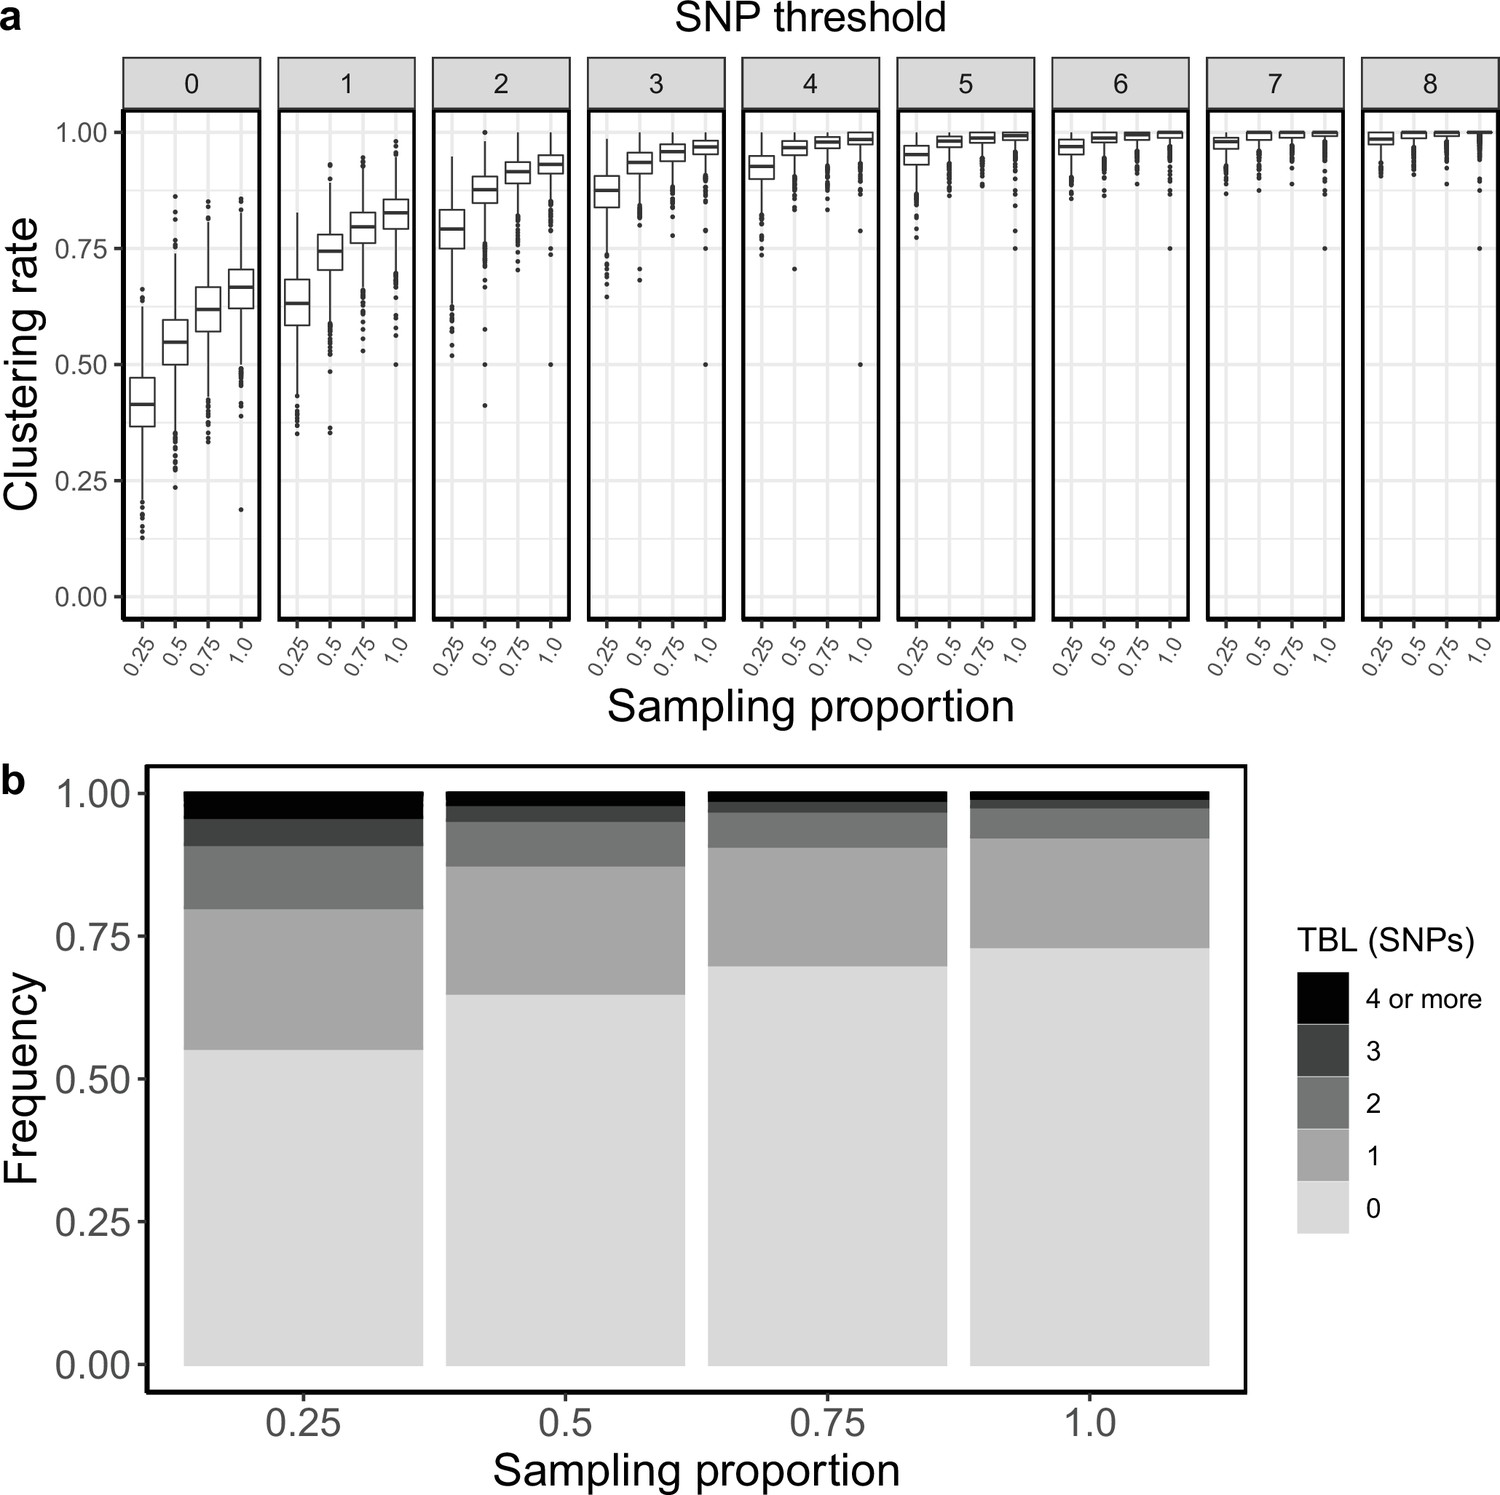
Clustering rates and TBL distribution for different sampling proportions.
(a) Clustering rates with different SNP thresholds. Only SNP thresholds up to the highest 95% sensitivity threshold are plotted (i.e. for higher thresholds more than 95% of samples are clustered in more than 95% of simulations for all settings). (b) Overall TBL distributions computed by merging all simulations.
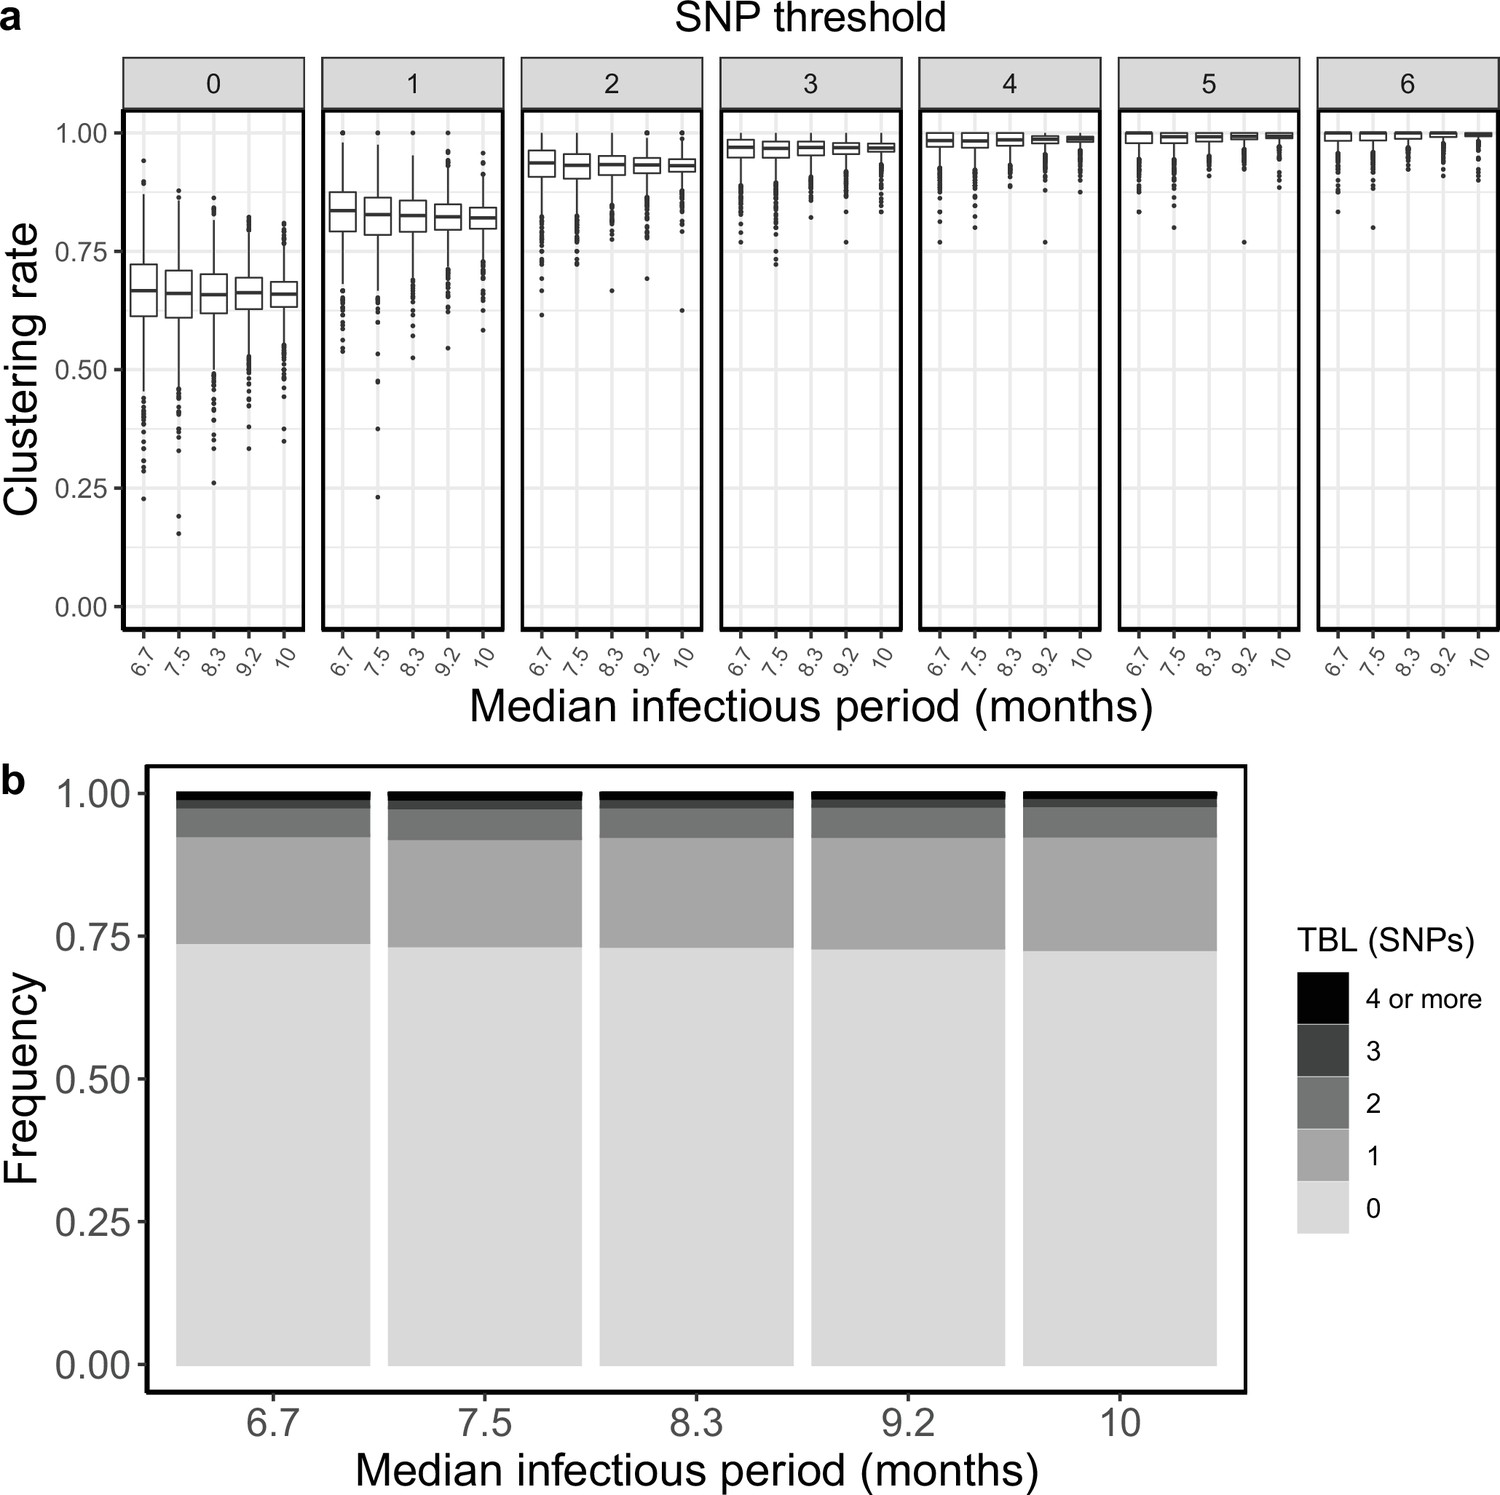
Appendix 3—figure 1
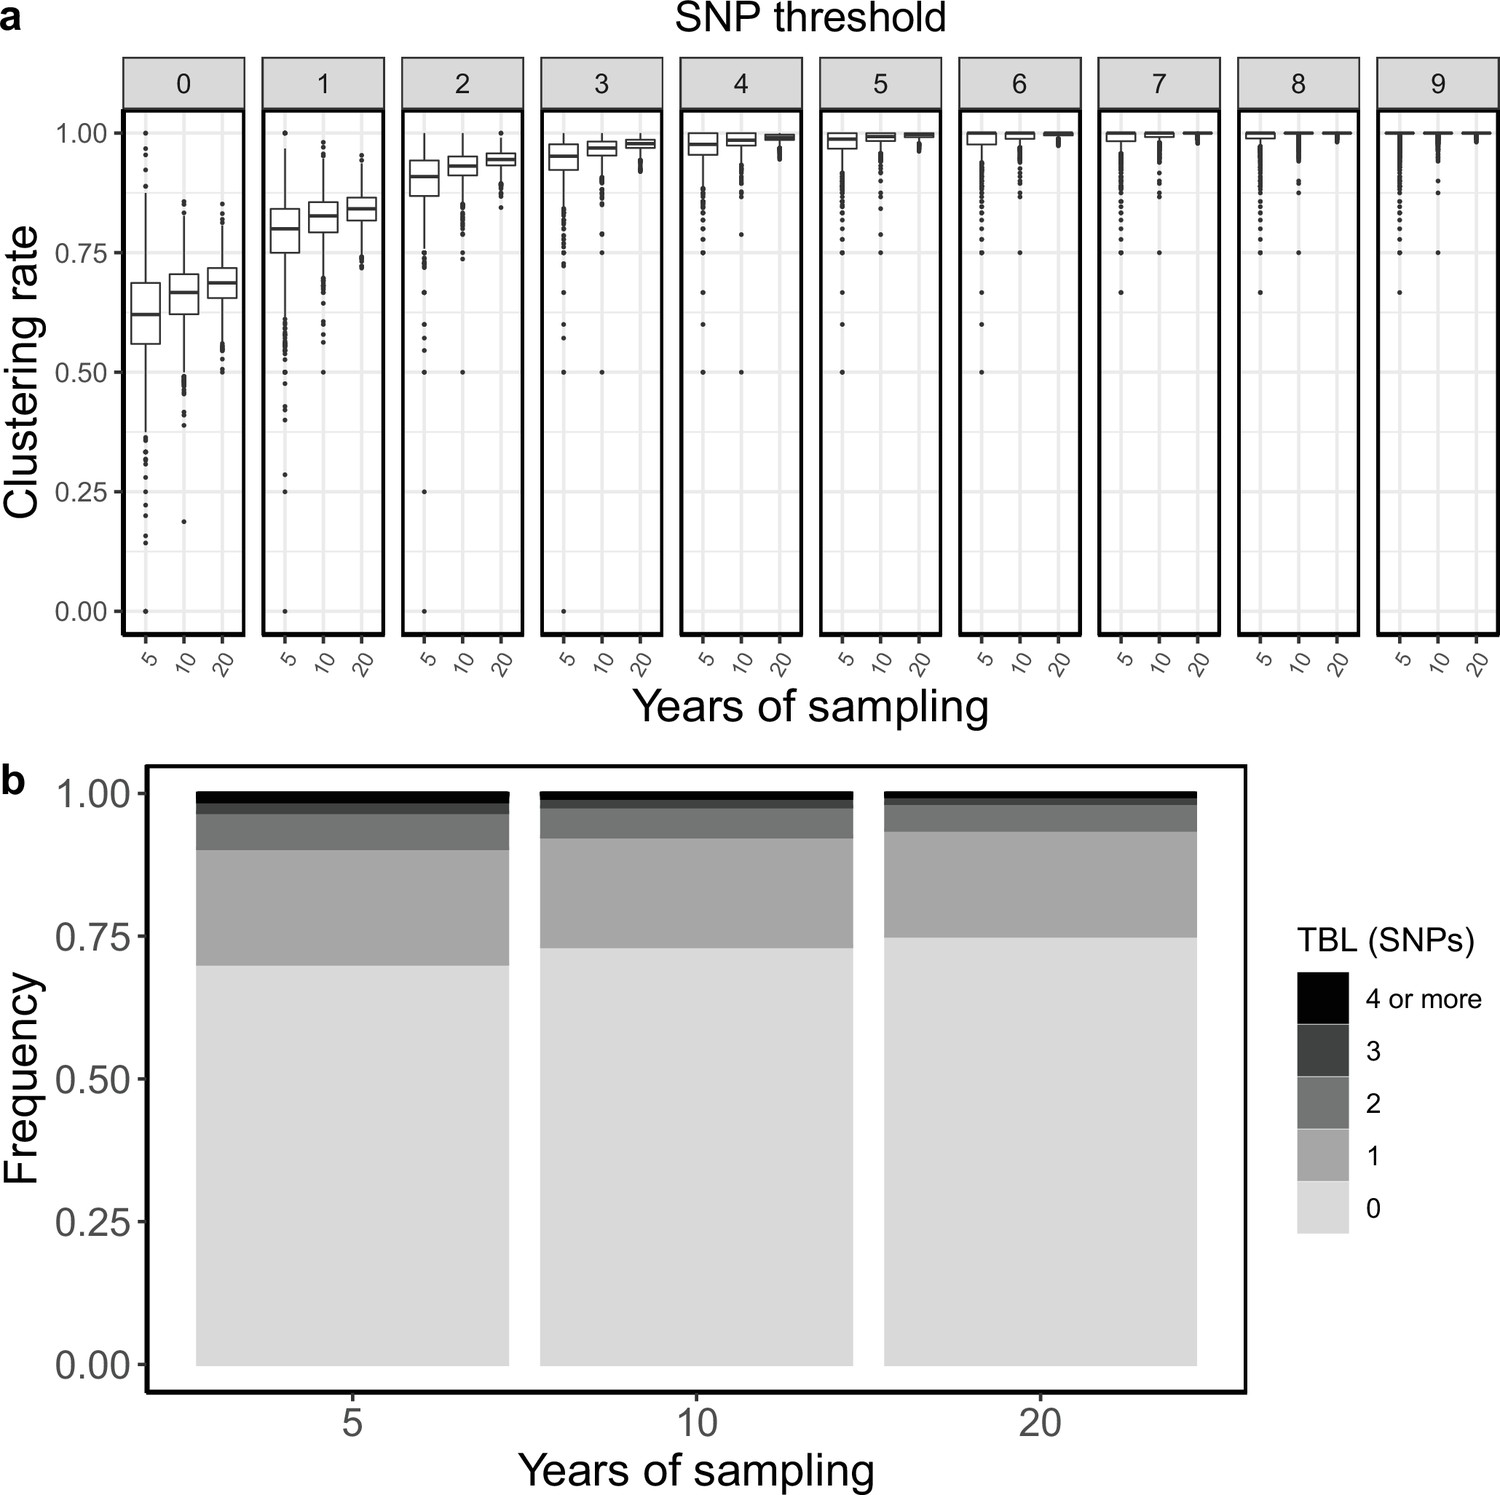
Clustering rates and TBL distributions for different sampling periods.
(a) Clustering rates with different SNP thresholds. Only SNP thresholds up to the highest 95% sensitivity threshold are plotted (i.e. for higher thresholds more than 95% of samples are clustered in more than 95% of simulations for all settings). (b) Overall TBL distributions computed by merging all simulations.
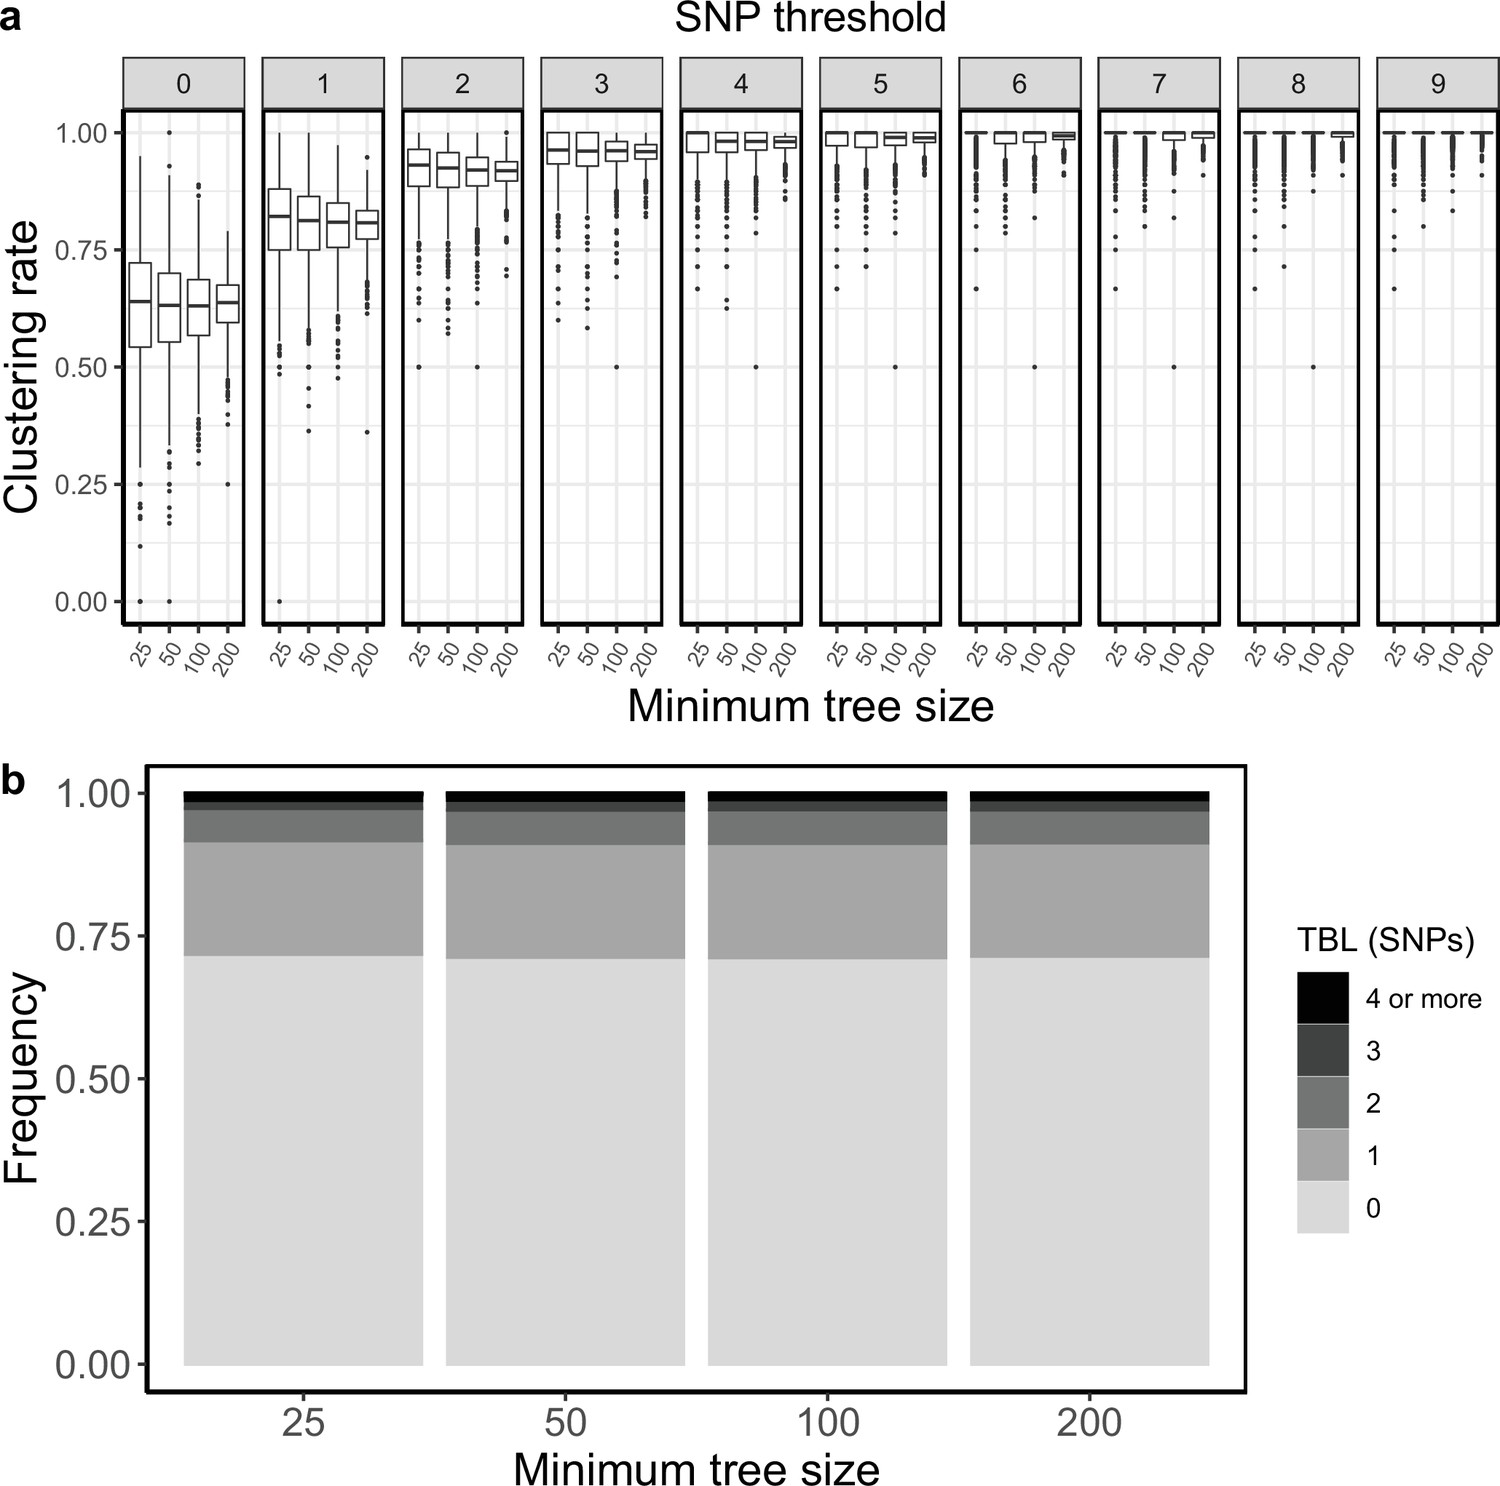
Appendix 4—figure 1
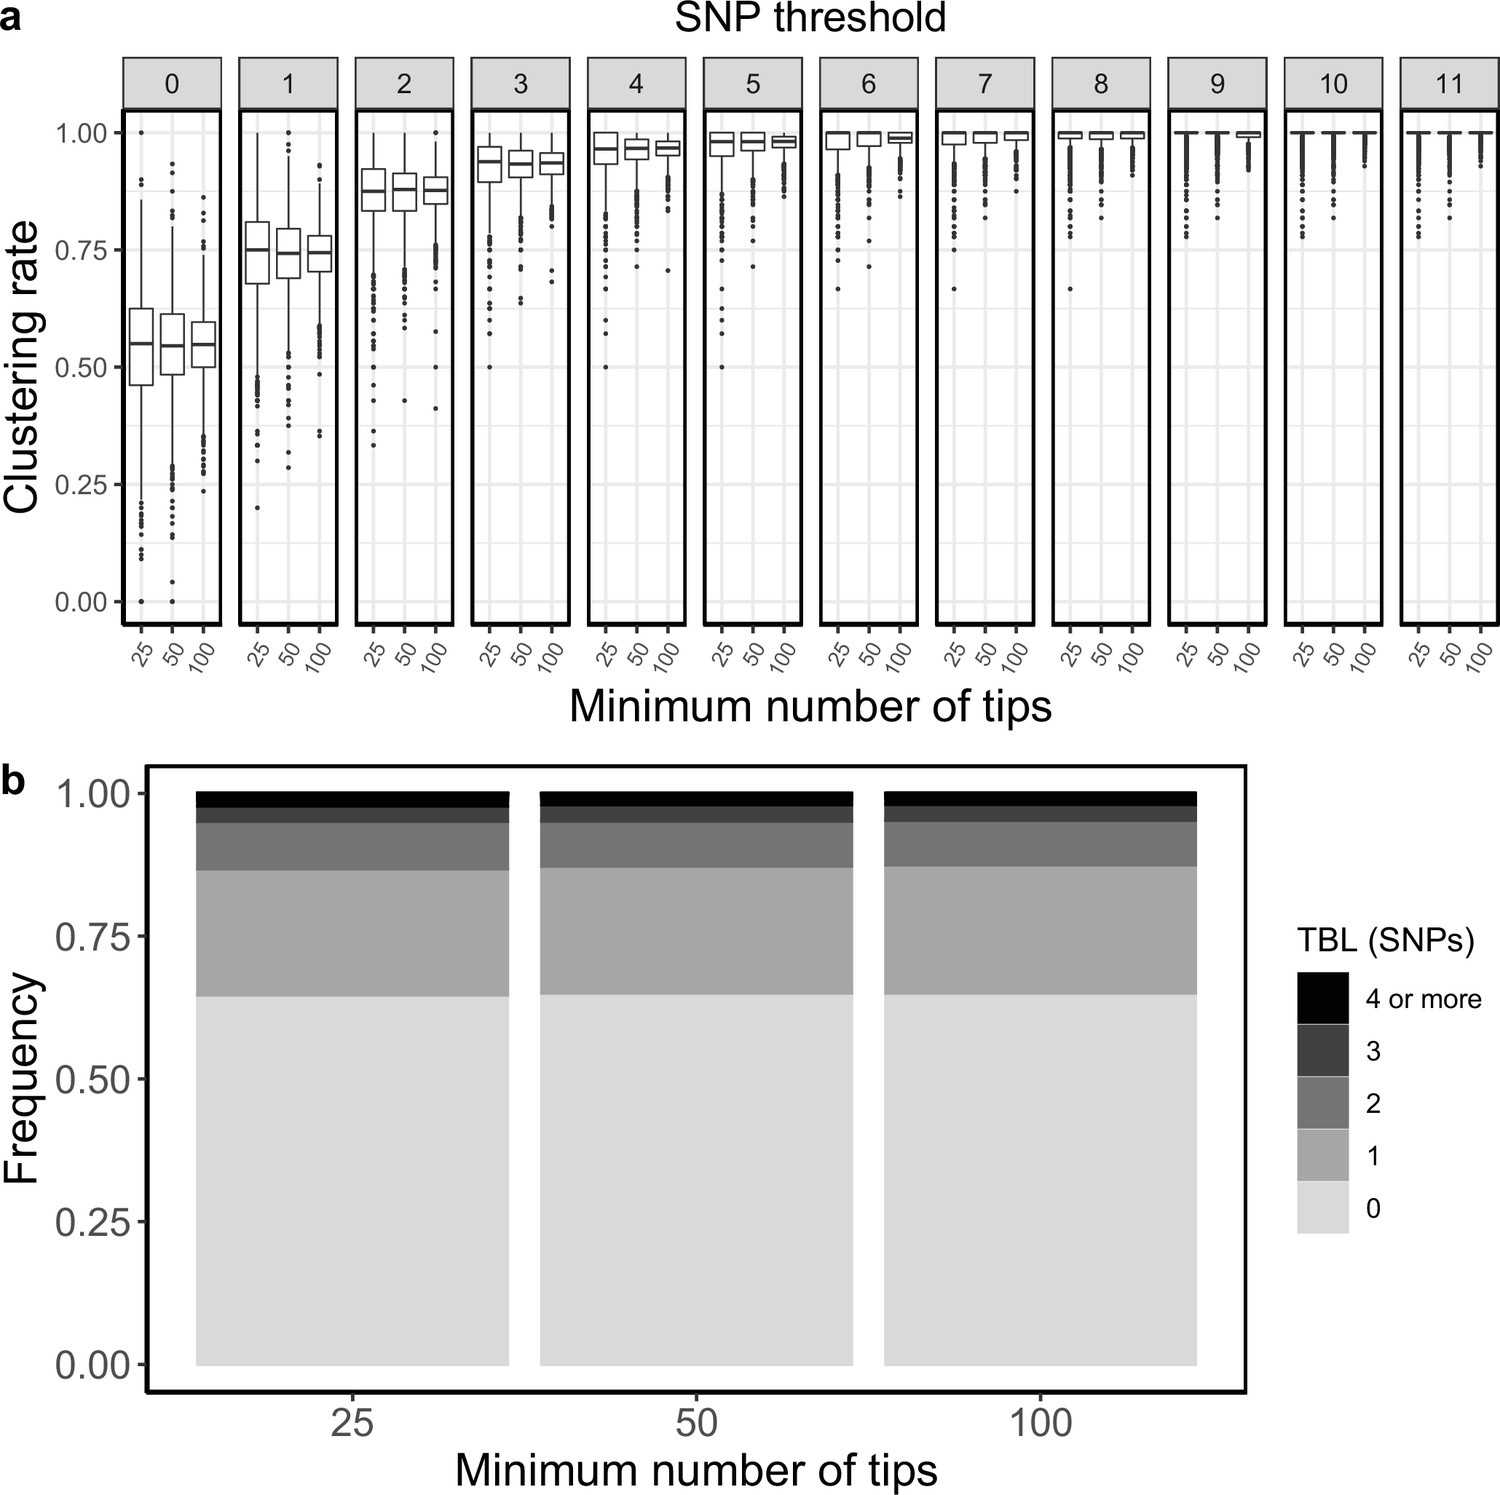
Clustering rates and TBL distributions for different minimum number of tips necessary to accept the MASTER simulation.
(a) Clustering rates with different SNP thresholds. Only SNP thresholds up to the highest 95% sensitivity threshold are plotted (i.e. for higher thresholds more than 95% of samples are clustered in more than 95% of simulations for all settings). (b) Overall TBL distributions computed by merging all simulations.
Appendix 5—figure 1
Clustering rates and TBL distributions for different transmission rates and a minimum simulated tree size of 100 tips.
(a) Clustering rates with different SNP thresholds. Only SNP thresholds up to the highest 95% sensitivity threshold are plotted (i.e. for higher thresholds more than 95% of samples are clustered in more than 95% of simulations for all settings). (b) Overall TBL distributions computed by merging all simulations.
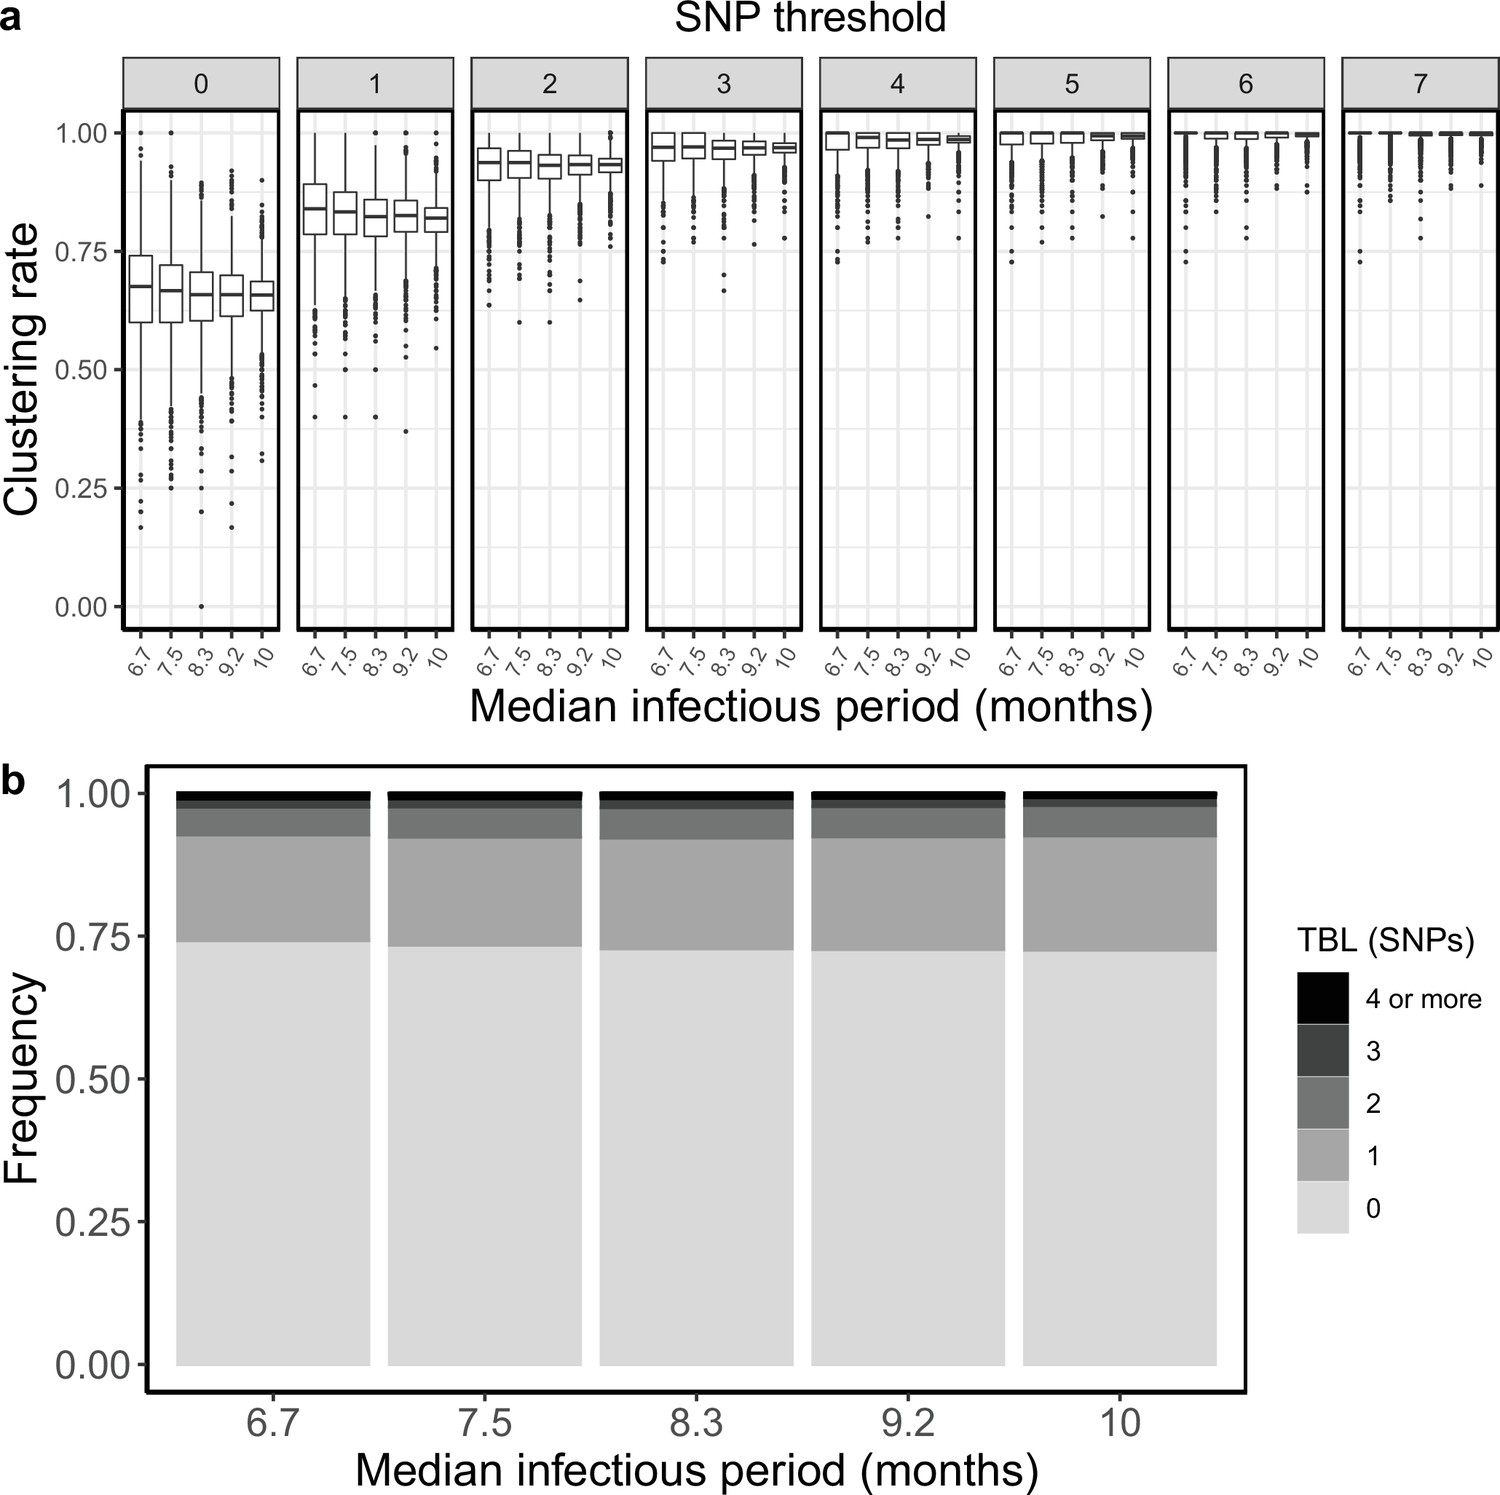
Appendix 5—figure 2
Clustering rates and TBL distributions for different sampling rates (and therefore infectious periods), and a minimum simulated tree size of 100 tips.
(a) Clustering rates with different SNP thresholds. Only SNP thresholds up to the highest 95% sensitivity threshold are plotted (i.e. for higher thresholds more than 95% of samples are clustered in more than 95% of simulations for all settings). (b) Overall TBL distributions computed by merging all simulations.
Appendix 5—figure 3

Clustering rates and TBL distributions for different transmission rates and a minimum simulated tree size of 25 tips.
(a) Clustering rates with different SNP thresholds. Only SNP thresholds up to the highest 95% sensitivity threshold are plotted (i.e. for higher thresholds more than 95% of samples are clustered in more than 95% of simulations for all settings). (b) Overall TBL distributions computed by merging all simulations.
Appendix 5—figure 4

Clustering rates and TBL distributions for different transmission rates and a minimum simulated tree size of 50 tips.
(a) Clustering rates with different SNP thresholds. Only SNP thresholds up to the highest 95% sensitivity threshold are plotted (i.e. for higher thresholds more than 95% of samples are clustered in more than 95% of simulations for all settings). (b) Overall TBL distributions computed by merging all simulations.
Appendix 5—figure 5

Clustering rates and TBL distributions for different transmission rates and a minimum simulated tree size of 200 tips.
(a) Clustering rates with different SNP thresholds. Only SNP thresholds up to the highest 95% sensitivity threshold are plotted (i.e. for higher thresholds more than 95% of samples are clustered in more than 95% of simulations for all settings). (b) Overall TBL distributions computed by merging all simulations.
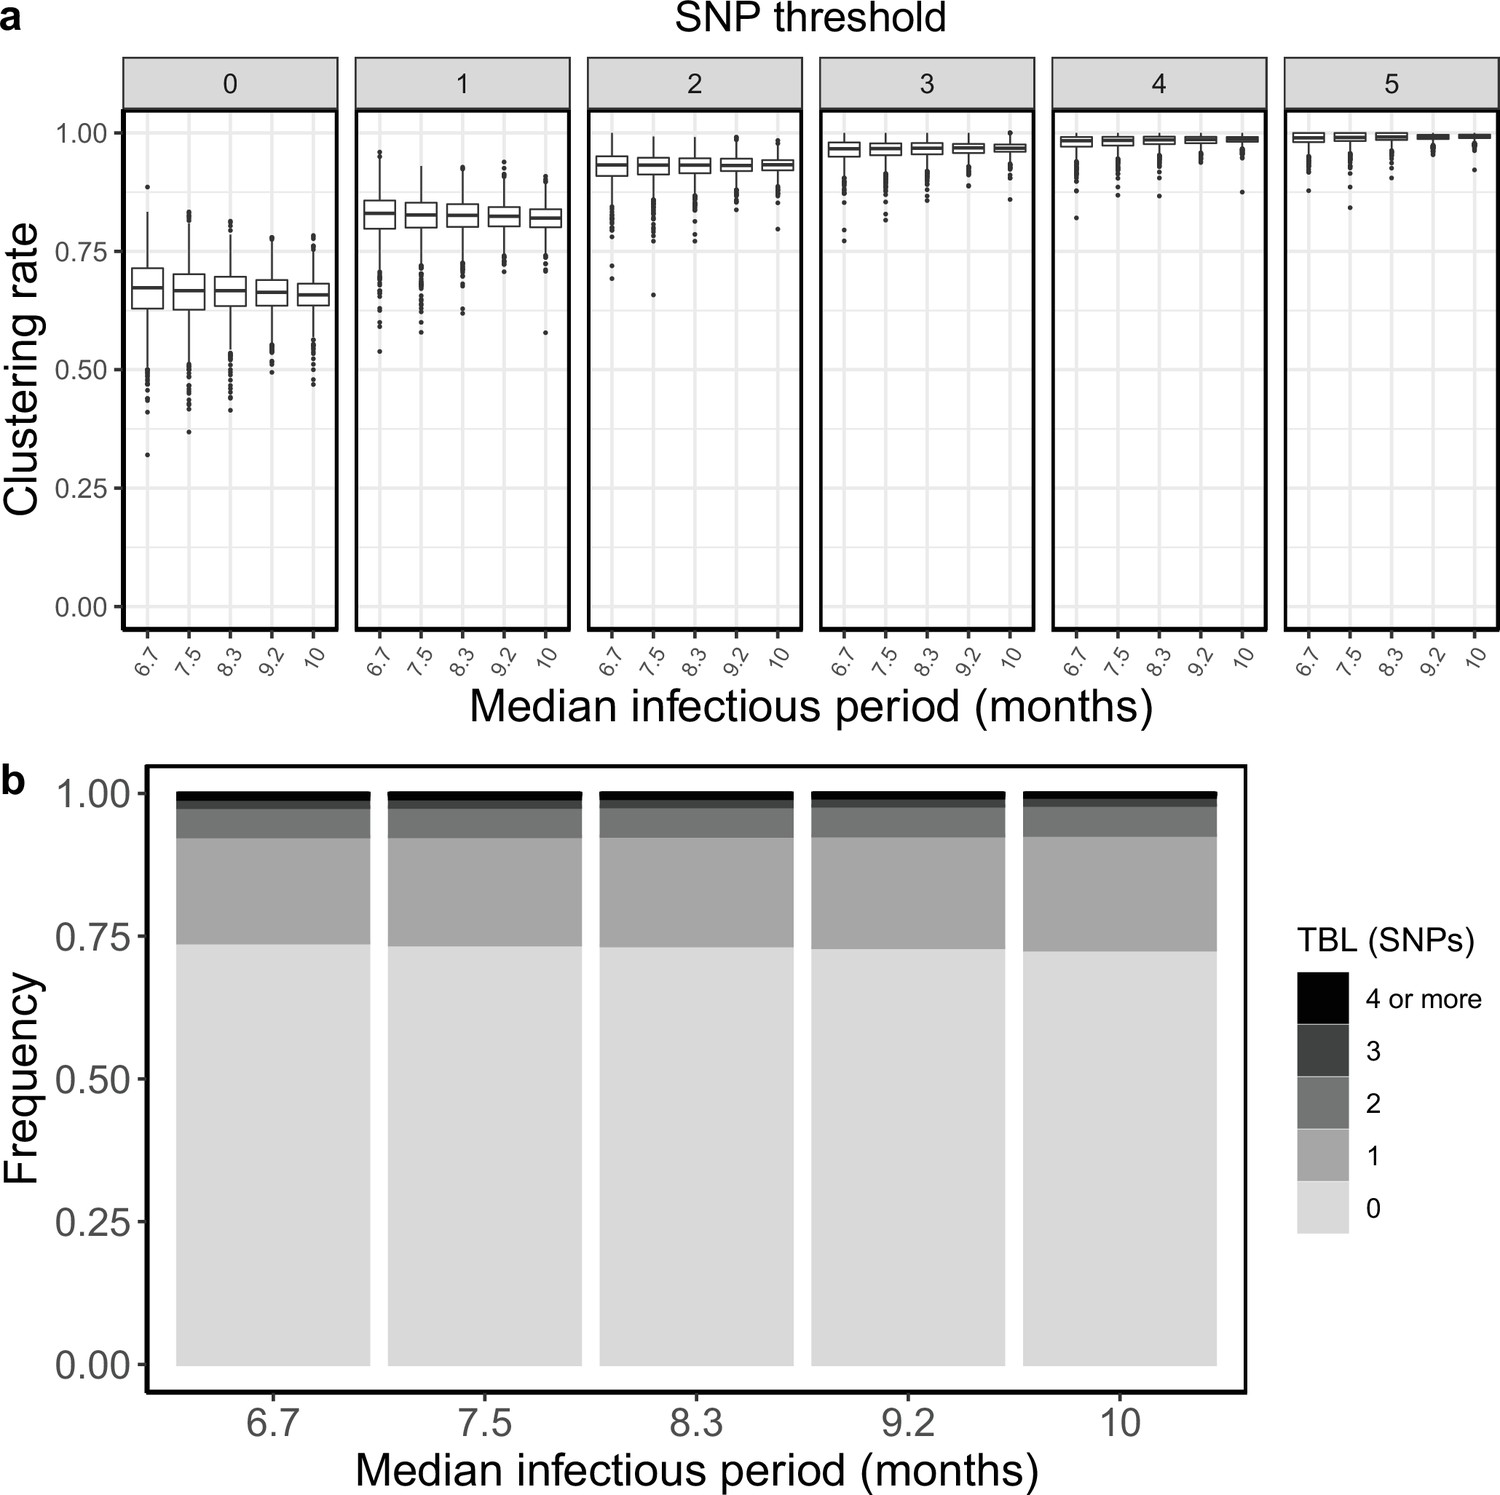
Appendix 5—figure 6
Clustering rates and TBL distributions for different sampling rates (and therefore infectious periods), and a minimum simulated tree size of 25 tips.
(a) Clustering rates with different SNP thresholds. Only SNP thresholds up to the highest 95% sensitivity threshold are plotted (i.e. for higher thresholds more than 95% of samples are clustered in more than 95% of simulations for all settings). (b) Overall TBL distributions computed by merging all simulation.
Appendix 5—figure 7
Clustering rates and TBL distributions for different sampling rates (and therefore infectious periods), and a minimum simulated tree size of 50 tips.
(a) Clustering rates with different SNP thresholds. Only SNP thresholds up to the highest 95% sensitivity threshold are plotted (i.e. for higher thresholds more than 95% of samples are clustered in more than 95% of simulations for all settings). (b) Overall TBL distributions computed by merging all simulation.
Appendix 5—figure 8
Clustering rates and TBL distributions for different sampling rates (and therefore infectious periods), and a minimum simulated tree size of 200 tips.
(a) Clustering rates with different SNP thresholds. Only SNP thresholds up to the highest 95% sensitivity threshold are plotted (i.e. for higher thresholds more than 95% of samples are clustered in more than 95% of simulations for all settings). (b) Overall TBL distributions computed by merging all simulation.
Appendix 5—figure 9
Clustering rates and TBL distributions for scenarios with transmission rate = 0.8, and different thresholds on the minimum tree size.
(a) Clustering rates with different SNP thresholds. Only SNP thresholds up to the highest 95% sensitivity threshold are plotted (i.e. for higher thresholds more than 95% of samples are clustered in more than 95% of simulations for all settings). (b) Overall TBL distributions computed by merging all simulations.
Appendix 5—figure 10

Clustering rates and TBL distributions for scenarios with sampling rate = 1.25, and different thresholds on the minimum tree size.
(a) Clustering rates with different SNP thresholds. Only SNP thresholds up to the highest 95% sensitivity threshold are plotted (i.e. for higher thresholds more than 95% of samples are clustered in more than 95% of simulations for all settings). (b) Overall TBL distributions computed by merging all simulations.
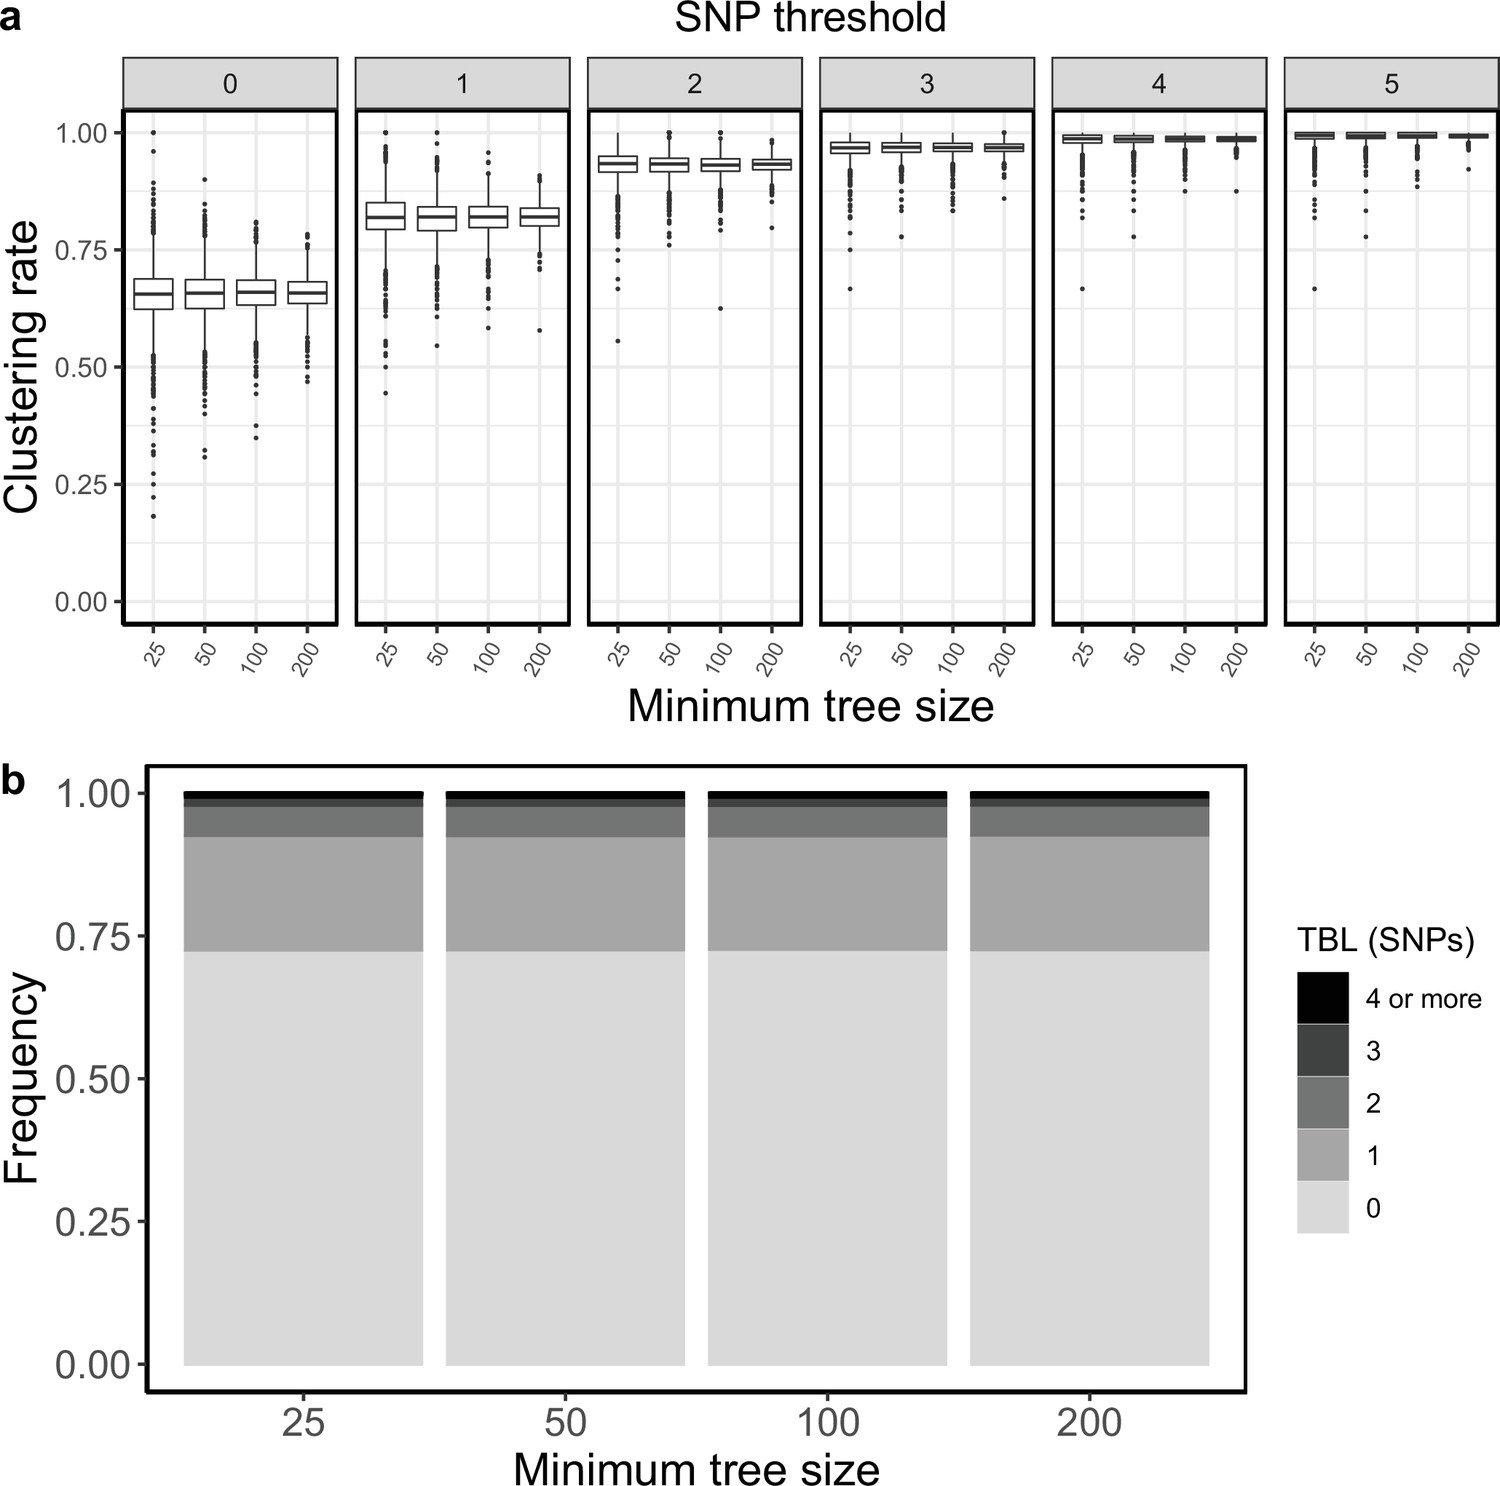
Appendix 5—figure 11

Clustering rates and TBL distributions for scenarios with transmission rate = 1, sampling rate = 1, and different thresholds on the minimum tree size.
(a) Clustering rates with different SNP thresholds. Only SNP thresholds up to the highest 95% sensitivity threshold are plotted (i.e. for higher thresholds more than 95% of samples are clustered in more than 95% of simulations for all settings). (b) Overall TBL distributions computed by merging all simulations.
Appendix 5—figure 12

Clustering rates and TBL distributions for scenarios with transmission rate = 1.2, and different thresholds on the minimum tree size.
(a) Clustering rates with different SNP thresholds. Only SNP thresholds up to the highest 95% sensitivity threshold are plotted (i.e. for higher thresholds more than 95% of samples are clustered in more than 95% of simulations for all settings). (b) Overall TBL distributions computed by merging all simulations.
Appendix 5—figure 13
Clustering rates and TBL distributions for scenarios with sampling rate = 0.83333, and different thresholds on the minimum tree size.
(a) Clustering rates with different SNP thresholds. Only SNP thresholds up to the highest 95% sensitivity threshold are plotted (i.e. for higher thresholds more than 95% of samples are clustered in more than 95% of simulations for all settings). (b) Overall TBL distributions computed by merging all simulations.
Tables
Table 1
Parameters and results for the different simulated scenarios in the analysis of latency.
λ: transmission rate, ε: sampling rate, R0 = λ/(ε+σ), σ: death rate, ψ: rate of progression to infectiousness, π: molecular clock rate in expected nucleotide changes per site per year, 95% SNP threshold: the minimum SNP threshold for which at least 95% of samples are clustered in at least 95% of simulations, 100% SNP threshold: the minimum SNP threshold for which 100% of samples are clustered in at least 95% of simulations, 95% CI TBL: the confidence interval for the overall TBL distribution, Mean TBL: average of the overall TBL distribution.
| Scenario | λ | ε | R0 | σ | ψ | π | 95% SNP threshold | 100% SNP threshold | 95% CI TBL | MeanTBL |
|---|---|---|---|---|---|---|---|---|---|---|
| Short latency | 1 | 0.5 | 1 | 0.5 | 2 | 8 × 10⁻⁸ | 5 | 15 | 0–2 | 0.41 |
| Mid latency | 1 | 0.5 | 1 | 0.5 | 1 | 8 × 10⁻⁸ | 6 | 17 | 0–3 | 0.56 |
| Long latency | 1 | 0.5 | 1 | 0.5 | 0.5 | 8 × 10⁻⁸ | 10 | 20 | 0–5 | 0.87 |
Table 2
Parameters and results for the different scenarios in the analysis of transmission dynamics.
λ: transmission rate, ε: sampling rate, R0: λ/(ε+σ), σ: death rate, ψ: rate of progression to infectiousness, π: molecular clock rate in expected nucleotide changes per site per year, 95% SNP threshold: the minimum SNP threshold for which at least 95% of samples are clustered in at least 95% of simulations, 100% SNP threshold: the minimum SNP threshold for which 100% of samples are clustered in at least 95% of simulations, 95% CI TBL: the confidence interval for the overall TBL distribution, Mean TBL: average of the overall TBL distribution.
| Scenario(Median infectious period (months) - R0) | λ | ε | R0 | σ | ψ | π | 95% SNP threshold | 100% SNP threshold | 95% CI TBL | Mean TBL |
|---|---|---|---|---|---|---|---|---|---|---|
| Long infectious period, shrinking (17–0.9) | 0.45 | 0.5 | 0.9 | 0 | 1 | 8 × 10⁻⁸ | 7 | 16 | 0–3 | 0.62 |
| Long infectious period, stable (17 - 1) | 0.5 | 0.5 | 1 | 0 | 1 | 8 × 10⁻⁸ | 6 | 16 | 0–3 | 0.59 |
| Long infectious period, growing (17–1.1) | 0.55 | 0.5 | 1.1 | 0 | 1 | 8 × 10⁻⁸ | 6 | 16 | 0–3 | 0.57 |
| Medium infectious period, shrinking (8–0.9) | 0.9 | 1 | 0.9 | 0 | 1 | 8 × 10⁻⁸ | 5 | 16 | 0–3 | 0.41 |
| Medium infectious period, stable (8 - 1) | 1 | 1 | 1 | 0 | 1 | 8 × 10⁻⁸ | 5 | 15 | 0–2 | 0.38 |
| Medium infectious period, growing (8–1.1) | 1.1 | 1 | 1.1 | 0 | 1 | 8 × 10⁻⁸ | 4 | 16 | 0–2 | 0.37 |
| Short infectious period, shrinking (4–0.9) | 1.8 | 2 | 0.9 | 0 | 1 | 8 × 10⁻⁸ | 5 | 14 | 0–2 | 0.31 |
| Short infectious period, stable (4 - 1) | 2 | 2 | 1 | 0 | 1 | 8 × 10⁻⁸ | 4 | 15 | 0–2 | 0.29 |
| Short infectious period, growing (4–1.1) | 2.2 | 2 | 1.1 | 0 | 1 | 8 × 10⁻⁸ | 3 | 17 | 0–2 | 0.27 |
Table 3
Parameters and results for the two simulated scenarios in the practical example.
λ: transmission rate, ε: sampling rate, R0 = λ/(ε+σ), σ: death rate, ψ: rate of progression to infectiousness, π: molecular clock rate in expected nucleotide changes per site per year, 95% SNP threshold: the minimum SNP threshold for which at least 95% of samples are clustered in at least 95% of simulations, 100% SNP threshold: the minimum SNP threshold for which 100% of samples are clustered in at least 95% of simulations, 95% CI TBL: the confidence interval for the overall TBL distribution, Mean TBL: average of the overall TBL distribution.
| Scenario | λ | ε | R0 | σ | ψ | π | 95% SNP threshold | 100% SNP threshold | 95% CI TBL | Mean TBL |
|---|---|---|---|---|---|---|---|---|---|---|
| Type 1 | 1.1 | 0.5 | 1.1 | 0.5 | 0.7 | 1 × 10⁻⁷ | 8 | 21 | 0–4 | 0.82 |
| Type 2 | 0.9 | 0.5 | 0.9 | 0.5 | 1.7 | 7 × 10⁻⁸ | 5 | 13 | 0–2 | 0.40 |
Appendix 1—table 1
Parameters and results for the different simulated scenarios in the analysis of clock rates.
λ: transmission rate, ε: sampling rate, R0 = λ/(ε+σ), σ: death rate, ψ: rate of progression to infectiousness, π: molecular clock rate in expected nucleotide changes per site per year, 95% SNP threshold: the minimum SNP threshold for which at least 95% of samples are clustered in at least 95% of simulations, 100% SNP threshold: the minimum SNP threshold for which 100% of samples are clustered in at least 95% of simulations, 95% CI TBL: the confidence interval for the overall TBL distribution, Mean TBL: average of the overall TBL distribution.
| Scenario | λ | ε | R0 | σ | ψ | π | 95% SNP threshold | 100% SNP threshold | 95% CI TBL | Mean TBL |
|---|---|---|---|---|---|---|---|---|---|---|
| Fast clock rate | 1 | 0.5 | 1 | 0.5 | 1 | 1.2 × 10⁻⁷ | 9 | 24 | 0–4 | 0.85 |
| Mid clock rate | 1 | 0.5 | 1 | 0.5 | 1 | 8 × 10⁻⁸ | 6 | 17 | 0–3 | 0.56 |
| Low clock rate | 1 | 0.5 | 1 | 0.5 | 1 | 4 × 10⁻⁸ | 4 | 9 | 0–2 | 0.28 |
Appendix 2—table 1
Parameters and results for the different simulated scenarios in the analysis of sampling proportions.
λ: transmission rate, ε: sampling rate, R0 = λ/(ε+σ), σ: death rate, ψ: rate of progression to infectiousness, π: molecular clock rate in expected nucleotide changes per site per year, 95% SNP threshold: the minimum SNP threshold for which at least 95% of samples are clustered in at least 95% of simulations, 100% SNP threshold: the minimum SNP threshold for which 100% of samples are clustered in at least 95% of simulations, 95% CI TBL: the confidence interval for the overall TBL distribution, Mean TBL: average of the overall TBL distribution.
| Scenario | λ | ε | R0 | σ | ψ | π | 95% SNP threshold | 100% SNP threshold | 95% CI TBL | Mean TBL |
|---|---|---|---|---|---|---|---|---|---|---|
| 25% sampling proportion | 1 | 0.25 | 1 | 0.75 | 1 | 8 × 10⁻⁸ | 8 | 19 | 0–4 | 0.83 |
| 50% sampling proportion | 1 | 0.5 | 1 | 0.5 | 1 | 8 × 10⁻⁸ | 6 | 17 | 0–3 | 0.56 |
| 75% sampling proportion | 1 | 0.75 | 1 | 0.25 | 1 | 8 × 10⁻⁸ | 5 | 16 | 0–3 | 0.45 |
| 100% sampling proportion | 1 | 1 | 1 | 0 | 1 | 8 × 10⁻⁸ | 4 | 16 | 0–2 | 0.39 |
Appendix 3—table 1
Parameters and results for the different simulated scenarios in the analysis of different sampling periods.
λ: transmission rate, ε: sampling rate, R0 = λ/(ε+σ), σ: death rate, ψ: rate of progression to infectiousness, π: molecular clock rate in expected nucleotide changes per site per year, 95% SNP threshold: the minimum SNP threshold for which at least 95% of samples are clustered in at least 95% of simulations, 100% SNP threshold: the minimum SNP threshold for which 100% of samples are clustered in at least 95% of simulations, 95% CI TBL: the confidence interval for the overall TBL distribution, Mean TBL: average of the overall TBL distribution.
| Scenario | λ | ε | R0 | σ | ψ | π | 95% SNP threshold | 100% SNP threshold | 95% CI TBL | Mean TBL |
|---|---|---|---|---|---|---|---|---|---|---|
| 5 years sampling | 1 | 0.5 | 1 | 0 | 1 | 8 × 10⁻⁸ | 9 | 18 | 0–3 | 0.47 |
| 10 years sampling | 1 | 1 | 1 | 0 | 1 | 8 × 10⁻⁸ | 4 | 13 | 0–2 | 0.39 |
| 20 years sampling | 1 | 0.5 | 1 | 0 | 1 | 8 × 10⁻⁸ | 3 | 11 | 0–2 | 0.34 |
Appendix 4—table 1
Parameters and results for the different simulated scenarios in the analysis of the minimum number of tips to accept a simulation.
λ: transmission rate, ε: sampling rate, R0 = λ/(ε+σ), σ: death rate, ψ: rate of progression to infectiousness, π: molecular clock rate in expected nucleotide changes per site per year, 95% SNP threshold: the minimum SNP threshold for which at least 95% of samples are clustered in at least 95% of simulations, 100% SNP threshold: the minimum SNP threshold for which 100% of samples are clustered in at least 95% of simulations, 95% CI TBL: the confidence interval for the overall TBL distribution, Mean TBL: average of the overall TBL distribution.
| Scenario | λ | ε | R0 | σ | ψ | π | 95% SNP threshold | 100% SNP threshold | 95% CI TBL | Mean TBL |
|---|---|---|---|---|---|---|---|---|---|---|
| Min tips = 25 | 1 | 0.5 | 1 | 0.5 | 1 | 8 × 10⁻⁸ | 11 | 16 | 0–3 | 0.59 |
| Min tips = 50 | 1 | 0.5 | 1 | 0.5 | 1 | 8 × 10⁻⁸ | 8 | 17 | 0–3 | 0.57 |
| Min tips = 100 | 1 | 0.5 | 1 | 0.5 | 1 | 8 × 10⁻⁸ | 6 | 17 | 0–3 | 0.56 |
Appendix 5—table 1
Parameters and results for the different simulated scenarios in the analysis of the transmission rate with minimum tree size = 100.
λ: transmission rate, ε: sampling rate, R0 = λ/(ε+σ), σ: death rate, ψ: rate of progression to infectiousness, π: molecular clock rate in expected nucleotide changes per site per year, 95% SNP threshold: the minimum SNP threshold for which at least 95% of samples are clustered in at least 95% of simulations, 100% SNP threshold: the minimum SNP threshold for which 100% of samples are clustered in at least 95% of simulations, 95% CI TBL: the confidence interval for the overall TBL distribution, Mean TBL: average terminal branch length for the overall TBL distribution in SNPs, Mean TBL: average of the overall TBL distribution.
| Scenario | λ | ε | R0 | σ | ψ | π | 95% SNP threshold | 100% SNP threshold | 95% CI TBL | Mean TBL |
|---|---|---|---|---|---|---|---|---|---|---|
| Fixed ε R0=0.8 | 0.8 | 1 | 0.8 | 0 | 1 | 8 × 10⁻⁸ | 6 | 17 | 0–3 | 0.43 |
| Fixed ε R0=0.9 | 0.9 | 1 | 0.9 | 0 | 1 | 8 × 10⁻⁸ | 5 | 15 | 0–3 | 0.41 |
| Fixed ε R0=1 | 1 | 1 | 1 | 0 | 1 | 8 × 10⁻⁸ | 5 | 16 | 0–2 | 0.38 |
| Fixed ε R0=1.1 | 1.1 | 1 | 1.1 | 0 | 1 | 8 × 10⁻⁸ | 4 | 15 | 0–2 | 0.37 |
| Fixed ε R0=1.2 | 1.2 | 1 | 1.2 | 0 | 1 | 8 × 10⁻⁸ | 4 | 16 | 0–2 | 0.34 |
Appendix 5—table 2
Parameters and results for the different simulated scenarios in the analysis of the sampling rate with minimum tree size = 100.
λ: transmission rate, ε: sampling rate, R0 = λ/(ε+σ), σ: death rate, ψ: rate of progression to infectiousness, π: molecular clock rate in expected nucleotide changes per site per year, 95% SNP threshold: the minimum SNP threshold for which at least 95% of samples are clustered in at least 95% of simulations, 100% SNP threshold: the minimum SNP threshold for which 100% of samples are clustered in at least 95% of simulations, 95% CI TBL: the confidence interval for the overall TBL distribution, Mean TBL: average terminal branch length for the overall TBL distribution in SNPs, Mean TBL: average of the overall TBL distribution.
| Scenario | λ | ε | R0 | σ | ψ | π | 95% SNP threshold | 100% SNP threshold | 95% CI TBL | Mean TBL |
|---|---|---|---|---|---|---|---|---|---|---|
| Fixed λ R0=0.8 | 1 | 1.25 | 0.8 | 0 | 1 | 8 × 10⁻⁸ | 6 | 14 | 0–2 | 0.38 |
| Fixed λ R0=0.9 | 1 | 1.11111 | 0.9 | 0 | 1 | 8 × 10⁻⁸ | 6 | 15 | 0–2 | 0.39 |
| Fixed λ R0=1 | 1 | 1 | 1 | 0 | 1 | 8 × 10⁻⁸ | 5 | 16 | 0–2 | 0.38 |
| Fixed λ R0=1.1 | 1 | 0.90909 | 1.1 | 0 | 1 | 8 × 10⁻⁸ | 4 | 15 | 0–2 | 0.38 |
| Fixed λ R0=1.2 | 1 | 0.83333 | 1.2 | 0 | 1 | 8 × 10⁻⁸ | 4 | 16 | 0–2 | 0.38 |
Appendix 5—table 3
Parameters and results for the different simulated scenarios in the analysis of the transmission rate with minimum tree size = 25.
λ: transmission rate, ε: sampling rate, R0 = λ/(ε+σ), σ: death rate, ψ: rate of progression to infectiousness, π: molecular clock rate in expected nucleotide changes per site per year, 95% SNP threshold: the minimum SNP threshold for which at least 95% of samples are clustered in at least 95% of simulations, 100% SNP threshold: the minimum SNP threshold for which 100% of samples are clustered in at least 95% of simulations, 95% CI TBL: the confidence interval for the overall TBL distribution, Mean TBL: average terminal branch length for the overall TBL distribution in SNPs, Mean TBL: average of the overall TBL distribution.
| Scenario | λ | ε | R0 | σ | ψ | π | 95% SNP threshold | 100% SNP threshold | 95% CI TBL | Mean TBL |
|---|---|---|---|---|---|---|---|---|---|---|
| Fixed ε R0=0.8 | 0.8 | 1 | 0.8 | 0 | 1 | 8 × 10⁻⁸ | 9 | 12 | 0–3 | 0.42 |
| Fixed ε R0=0.9 | 0.9 | 1 | 0.9 | 0 | 1 | 8 × 10⁻⁸ | 7 | 13 | 0–3 | 0.41 |
| Fixed ε R0=1 | 1 | 1 | 1 | 0 | 1 | 8 × 10⁻⁸ | 6 | 13 | 0–2 | 0.39 |
| Fixed ε R0=1.1 | 1.1 | 1 | 1.1 | 0 | 1 | 8 × 10⁻⁸ | 5 | 13 | 0–2 | 0.37 |
| Fixed ε R0=1.2 | 1.2 | 1 | 1.2 | 0 | 1 | 8 × 10⁻⁸ | 4 | 14 | 0–2 | 0.34 |
Appendix 5—table 4
Parameters and results for the different simulated scenarios in the analysis of the transmission rate with minimum tree size = 50.
λ: transmission rate, ε: sampling rate, R0 = λ/(ε+σ), σ: death rate, ψ: rate of progression to infectiousness, π: molecular clock rate in expected nucleotide changes per site per year, 95% SNP threshold: the minimum SNP threshold for which at least 95% of samples are clustered in at least 95% of simulations, 100% SNP threshold: the minimum SNP threshold for which 100% of samples are clustered in at least 95% of simulations, 95% CI TBL: the confidence interval for the overall TBL distribution, Mean TBL: average terminal branch length for the overall TBL distribution in SNPs, Mean TBL: average of the overall TBL distribution.
| Scenario | λ | ε | R0 | σ | ψ | π | 95% SNP threshold | 100% SNP threshold | 95% CI TBL | Mean TBL |
|---|---|---|---|---|---|---|---|---|---|---|
| Fixed ε R0=0.8 | 0.8 | 1 | 0.8 | 0 | 1 | 8 × 10⁻⁸ | 9 | 15 | 0–3 | 0.43 |
| Fixed ε R0=0.9 | 0.9 | 1 | 0.9 | 0 | 1 | 8 × 10⁻⁸ | 8 | 14 | 0–3 | 0.42 |
| Fixed ε R0=1 | 1 | 1 | 1 | 0 | 1 | 8 × 10⁻⁸ | 6 | 15 | 0–2 | 0.40 |
| Fixed ε R0=1.1 | 1.1 | 1 | 1.1 | 0 | 1 | 8 × 10⁻⁸ | 4 | 14 | 0–2 | 0.36 |
| Fixed ε R0=1.2 | 1.2 | 1 | 1.2 | 0 | 1 | 8 × 10⁻⁸ | 4 | 15 | 0–2 | 0.34 |
Appendix 5—table 5
Parameters and results for the different simulated scenarios in the analysis of the transmission rate with minimum tree size = 200.
λ: transmission rate, ε: sampling rate, R0 = λ/(ε+σ), σ: death rate, ψ: rate of progression to infectiousness, π: molecular clock rate in expected nucleotide changes per site per year, 95% SNP threshold: the minimum SNP threshold for which at least 95% of samples are clustered in at least 95% of simulations, 100% SNP threshold: the minimum SNP threshold for which 100% of samples are clustered in at least 95% of simulations, 95% CI TBL: the confidence interval for the overall TBL distribution, Mean TBL: average terminal branch length for the overall TBL distribution in SNPs, Mean TBL: average of the overall TBL distribution.
| Scenario | λ | ε | R0 | σ | ψ | π | 95% SNP threshold | 100% SNP threshold | 95% CI TBL | Mean TBL |
|---|---|---|---|---|---|---|---|---|---|---|
| Fixed ε R0=0.8 | 0.8 | 1 | 0.8 | 0 | 1 | 8 × 10⁻⁸ | 5 | 16 | 0–3 | 0.42 |
| Fixed ε R0=0.9 | 0.9 | 1 | 0.9 | 0 | 1 | 8 × 10⁻⁸ | 5 | 17 | 0–3 | 0.40 |
| Fixed ε R0=1 | 1 | 1 | 1 | 0 | 1 | 8 × 10⁻⁸ | 4 | 15 | 0–2 | 0.38 |
| Fixed ε R0=1.1 | 1.1 | 1 | 1.1 | 0 | 1 | 8 × 10⁻⁸ | 4 | 17 | 0–2 | 0.37 |
| Fixed ε R0=1.2 | 1.2 | 1 | 1.2 | 0 | 1 | 8 × 10⁻⁸ | 3 | 17 | 0–2 | 0.34 |
Appendix 5—table 6
Parameters and results for the different simulated scenarios in the analysis of the sampling rate with minimum tree size = 25.
λ: transmission rate, ε: sampling rate, R0 = λ/(ε+σ), σ: death rate, ψ: rate of progression to infectiousness, π: molecular clock rate in expected nucleotide changes per site per year, 95% SNP threshold: the minimum SNP threshold for which at least 95% of samples are clustered in at least 95% of simulations, 100% SNP threshold: the minimum SNP threshold for which 100% of samples are clustered in at least 95% of simulations, 95% CI TBL: the confidence interval for the overall TBL distribution, Mean TBL: average terminal branch length for the overall TBL distribution in SNPs, Mean TBL: average of the overall TBL distribution.
| Scenario | λ | ε | R0 | σ | ψ | π | 95% SNP threshold | 100% SNP threshold | 95% CI TBL | Mean TBL |
|---|---|---|---|---|---|---|---|---|---|---|
| Fixed λ R0=0.8 | 1 | 1.25 | 0.8 | 0 | 1 | 8 × 10⁻⁸ | 9 | 12 | 0–2 | 0.37 |
| Fixed λ R0=0.9 | 1 | 1.11111 | 0.9 | 0 | 1 | 8 × 10⁻⁸ | 8 | 12 | 0–2 | 0.38 |
| Fixed λ R0=1 | 1 | 1 | 1 | 0 | 1 | 8 × 10⁻⁸ | 6 | 13 | 0–2 | 0.39 |
| Fixed λ R0=1.1 | 1 | 0.90909 | 1.1 | 0 | 1 | 8 × 10⁻⁸ | 6 | 15 | 0–2 | 0.39 |
| Fixed λ R0=1.2 | 1 | 0.83333 | 1.2 | 0 | 1 | 8 × 10⁻⁸ | 5 | 15 | 0–2 | 0.38 |
Appendix 5—table 7
Parameters and results for the different simulated scenarios in the analysis of the sampling rate with minimum tree size = 50.
λ: transmission rate, ε: sampling rate, R0 = λ/(ε+σ), σ: death rate, ψ: rate of progression to infectiousness, π: molecular clock rate in expected nucleotide changes per site per year, 95% SNP threshold: the minimum SNP threshold for which at least 95% of samples are clustered in at least 95% of simulations, 100% SNP threshold: the minimum SNP threshold for which 100% of samples are clustered in at least 95% of simulations, 95% CI TBL: the confidence interval for the overall TBL distribution, Mean TBL: average terminal branch length for the overall TBL distribution in SNPs, Mean TBL: average of the overall TBL distribution.
| Scenario | λ | ε | R0 | σ | ψ | π | 95% SNP threshold | 100% SNP threshold | 95% CI TBL | Mean TBL |
|---|---|---|---|---|---|---|---|---|---|---|
| Fixed λ R0=0.8 | 1 | 1.25 | 0.8 | 0 | 1 | 8 × 10⁻⁸ | 7 | 13 | 0–2 | 0.38 |
| Fixed λ R0=0.9 | 1 | 1.11111 | 0.9 | 0 | 1 | 8 × 10⁻⁸ | 7 | 14 | 0–2 | 0.39 |
| Fixed λ R0=1 | 1 | 1 | 1 | 0 | 1 | 8 × 10⁻⁸ | 6 | 15 | 0–2 | 0.40 |
| Fixed λ R0=1.1 | 1 | 0.90909 | 1.1 | 0 | 1 | 8 × 10⁻⁸ | 5 | 15 | 0–2 | 0.39 |
| Fixed λ R0=1.2 | 1 | 0.83333 | 1.2 | 0 | 1 | 8 × 10⁻⁸ | 4 | 16 | 0–2 | 0.38 |
Appendix 5—table 8
Parameters and results for the different simulated scenarios in the analysis of the sampling rate with minimum tree size = 200.
λ: transmission rate, ε: sampling rate, R0 = λ/(ε+σ), σ: death rate, ψ: rate of progression to infectiousness, π: molecular clock rate in expected nucleotide changes per site per year, 95% SNP threshold: the minimum SNP threshold for which at least 95% of samples are clustered in at least 95% of simulations, 100% SNP threshold: the minimum SNP threshold for which 100% of samples are clustered in at least 95% of simulations, 95% CI TBL: the confidence interval for the overall TBL distribution, Mean TBL: average terminal branch length for the overall TBL distribution in SNPs, Mean TBL: average of the overall TBL distribution.
| Scenario | λ | ε | R0 | σ | ψ | π | 95% SNP threshold | 100% SNP threshold | 95% CI TBL | Mean TBL |
|---|---|---|---|---|---|---|---|---|---|---|
| Fixed λ R0=0.8 | 1 | 1.25 | 0.8 | 0 | 1 | 8 × 10⁻⁸ | 5 | 16 | 0–2 | 0.38 |
| Fixed λ R0=0.9 | 1 | 1.11111 | 0.9 | 0 | 1 | 8 × 10⁻⁸ | 5 | 17 | 0–2 | 0.38 |
| Fixed λ R0=1 | 1 | 1 | 1 | 0 | 1 | 8 × 10⁻⁸ | 4 | 15 | 0–2 | 0.38 |
| Fixed λ R0=1.1 | 1 | 0.90909 | 1.1 | 0 | 1 | 8 × 10⁻⁸ | 4 | 15 | 0–2 | 0.38 |
| Fixed λ R0=1.2 | 1 | 0.83333 | 1.2 | 0 | 1 | 8 × 10⁻⁸ | 4 | 16 | 0–2 | 0.38 |
Appendix 5—table 9
Parameters and results for scenarios with transmission rate = 0.8 and different thresholds on the minimum tree size.
mts: minimum tree size, λ: transmission rate, ε: sampling rate, R0 = λ/(ε+σ), σ: death rate, ψ: rate of progression to infectiousness, π: molecular clock rate in expected nucleotide changes per site per year, 95% SNP threshold: the minimum SNP threshold for which at least 95% of samples are clustered in at least 95% of simulations, 100% SNP threshold: the minimum SNP threshold for which 100% of samples are clustered in at least 95% of simulations, 95% CI TBL: the confidence interval for the overall TBL distribution, Mean TBL: average terminal branch length for the overall TBL distribution in SNPs, Mean TBL: average of the overall TBL distribution.
| Scenario | λ | ε | R0 | σ | ψ | π | 95% SNP threshold | 100% SNP threshold | 95% CI TBL | Mean TBL |
|---|---|---|---|---|---|---|---|---|---|---|
| mts = 25 | 0.8 | 1 | 0.8 | 0 | 1 | 8 × 10⁻⁸ | 9 | 12 | 0–3 | 0.42 |
| mts = 50 | 0.8 | 1 | 0.8 | 0 | 1 | 8 × 10⁻⁸ | 9 | 15 | 0–3 | 0.43 |
| mts = 100 | 0.8 | 1 | 0.8 | 0 | 1 | 8 × 10⁻⁸ | 6 | 17 | 0–3 | 0.43 |
| mts = 200 | 0.8 | 1 | 0.8 | 0 | 1 | 8 × 10⁻⁸ | 5 | 16 | 0–3 | 0.42 |
Appendix 5—table 10
Parameters and results for scenarios with sampling rate = 1.25 and different thresholds on the minimum tree size.
mts: minimum tree size, λ: transmission rate, ε: sampling rate, R0 = λ/(ε+σ), σ: death rate, ψ: rate of progression to infectiousness, π: molecular clock rate in expected nucleotide changes per site per year, 95% SNP threshold: the minimum SNP threshold for which at least 95% of samples are clustered in at least 95% of simulations, 100% SNP threshold: the minimum SNP threshold for which 100% of samples are clustered in at least 95% of simulations, 95% CI TBL: the confidence interval for the overall TBL distribution, Mean TBL: average terminal branch length for the overall TBL distribution in SNPs, Mean TBL: average of the overall TBL distribution.
| Scenario | λ | ε | R0 | σ | ψ | π | 95% SNP threshold | 100% SNP threshold | 95% CI TBL | Mean TBL |
|---|---|---|---|---|---|---|---|---|---|---|
| mts = 25 | 1 | 1.25 | 0.8 | 0 | 1 | 8 × 10⁻⁸ | 9 | 12 | 0–2 | 0.37 |
| mts = 50 | 1 | 1.25 | 0.8 | 0 | 1 | 8 × 10⁻⁸ | 7 | 13 | 0–2 | 0.38 |
| mts = 100 | 1 | 1.25 | 0.8 | 0 | 1 | 8 × 10⁻⁸ | 6 | 14 | 0–2 | 0.38 |
| mts = 200 | 1 | 1.25 | 0.8 | 0 | 1 | 8 × 10⁻⁸ | 5 | 16 | 0–2 | 0.38 |
Appendix 5—table 11
Parameters and results for scenarios with transmission rate = 1, sampling rate = 1, and different thresholds on the minimum tree size.
mts: minimum tree size, λ: transmission rate, ε: sampling rate, R0 = λ/(ε+σ), σ: death rate, ψ: rate of progression to infectiousness, π: molecular clock rate in expected nucleotide changes per site per year, 95% SNP threshold: the minimum SNP threshold for which at least 95% of samples are clustered in at least 95% of simulations, 100% SNP threshold: the minimum SNP threshold for which 100% of samples are clustered in at least 95% of simulations, 95% CI TBL: the confidence interval for the overall TBL distribution, Mean TBL: average terminal branch length for the overall TBL distribution in SNPs, Mean TBL: average of the overall TBL distribution.
| Scenario | λ | ε | R0 | σ | ψ | π | 95% SNP threshold | 100% SNP threshold | 95% CI TBL | Mean TBL |
|---|---|---|---|---|---|---|---|---|---|---|
| mts = 25 | 1 | 1 | 1 | 0 | 1 | 8 × 10⁻⁸ | 6 | 13 | 0–2 | 0.39 |
| mts = 50 | 1 | 1 | 1 | 0 | 1 | 8 × 10⁻⁸ | 6 | 15 | 0–2 | 0.40 |
| mts = 100 | 1 | 1 | 1 | 0 | 1 | 8 × 10⁻⁸ | 5 | 16 | 0–2 | 0.38 |
| mts = 200 | 1 | 1 | 1 | 0 | 1 | 8 × 10⁻⁸ | 4 | 15 | 0–2 | 0.38 |
Appendix 5—table 12
Parameters and results for scenarios with transmission rate = 1.2 and different thresholds on the minimum tree size.
mts: minimum tree size, λ: transmission rate, ε: sampling rate, R0 = λ/(ε+σ), σ: death rate, ψ: rate of progression to infectiousness, π: molecular clock rate in expected nucleotide changes per site per year, 95% SNP threshold: the minimum SNP threshold for which at least 95% of samples are clustered in at least 95% of simulations, 100% SNP threshold: the minimum SNP threshold for which 100% of samples are clustered in at least 95% of simulations, 95% CI TBL: the confidence interval for the overall TBL distribution, Mean TBL: average terminal branch length for the overall TBL distribution in SNPs, Mean TBL: average of the overall TBL distribution.
| Scenario | λ | ε | R0 | σ | ψ | π | 95% SNP threshold | 100% SNP threshold | 95% CI TBL | Mean TBL |
|---|---|---|---|---|---|---|---|---|---|---|
| mts = 25 | 1.2 | 1 | 1.2 | 0 | 1 | 8 × 10⁻⁸ | 4 | 14 | 0–2 | 0.34 |
| mts = 50 | 1.2 | 1 | 1.2 | 0 | 1 | 8 × 10⁻⁸ | 4 | 15 | 0–2 | 0.34 |
| mts = 100 | 1.2 | 1 | 1.2 | 0 | 1 | 8 × 10⁻⁸ | 4 | 16 | 0–2 | 0.34 |
| mts = 200 | 1.2 | 1 | 1.2 | 0 | 1 | 8 × 10⁻⁸ | 3 | 17 | 0–2 | 0.34 |
Appendix 5—table 13
Parameters and results for scenarios with sampling rate = 0.83333 and different thresholds on the minimum tree size.
mts: minimum tree size, λ: transmission rate, ε: sampling rate, R0 = λ/(ε+σ), σ: death rate, ψ: rate of progression to infectiousness, π: molecular clock rate in expected nucleotide changes per site per year, 95% SNP threshold: the minimum SNP threshold for which at least 95% of samples are clustered in at least 95% of simulations, 100% SNP threshold: the minimum SNP threshold for which 100% of samples are clustered in at least 95% of simulations, 95% CI TBL: the confidence interval for the overall TBL distribution, Mean TBL: average terminal branch length for the overall TBL distribution in SNPs, Mean TBL: average of the overall TBL distribution.
| Scenario | λ | ε | R0 | σ | ψ | π | 95% SNP threshold | 100% SNP threshold | 95% CI TBL | Mean TBL |
|---|---|---|---|---|---|---|---|---|---|---|
| mts = 25 | 1 | 0.83333 | 1.2 | 0 | 1 | 8 × 10⁻⁸ | 5 | 15 | 0–2 | 0.38 |
| mts = 50 | 1 | 0.83333 | 1.2 | 0 | 1 | 8 × 10⁻⁸ | 4 | 16 | 0–2 | 0.38 |
| mts = 100 | 1 | 0.83333 | 1.2 | 0 | 1 | 8 × 10⁻⁸ | 4 | 16 | 0–2 | 0.38 |
| mts = 200 | 1 | 0.83333 | 1.2 | 0 | 1 | 8 × 10⁻⁸ | 4 | 16 | 0–2 | 0.38 |
Additional files
Download links
A two-part list of links to download the article, or parts of the article, in various formats.
Downloads (link to download the article as PDF)
Open citations (links to open the citations from this article in various online reference manager services)
Cite this article (links to download the citations from this article in formats compatible with various reference manager tools)
Understanding drivers of phylogenetic clustering and terminal branch lengths distribution in epidemics of Mycobacterium tuberculosis
eLife 11:e76780.
https://doi.org/10.7554/eLife.76780


