A single cell transcriptional roadmap of human pacemaker cell differentiation
- Department of Medical Biology, Amsterdam University Medical Centers, University of Amsterdam, Netherlands
- Department of Experimental Cardiology, Amsterdam University Medical Centers, University of Amsterdam, Netherlands
- Department of Cardiology, Amsterdam University Medical Centers, University of Amsterdam, Netherlands
Figures
Figure 1 with 1 supplement
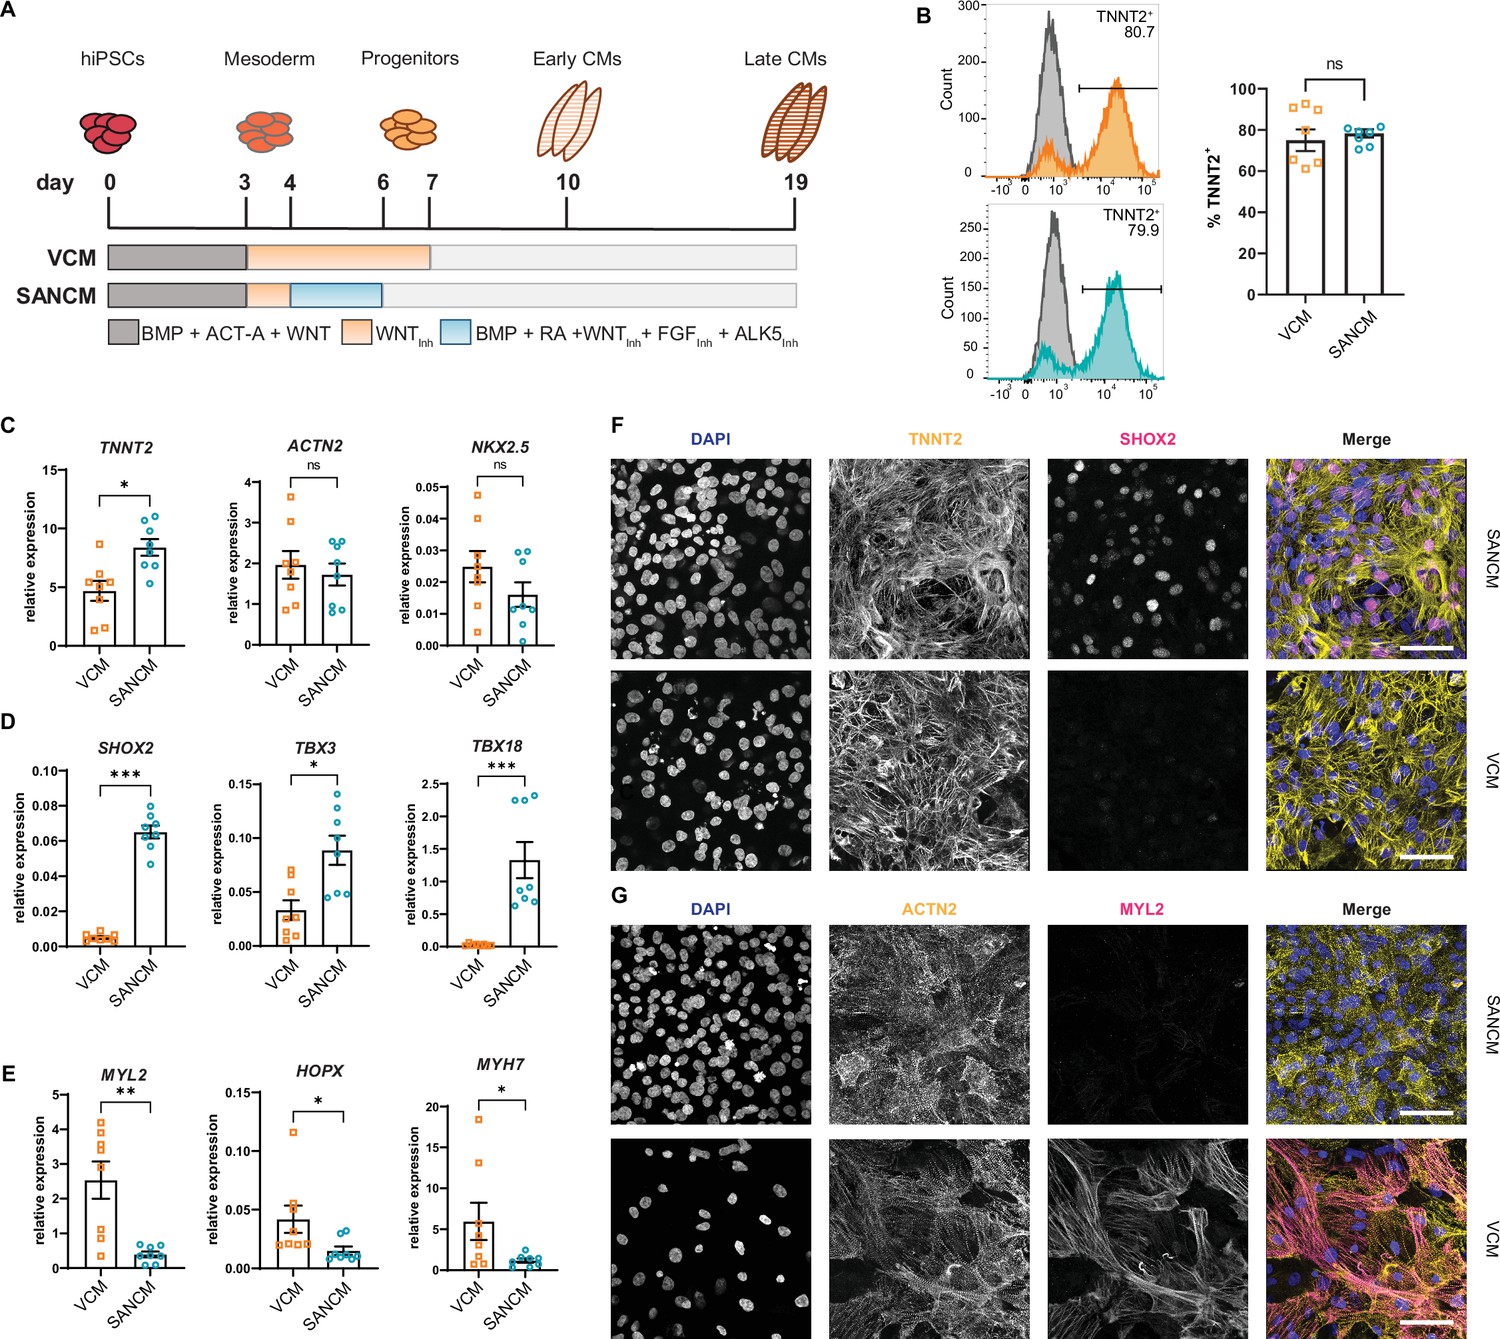
Differentiation of human induced pluripotent stem cells (hiPSCs) to sinoatrial node (SANCM) and ventricular-like cardiomyocytes (VCM).
(A) Schematic representation of protocols used to differentiate hiPSCs to VCM and SANCM. (B) Representative histograms (left) and summarized data (right) showing percentage of TNNT2+ cells in VCM (orange) and SANCM (blue) at day 19 of differentiation. A corresponding IgG isotype antibody was used as negative control for flow cytometry (gray). N=7 independent differentiations. Error bars, s.e.m. Mann-Whitney U test: p>0.05 (ns). (C–E) RT-qPCR depicting expression of pan cardiomyocyte genes (C), SAN-associated genes (D), and ventricular-associated genes (E) at day 19 of differentiation. N=8 independent differentiations; corrected to GEOMEAN of reference genes RPLP0 and GUSB. Error bars, s.e.m. Mann-Whitney U test: p<0.05 (*), p<0.005 (**), p<0.0005 (***). (F–G) Immunofluorescence stainings demonstrating the expression of nuclear stain DAPI, SHOX2, and TNNT2 (F), MYL2 and ACTN2 (G), in SANCM and VCM. Scale bars, 50 μm. Also see Figure 1—figure supplement 1.
Figure 1—figure supplement 1
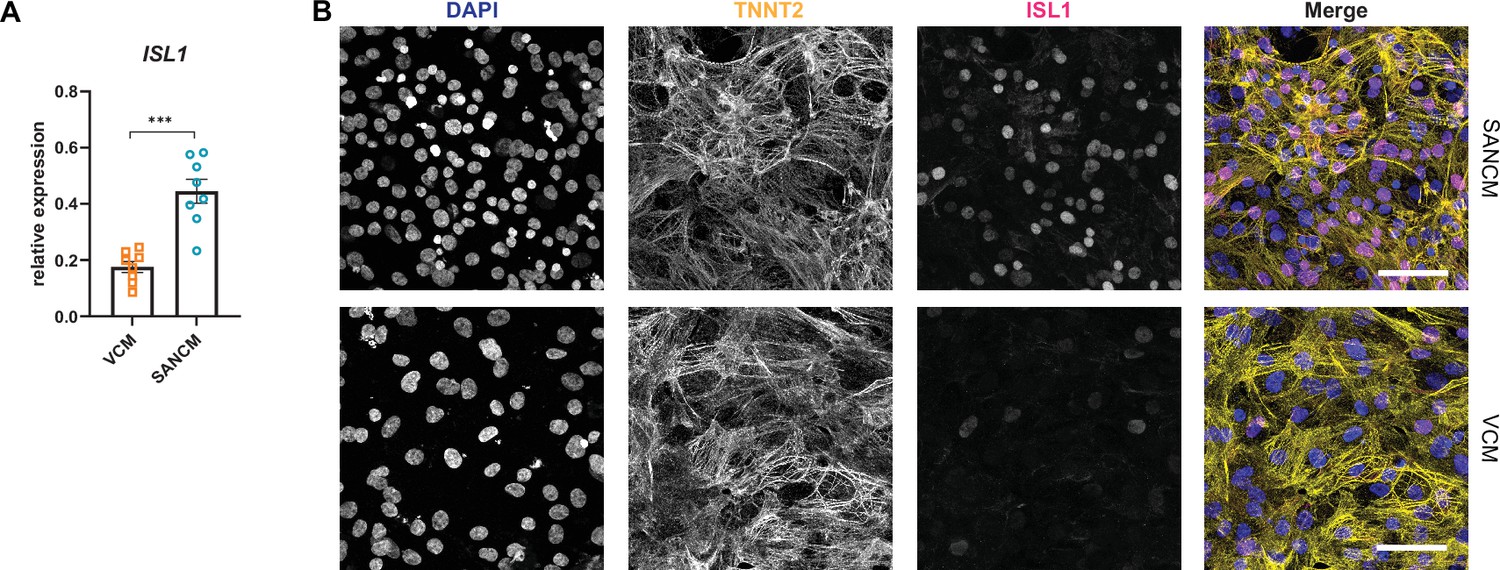
Expression of ISL1 in sinoatrial node-like cardiomyocyte (SANCM) and ventricular-like cardiomyocyte (VCM).
(A) RT-qPCR analysis of ISL1 expression at day 19 of differentiation. N=8 independent differentiations; corrected to GEOMEAN of reference genes RPLP0 and GUSB. Error bars, s.e.m. Mann-Whitney U test: p<0.0005 (***). (B) Immunofluorescence staining of ISL1 co-stained with TNNT2 and DAPI in SANCM and VCM. Scale bars, 50 μm.
Figure 2
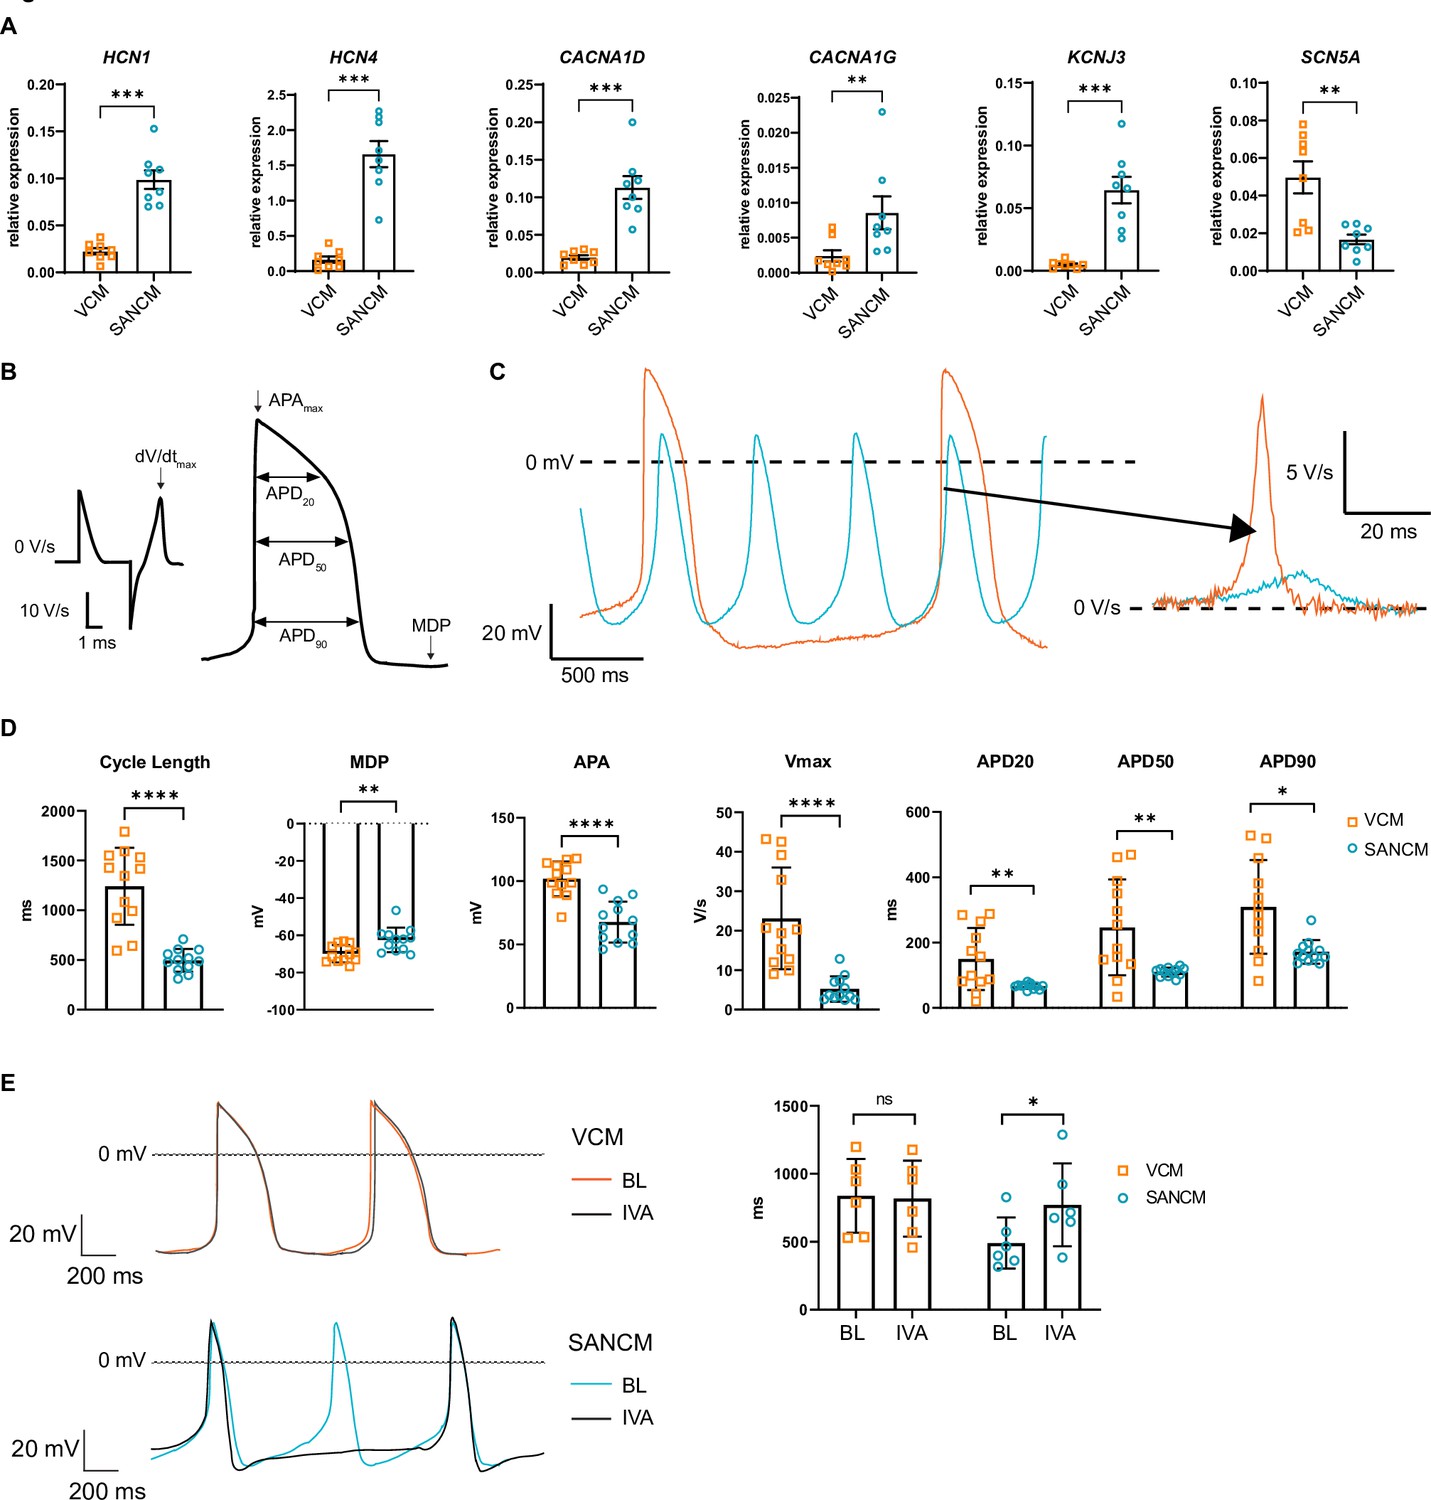
Electrophysiological characterization of sinoatrial node-like cardiomyocyte (SANCM) and ventricular-like cardiomyocyte (VCM).
(A) RT-qPCR showing expression of ion channel genes at day 19 of differentiation. N=8 independent differentiations; corrected to GEOMEAN of reference genes RPLP0 and GUSB. Error bars, s.e.m. Mann-Whitney U test: p<0.05 (*), p<0.005 (**), p<0.0005 (***). (B) Action potential (AP) illustration depicting analyzed electrophysiological parameters. (C) Representative traces of spontaneous APs of day 19 SANCM (blue) and VCM (orange). (D) Cycle length, MDP, APA, Vmax, and APD20, APD50, and APD90 of VCM and SANCM at day 19 of differentiation. N=12 cells from four independent differentiations. Error bars, s.e.m. Mann-Whitney U test: p<0.05 (*), p<0.005 (**), p<0.0001 (****). (E) Cycle lengths of SANCM and VCM measured at baseline (BL) and after treatment with 3 µM ivabradine (IVA). N=6 cells from three independent differentiations. Error bars, s.e.m. Wilcoxon signed-rank test: p<0.05 (*). MDP, maximal diastolic potential; APA, action potential amplitude; Vmax, upstroke velocity; APD20, APD50, APD90, AP duration at 20%, 50%, 90% repolarization, respectively. Also see related source data file Figure 2—source data 1.
-
Figure 2—source data 1
Electrophysiological characterization of SANCM and VCM.
- https://cdn.elifesciences.org/articles/76781/elife-76781-fig2-data1-v1.xlsx
Figure 3 with 2 supplements
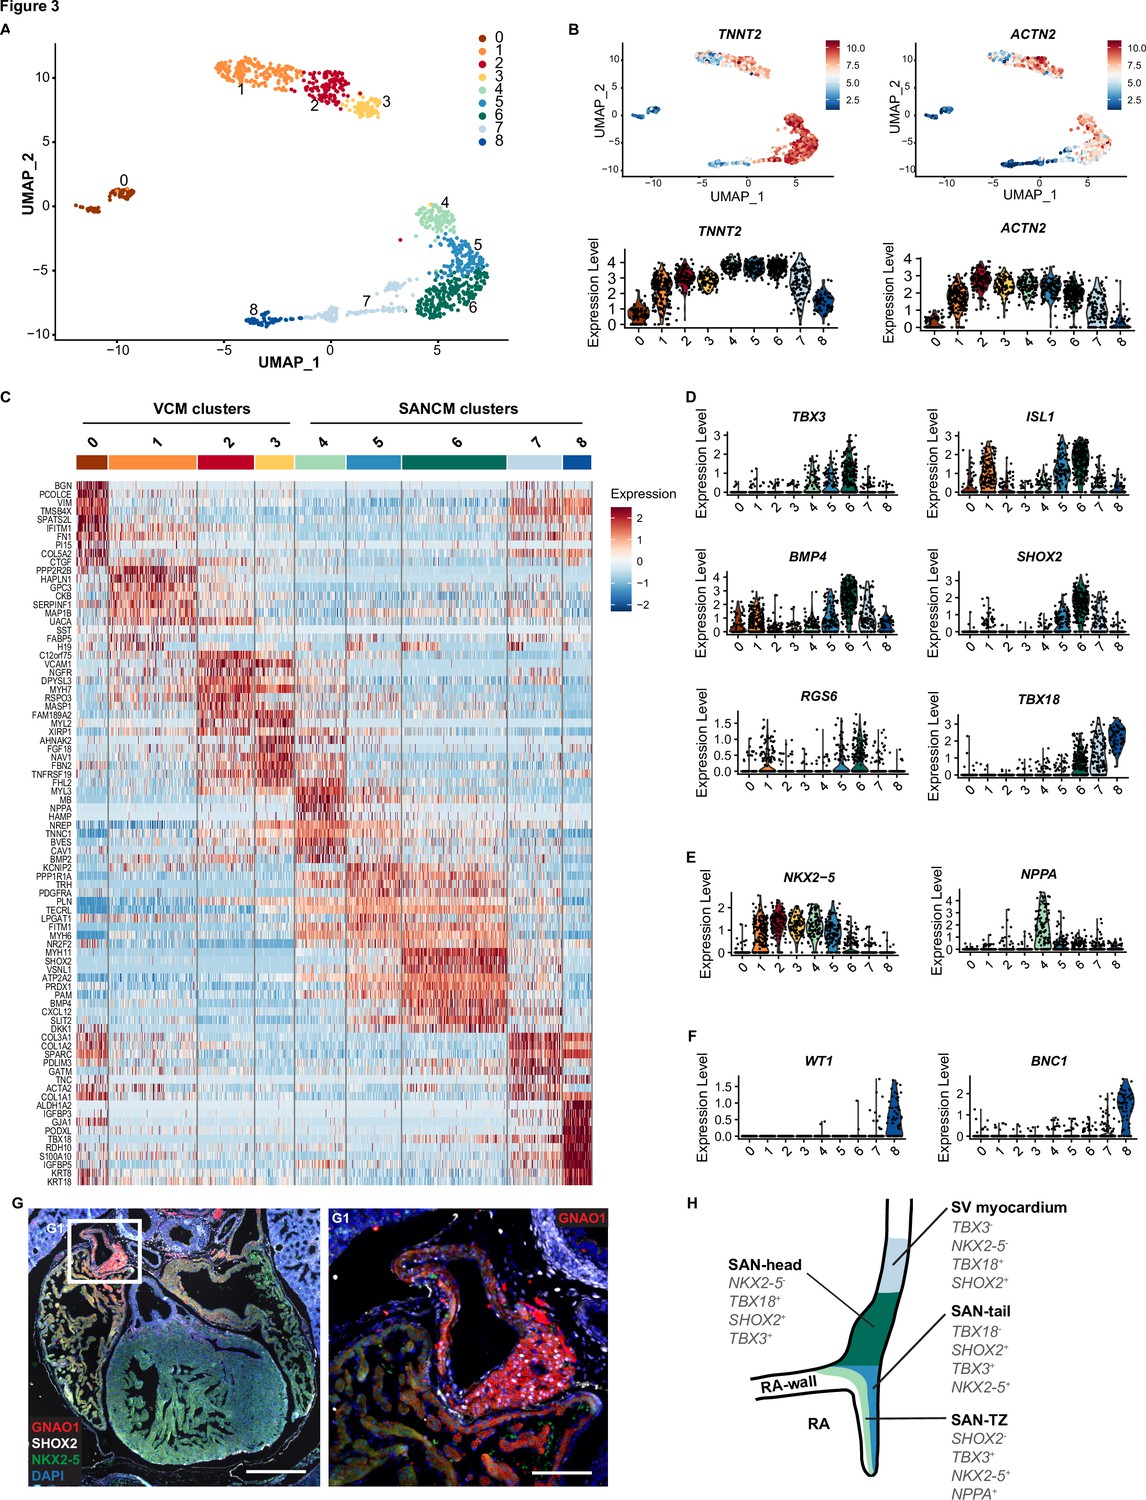
Single cell RNA-sequencing analysis of sinoatrial node-like cardiomyocyte (SANCM) and ventricular-like cardiomyocyte (VCM) cultures.
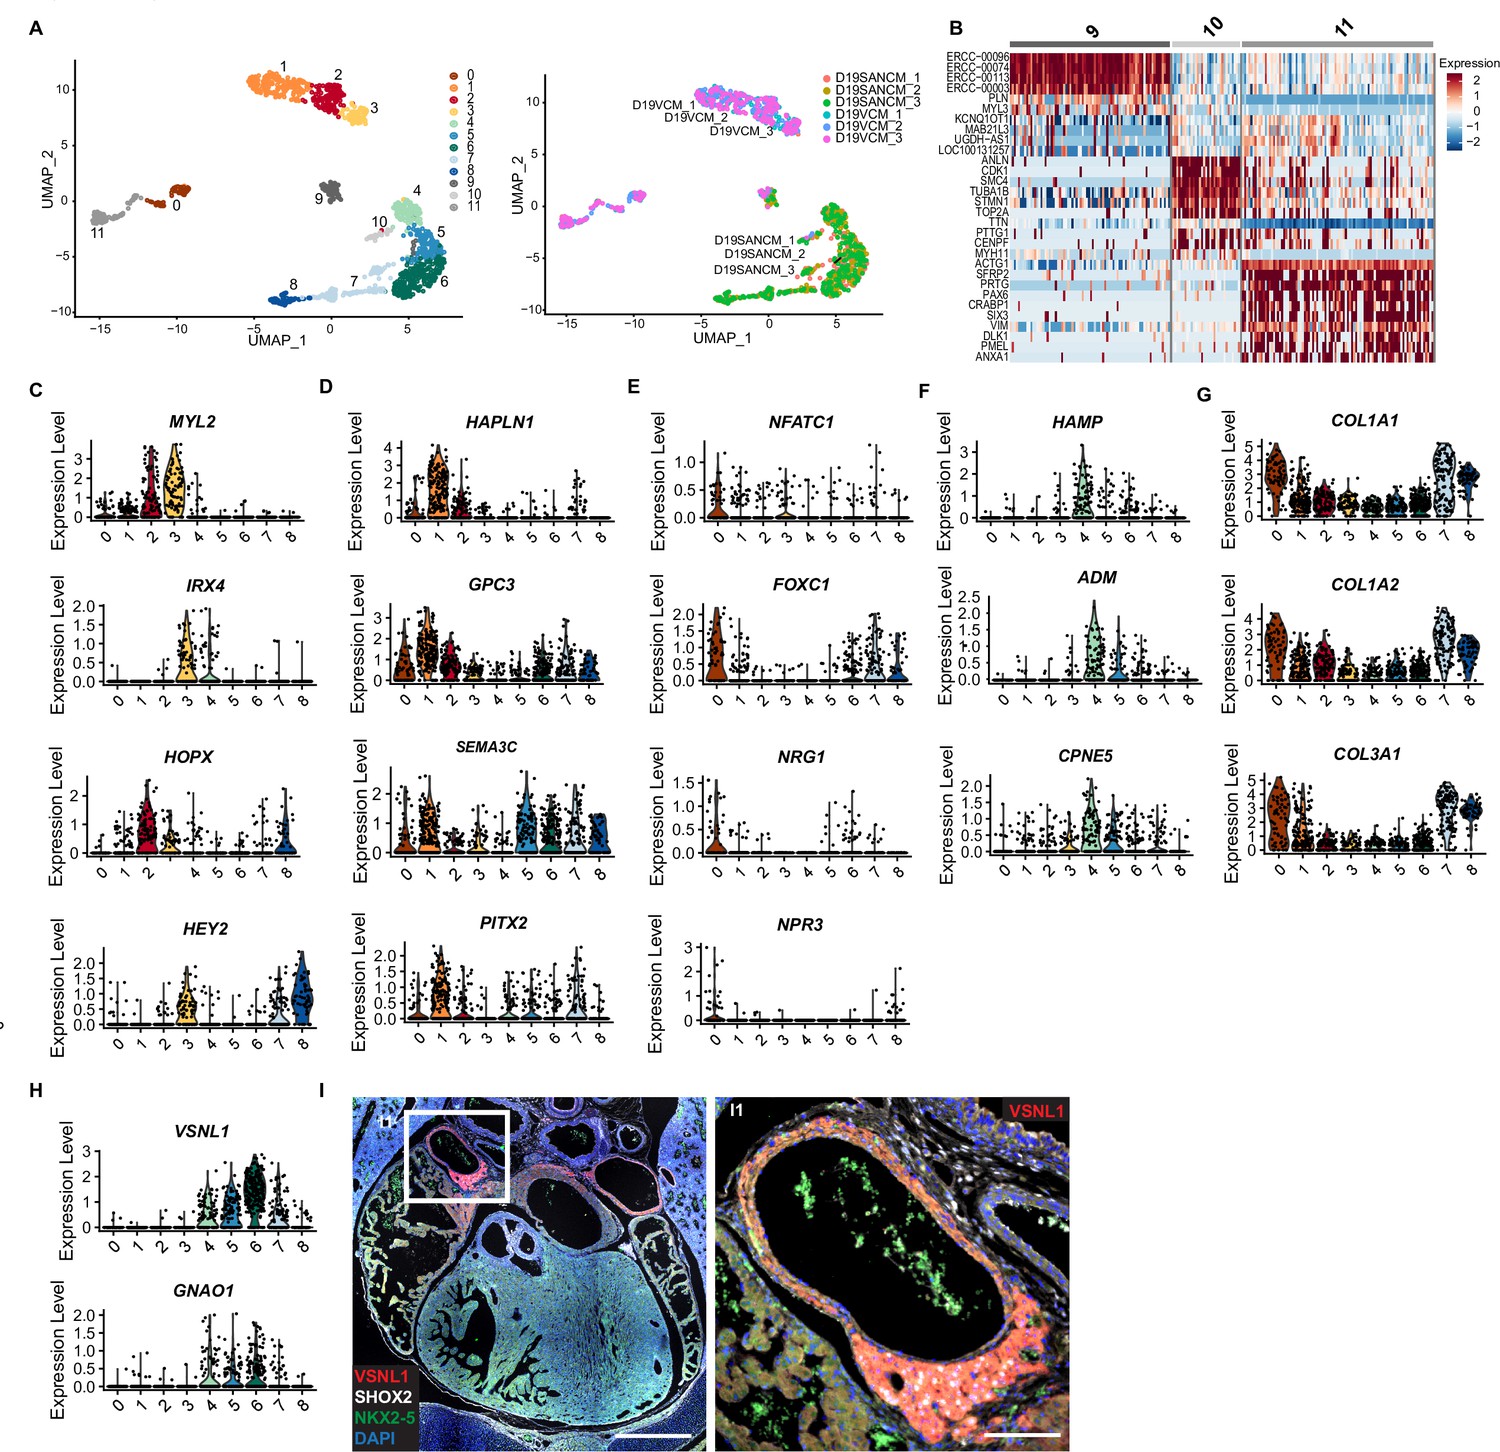
(A) UMAP representation of single cell transcriptomes of SANCM and VCM at day 19 of differentiation. (B) UMAP feature plots and violin plots showing TNNT2 and ACTN2 expression in cell clusters. (C) Heatmap showing the top 10 differentially expressed genes in clusters at day 19 of differentiation. (D–F) Violin plots depicting expression of compact SAN-associated genes (D), SAN-TZ-associated genes (E), and proepicardial-associated genes (F). (G) Immunofluorescence staining of GNAO1 co-stained with SHOX2, NKX2-5, and DAPI in E17.5 embryonic mouse heart. Scale bar 500 μm. G1 is a zoom in of the marked SAN area. Scale bar 100 μm. (H) Schematic representation of the in vivo organization of the SV and SAN region during development. RA, right atrium; rvv, right venous valve; SAN, sinoatrial node; SV, sinus venosus; UMAP, uniform manifold approximation and projection. Also see Figure 3—figure supplement 1 and Figure 3—figure supplement 2.
Figure 3—figure supplement 1
Single cell RNA-sequencing analysis of sinoatrial node-like cardiomyocyte (SANCM) and ventricular-like cardiomyocyte (VCM) cultures.
(A) UMAP depicting all single cell transcriptomes before filtering out low-quality cells and unrelated clusters (left). UMAP showing the original identifier of collection (right). (B) Heatmap showing top 10 differentially expressed genes of clusters excluded from the analysis: low-quality/ERCC-spike-in DNA-enriched cells (cluster 9), cell cycle-enriched gene cluster (cluster 10) and a cluster associated with extraocular muscle development (cluster 11). (C–H) Violin plots showing expression of ventricular-enriched genes (C), genes associated with outflow tract development (D), fetal endocardium-associated genes (E), atrial- and SAN-TZ-associated genes (F), fibroblast-associated genes (G), and SAN-enriched genes with yet unknown function (H). (I) Immunofluorescence staining of VSNL1 co-stained with SHOX2, NKX2-5, and DAPI in E17.5 embryonic mouse heart. Scale bar 500 μm. I1 is a magnification of the marked SAN area. Scale bar 100 μm.
Figure 3—figure supplement 2
Genes enriched in the different sinoatrial node-like cardiomyocyte (SANCM) subpopulations.
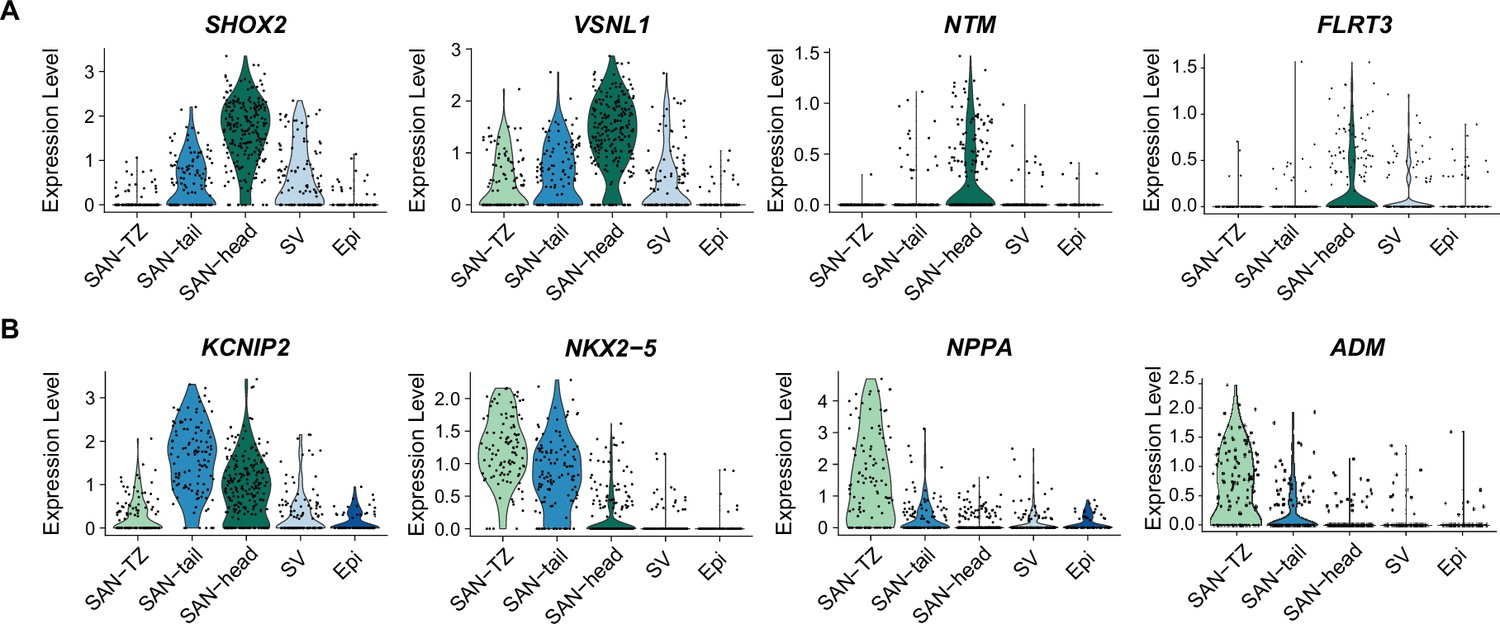
(A–B) Genes enriched in the SAN-head population (A) and genes enriched in SAN-tail (KCNIP2, NKX2-5) and SAN-TZ cells (NKX2-5, NPPA, and ADM) (B) at day 19 of differentiation. Epi, proepicardial-like population; SV, sinus venosus-like population.
Figure 4 with 2 supplements

Time course single cell RNA-sequencing of SANCM.
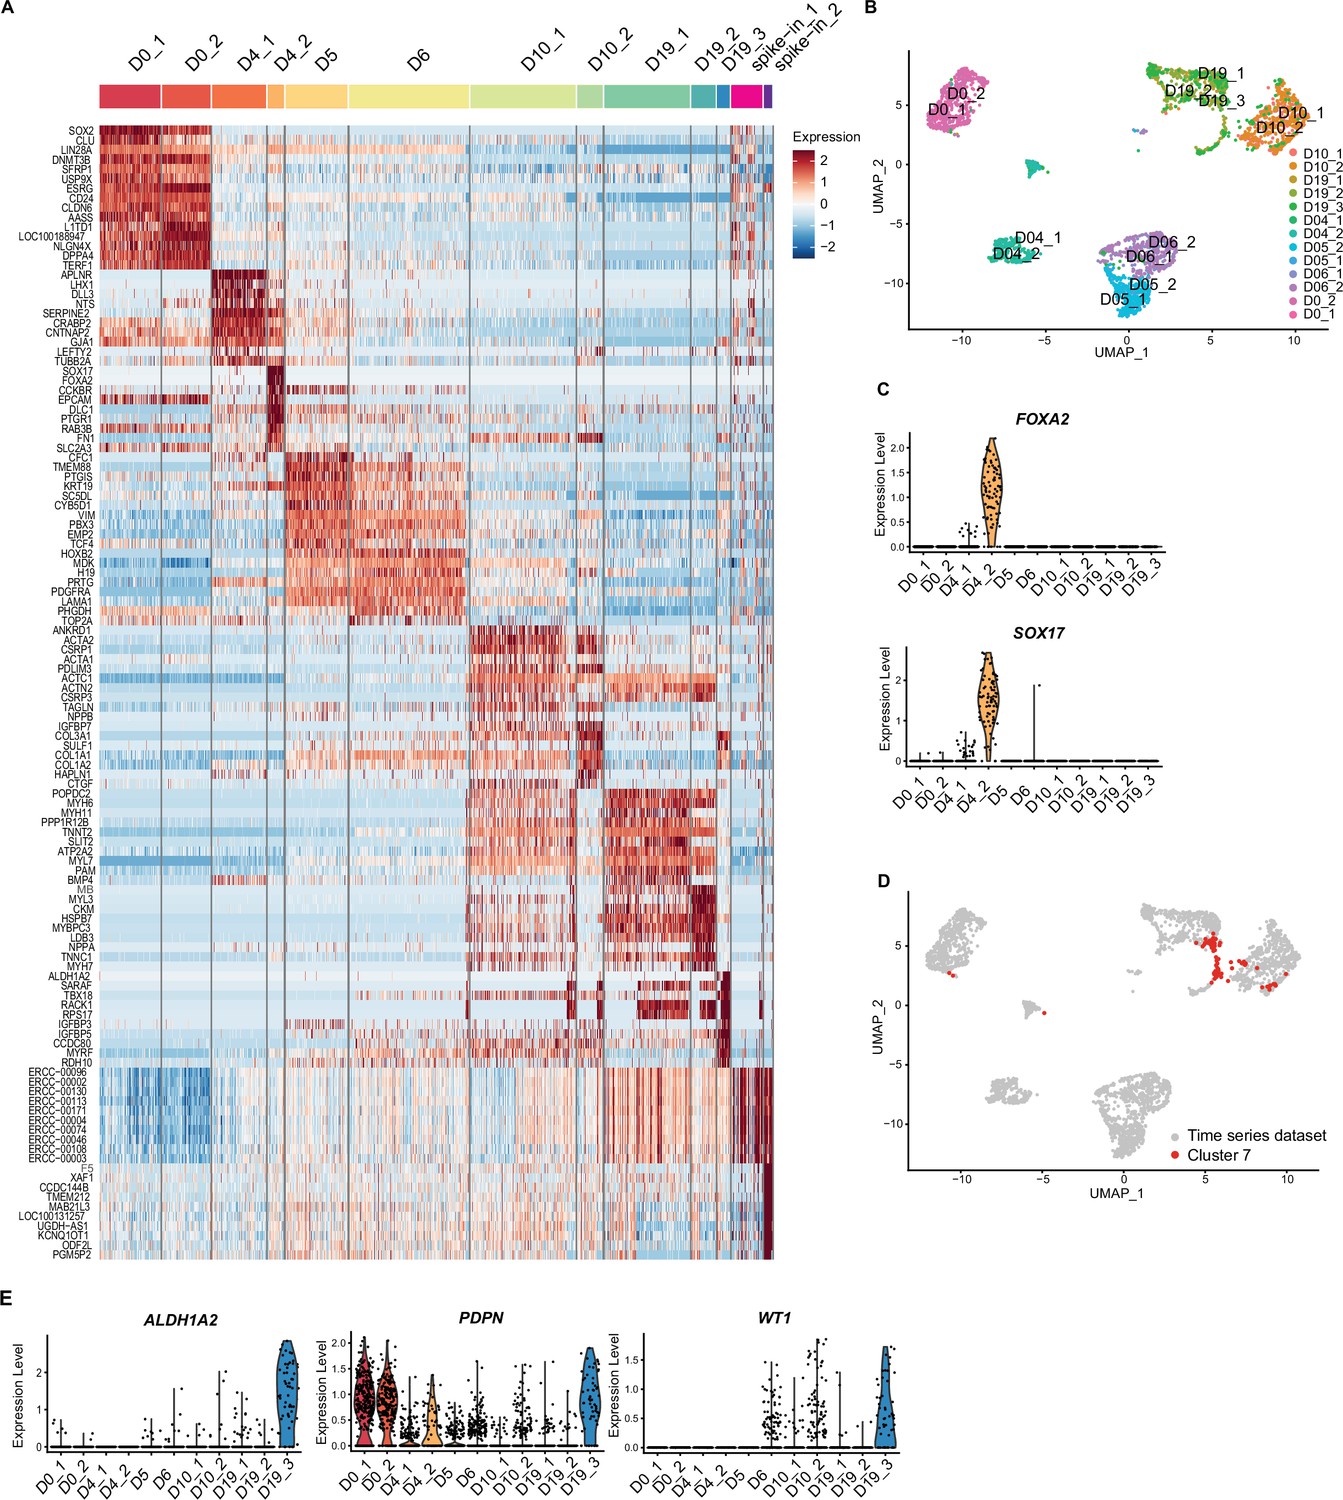
(A) Timeline of hiPSC differentiation to SANCM representing sample collection time points. (B) UMAP representation of single cell transcriptomes collected at different time points throughout differentiation from hiPSC to SANCM. Arrow indicates course of differentiation. (C) UMAP feature plots and violin plots showing TNNT2 and ACTN2 gene expression at different stages of SANCM differentiation. (D–H) Violin plots of pluripotency genes (D), mesodermal genes (E), posterior cardiac progenitor genes (F), proepicardial genes (G), and SAN-associated transcription factor genes (H). hiPSCs, human induced pluripotent stem cells; CPC, cardiac progenitor cells; CMs, cardiomyocytes; UMAP, uniform manifold approximation and projection; SANCM, sinoatrial node-like cardiomyocyte. Also see Figure 4—figure supplement 1 and Figure 4—figure supplement 2.
Figure 4—figure supplement 1
Time course single cell RNA-sequencing of sinoatrial node-like cardiomyocyte (SANCM).
(A) Heatmap showing top 10 differentially expressed genes of all clusters identified before filtering low-quality cells. Two clusters with low-quality/ERCC-spike-in DNA-enriched transcriptomes (spike_in_1 and spike_in_2) were excluded from the analysis. (B) Uniform manifold approximation and projection (UMAP) showing the original identifier of each collection time point. (C) Violin plots depicting expression of endoderm-associated genes in cluster D4_2. (D) UMAP depicting annotation of cluster 7 (sinus venosus-like cluster, Figure 3A) on entire time series dataset. Majority of cluster 7 (Figure 3A) cluster together with cells collected on day 10 (cluster D10_1).
Figure 4—figure supplement 2

Time course RT-qPCR of sinoatrial node (SAN)-subpopulation markers.
(A–C) Time course RT-qPCR of SAN progenitor-enriched genes (A), SAN-head-enriched genes (B) and SAN-tail (KCNIP2) or SAN-TZ-enriched genes (C). N=4 independent differentiations; corrected to GEOMEAN of reference genes RPLP0 and GUSB.
Figure 5 with 1 supplement
Reconstruction of single cell trajectories.
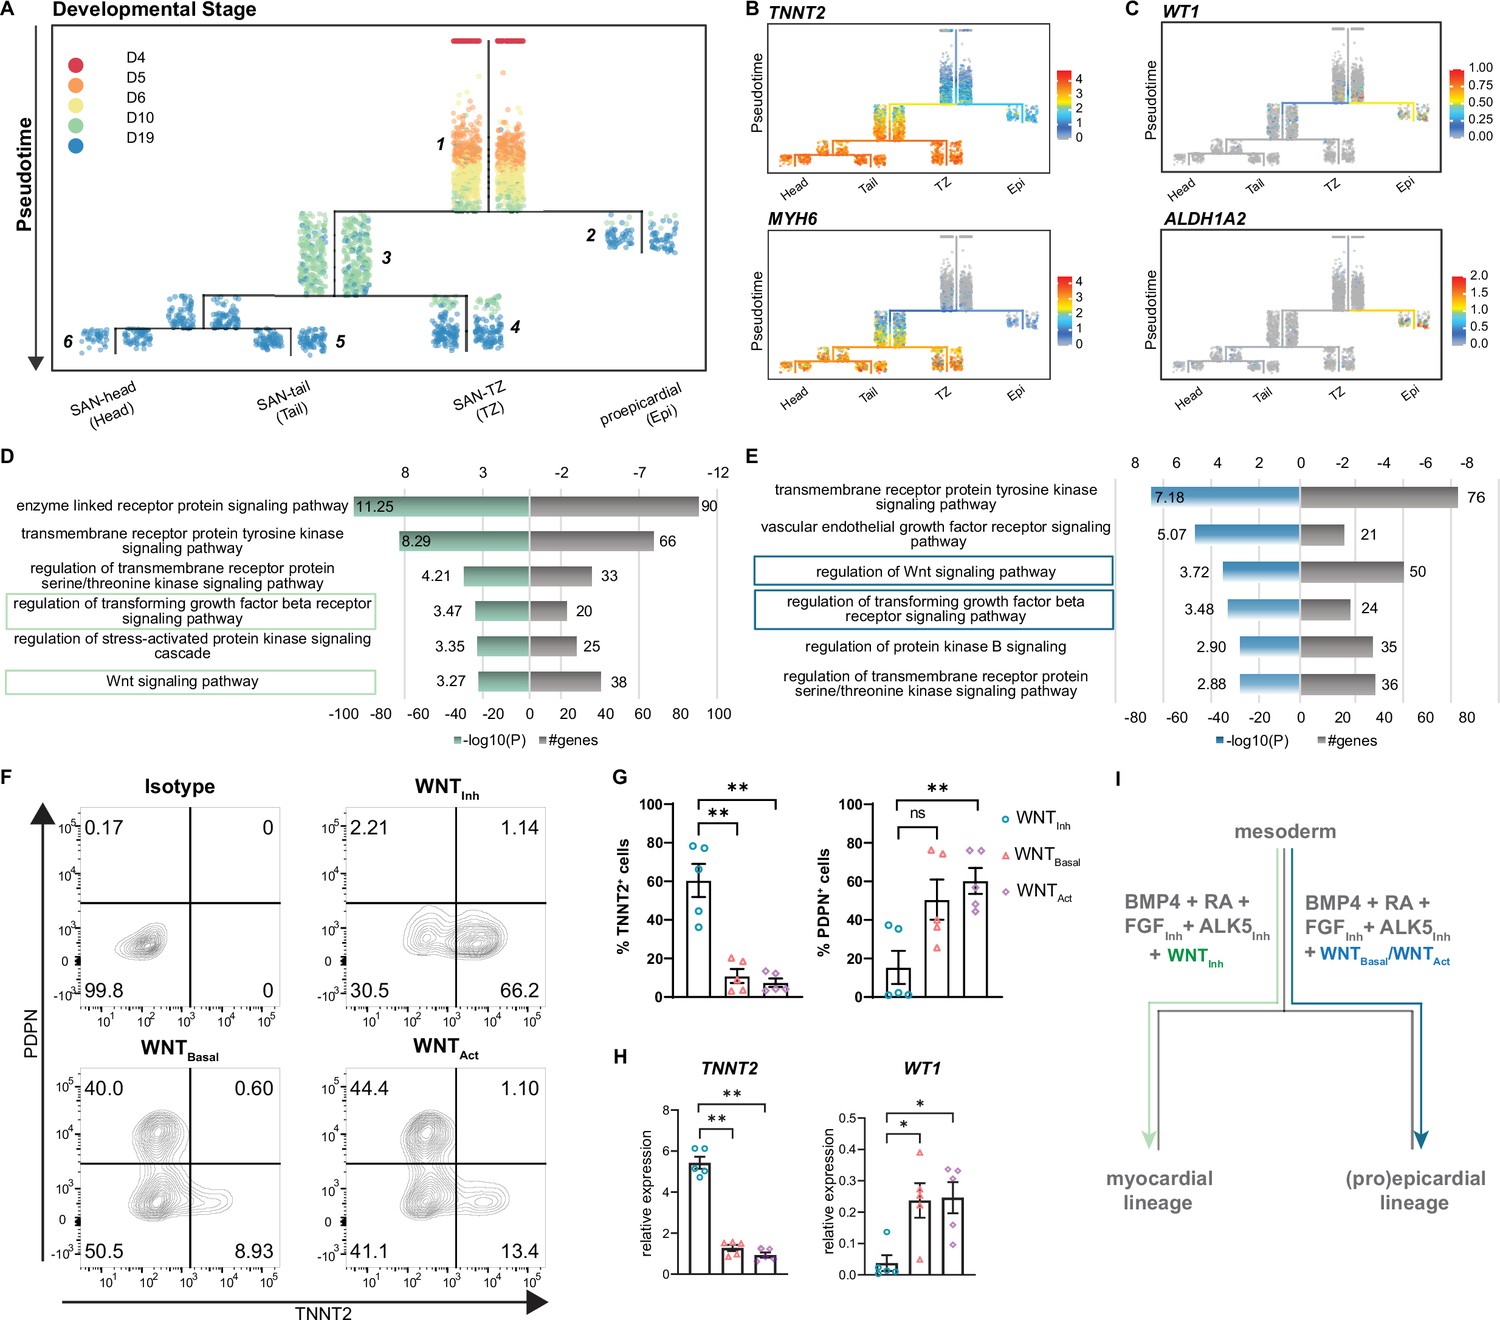
(A) URD trajectory tree starts at late mesoderm stage (day 4) and proceeds to terminally differentiated cell clusters identified on day 19. Colors correspond to the time point of cell collection. (B) Expression of TNNT2 and MYH6 marking the myocardial lineage (C) Expression of WT1 and ALDH1A2 marking the proepicardial lineage in the trajectory tree. (D–E) Representative gene ontology (GO) terms based on differentially expressed genes between the common progenitor, segment 1, and the myocardial branch, segment 3, (D) or the proepicardial branch, segment 2 (E) . (F) Representative contour plots and (G) summarized data demonstrating percentage of TNNT2+ and PDPN+ cells in baseline condition containing WNT inhibitor, XAV (WNTInh), excluding WNT inhibitor, XAV (WNTBasal), and addition of WNT activator, CHIR (WNTAct). N=5 independent differentiations. Error bars represent s.e.m., Kruskal-Wallis, post hoc Mann-Whitney U test: p<0.005 (**). (H) RT-qPCR demonstrating the expression of cardiomyocyte gene TNNT2 and the proepicardial gene WT1 in WNTInh, WNTBasal, and WNTAct conditions. N=5 independent differentiations; corrected to GEOMEAN of reference genes RPLP0 and GUSB. Error bars, s.e.m. Kruskal-Wallis, post hoc Mann-Whitney U test: p<0.05 (*), p<0.005 (**). (I) Schematic representation of divergence of myocardial and proepicardial lineages from a common progenitor. Also see Figure 5—figure supplement 1.
Figure 5—figure supplement 1
Reconstruction of single cell trajectories and the role of TGFβ modulation on pacemaker versus proepicardial differentiation.
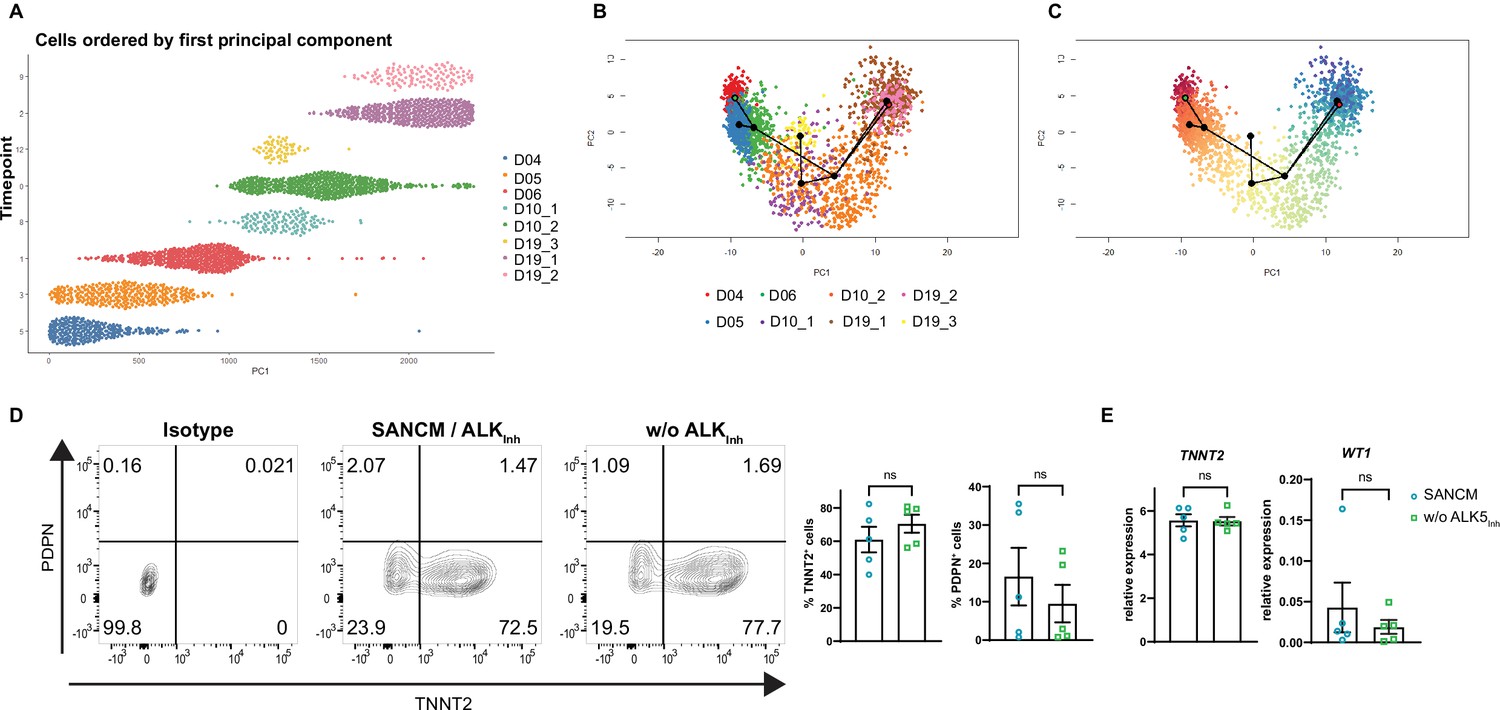
(A) Ordering of cell populations by principal component 1. (B–C) Lineages inferred by Slingshot (Street et al., 2018) with points colored by cluster (B) and pseudotime (C). Green dot indicates manually chosen starting point of trajectory; red point indicates manually chosen end time point of trajectory. Similar to URD, Slingshot identified the correct order of the cells. Furthermore, a similar number of trajectories was obtained. Slingshot did not recognize day 5 as part of the main trajectory and instead connected cells from day 4 directly to day 6, with day 5 cells forming an individual lineage. This outcome might reflect the transcriptional burst induced by the treatment with pacemaker differentiation factors (BMP4, retinoic acid and others) introduced in the culture on day 4. Similar to URD, Slingshot identified a lineage branching off toward the proepicardial cells around day 10, and two separate cardiomyocyte lineages. These results are consistent with the clustering outcome shown in Figure 4B, where cells collected on day 19 of differentiation form three individual groups (SAN-head/SAN-tail, SAN-TZ, and proepicardial cells). All in all, predictions made by URD, and Slingshot are very comparable. (D) Representative contour plots (left) and summarized data (right) demonstrating percentage of TNNT2+ and PDPN+ cells (day 19) of baseline condition including ALK5 inhibitor (SANCM) and without ALK5 inhibitor (w/o ALK5Inh) from day 4 to day 6 of differentiation. N=5 independent differentiations. Error bars represent s.e.m., Mann-Whitney U test: p>0.05 (ns). (E) RT-qPCR analysis at day 19 of differentiation showing the expression of the cardiac gene TNNT2 and the proepicardial gene WT1 in the baseline condition including ALK5 inhibitor (SANCM) and without ALK5 inhibitor (w/o ALK5Inh) from day 4 to day 6 of differentiation. N=5 independent differentiations; corrected to GEOMEAN of reference genes RPLP0 and GUSB. Error bars, s.e.m. Mann-Whitney U test: p>0.05 (ns).
Figure 6
Diversification of sinoatrial node (SAN)-head, SAN-tail, and SAN-TZ subpopulations.
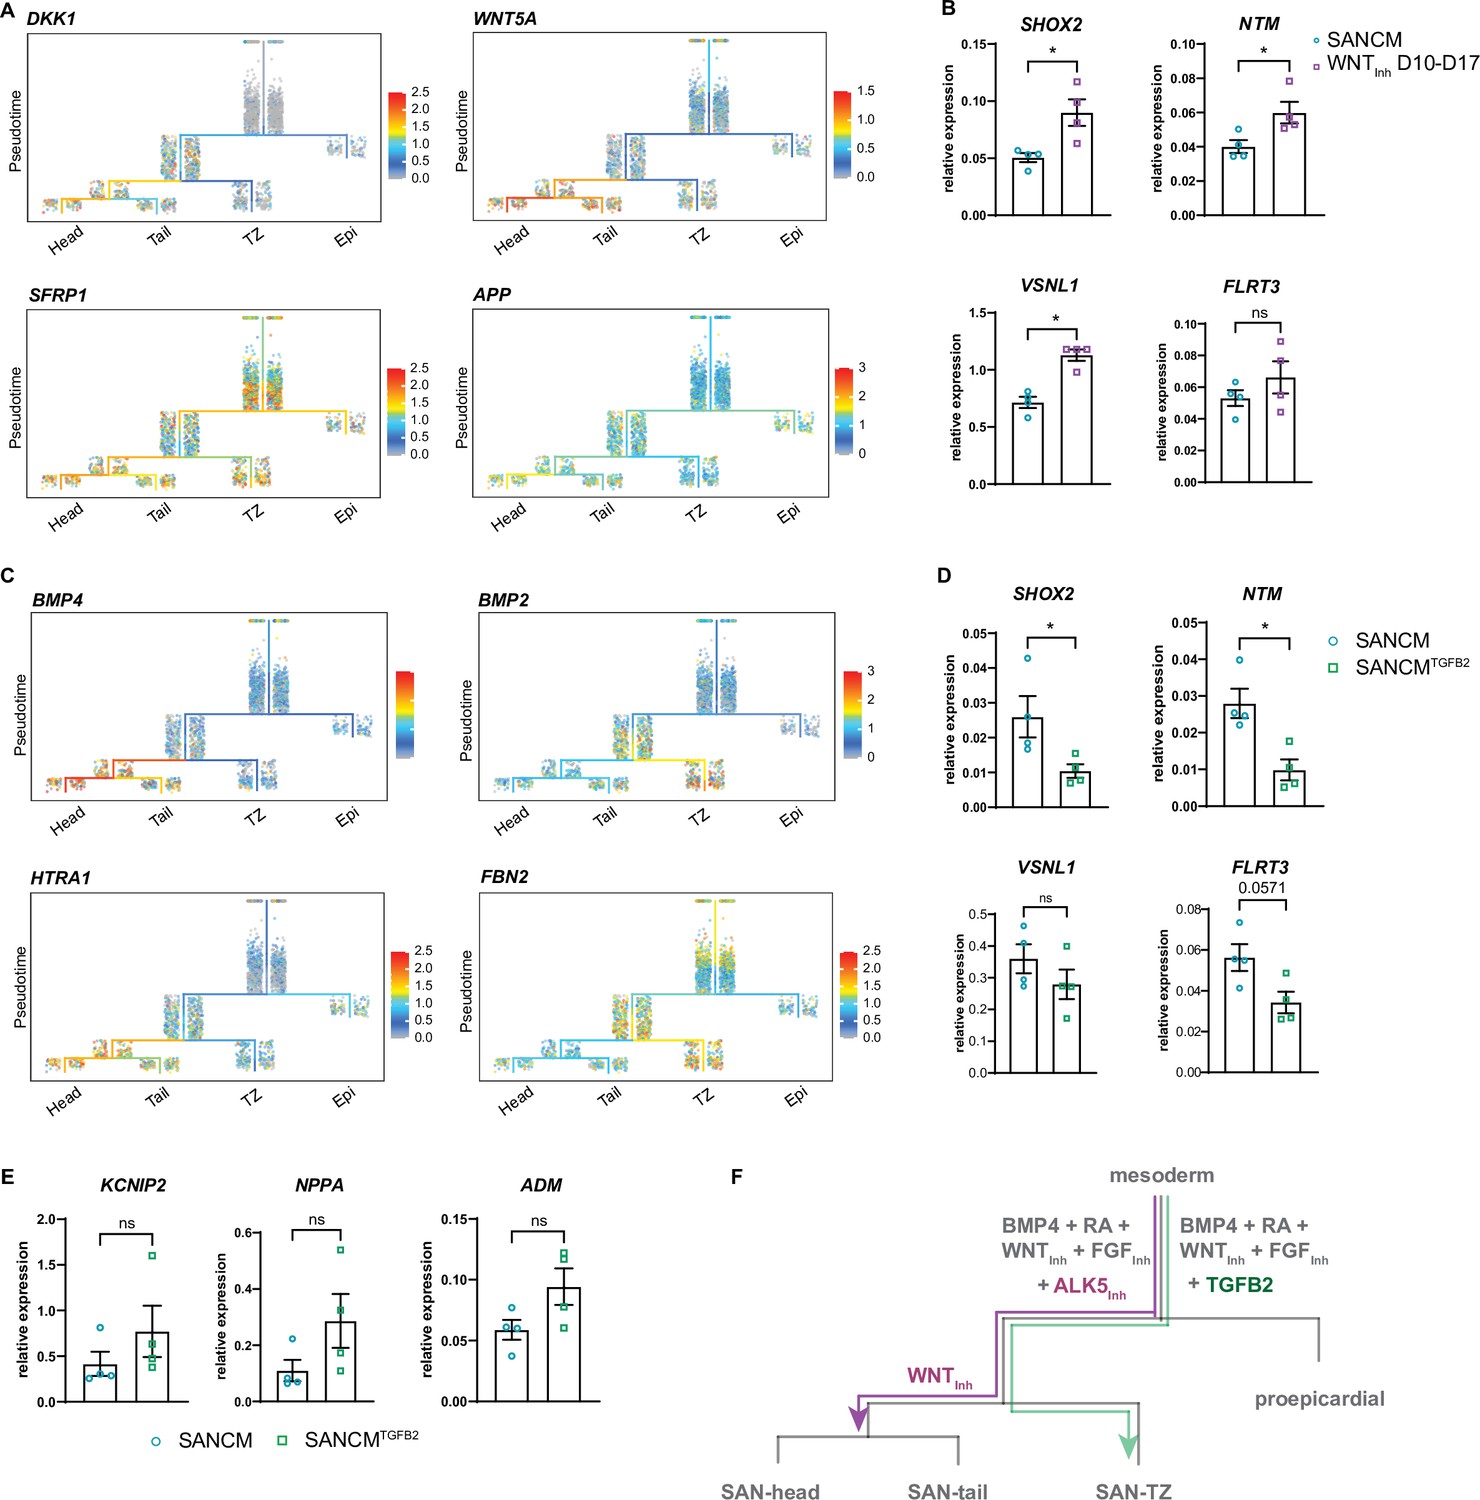
(A) Expression of WNT signaling pathway members in the trajectory tree. (B) RT-qPCR of genes enriched in the SAN-head lineage upon prolonged WNT signaling inhibition (WNTInh D 10–17). N=4 independent differentiations; corrected to GEOMEAN of reference genes RPLP0 and GUSB. Error bars, s.e.m. Mann-Whitney U test: p<0.05 (*). (C) Expression of TGFβ signaling pathway members in the trajectory tree. (D–E) RT-qPCR of genes enriched in the SAN-head lineage (D) and SAN-tail/-TZ lineage (E) upon supplementation with TGFB2 (SANCMTGFB2) during differentiation. N=4 independent differentiations; corrected to GEOMEAN of reference genes RPLP0 and GUSB. Error bars, s.e.m. Mann-Whitney U test: p<0.05 (*). (F) Schematic representation of the diversification of the various SANCM subpopulations from a common myocardial progenitor.
Figure 7 with 1 supplement

TGFβ signaling promotes differentiation toward sinoatrial node (SAN)-TZ cells.
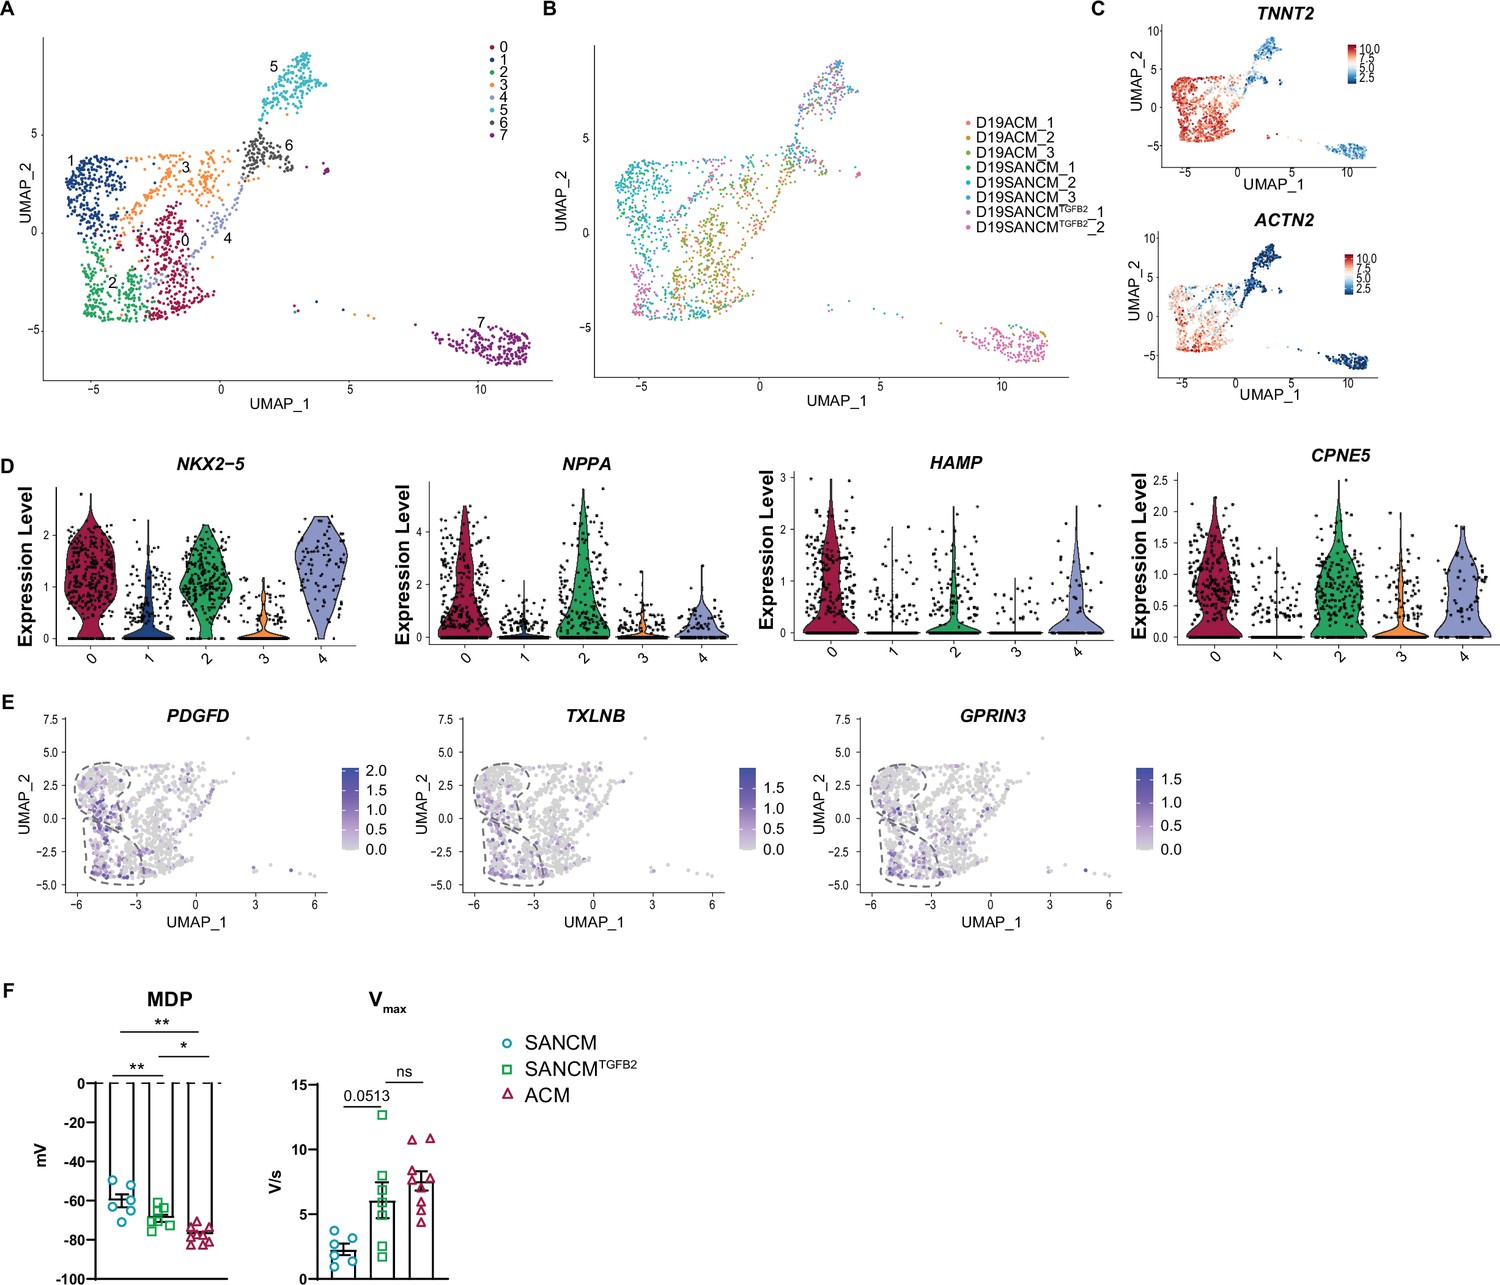
(A) Uniform manifold approximation and projection (UMAP) representation of single cell transcriptomes of cardiomyocyte clusters derived from SANCM, SANCMTGFB2, and ACM differentiation at day 19. (B) Heatmap depicting the top 10 differentially expressed genes in each cluster. (C) UMAP showing the distribution of cells from different conditions in clusters 0–4. (D) UMAP highlighting previously annotated SAN subpopulation clusters (SAN-TZ, SAN-head, and SAN-tail) (Figure 3) in the cluster analysis comparing SANCM, SANCMTGFB2, and ACM. (E) Representative traces of spontaneous APs of day 19 SANCM (black) and SANCMTGFB2 (green). (F–G) Cycle length and MDP (F), Vmax, APA, and APD20, APD50, and APD90 (G) of SANCM and SANCMTGFB2 at day 19 of differentiation. N=6–8 cells. Error bars, s.e.m. Mann-Whitney U test: p<0.05 (*), p<0.005 (**), p<0.0001 (****). MDP, maximal diastolic potential; APA, action potential amplitude; Vmax, upstroke velocity; APD20, APD50, APD90, AP duration at 20%, 50%, 90% repolarization, respectively. Also see Figure 7—figure supplement 1 and related source data file Figure 7—source data 1.
-
Figure 7—source data 1
Active TGFβ signaling promotes SAN-TZ cell differentiation.
- https://cdn.elifesciences.org/articles/76781/elife-76781-fig7-data1-v1.xlsx
Figure 7—figure supplement 1
TGFβ signaling promotes differentiation toward sinoatrial node (SAN)-TZ cells.
(A) Uniform manifold approximation and projection (UMAP) depicting all identified single cell transcriptomes (eight clusters). (B) UMAP showing the distribution of cells from different conditions in clusters 0–7. (C) UMAP feature plots showing TNNT2 and ACTN2 expression. (D) Violin plots depicting expression of atrial/SAN-TZ-associated genes. (E) UMAP feature plots showing genes shared between cluster 2 (SAN-TZ) and cluster 1 (SAN-head and SAN-tail). (F) MDP and Vmax comparing SANCM, SANCMTGFB2, and ACM cells (ACM data from Li et al., 2019). N=6–9 cells. Error bars, s.e.m. Wilcoxon: p<0.05 (*), p<0.005 (**), p<0.0005 (***). MDP, maximal diastolic potential; Vmax, upstroke velocity.
Tables
Key resources table
| Reagent type (species) or resource | Designation | Source or reference | Identifiers | Additional information |
|---|---|---|---|---|
| Cell line (Homo sapiens) | hiPSC line (female) | iPSC core facility of Leiden University Medical Center | LUMC0099iCTRL04 | https://hpscreg.eu/cell-line/LUMCi004-A |
| Antibody | Anti-cTNT (rabbit polyclonal) | Abcam | Ab45932 | (1:1000) |
| Antibody | Anti-ACTN2 (mouse monoclonal) | Sigma | A7811 | (1:800) |
| Antibody | Anti-SHOX2 (mouse monoclonal) | Abcam | ab55740 | (1:200) |
| Antibody | Anti-MYL2 (rabbit polyclonal) | Abcam | 79935 | (1:200) |
| Antibody | Anti-ISL1 (goat polyclonal) | Neuromics | GT15051 | (1:200) |
| Antibody | Anti-HCN4 (rabbit polyclonal) | Merck Millipore | AB5808-200uL | (1:250) |
| Antibody | Anti-NKX2-5 (goat polyclonal) | LabNed | LN2027081 | (1:150) |
| Antibody | Anti-GNAO1 (rabbit polyclonal) | Protein Tech Group | 12635-1-AP | (1:150) |
| Antibody | Anti-VSNL1 (rabbit polyclonal) | Abbexa | abx007357 | (1:450) |
| Antibody | Anti-cTNT -REAfinity (recombinant human; APC) | Miltenyi Biotec | 130-120-403 | (1:50) |
| Antibody | Anti-Podoplanin (rat monoclonal; Alexa Fluor 488) | Biolegend | 337005 | (1:20) |
| Peptide, recombinant protein | Activin-A | Miltenyi Biotec | #130-115-012 | Human, premium grade |
| Peptide, recombinant protein | BMP4 | R&D Systems | #314BP-010/CF | Recombinant human protein, carrier-free |
| Peptide, recombinant protein | TGFB2 | R&D Systems | #302-B2-002/CF | Recombinant human protein |
| Chemical compound, drug | CHIR99021 | Axon Medchem | #1386 | |
| Chemical compound, drug | XAV939 | Tocris Bioscience | #3748/10 | |
| Chemical compound, drug | SB431542 | Tocris Bioscience | #1614 | |
| Chemical compound, drug | PD173074 | Selleck Chemicals | #1264 | |
| Chemical compound, drug | Retinoic acid | Sigma | #R2625 | |
| Software, algorithm | Seurat V3/V4 | Stuart et al., 2019 (V3) Hao et al., 2021 (V4) | https://github.com/satijalab/seurat/ | |
| Software, algorithm | URD | Farrell et al., 2018 | https://schierlab.biozentrum.unibas.ch/urd | |
| Software, algorithm | GraphPad Prism version 9.1.0 | GraphPad Software, San Diego, CA | https://www.graphpad.com/ | |
| Other | mTESR1 | Stem Cell Technologies | #5850 | iPSC Maintenance Media |
| Other | Matrigel | Corning | #356234 | Substrate for iPSC culture |
| Other | ×1 TryPLE Select | Thermo Fisher Scientific | #12563011 | Cell dissociation reagent |
Additional files
-
Transparent reporting form
- https://cdn.elifesciences.org/articles/76781/elife-76781-transrepform1-v1.docx
-
Supplementary file 1
Differentially expressed genes in sinoatrial node-like cardiomyocyte (SANCM) and ventricular-like cardiomyocyte (VCM) clusters identified at day 19.
Related to Figure 3 and Figure 3—figure supplement 1.
- https://cdn.elifesciences.org/articles/76781/elife-76781-supp1-v1.xlsx
-
Supplementary file 2
Differentially expressed genes in clusters identified in time series analysis.
Related to Figure 4 and Figure 4—figure supplement 1.
- https://cdn.elifesciences.org/articles/76781/elife-76781-supp2-v1.xlsx
-
Supplementary file 3
Gene ontology (GO) term analysis of differentially expressed genes between common progenitor segment (1) and proepicardial segment (2) or myocardial segment (3).
Related to Figure 5.
- https://cdn.elifesciences.org/articles/76781/elife-76781-supp3-v1.xlsx
-
Supplementary file 4
Gene ontology (GO) term analysis of differentially expressed genes between myocardial segment (3) and sinoatrial node (SAN)-TZ segment (4) or SAN-tail segment (5), or SAN-head segment (6).
Related to Figure 6.
- https://cdn.elifesciences.org/articles/76781/elife-76781-supp4-v1.xlsx
-
Supplementary file 5
Differentially expressed genes in clusters identified on day 19 comparing sinoatrial node-like cardiomyocyte (SANCM), SANCMTGFB2, and ACM.
Related to Figure 7.
- https://cdn.elifesciences.org/articles/76781/elife-76781-supp5-v1.xlsx
-
Supplementary file 6
Sequences of primers used in the manuscript.
- https://cdn.elifesciences.org/articles/76781/elife-76781-supp6-v1.xlsx
Download links
A two-part list of links to download the article, or parts of the article, in various formats.
Downloads (link to download the article as PDF)
Open citations (links to open the citations from this article in various online reference manager services)
Cite this article (links to download the citations from this article in formats compatible with various reference manager tools)
A single cell transcriptional roadmap of human pacemaker cell differentiation
eLife 11:e76781.
https://doi.org/10.7554/eLife.76781


