Modified viral-genetic mapping reveals local and global connectivity relationships of ventral tegmental area dopamine cells
- Department of Physiology and Biophysics, Neurobiology and Behavior, Biomedical Engineering, Pharmaceutical Sciences, Center for the Neurobiology of Learning and Memory, University of California, Irvine, United States
Figures
Figure 1 with 2 supplements

Use of a modified viral-genetic strategy to map local and global inputs to VTADA neurons.
(A) Strategy for viral mapping. On day 1, a combination of adeno-associated viruses (AAVs) expressing the mutated TVA protein fused to mCherry, TC66T, and RABV-G were injected into the VTA. Two weeks later, EnvA-pseudotyped RABV expressing GFP was injected into the VTA. Animals were sacrificed 5 days later. (B) Representative image of local virally labeled inputs at anterior–posterior −3.9 mm from bregma. Scale, 1 mm. (C) Representative image of local virally labeled inputs at anterior–posterior −4.2 mm from bregma. Scale, 1 mm. (D) Representative image of a midbrain section including starter cells in the VTA as well as local inputs. Scale, 1 mm. (E) Starter cell distributions for each of the four experiments. The center of each oval represents the center of mass of starter cells, and the horizontal and vertical radii of the oval represent 1 SD of starter cells in the medial–lateral and dorsal–ventral axes, respectively. (F) The fraction of starter cells located in each region in the ventral midbrain. 58% ± 6% were located in the parabrachial pigmented nucleus (PBP), 27% ± 6% in the paranigral nucleus (PN), and 5% ± 2% in the IF nuclei of the VTA, 8% ± 3% in the SNc, 2% ± 1% in the Rli, and 1% ± 0.3% in all other regions. (G) Linear regression of RABV-labeled inputs vs. number of starter cells. (H) The convergence index, or ratio of inputs to starter cells, for RABV input mapping experiments using TCB as reported in Beier et al., 2015, or TC66T. Only long-range inputs were considered to enable direct comparison between conditions. p = 0.42, 95% CI −21.25 to 10.24, unpaired t-test; n = 4 for each condition. (I) The percentage of each local and long-distance input relative to all RABV-labeled inputs is shown. (J) The fraction of inputs that were long-range inputs (54% ± 3%), as mapped by us in the previous studies, and local inputs (46% ± 3%), is shown. All error bars in this figure and others throughout this manuscript represent ±1 standard error of the mean (SEM) (Beier et al., 2015).
Figure 1—figure supplement 1
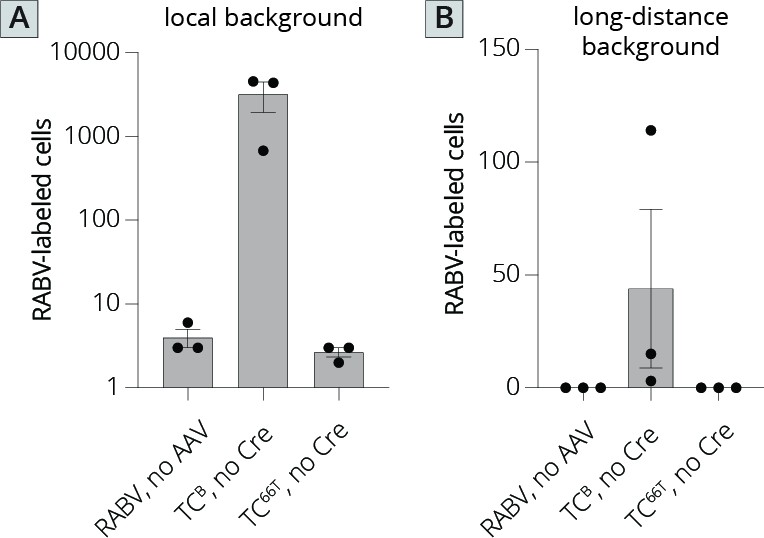
Quantification of local and long-distance input labeling using TCB and TC66T.
(A) Local background in animals where AAVs were not injected in Cre+ mice, TCB was injected in Cre− mice, or TC66T was injected into Cre− mice. (B) Long-distance background in animals where AAVs were not injected in Cre+ mice, TCB was injected in Cre− mice, or TC66T was injected into Cre− mice.
Figure 1—figure supplement 2
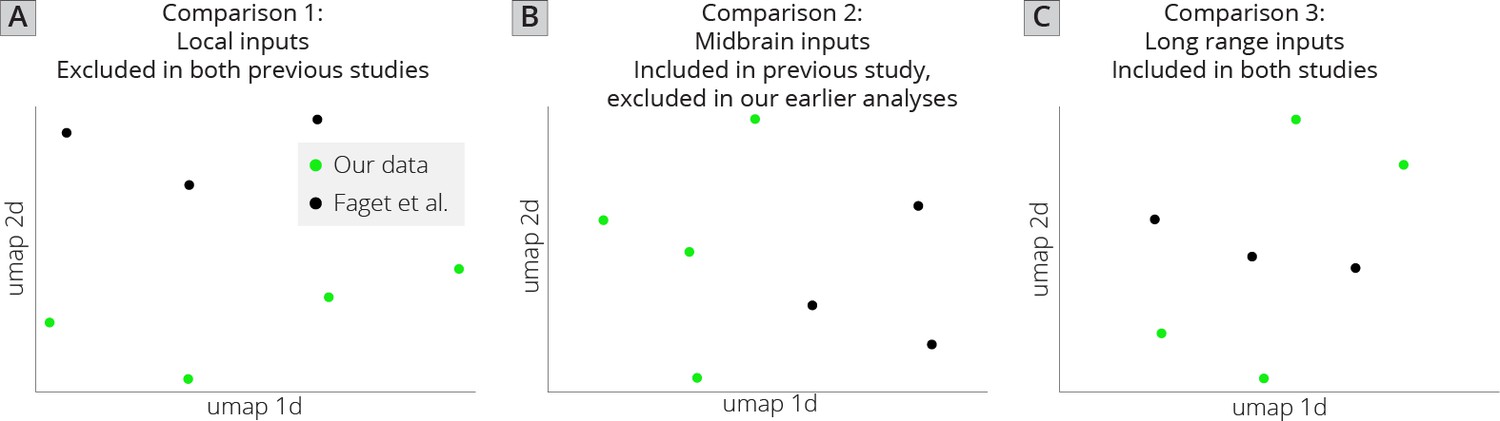
UMAP analysis of VTADA input tracing datasets.
(A) UMAP embedding of brains using only inputs excluded in my previous studies as well as in Faget et al. These included the VTA, substantia nigra (SNc/SNr), IPN, RPC, and medial habenula (MHb). (B) UMAP embedding of local inputs included in Faget et al., but excluded from my previous studies. These inputs included the PSth, MM, SuM, MnR, PPTg, RMg, RRF, PT, InC, PAG, RI, VTg, colliculus (IC + SC), MiTg, SPTg, ATg, DLL, PnC, PnO, RtTg, and SubB. (C) UMAP embedding of long-range inputs from my study and Faget et al. Regions of the isocortex anterior to the corpus collosum were combined to make the anterior cortex. The extended amygdala (EAM) and deep cerebellar nuclei (DCN were excluded from the analysis as these were not contained in both datasets, and the MHb was excluded from this dataset because it was contained in the excluded dataset (panel A)).
Figure 2
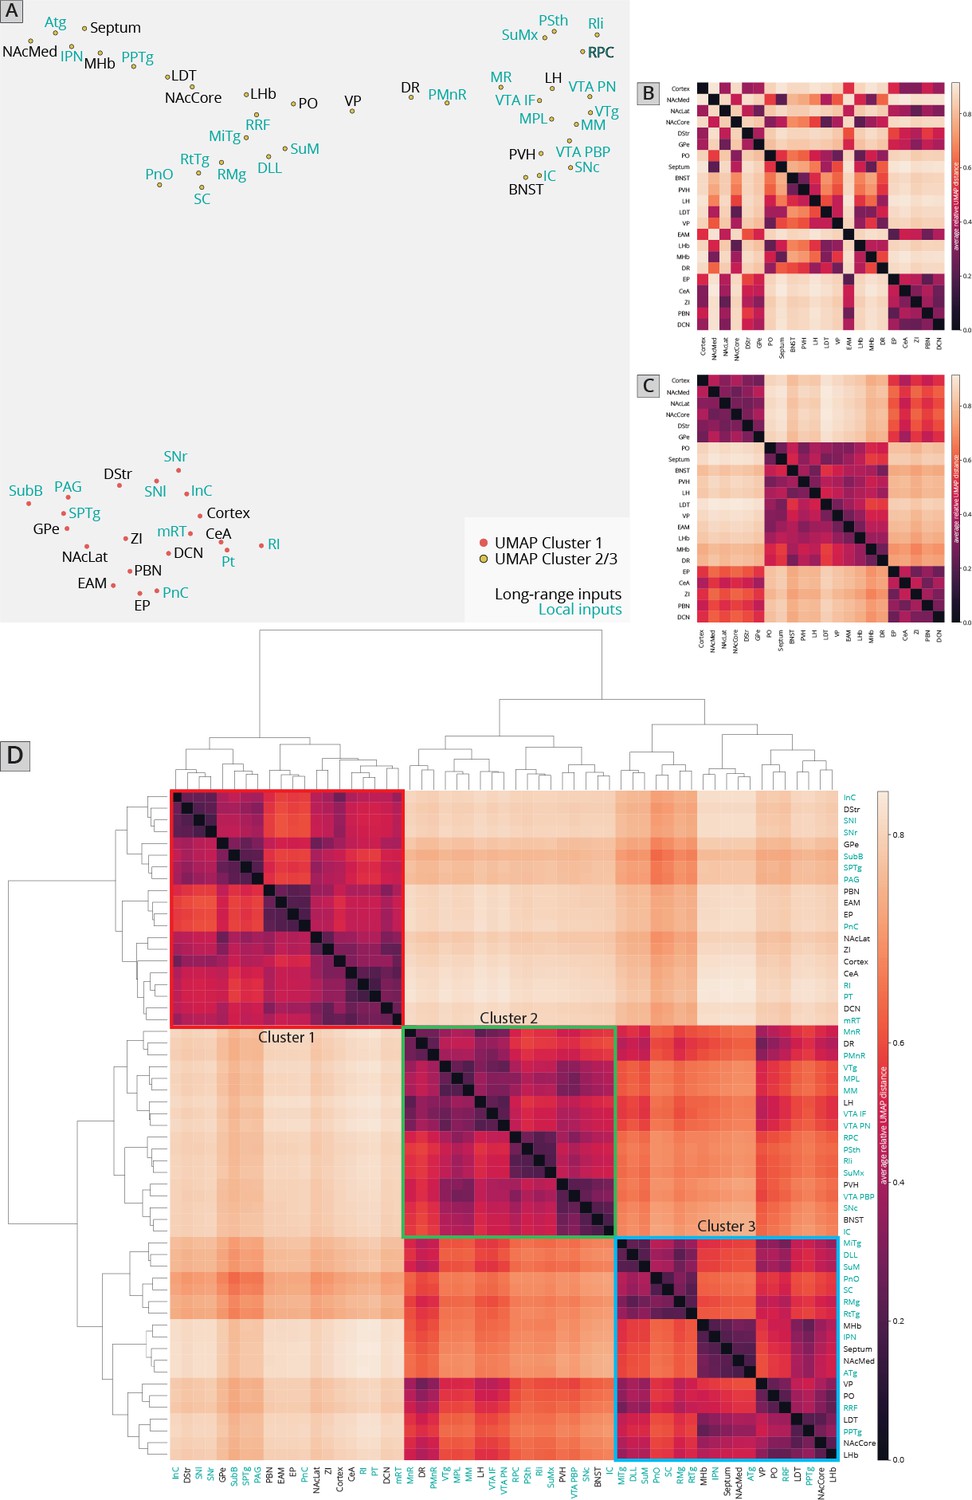
Association of local inputs to VTADA cells with long-range inputs.
(A) Input regions are plotted in Uniform Manifold Approximation and Projection (UMAP) space, embedded with respect to z-scored counts across mouse brains. Clusters represent inputs with similar patterns of variation across the cohort. (B) Heatmap of pairwise distances (averaged across 20 UMAP embeddings) for the RABV input data, including only long-distance inputs to enable comparison to our 76-brain dataset, where only long-distance inputs were analyzed. (C) Heatmap of pairwise distances from an aggregated UMAP analysis of our 76 brain dataset, from Derdeyn et al., 2021, for purposes of comparison. (D) Heatmap of pairwise distances for the RABV input data, including both local and long-distance inputs. Regions are grouped according to hierarchical clusters. Clusters are highlighted to match the clusters in the UMAP plot.
Figure 3 with 1 supplement
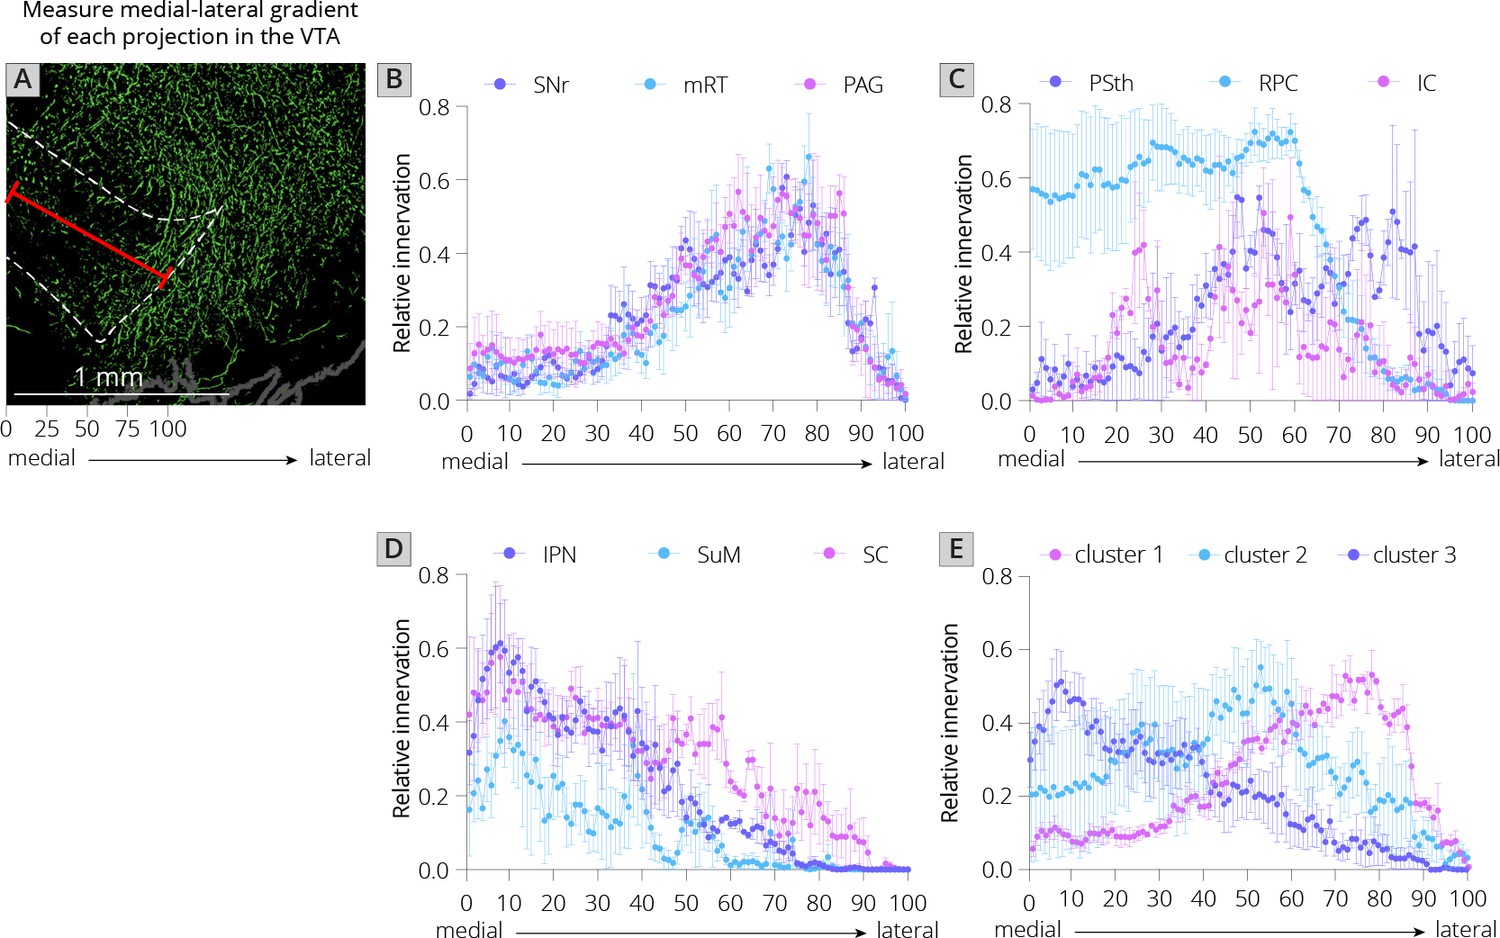
Projections from local inputs along the medial–lateral axis of the VTA.
(A) Schematic of how relative innervation of the medial–lateral axis of the VTA was quantified. Scale, 1 mm. Images used for quantification of the data in panels B–E were obtained from the Allen Mouse Brain Connectivity Atlas. (B) Relative innervation across the medial–lateral axis for Uniform Manifold Approximation and Projection (UMAP) cluster 1. (C) Relative innervation across the medial–lateral axis for UMAP cluster 2. (D) Relative innervation across the medial–lateral axis for UMAP cluster 3. (E) Relative innervation across the medial–lateral axis for each UMAP cluster, representing the average of the three individual quantified input regions shown in B-D. Error bars represent 1 standard error of the mean (SEM).
Figure 3—figure supplement 1
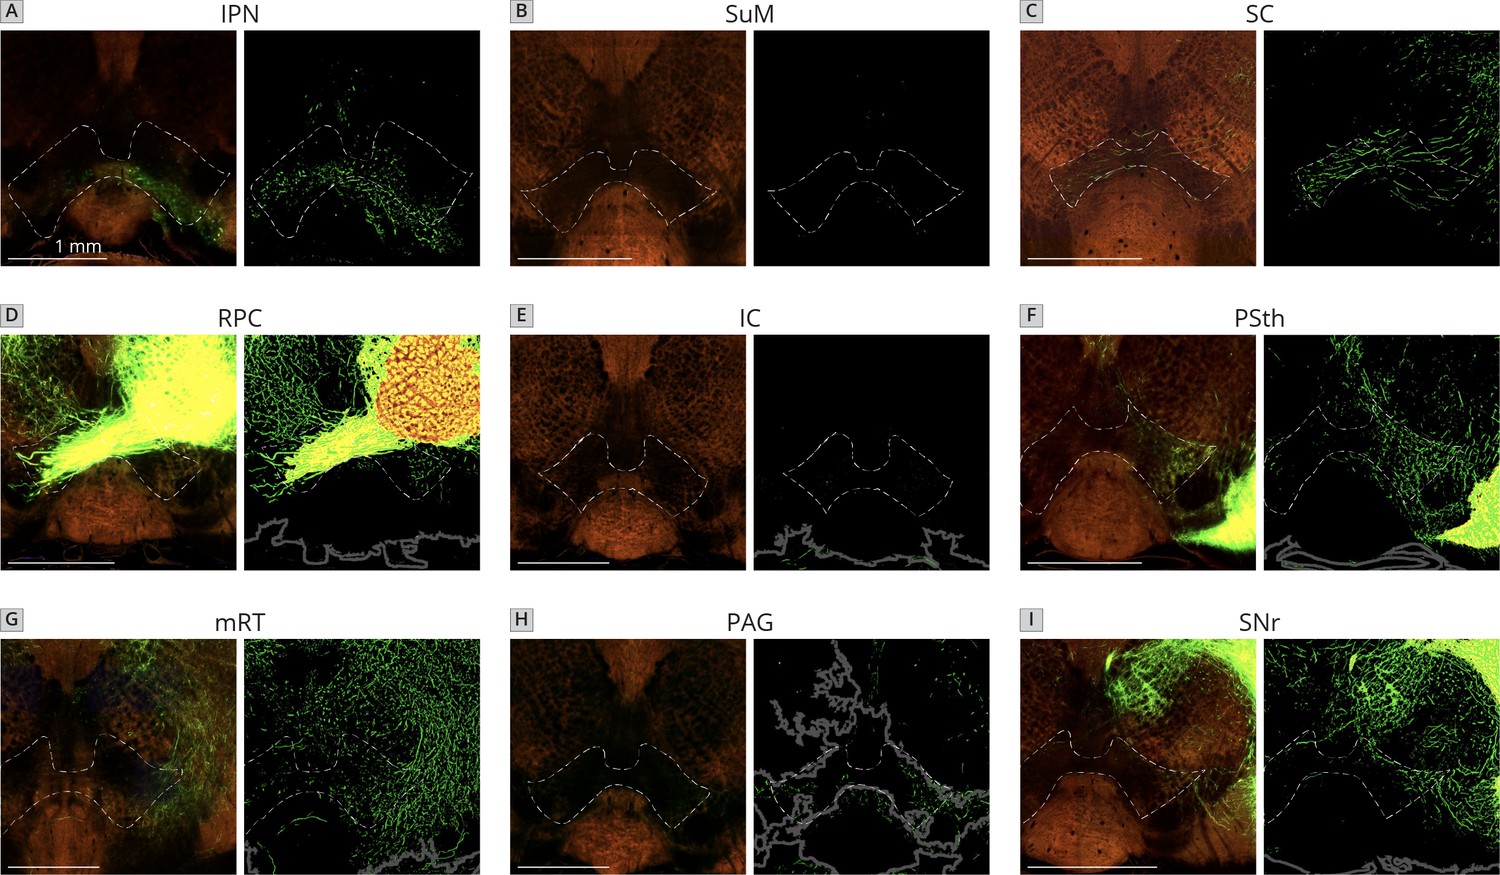
Sample images of projections in the VTA from each of the nine quantified local inputs to VTADA cells.
Images are from axons of labeled cells in the (A) IPN, (B) SuM, (C) SC, (D) RPC, (E) IC, (F) PSth, (G) mRT, (H) PAG, and (I) SNr. Left images, serial two-photon tomography; right images, projection segmentation. Dark gray lines are auto-defined borders. All images were obtained from the Allen Mouse Brain Connectivity Atlas. Scale, 1 mm.
Figure 4
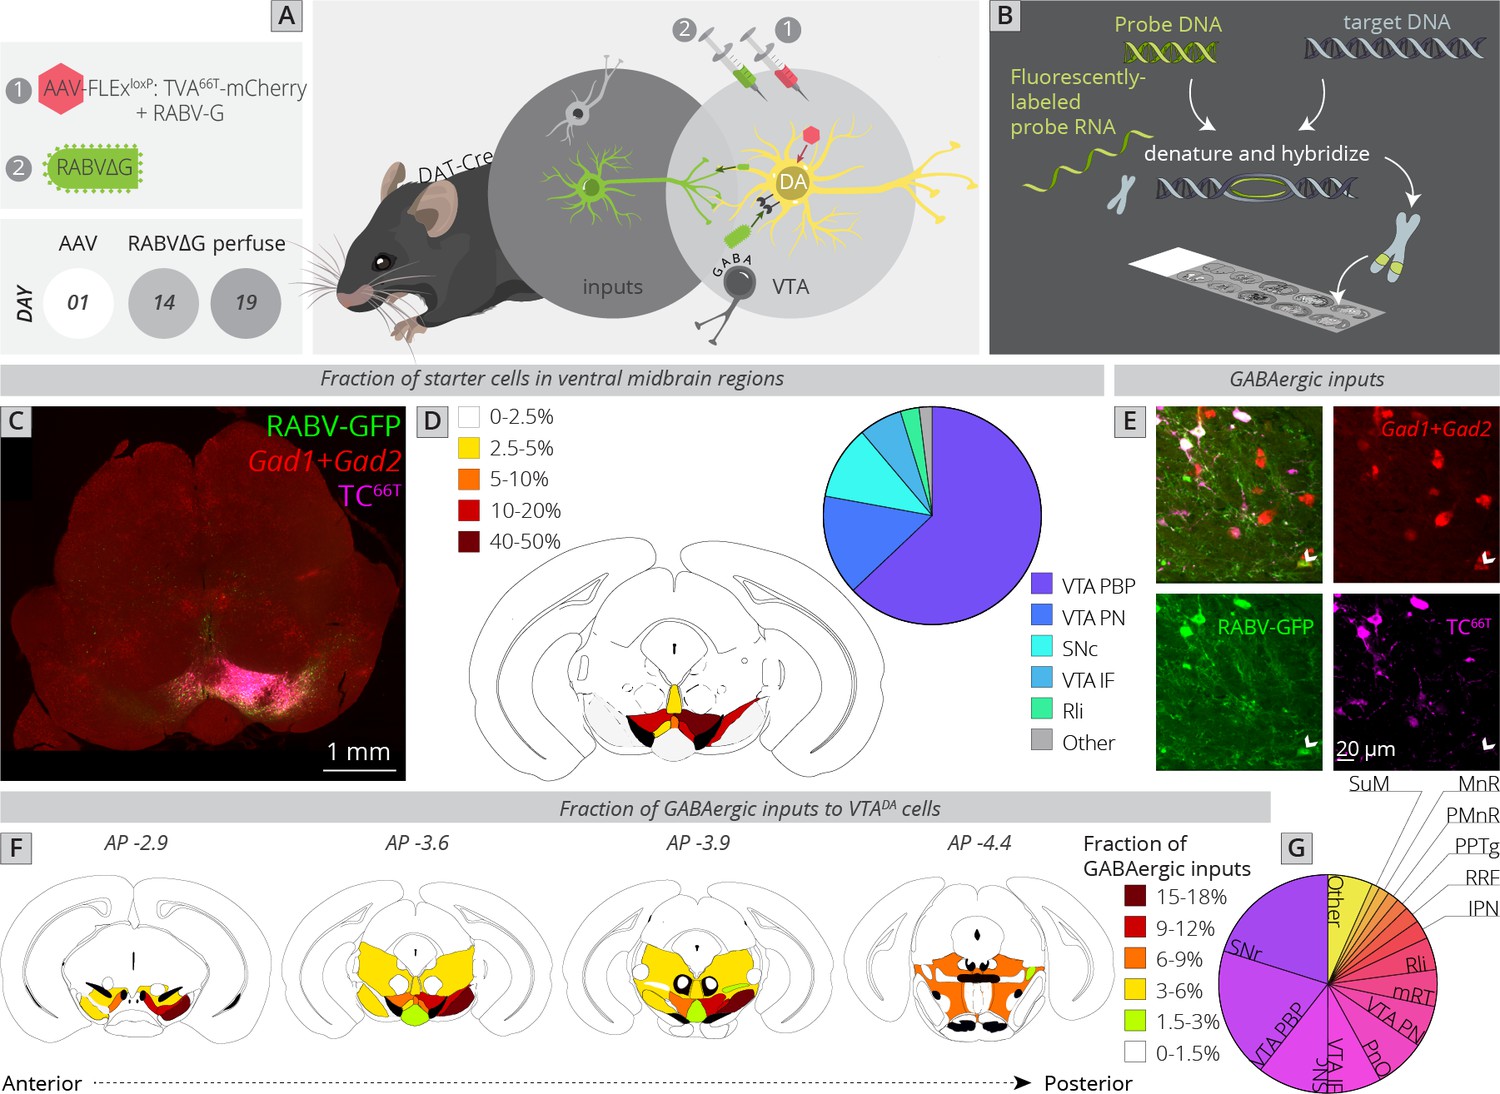
Local and distributed GABAergic inhibition to VTADA cells.
(A) Strategy for viral mapping combined with (B) fluorescent in situ hybridization with probes for GAD1 and GAD2. (C) Sample histology section of the midbrain near the injection site. Green = RABV, red = FISH for GAD1/GAD2, magenta = TC66T. Scale, 1 mm. (D) Breakdown of starter cell location in different midbrain nuclei. 63% ± 1% were located within the parabrachial pigmented nucleus (PBP) of the VTA (15% ± 1% in the VTA PN, 11% ± 2% in the SNc, 6% ± 1% in the VTA IF, 3% ± 1% in the Rli, and 2% ± 0.3% in all other regions). (E) Example histology image of labeled cells, with the arrowhead pointing to a RABV+, GAD1/GAD2+, TC66T− cell. Scale, 50 µM (F) Schematic heatmap of GABAergic input location throughout the ventral midbrain. Colors correspond to the total % of local GABAergic inputs located in that particular region. Data from each hemisphere are reported separately. The injection occurred in the right hemisphere. (G) Pie chart representing the total fraction of GABAergic inputs located in each region. Data from both hemispheres are combined. 20.1% ± 1.4% of all inhibitory inputs are from the SNr, 19.3% ± 0.7% from the VTA PBP, SNc 10.5% ± 2.4%, VTA IF 8.0 ± 2.6, VTA PN 6.2 ± 0.6, PnO 7.5% ± 2.4%, mRT 5.5% ± 1.3%, Rli 4.8 ± 0.5, IPN 2.8 ± 1.8, RRF 2.5% ± 1.1%, PPTg 1.8% ± 0.8%, PMnR 1.6% ± 0.3%, MnR 1.2% ± 1.2%, SuM 1.2 ± 0.2, and 6.6 ± 0.8 in all other regions.
Figure 5
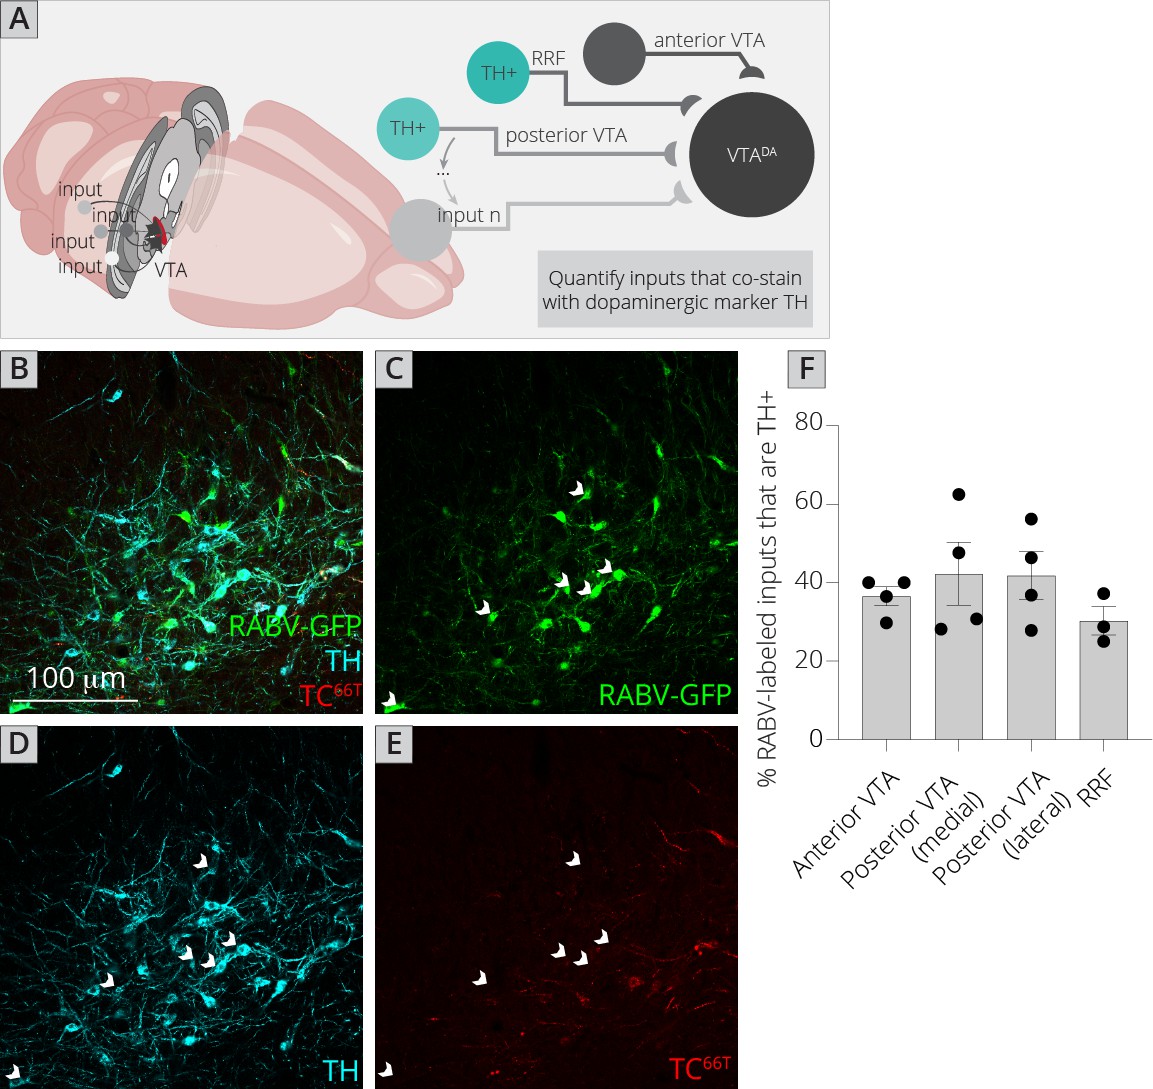
Connections between DA cells in the ventral midbrain.
(A) Schematic of experiments for assessing potential DA–DA connections. Brain sections were stained for TH and mCherry and local inputs in the A8 (RRF) and A10 (VTA) regions were assessed for colabeling with TH and mCherry. Cells that were GFP+, TH+, and mCherry− were considered DAergic inputs. (B–E) Example histology image of labeled cells in the RRF. Green = GFP, cyan = TH, red = mCherry. Scale, 100 μm. White arrows indicate RABV+/TH+/mCherry− cells. (F) Quantification of TH+ inputs in four different midbrain regions.
Figure 6
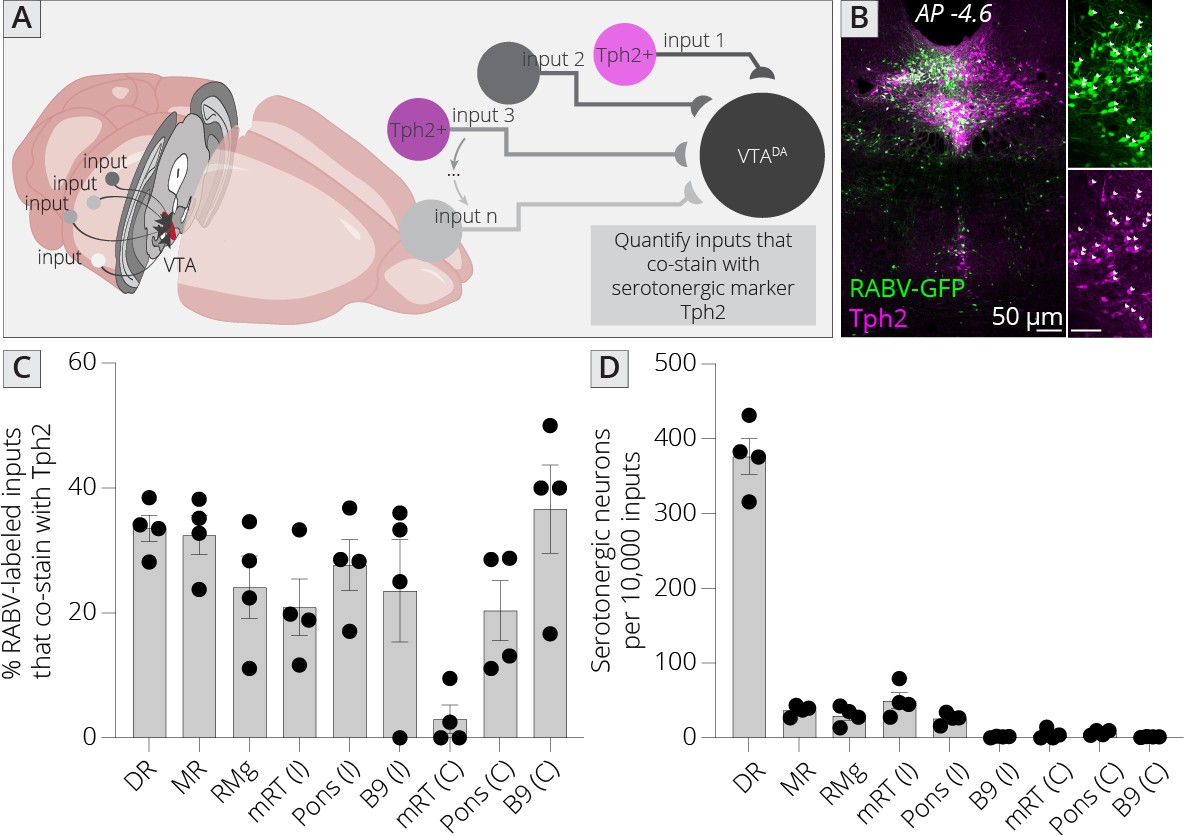
Identifying location of serotonergic inputs to VTADA cells.
(A) Schematic of experiments for assessing potential serotonergic inputs. Brain sections were stained for Tph2, and inputs in the B3, B5, B6, B8, and B9 regions were assessed for colabeling with Tph2. Cells that were GFP+ and Tph2+ were considered serotonergic inputs. (B) Example histology image of labeled cells in the midbrain. Green = GFP, magenta = Tph2. Scale, 50 μm. (C) Percentage of RABV-labeled inputs in each region that costained with Tph2. (D) The number of serotonergic inputs in each quantified region, normalized to 10,000 RABV-labeled inputs. I = ipsilateral, C = contralateral to injection side.
Tables
Key resources table
| Reagent type (species) or resource | Designation | Source or reference | Identifiers | Additional information |
|---|---|---|---|---|
| Genetic reagent (M. musculus) | Mouse B6.SJL-Slc6a3tm1.1(cre)Bkmn/J (DAT-Cre) | The Jackson Laboratory | RRID:IMSR_JAX:006660 | |
| Antibody | Anti-GFP (chicken polyclonal) | Aves Labs | Cat#: GFP-1020 (RRID:AB_10000240) | IF (1:1000) |
| Antibody | Anti-TH (rabbit polyclonal) | Millipore | Cat#: AB152 (RRID:AB_390204) | IF (1:1000) |
| Antibody | Anti-mCherry (rat monoclonal) | Thermo Fisher | Cat#: M11217 (RRID:AB_2536611) | IF (1:2000) |
| Antibody | Anti-Tph2 (rabbit polyclonal) | Novus Biologicals | Cat#: NB100-74555 (RRID:AB_2202792 ) | IF (1:1000) |
| Antibody | Anti-chicken AlexaFluor 488 (donkey polyclonal) | Jackson ImmunoResearch | Cat#: 703-545-155 (RRID:AB_2340375) | IF (1:500) |
| Antibody | Anti-rat AlexaFluor 555 (donkey polyclonal) | Jackson ImmunoResearch | Cat#: 712-165-153 (RRID:AB_2340667 ) | IF (1:500) |
| Antibody | Anti-rabbit AlexaFluor 647 (donkey polyclonal) | Jackson ImmunoResearch | Cat#: 711-605-152 (RRID:AB_2492288) | IF (1:500) |
| Sequence-based reagent | Gad1 probe | Weissbourd et al., 2014 | ||
| Sequence-based reagent | Gad2 probe | Weissbourd et al., 2014 | ||
| Software, algorithm | Prism 9 | GraphPad, https://www.graphpad.com/scientific-software/prism/ | ||
| Software, algorithm | Fiji | https://imagej.net/software/fiji/?Downloads | ||
| Software, algorithm | Python 3.8 | https://www.python.org/downloads/release/python-380/ | ||
| Other | AAV2-CAG-FLExloxP- TC66T | University of North Carolina, vector core | Adeno-associated virus, titer: 2.6 × 10¹² genome copies (gc)/ml | |
| Other | AAV8-CAG-FLExloxP-RABV-G | University of North Carolina, vector core | Adeno-associated virus, titer: 1.3 × 10¹² gc/ml; | |
| Other | RABVΔG | Made in lab | Rabies virus, titer: 5.0 × 10⁸ colony-forming units (cfu)/ml |
Additional files
Download links
A two-part list of links to download the article, or parts of the article, in various formats.
Downloads (link to download the article as PDF)
Open citations (links to open the citations from this article in various online reference manager services)
Cite this article (links to download the citations from this article in formats compatible with various reference manager tools)
Modified viral-genetic mapping reveals local and global connectivity relationships of ventral tegmental area dopamine cells
eLife 11:e76886.
https://doi.org/10.7554/eLife.76886


