Distinct responses to rare codons in select Drosophila tissues
- Department of Cell Biology, Duke University, United States
- Department of Pharmacology and Cancer Biology, Duke University, United States
- Department of Biology, University of North Carolina at Chapel Hill, United States
Figures
Figure 1 with 2 supplements

Strictly defined limits on rare codon usage regulate gene expression.
(A) Top- schematic of each indicated reporter. Bottom- heat map indicating codon usage across each reporter coding sequence. Color key indicates codon usage along the length of the coding sequence. (B–Q) Representative fluorescent images taken under identical camera exposure settings of live male wandering third instar larvae (WL3) containing stable genomic insertions of the indicated GFP reporter. Scalebars are 1 mm. Yellow dashed outlines highlight the larvae in images where no GFP signal was apparent. (R) Western blot protein quantifications of indicated reporters normalized to total protein stain then plotted as percentages relative to GFP0D for whole third instar larvae (two replicates, N=5 each, plotting individual data points and mean ± SEM). Reporters listed in descending order by Codon Adaptation Index (CAI). See Figure 1—figure supplement 1 for blot images. (S) mRNA abundances of the indicated reporters normalized as percentages relative to GFP0D for whole third instar larvae (two replicates, N=5 each, plotting individual data points and mean ± SEM). (T) Histogram of CAI values for each transcript in the Drosophila melanogaster genome. Reporter CAI values are indicated with dotted lines. Full range of endogenous genes highlighted in light gray box.
Figure 1—figure supplement 1
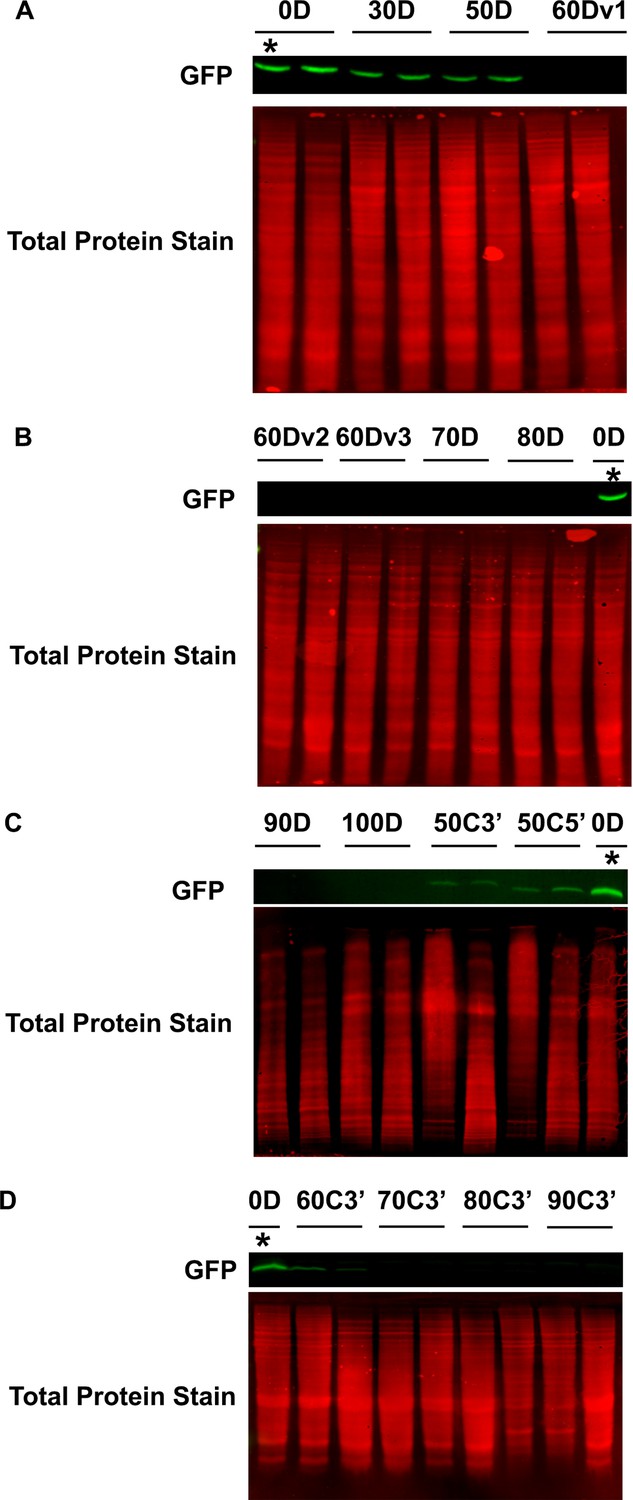
Western blots of whole wandering third instar larvae (WL3).
(A–D) Western blots of whole larvae with stable genomic insertions of the indicated reporters, performed in duplicate. Detected GFP signal is indicated by green bands. Total protein stain for each lane is displayed in red directly below the GFP signal bands. *indicates the same GFP0D lysate loaded in each gel for between gels comparisons. We note that the blot in panel C was not loaded evenly and the gel ran sub-optimally, and that this is a caveat to interpretations of protein abundance for reporters GFP90D, GFP100D, GFP50C3’, and GFP50C5’.
-
Figure 1—figure supplement 1—source data 1
Raw data file and associated PDF figure of uncropped blot presented in Figure 1—figure supplement 1A,B and quantified in Figure 1R.
Blot image was taken in the 800 nm channel and indicates the signal from anti-GFP antibody recognizing transgenic reporter derived GFP protein. Ladder is LI-COR Chameleon Duo pre-stained protein ladder.
- https://cdn.elifesciences.org/articles/76893/elife-76893-fig1-figsupp1-data1-v2.zip
-
Figure 1—figure supplement 1—source data 2
Raw data file and associated PDF figure of uncropped blot presented in Figure 1—figure supplement 1A,B and quantified in Figure 1R.
Blot image was taken in the 700 nm channel and indicates the total protein stain obtained using the LI-COR Revert700 Total Protein Stain kit. Ladder is LI-COR Chameleon Duo pre-stained protein ladder.
- https://cdn.elifesciences.org/articles/76893/elife-76893-fig1-figsupp1-data2-v2.zip
-
Figure 1—figure supplement 1—source data 3
Raw data file and associated PDF figure of uncropped blot presented in Figure 1—figure supplement 1C and quantified in Figure 1R.
Blot image was taken in the 800 nm channel and indicates the signal from anti-GFP antibody recognizing transgenic reporter derived GFP protein. Ladder is LI-COR Chameleon Duo pre-stained protein ladder.
- https://cdn.elifesciences.org/articles/76893/elife-76893-fig1-figsupp1-data3-v2.zip
-
Figure 1—figure supplement 1—source data 4
Raw data file and associated PDF figure of uncropped blot presented in Figure 1—figure supplement 1C and quantified in Figure 1R.
Blot image was taken in the 700 nm channel and indicates the total protein stain obtained using the LI-COR Revert700 Total Protein Stain kit. Ladder is LI-COR Chameleon Duo pre-stained protein ladder.
- https://cdn.elifesciences.org/articles/76893/elife-76893-fig1-figsupp1-data4-v2.zip
-
Figure 1—figure supplement 1—source data 5
Raw data file and associated PDF figure of uncropped blot presented in Figure 1—figure supplement 1D and quantified in Figure 1R.
Blot image was taken in the 800 nm channel and indicates the signal from anti-GFP antibody recognizing transgenic reporter derived GFP protein. Ladder is LI-COR Chameleon Duo pre-stained protein ladder.
- https://cdn.elifesciences.org/articles/76893/elife-76893-fig1-figsupp1-data5-v2.zip
-
Figure 1—figure supplement 1—source data 6
Raw data file and associated PDF figure of uncropped blot presented in Figure 1—figure supplement 1D and quantified in Figure 1R.
Blot image was taken in the 700 nm channel and indicates the total protein stain obtained using the LI-COR Revert700 Total Protein Stain kit. Ladder is LI-COR Chameleon Duo pre-stained protein ladder.
- https://cdn.elifesciences.org/articles/76893/elife-76893-fig1-figsupp1-data6-v2.zip
Figure 1—figure supplement 2
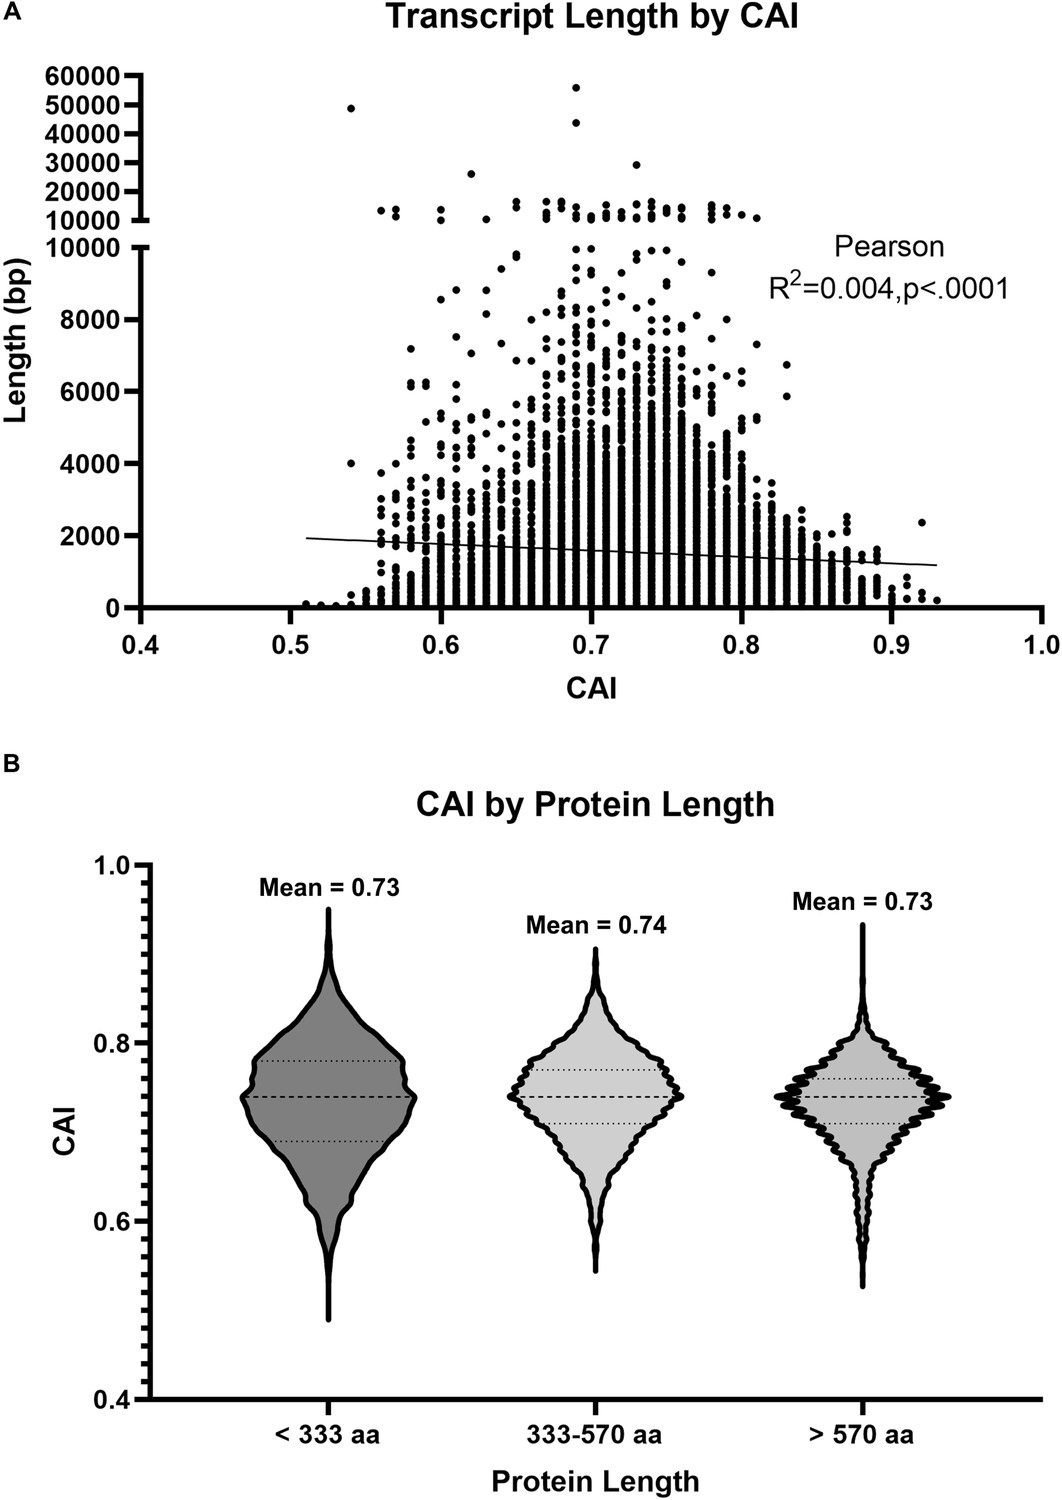
Codon Adaptation Index (CAI) is not correlated with gene length.
(A) Scatterplot depicting transcript length as a function of CAI. Each dot represents a single Drosophila transcript. Line represent Pearson’s linear correlation (R2=0.004, p<0.0001). (B) Violin plots depicting the spread of CAI values for protein coding sequences encoding proteins of the indicated size. The size ranges analyzed were chosen for consistency with a previous analysis by Duret and Mouchiroud, 1999.
Figure 2 with 1 supplement
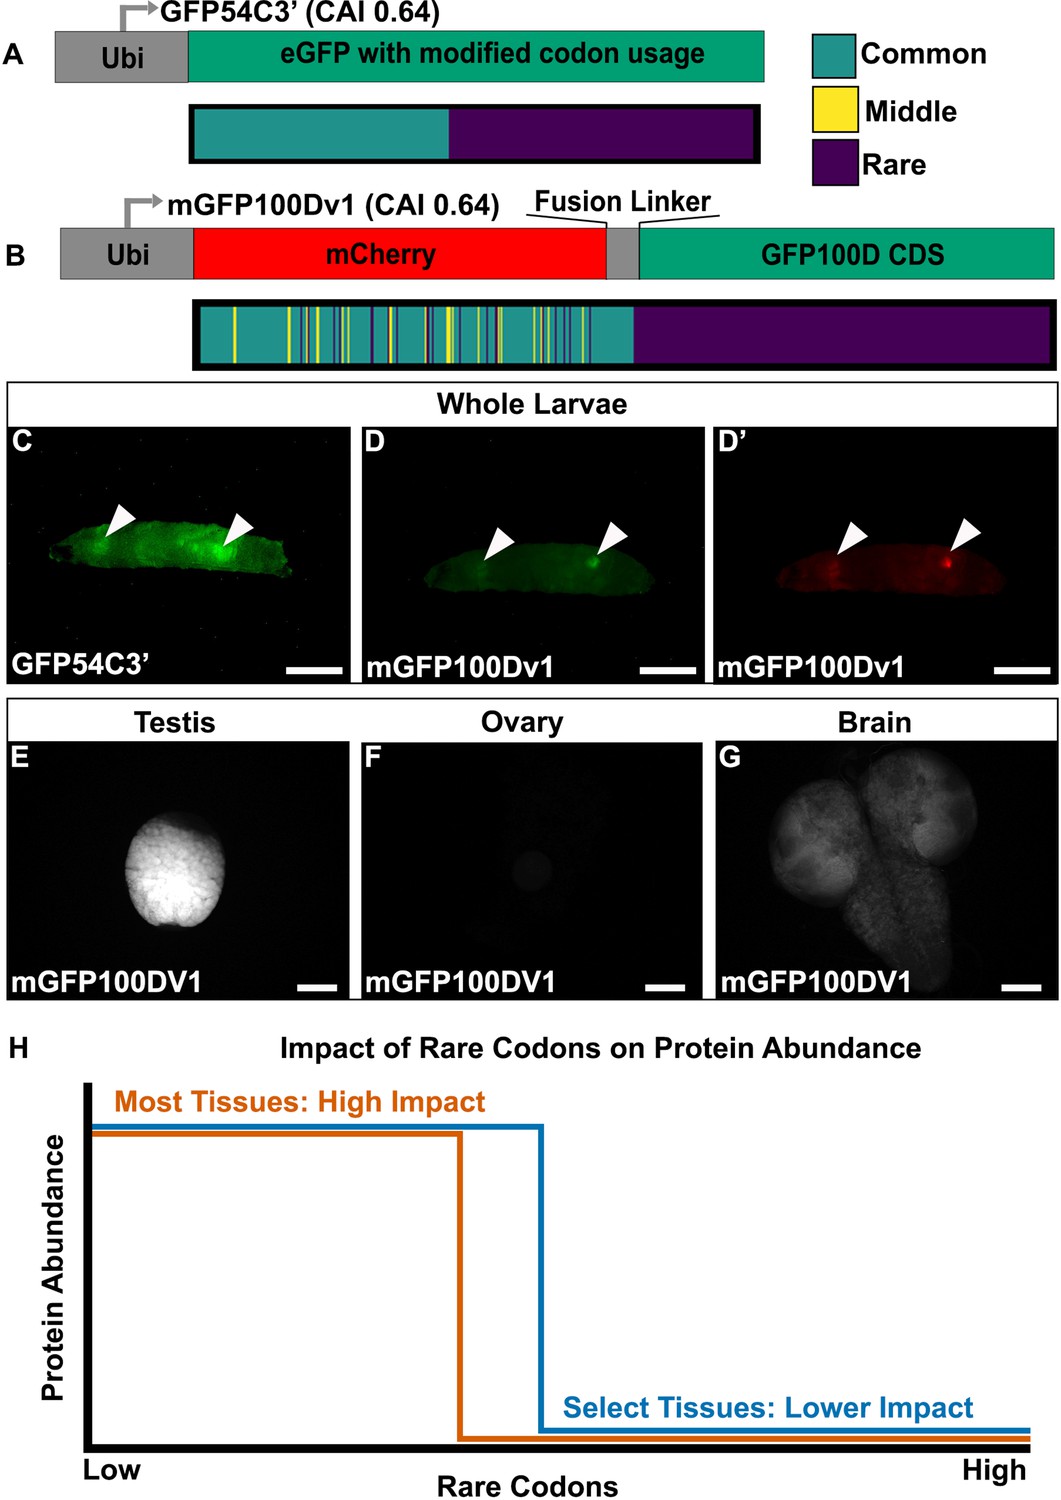
Tissues exhibit distinct responses to rare codons.
(A) Top- reporter design and Bottom- codon usage (see key) along the CDS of GFP54C3’. CAI for GFP54C3’ indicated in parentheses. (B) Top- reporter design and Bottom- codon usage along the CDS of mGFP100Dv1 (see key in panel A). CAI for mGFP100Dv1 indicated in parentheses. (C) Representative fluorescent images of live male wandering third instar larvae (WL3) with stable genomic insertion of GFP54C3’. (D) Representative fluorescent image of live male WL3 larva with stable genomic insertion of mGFP100Dv1 taken at GFP excitation wavelength. (D’) Representative fluorescent image of live male WL3 larva with stable genomic insertion of mGFP100Dv1 taken at mCherry excitation wavelength. Scalebars for (C–D)’ are 1 mm. (E–G) Representative fluorescent images of dissected mGFP100Dv1 larval tissues. Images are taken under identical conditions with fluorescence intensity normalized to testis. Scalebars for (E–G) are 100 µm. (H) Conceptual depiction of tissue-specific differences in rare codon tolerance, as revealed by our reporters. As rare codons increase (moving to the right on the x-axis), protein abundance (y-axis) undergoes a cliff-like decline. However, the point at which select tissues hit the edge of the cliff is distinct.
Figure 2—figure supplement 1
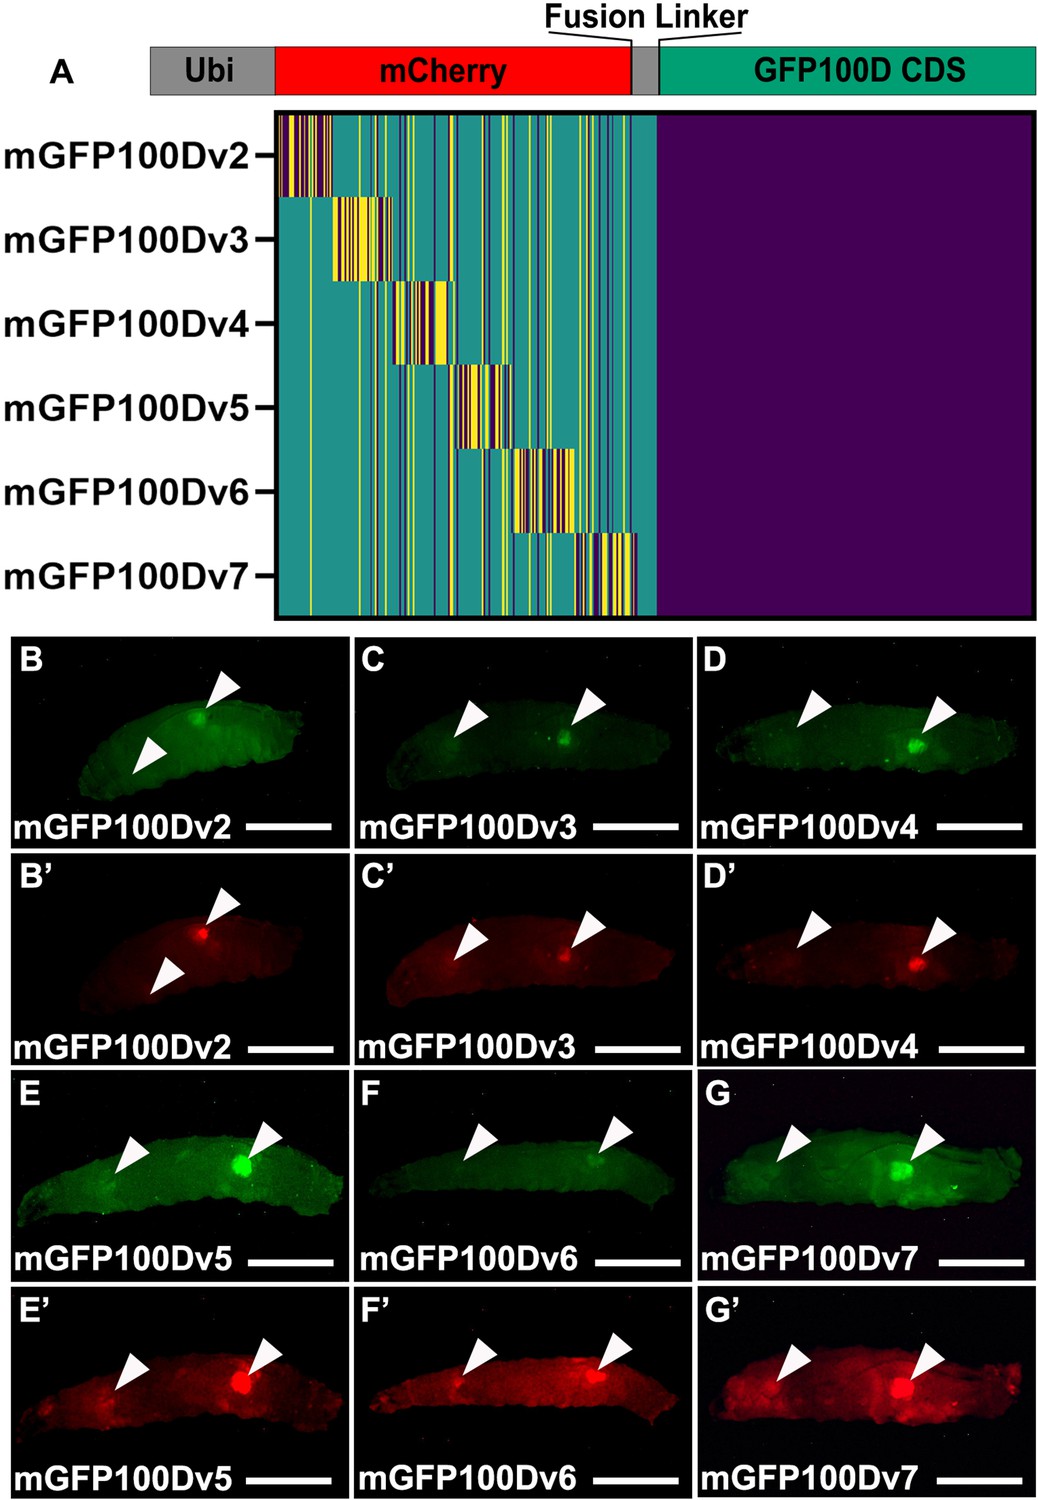
Tissue-specific rescue of GFP100D is not dependent on mCherry or linker sequence.
(A) Schematic of each indicated reporter. Heat map color scheme as in Figure 2A. (B–G) Fluorescent images taken in the GFP excitation channel of live male wandering third instar larvae (WL3) with stable genomic insertions of the indicated reporter. (B’–G’) Fluorescent images taken in the mCherry excitation channel of live male WL3 larva with stable genomic insertions of the indicated reporter. Arrowheads indicate tissues that robustly produce the fluorescent reporter. Scalebars are approximately 1 mm.
Figure 3 with 4 supplements
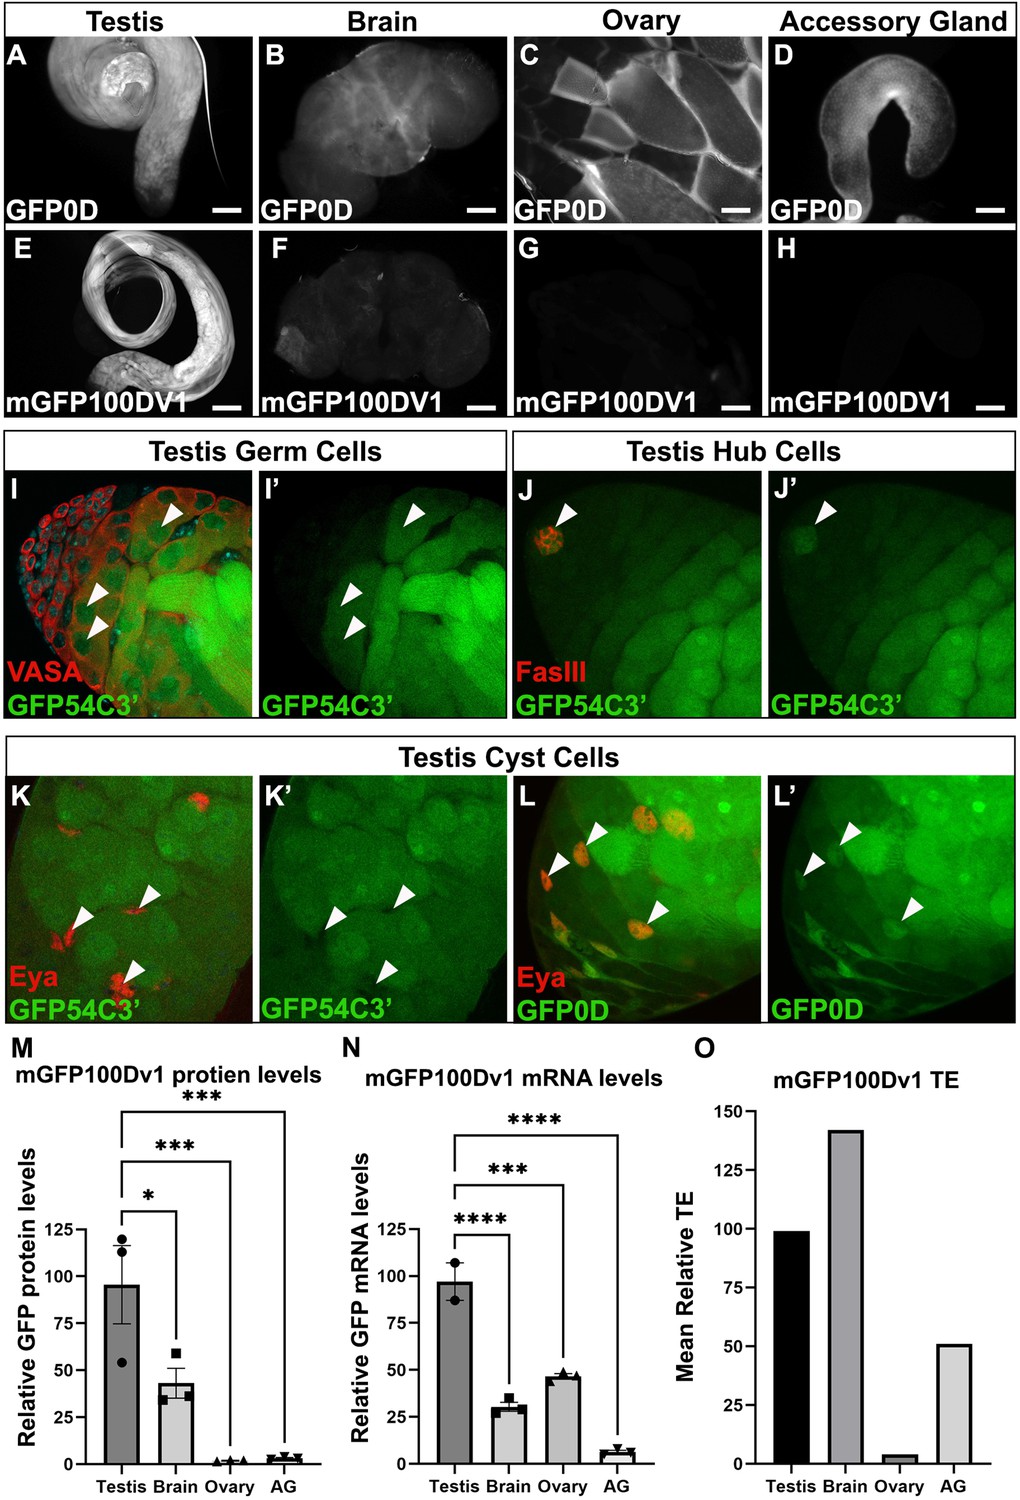
The adult testis and brain robustly express rare codon-enriched reporters.
(A–D) Representative fluorescent images of dissected GFP0D adult tissues. Images are taken under identical conditions with fluorescence intensity normalized to testis. (E–H) Representative fluorescent images of dissected mGFP100Dv1 adult tissues. Images are taken under identical conditions with fluorescence intensity normalized to testis. (I–L’) Confocal images of adult GFP54C3’ testis immunostained with antibodies recognizing the indicated cell types. Arrowheads indicate cells of interest, I, I’ = germ cells, J, J’=hub, K, K’=somatic cyst cells. Right image in each pair shows the GFP only channel from the left image in the pair. (L’L’) Confocal image of adult GFP0D testis immunostained with Eya. Arrowheads = somatic cyst cells. (L’) GFP only channel of image in (L) (M) mGFP100Dv1 protein abundance in dissected adult tissues measured by western blot and plotted as a percentage relative to GFP0D (three replicates, N=10–12 animals each, plotting mean ± SEM, Dunnett’s multiple comparison to testis, *p<0.05, ***p≤0.001). See Figure 3—figure supplement 1 for representative blot image. (N) Steady state mRNA levels for heterozygous mGFP100Dv1/GFP0D expressing animals measured by Quantitative Real-Time PCR (qRT-PCR). mGFP100Dv1 mRNA levels are plotted as a percentage relative to GFP0D within each tissue. (2–3 replicates, N=10 animals each, plotting mean ± SEM, Dunnett’s multiple comparison to testis, ***p=0.0001,****p<0.0001). (O) Translation efficiency of mGFP100Dv1 in each tissue plotted as a percentage relative to GFP0D, plotting mean value. See Methods for details. Scalebars are 100 µm. AG = accessory gland.
Figure 3—figure supplement 1
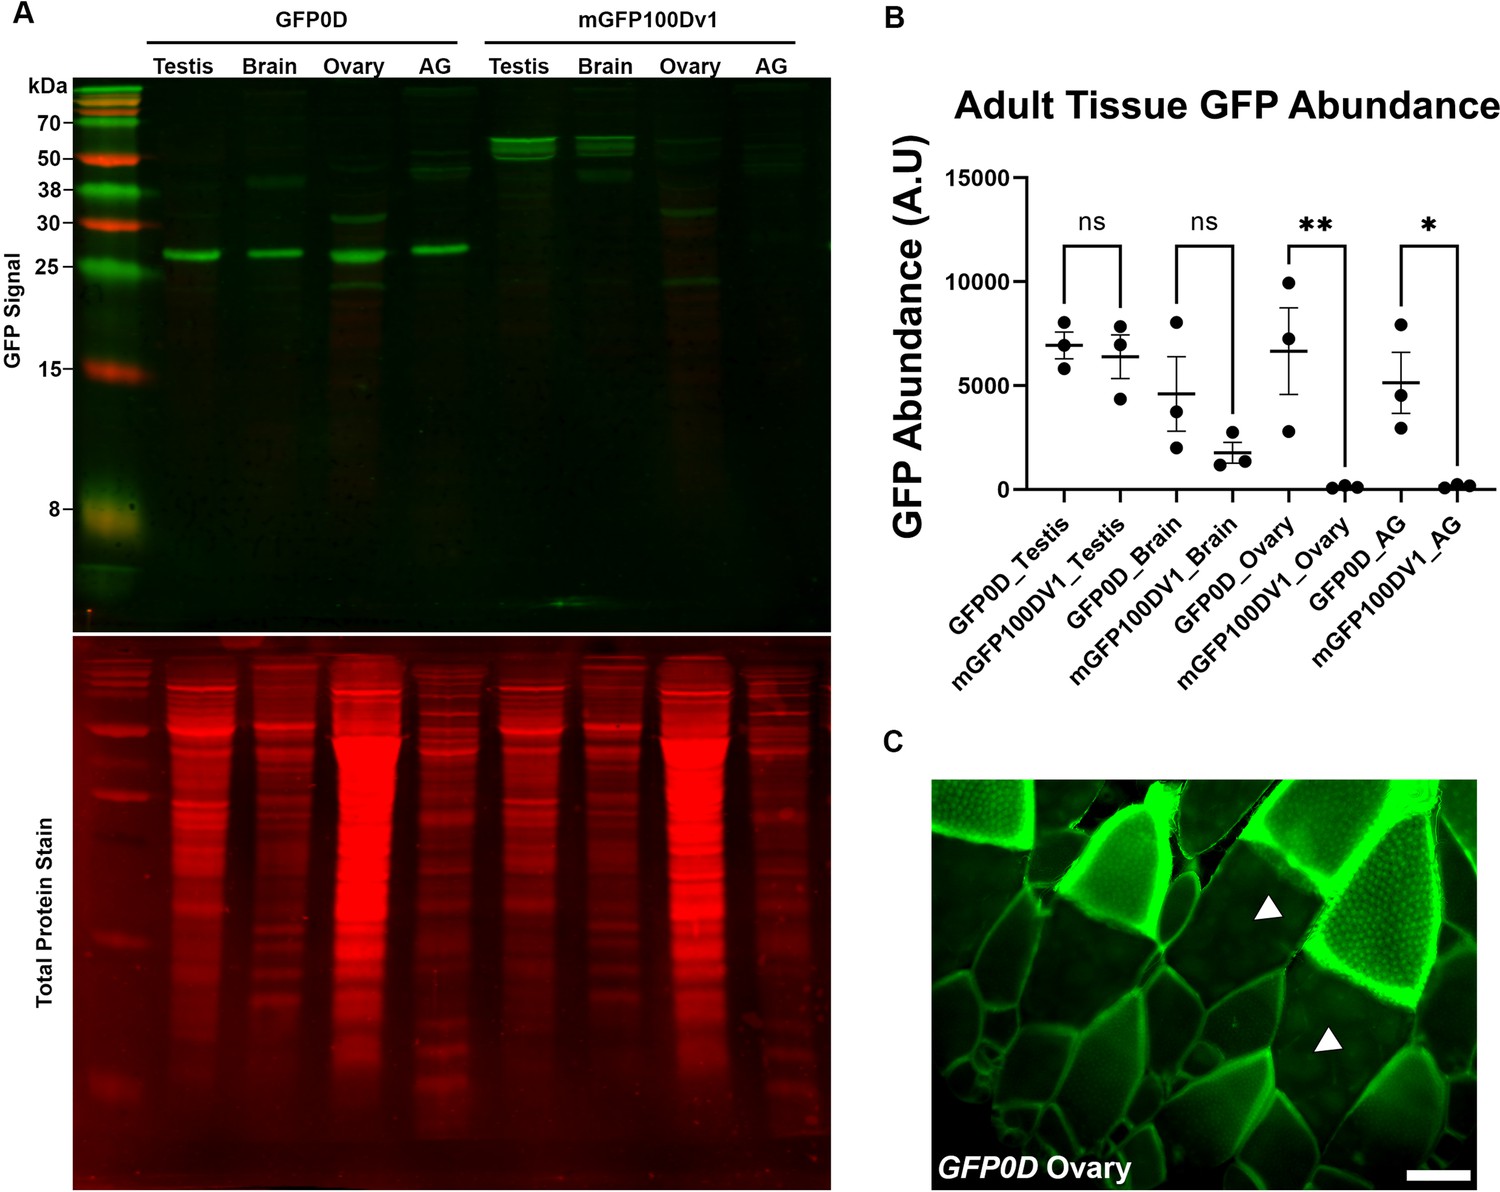
Western blot for adult tissues.
(A) Representative western blot for dissected adult tissues (N=10–12 per tissue, 10–12 pairs for testis, ovary, and accessory gland (AG)), three replicates performed in total, quantified using alternative methods in Figure 3M and in panel (B). GFP signal is indicated by green bands. For GFP0D the prominent band around 27 kDa was quantified. For mGFP100Dv1, the three closely adjacent bands around 55 kDa were quantified. These bands may represent post-translational modifications to mGFP100Dv1 as they are not detected in GFP0D animals, indicating that they are unlikely to be non-specific. We note the presence of a non-specific band detected in brains of both GFP0D and mGFP100Dv1 animals around 38 kDa, and two non-specific bands detected in ovary of both GFP0D and mGFP100Dv1 animals around 20 kDa and 30 kDa respectively. We believe these bands to be non-specific given that mGFP100Dv1 protein is twice as large as GFP0D, yet the bands are of identical size, rendering it highly unlikely that these bands represent reporter-derived protein products. Total protein stain for each lane is displayed in red directly below the GFP channel image. (B) Quantitation of GFP protein abundance in dissected adult tissues measured by western blot for GFP0D and mGFP100Dv1 animals normalized to total protein stain (three replicates, N=10–12 animals each, plotting mean ± SEM, Bonferroni-Šídák, ns = p>0.05, *p<0.05, **p<0.01). (C) Fluorescent image of an ovary from a GFP0D transgenic animal depicting that GFP0D protein is detectable in the germline at reduced levels relative to the soma. Arrowheads indicate germline cells. Scalebar is 100 µm.
-
Figure 3—figure supplement 1—source data 1
Raw data file and associated PDF figure of uncropped blot presented in Figure 3—figure supplement 1A and quantified in Figure 3—figure supplement 1B and Figure 3M.
Blot image was taken in the 800 nm channel and indicates the signal from anti-GFP antibody recognizing transgenic reporter derived GFP protein. Ladder is LI-COR Chameleon Duo pre-stained protein ladder.
- https://cdn.elifesciences.org/articles/76893/elife-76893-fig3-figsupp1-data1-v2.zip
-
Figure 3—figure supplement 1—source data 2
Raw data file and associated PDF figure of uncropped blot presented in Figure 3—figure supplement 1A and quantified in Figure 3—figure supplement 1B and Figure 3M.
Blot image was taken in the 700 nm channel and indicates the total protein stain obtained using the LI-COR Revert700 Total Protein Stain kit. Ladder is LI-COR Chameleon Duo pre-stained protein ladder.
- https://cdn.elifesciences.org/articles/76893/elife-76893-fig3-figsupp1-data2-v2.zip
-
Figure 3—figure supplement 1—source data 3
Raw data file and associated PDF figure of uncropped blot quantified in Figure 3—figure supplement 1B, and Figure 3M.
Blot image was taken in the 800 nm channel and indicates the signal from anti-GFP antibody recognizing transgenic reporter derived GFP protein. Ladder is LI-COR Chameleon Duo pre-stained protein ladder.
- https://cdn.elifesciences.org/articles/76893/elife-76893-fig3-figsupp1-data3-v2.zip
-
Figure 3—figure supplement 1—source data 4
Raw data file and associated PDF figure of uncropped blot quantified in Figure 3—figure supplement 1B, and Figure 3M.
Blot image was taken in the 700 nm channel and indicates the total protein stain obtained using the LI-COR Revert700 Total Protein Stain kit. Ladder is LI-COR Chameleon Duo pre-stained protein ladder.
- https://cdn.elifesciences.org/articles/76893/elife-76893-fig3-figsupp1-data4-v2.zip
Figure 3—figure supplement 2
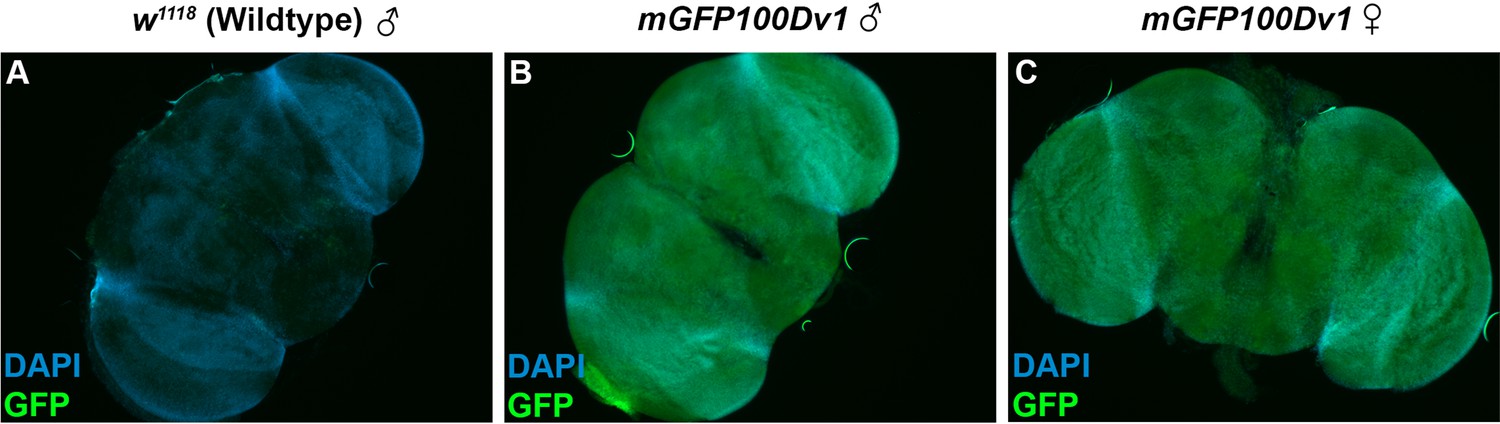
The brains of both sexes robustly express rare codon-enriched reporters.
(A) Fluorescent image of a dissected brain from an adult Drosophila with no transgenic GFP reporter. Image is taken under identical conditions as (B–C) with fluorescence intensity normalized to male mGFP100Dv1 brain. Nuclei are stained with DAPI, indicated in blue. GFP channel signal, indicated in green, represents autofluorescence. (B–C) Fluorescent images of dissected brains from adult Drosophila with stable genomic insertion of mGFP100Dv1. Images are taken under identical conditions with fluorescence intensity normalized to male mGFP100Dv1 brain. Nuclei are stained with DAPI, indicated in blue. GFP channel signal, indicated in green, is from the mGFP100Dv1 reporter.
Figure 3—figure supplement 3
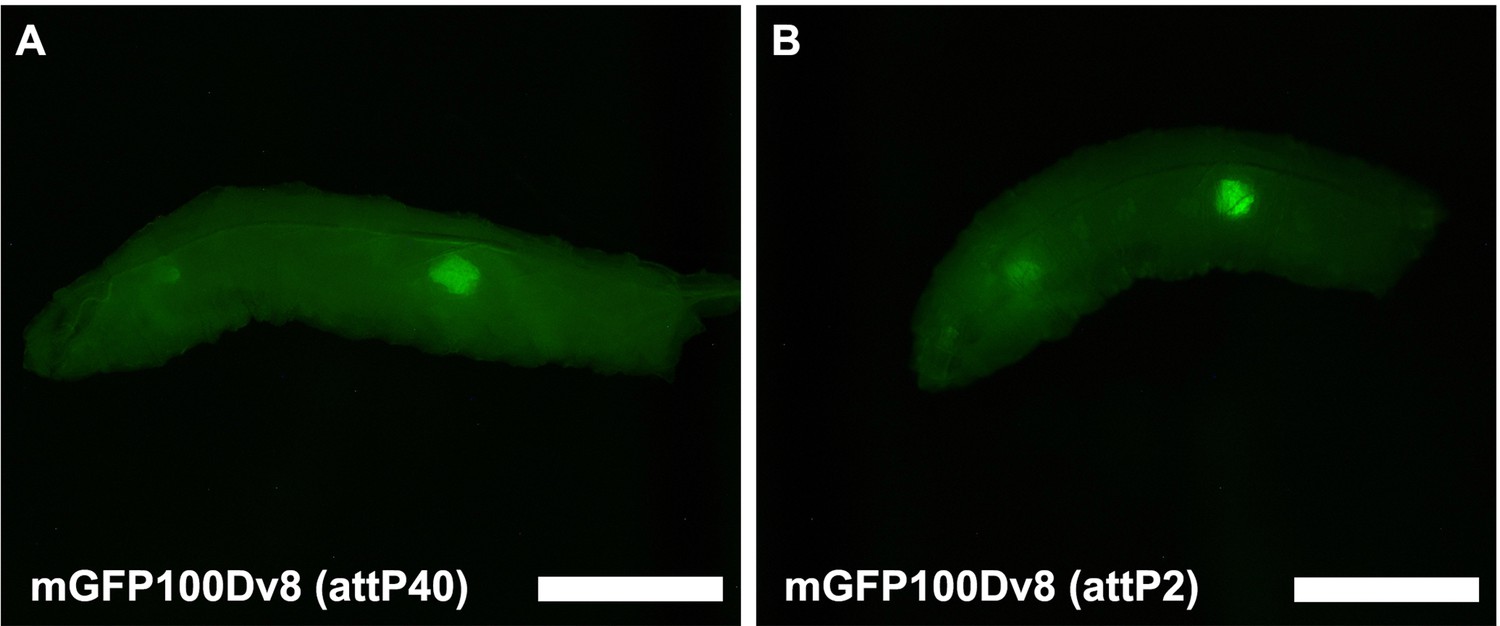
Tissue-specific expression is not dependent on the genomic locus of transgene insertion.
(A) Fluorescent image taken in the GFP excitation channel of a live male wandering third instar larvae (WL3) with stable genomic insertion of mGFP100Dv8 into site attP40 on chromosome II. (B) Fluorescent image taken in the GFP excitation channel of a live male WL3 larva with stable genomic insertion of mGFP100Dv8 into site attP2 on chromosome III. Scalebars are approximately 1 mm.
Figure 3—figure supplement 4
mRNA length from indicated transgenes.
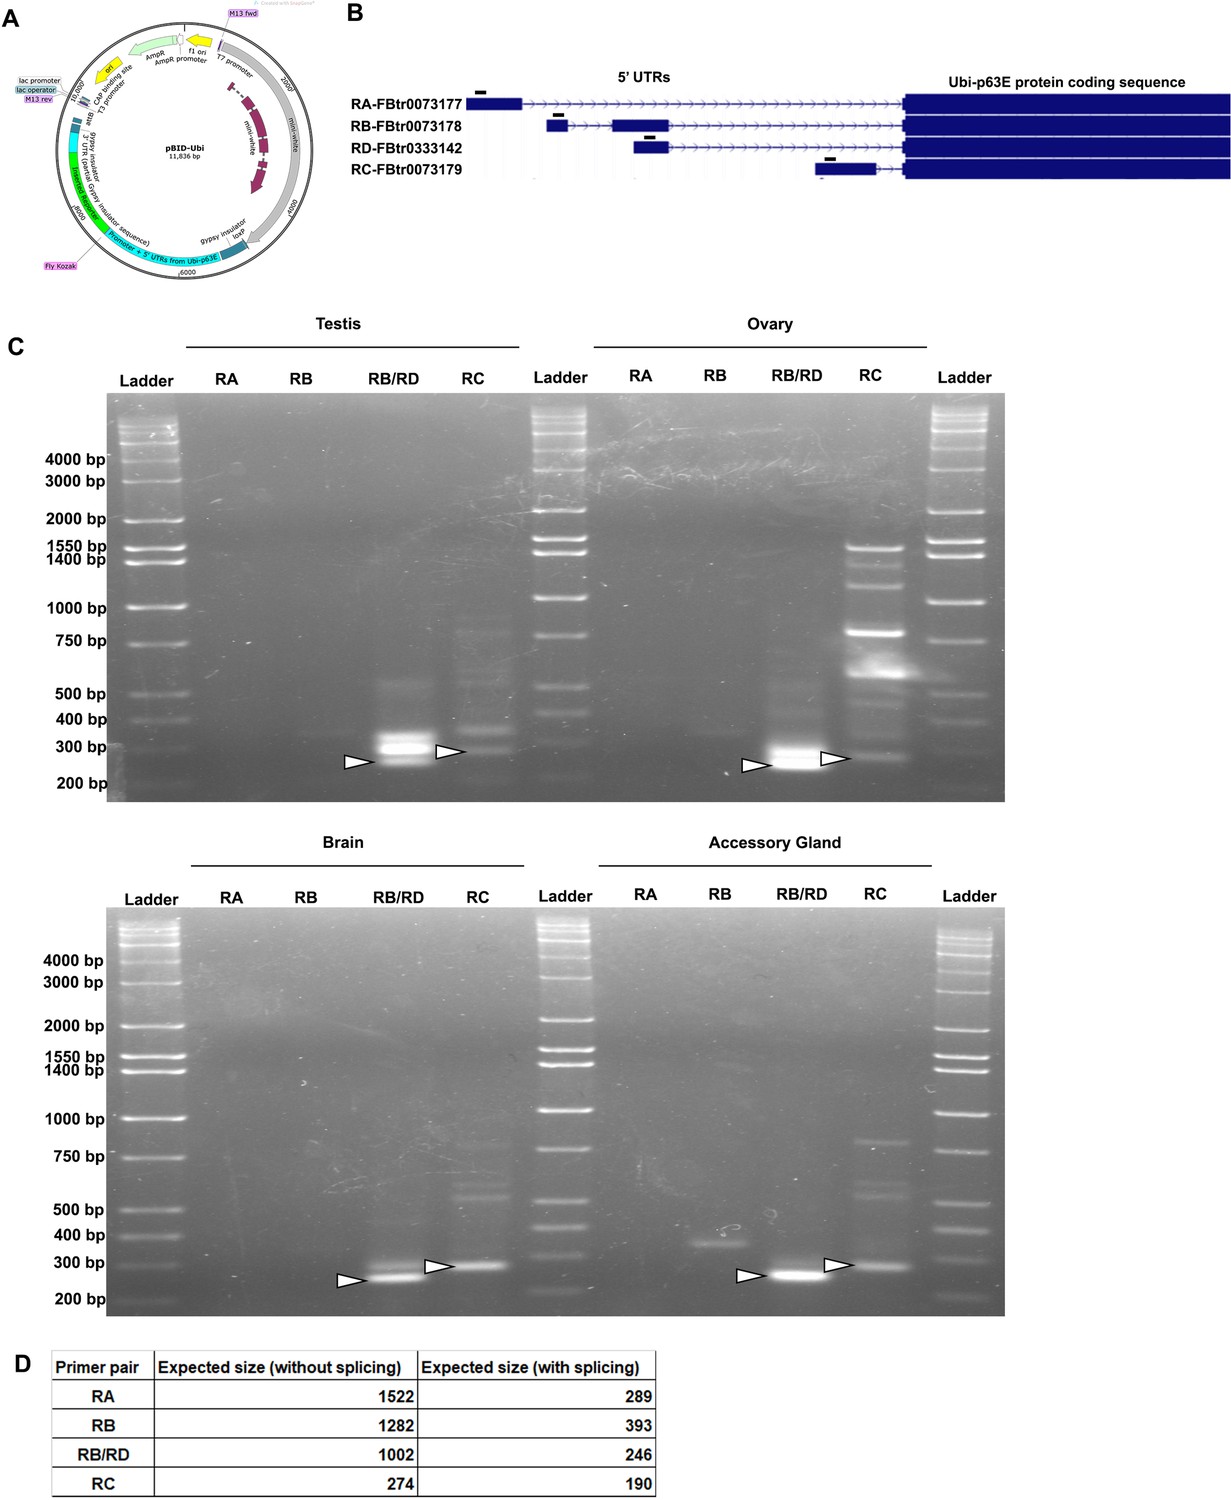
(A) Plasmid map of the pBID-Ubi vector depicting key features. Of note are the Ubi-p63 promoter sequence, which contains the 5’ UTR sequences of the Drosophila Ubi-p63E gene, and the 3’ UTR which consists of a partial Gypsy transposon insulator sequence as determined by 3’ RACE (See Methods). Plasmid map created using SnapGene software (from Insightful Science; available at snapgene.com) (B) UCSC genome browser tracks of the four Drosophila Ubi-p63E transcript isoforms and their respective 5’ UTRs. Black rectangles mark the forward primer binding sites for RT-PCR amplification in panel C. (C) RT-PCR products separated by gel electrophoresis for predicted alternative 5’ UTRs derived from the Ubi-p63E promoter. RT-PCR was performed on cDNA from either testis, ovary, brain, or accessory glands of mGFP100Dv1 animals using isoform-specific forward primers indicated in panel B and a reverse primer in the 5’ end of the mGFP100Dv1 coding sequence. Primer pairs were validated to amplify a single band of expected size from genomic DNA, however, several non-specific bands were detected when performing RT-PCR. Arrowheads indicate bands of interest, which were verified by gel extraction and sequencing for testis and ovary. Importantly, bands of interest do not differ between tissues. Of note, the prominent non-specific band detected by the RB/RD isoform-specific primer in both testis and ovary, which is only slightly larger than the band of expected size, lacks significant homology with our mGFP100Dv1 reporter and shares 98% identity with the Drosophila endogenous transcript for the gene belphegor. We also note that the RB/RD specific primer yielded a band of the expected size, whereas the RB specific primer yielded no bands of expected size, suggesting that the band in the RB/RD lane is predominantly derived from isoform RD. (D) Table of expected RT-PCR band sizes with or without splicing of introns. Note that only the spliced band size is detected for isoform RD and only the unspliced band size is detected for isoform RC. Impaired splicing of isoform RC is likely due to the presence of a sequencing-verified T>A SNP in the 5’ GT splice signature of the intron.
Figure 4 with 3 supplements

Endogenous testis genes are enriched in rare codons.
(A) issue-apparent CAI (taCAI) for Drosophila melanogaster tissues from FlyAtlas2. All tissues analyzed are from adult male animals except the ovary, which is from adult females. Whole ORFeome is plotted as a reference using organismal codon usage frequencies from the Kazusa codon usage database. (B) taCAI for human tissues from the Human Protein Atlas. Whole ORFeome is plotted as a reference using organismal codon usage frequencies from the Kazusa codon usage database.
Figure 4—figure supplement 1
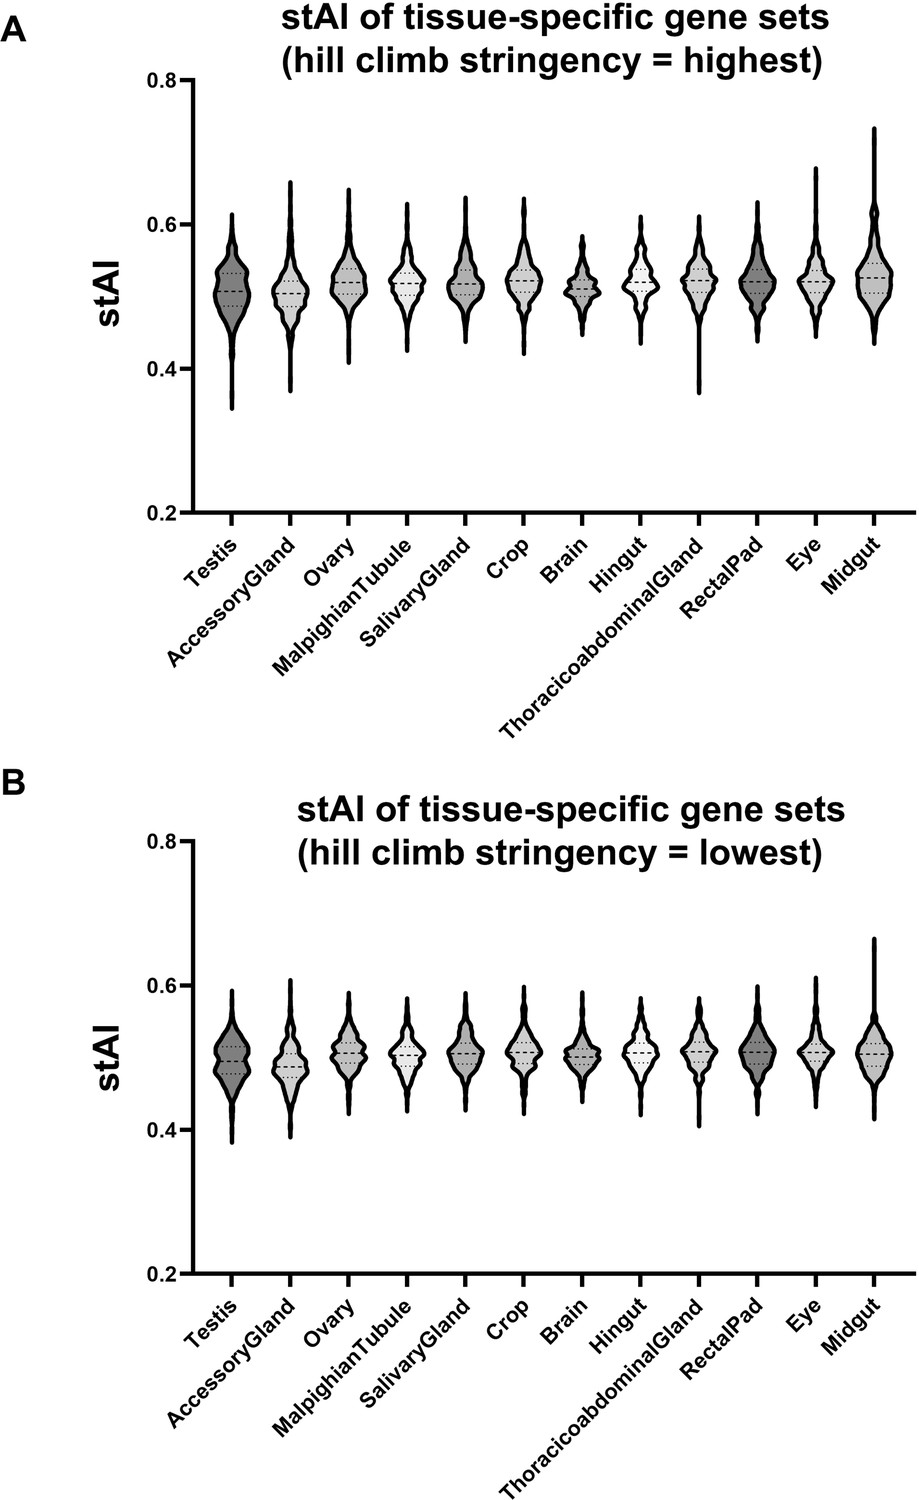
Pre-existing species-specific tRNA Adaptation Index (stAI) metric does not capture tissue-specific differences in codon usage.
(A) Violin plots illustrating stAI values of the Drosophila tissue-specific gene sets identified in Figure 4. stAI was calculated using the standalone stAIcalc software package (Sabi et al., 2010) with the maximum hill climb stringency setting. (B) Same analysis as in panel A, but using the minimum hill climb stringency setting.
Figure 4—figure supplement 2
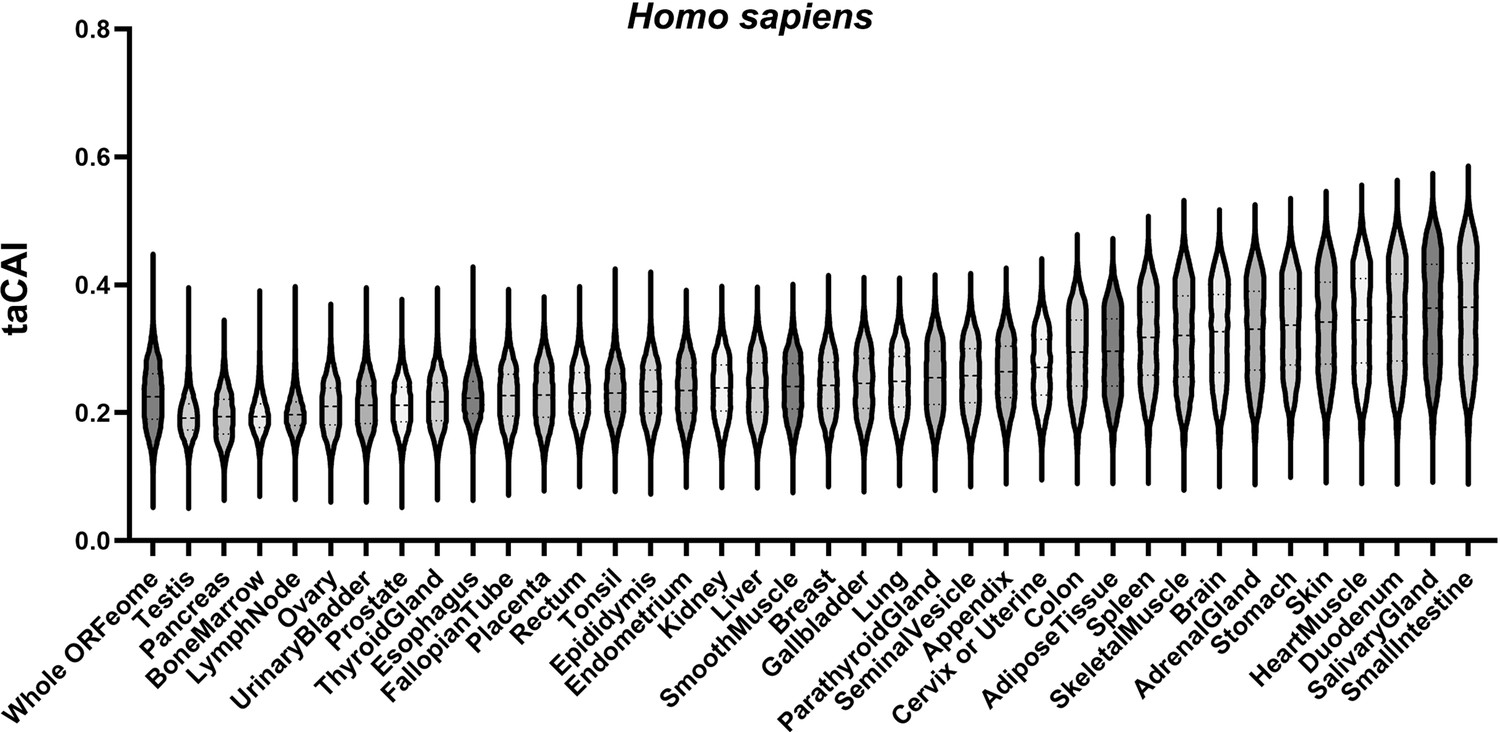
Human tissue-apparent CAI (taCAI) using identical cutoffs as fly.
taCAI for human tissues from the Human Protein Atlas. Whole ORFeome is plotted as a reference using organismal codon usage frequencies from the Kazusa codon usage database. The criteria for determining tissue-specific gene sets here are identical to the criteria for determining tissue-specific gene sets in Drosophila melanogaster (see Methods).
Figure 4—figure supplement 3
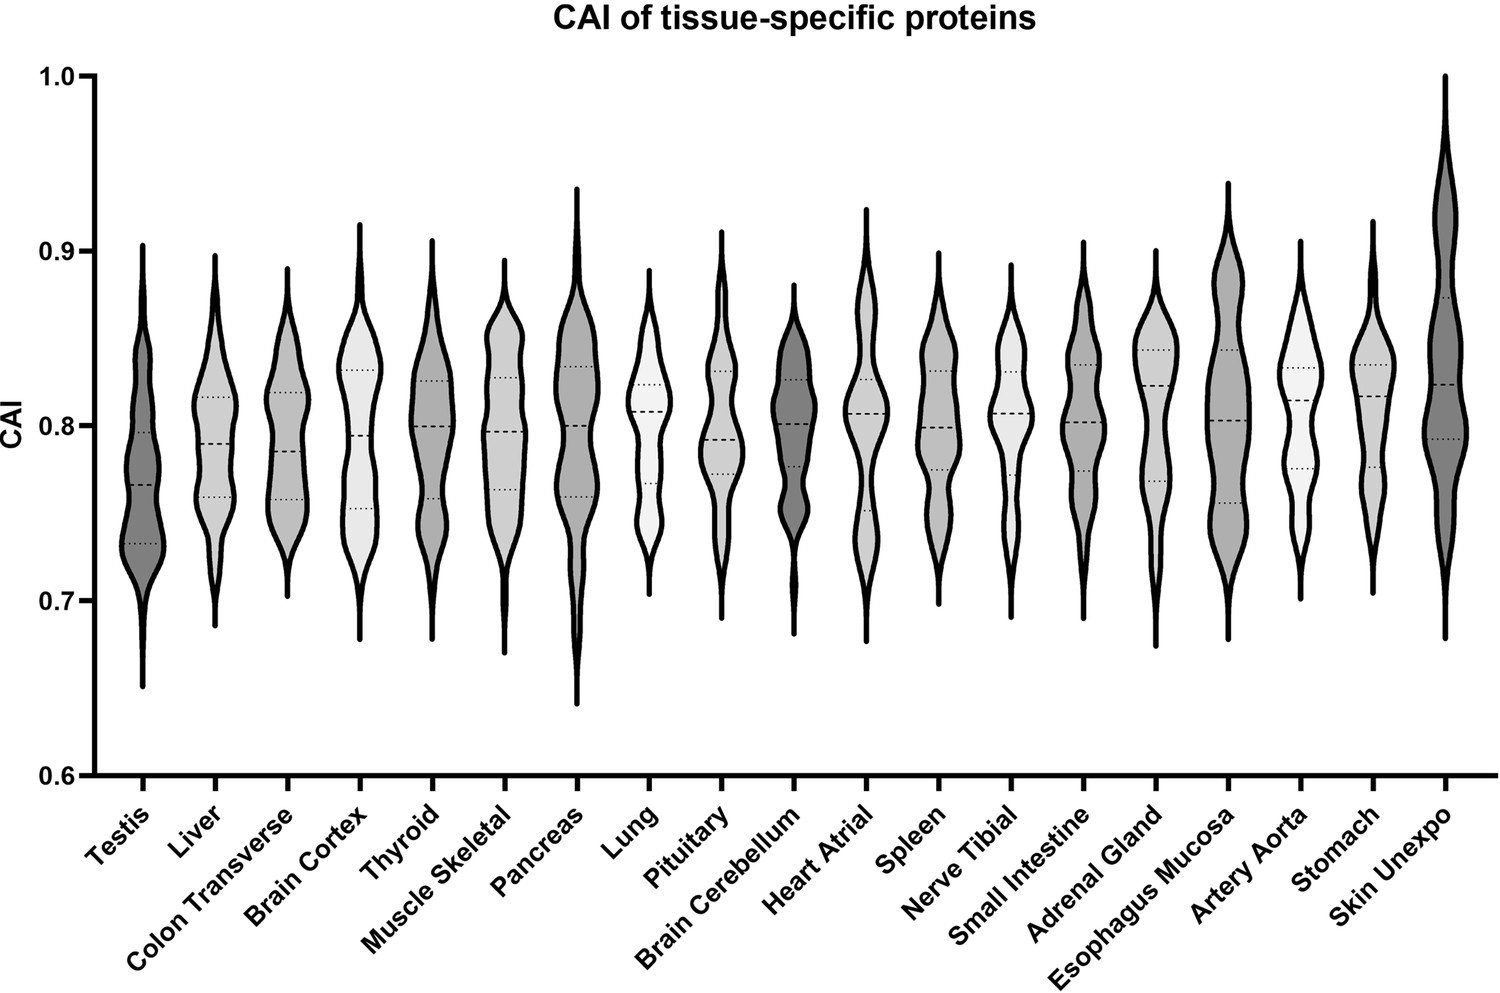
Human tissue-specific proteome data indicate that testis-specific proteins are derived from rare codon-enriched genes.
Violin plots illustrating the Codon Adaptation Index (CAI) of genes encoding tissue-specific proteins identified by Jiang et al., 2020. Data shown are for proteins identified as specific to only a single tissue. Tissues were selected to have at least 10 identified tissue-specific proteins to be included in the analysis. Tissues are plotted in ascending order based on mean CAI.
Figure 5 with 2 supplements
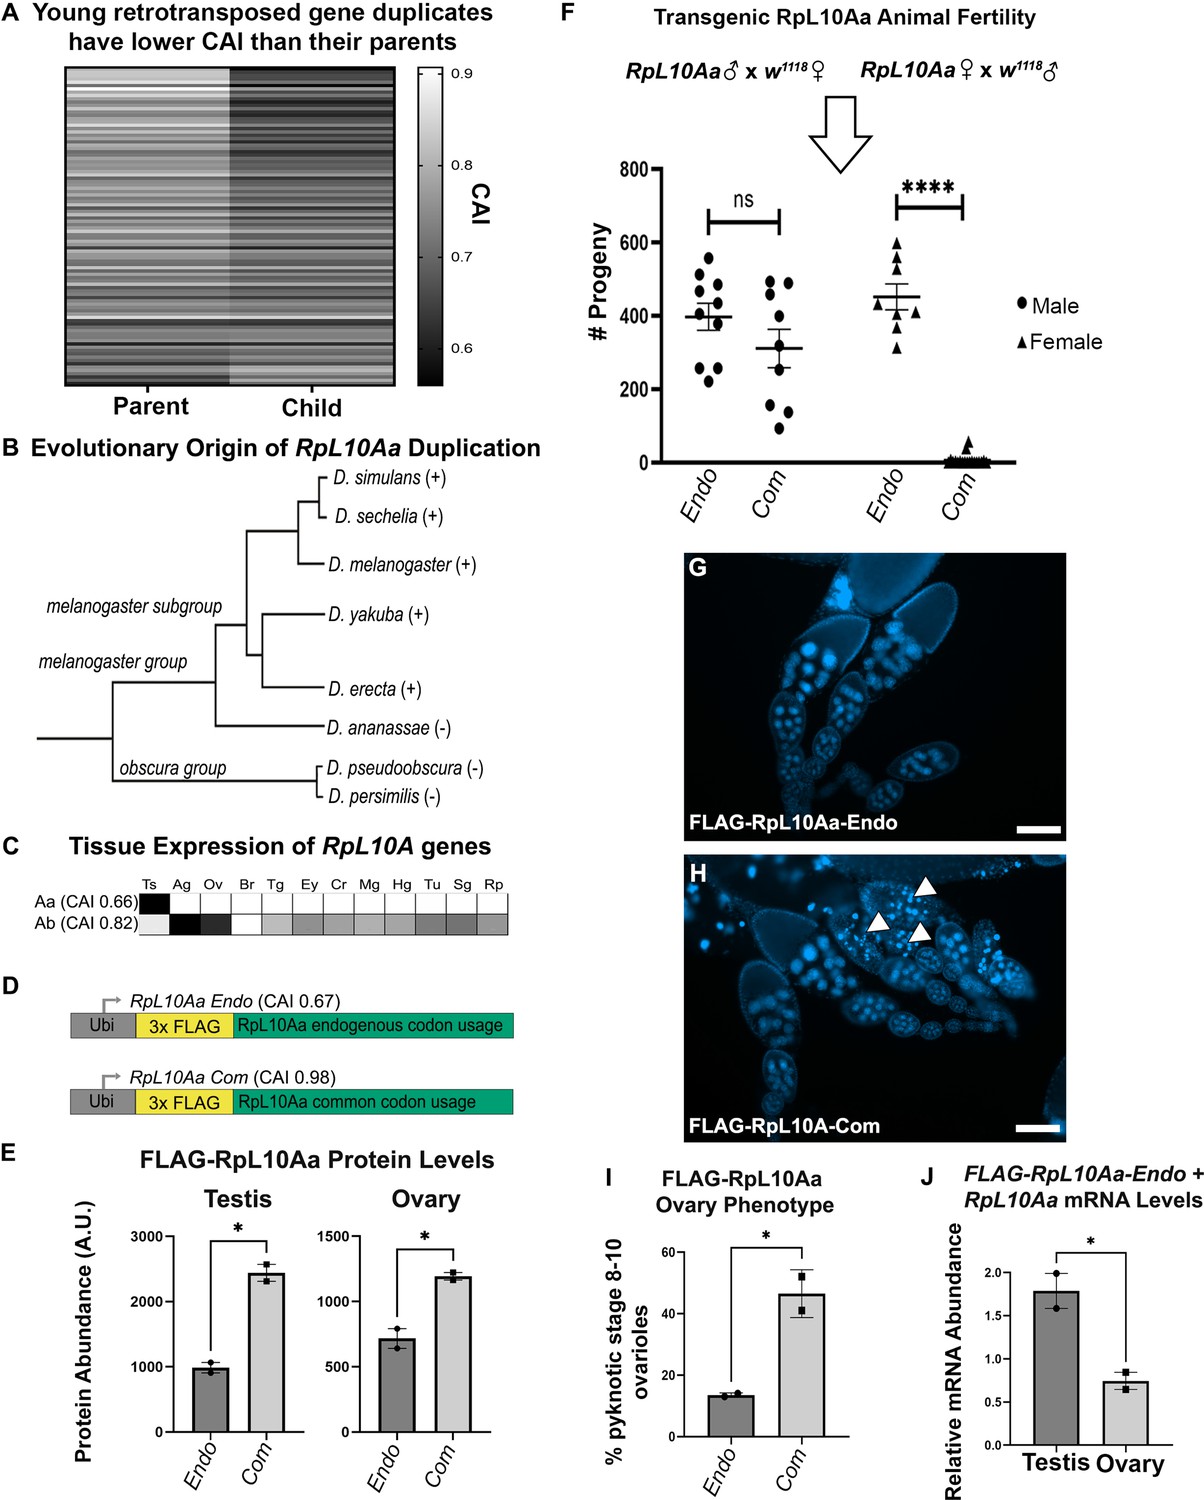
Rare codons in RpL10Aa, an evolutionarily young testis gene, impacts fertility.
(A) Codon usage analysis for young gene duplicate pairs arising from retrotransposition events, identified by Zhang et al., 2010. Heatmap represents 96 duplicate gene pairs with the Codon Adaptation Index (CAI) of the parent gene indicated on the left and the CAI of the child gene indicated on the right. (B) Phylogenetic tree (Granzotto et al., 2009) of the RpL10Aa gene duplication event. RpL10Aa is only present in the melanogaster subgroup as indicated by (+). RpL10Aa is not present in D. ananassae or the obscura group as indicated by (−). (C) Expression profiles for RpL10Aa and RpL10Ab based on FlyAtlas2 RNAseq. Darker boxes indicate higher expression. Ts = testis, Ag = accessory gland, Ov = ovary, Br = brain, Tg = thoracicoabdominal gland, Ey = eye, Cr = crop, Mg = midgut, Hg = hindgut, Tu = Malpighian tubule, Sg = salivary gland, Rp = rectal pad. (D) Design of RpL10Aa transgenes. CAI for transgenic 3xFLAG-RpL10Aa CDS indicated in parentheses. (E) Quantification of transgenic RpL10Aa protein levels in adult testis and young (0–8 hr old) adult ovaries measured by western blot. Protein levels are normalized to total protein stain (two replicates, N=10 animals each, plotting mean ± SEM, unpaired T-test, *p<0.05). Western blot images in Figure 5—figure supplement 2. (F) RpL10Aa fertility assay. Single RpL10Aa transgene expressing flies were crossed to single wildtype flies of the opposite sex. Adult progeny resulting from a 10 days mating period were counted. Each point represents progeny from one mating pair. (8–19 replicates per condition, Tukey’s multiple comparisons, ns = p>0.05, ****p<0.0001). Legend indicates sex of RpL10Aa transgene expressing parent. (G–H) Representative fluorescence images of RpL10Aa transgene expressing ovaries depicting egg chambers with pyknotic nuclei (arrowheads) at mid-oogenesis in RpL10Aa Com animals. Nuclei are stained with DAPI. (I) Quantification of pyknotic nuclei phenotype in G–H. (J) RpL10Aa Endo mRNA levels encompassing both transgenic RpL10Aa Endo and RpL10Aa from the endogenous gene locus. RNA levels are plotted as a ratio relative to codon optimized transgenic RpL10Aa-Com.
Figure 5—figure supplement 1
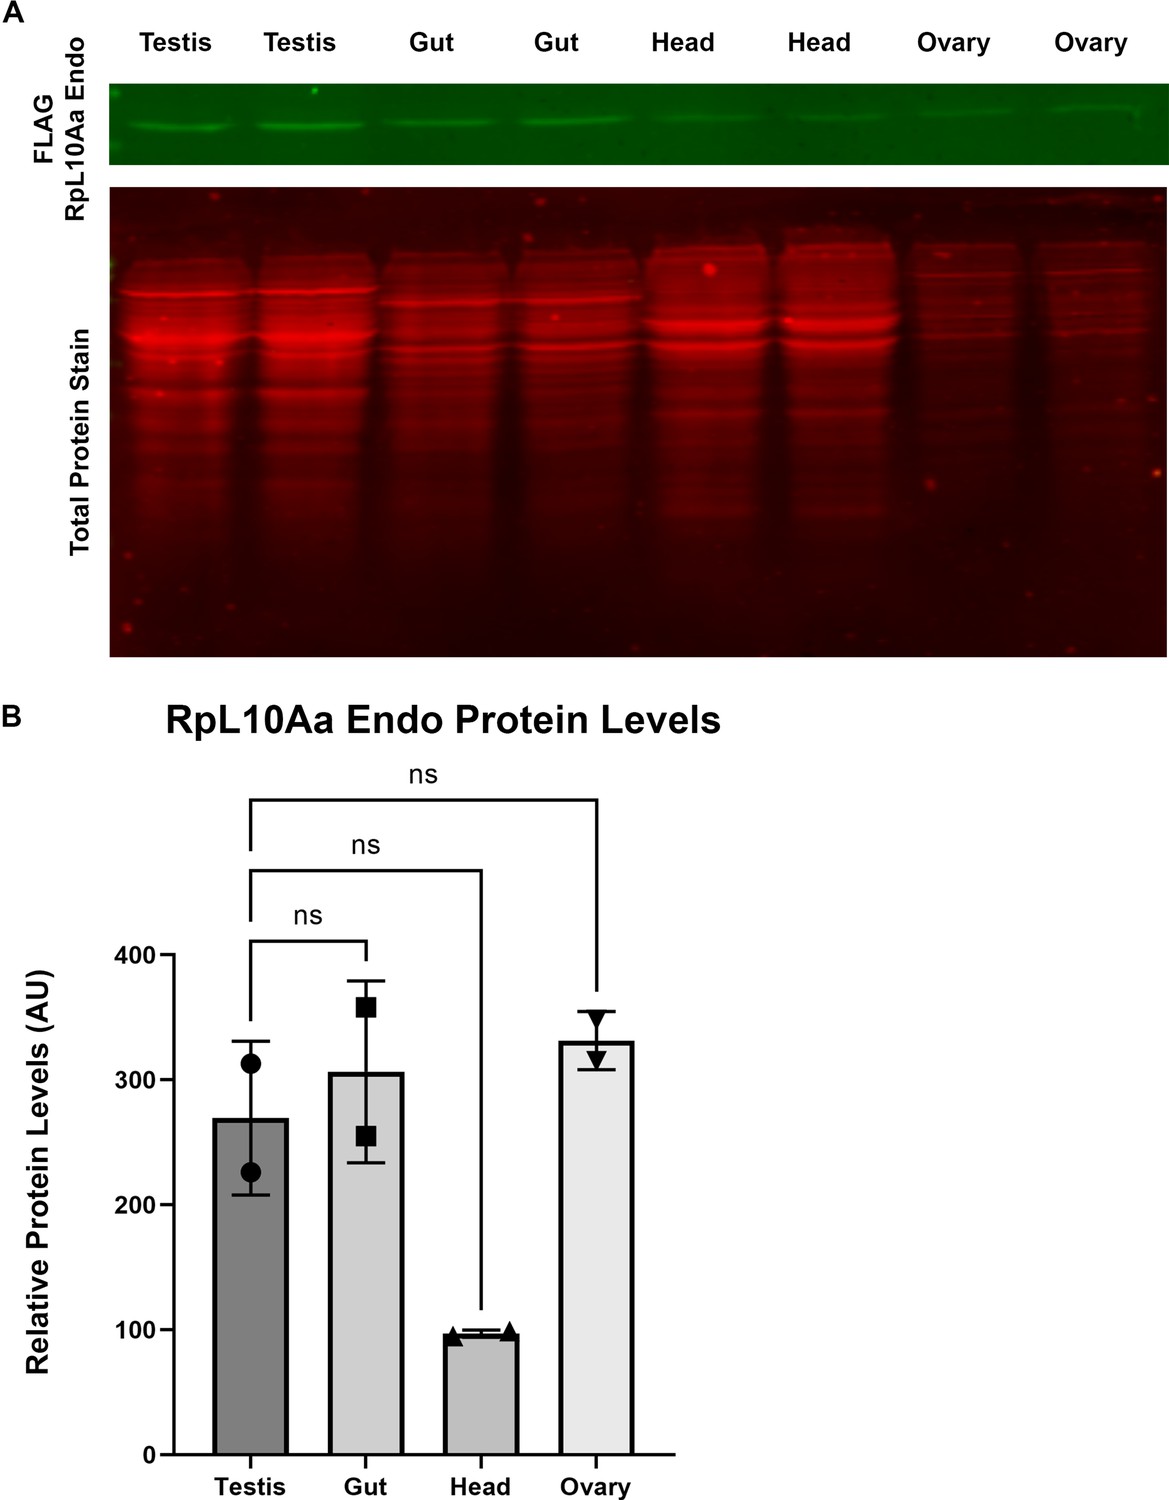
The FLAG-RpL10Aa-Endo reporter transgene is not selectively expressed in the testis.
(A) Western blot analyzing FLAG-RpL10Aa-Endo reporter protein levels across multiple tissues. Top section reveals FLAG-RpL10Aa-Endo levels detected with anti-FLAG M2 antibody. Bottom section is total protein stained using LI-COR Revert700. (B) Quantification of FLAG-RpL10Aa-Endo protein levels normalized to total protein (Dunnett’s multiple comparisons test, ns = p>0.05).
-
Figure 5—figure supplement 1—source data 1
Raw data file and associated PDF figure of uncropped blot presented and quantified in Figure 5—figure supplement 1.
Blot image was taken in the 800 nm channel and indicates the signal from anti-FLAG M2 antibody recognizing FLAG-tagged transgenic RpL10Aa reporter derived protein. Ladder is LI-COR Chameleon Duo pre-stained protein ladder.
- https://cdn.elifesciences.org/articles/76893/elife-76893-fig5-figsupp1-data1-v2.zip
-
Figure 5—figure supplement 1—source data 2
Raw data file and associated PDF figure of uncropped blot presented and quantified in Figure 5—figure supplement 1.
Blot image was taken in the 700 nm channel and indicates the total protein stain obtained using the LI-COR Revert700 Total Protein Stain kit. Ladder is LI-COR Chameleon Duo pre-stained protein ladder.
- https://cdn.elifesciences.org/articles/76893/elife-76893-fig5-figsupp1-data2-v2.zip
Figure 5—figure supplement 2
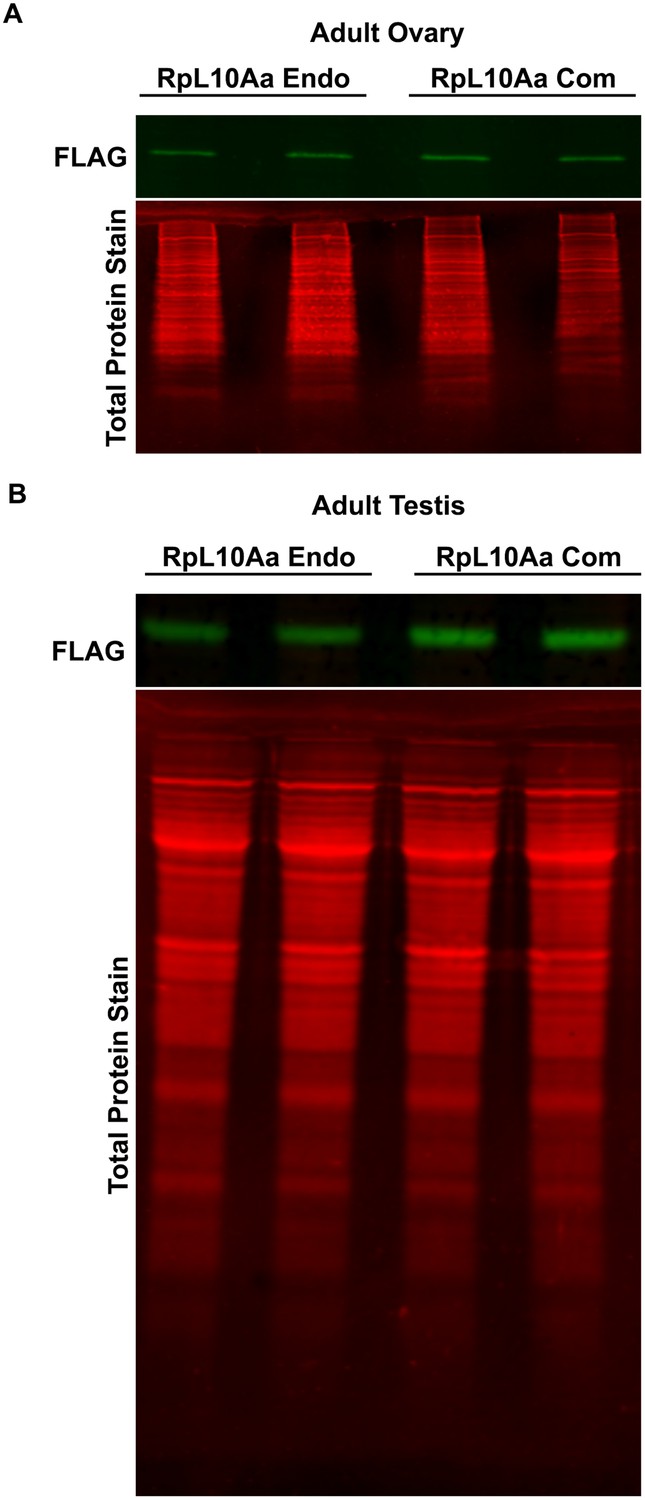
Western blot for RpL10Aa in adult ovary and testis.
(A) Western blot of adult ovaries from animals with stable genomic insertion of RpL10Aa Com and RpL10Aa Endo (two replicates, N=10 pairs of ovaries each, quantified in Figure 5E). (B) Western blot of adult testis from animals with stable genomic insertion of RpL10Aa Com and RpL10Aa Endo (two replicates, N=10 pairs of ovaries each, quantified in Figure 5E).
-
Figure 5—figure supplement 2—source data 1
Raw data file and associated PDF figure of uncropped blot presented in Figure 5—figure supplement 2A and quantified in Figure 5E.
Blot image was taken in the 800 nm channel and indicates the signal from anti-FLAG M2 antibody recognizing FLAG-tagged transgenic RpL10Aa reporter derived protein. Ladder is LI-COR Chameleon Duo pre-stained protein ladder.
- https://cdn.elifesciences.org/articles/76893/elife-76893-fig5-figsupp2-data1-v2.zip
-
Figure 5—figure supplement 2—source data 2
Raw data file and associated PDF figure of uncropped blot presented in Figure 5—figure supplement 2A and quantified in Figure 5E.
Blot image was taken in the 700 nm channel and indicates the total protein stain obtained using the LI-COR Revert700 Total Protein Stain kit. Ladder is LI-COR Chameleon Duo pre-stained protein ladder.
- https://cdn.elifesciences.org/articles/76893/elife-76893-fig5-figsupp2-data2-v2.zip
-
Figure 5—figure supplement 2—source data 3
Raw data file and associated PDF figure of uncropped blot presented in Figure 5—figure supplement 2B and quantified in Figure 5E.
Blot image was taken in the 800 nm channel and indicates the signal from anti-FLAG M2 antibody recognizing FLAG-tagged transgenic RpL10Aa reporter derived protein. Ladder is LI-COR Chameleon Duo pre-stained protein ladder.
- https://cdn.elifesciences.org/articles/76893/elife-76893-fig5-figsupp2-data3-v2.zip
-
Figure 5—figure supplement 2—source data 4
Raw data file and associated PDF figure of uncropped blot presented in Figure 5—figure supplement 2B and quantified in Figure 5E.
Blot image was taken in the 700 nm channel and indicates the total protein stain obtained using the LI-COR Revert700 Total Protein Stain kit. Ladder is LI-COR Chameleon Duo pre-stained protein ladder.
- https://cdn.elifesciences.org/articles/76893/elife-76893-fig5-figsupp2-data4-v2.zip
Tables
Key resources table
| Reagent type (species) or resource | Designation | Source or reference | Identifiers | Additional information |
|---|---|---|---|---|
| antibody | anti-GFP (rabbit polyclonal) | Invitrogen | A11122 | (1:1000) |
| antibody | anti-FLAG M2 (mouse monoclonal) | Sigma | F1804 | (1:500) |
| antibody | IRDye 800CW Donkey anti-rabbit IgG Secondary Antibody (clonality unspecified) | LI-COR | 926–32213 | (1:10,000) |
| antibody | IRDye 800CW Donkey anti-mouse IgG Secondary Antibody (clonality unspecified) | LI-COR | 926–32212 | (1:10,000) |
| recombinant DNA reagent | pBID-Ubi | this paper | modified from Addgene Plasmid #35,200 | |
| gene (D. melanogaster) | RpL10Aa | NA | FBgn0038281 | |
| genetic reagent (D. melanogaster) | attP40 | Model System Injections | y1() M{RFP[3xP3.PB] GFP[E.3xP3]=vas int.Dm}ZH2A w[*]; P{y[+t7.7]=CaryP}attP40 | |
| genetic reagent (D. melanogaster) | w1118 | BDSC | #3605 | |
| genetic reagent (D. melanogaster) | Ubi-GFP0D | Sawyer et al., 2020 | attP40 (2 L) | |
| genetic reagent (D. melanogaster) | Ubi-GFP30D | this paper | attP40 (2 L) | |
| genetic reagent (D. melanogaster) | Ubi-GFP50D | Sawyer et al., 2020 | attP40 (2 L) | |
| genetic reagent (D. melanogaster) | Ubi-GFP60Dv1 | this paper | attP40 (2 L) | |
| genetic reagent (D. melanogaster) | Ubi-GFP60Dv2 | this paper | attP40 (2 L) | |
| genetic reagent (D. melanogaster) | Ubi-GFP60Dv3 | this paper | attP40 (2 L) | |
| genetic reagent (D. melanogaster) | Ubi-GFP70D | this paper | attP40 (2 L) | |
| genetic reagent (D. melanogaster) | Ubi-GFP80D | this paper | attP40 (2 L) | |
| genetic reagent (D. melanogaster) | Ubi-GFP90D | this paper | attP40 (2 L) | |
| genetic reagent (D. melanogaster) | Ubi-GFP100D | this paper | attP40 (2 L) | |
| genetic reagent (D. melanogaster) | Ubi-GFP50C3’ | this paper | attP40 (2 L) | |
| genetic reagent (D. melanogaster) | Ubi-GFP60C3’ | this paper | attP40 (2 L) | |
| genetic reagent (D. melanogaster) | Ubi-GFP70C3’ | this paper | attP40 (2 L) | |
| genetic reagent (D. melanogaster) | Ubi-GFP80C3’ | this paper | attP40 (2 L) | |
| genetic reagent (D. melanogaster) | Ubi-GFP90C3’ | this paper | attP40 (2 L) | |
| genetic reagent (D. melanogaster) | Ubi-GFP50C5’ | this paper | attP40 (2 L) | |
| genetic reagent (D. melanogaster) | Ubi-GFP54C3’ | this paper | attP40 (2 L) | |
| genetic reagent (D. melanogaster) | Ubi-mGFP100Dv1 | this paper | attP40 (2 L) | |
| genetic reagent (D. melanogaster) | Ubi-mGFP100Dv2 | this paper | attP40 (2 L) | |
| genetic reagent (D. melanogaster) | Ubi-mGFP100Dv3 | this paper | attP40 (2 L) | |
| genetic reagent (D. melanogaster) | Ubi-mGFP100Dv4 | this paper | attP40 (2 L) | |
| genetic reagent (D. melanogaster) | Ubi-mGFP100Dv5 | this paper | attP40 (2 L) | |
| genetic reagent (D. melanogaster) | Ubi-mGFP100Dv6 | this paper | attP40 (2 L) | |
| genetic reagent (D. melanogaster) | Ubi-mGFP100Dv7 | this paper | attP40 (2 L) | |
| genetic reagent (D. melanogaster) | Ubi-mGFP100Dv8 | this paper | attP40 (2 L), attP2 (3 L) | |
| genetic reagent (D. melanogaster) | Ubi-3xFLAG-RpL10Aa Endo | this paper | attP40 (2 L) | |
| genetic reagent (D. melanogaster) | Ubi-3xFLAG-RpL10Aa Com | this paper | attP40 (2 L) |
Additional files
-
Supplementary file 1
Full coding sequences of reporters.
- https://cdn.elifesciences.org/articles/76893/elife-76893-supp1-v2.docx
-
Supplementary file 2
Occurrences of codons known to impair translation do not explain reporter expression patterns.
- https://cdn.elifesciences.org/articles/76893/elife-76893-supp2-v2.docx
-
Supplementary file 3
Sequences of pBID-Ubi plasmid promoter and UTRs.
- https://cdn.elifesciences.org/articles/76893/elife-76893-supp3-v2.docx
-
Supplementary file 4
Identity of child genes that gained max expression in the testis.
- https://cdn.elifesciences.org/articles/76893/elife-76893-supp4-v2.docx
-
Supplementary file 5
Primer sequences for qRT-PCR and RT-PCR experiments.
- https://cdn.elifesciences.org/articles/76893/elife-76893-supp5-v2.docx
-
Transparent reporting form
- https://cdn.elifesciences.org/articles/76893/elife-76893-transrepform1-v2.pdf
Download links
A two-part list of links to download the article, or parts of the article, in various formats.
Downloads (link to download the article as PDF)
Open citations (links to open the citations from this article in various online reference manager services)
Cite this article (links to download the citations from this article in formats compatible with various reference manager tools)
Distinct responses to rare codons in select Drosophila tissues
eLife 11:e76893.
https://doi.org/10.7554/eLife.76893


