Determinants of trafficking, conduction, and disease within a K+ channel revealed through multiparametric deep mutational scanning
- Department of Biochemistry, Molecular Biology and Biophysics, University of Minnesota, United States
- Department of Genetics, Cell Biology and Development, University of Minnesota, United States
Figures
Figure 1 with 4 supplements
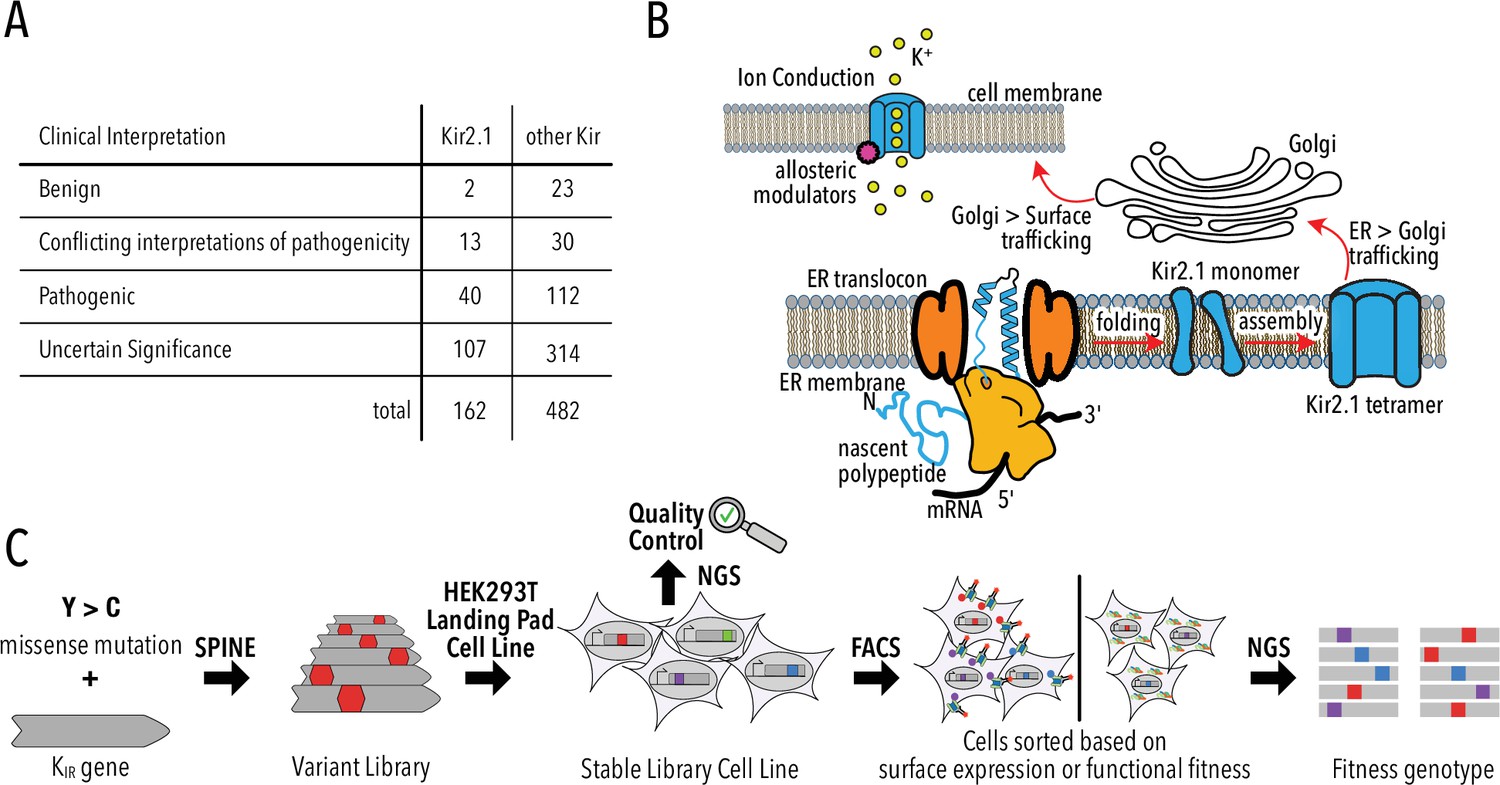
Deep mutational scanning (DMS) to improve clinical variant prediction.
(A) Clinically observed variation in Kir2.1 and other Kir and their interpretation of pathogenicity. (B) Schematic summarizing the various processes that must work correctly for Kir2.1 to fulfill its role in cellular physiology. (C) Schematic summarizing DMS and multiparametric assessment of phenotype. Mutations are introduced into Kir2.1 using SPINE. A stable single-copy insertion library is generated by BxBI-mediated recombination in HEK293T. Cells are sorted based on channel surface expression or function (K+ conductance) as determined by antibody labeling of an extracellular FLAG-tag or voltage-sensitive dye, respectively. Genotypes of each sorted cell population are recovered by NextGen Sequencing (NGS).
Figure 1—figure supplement 1
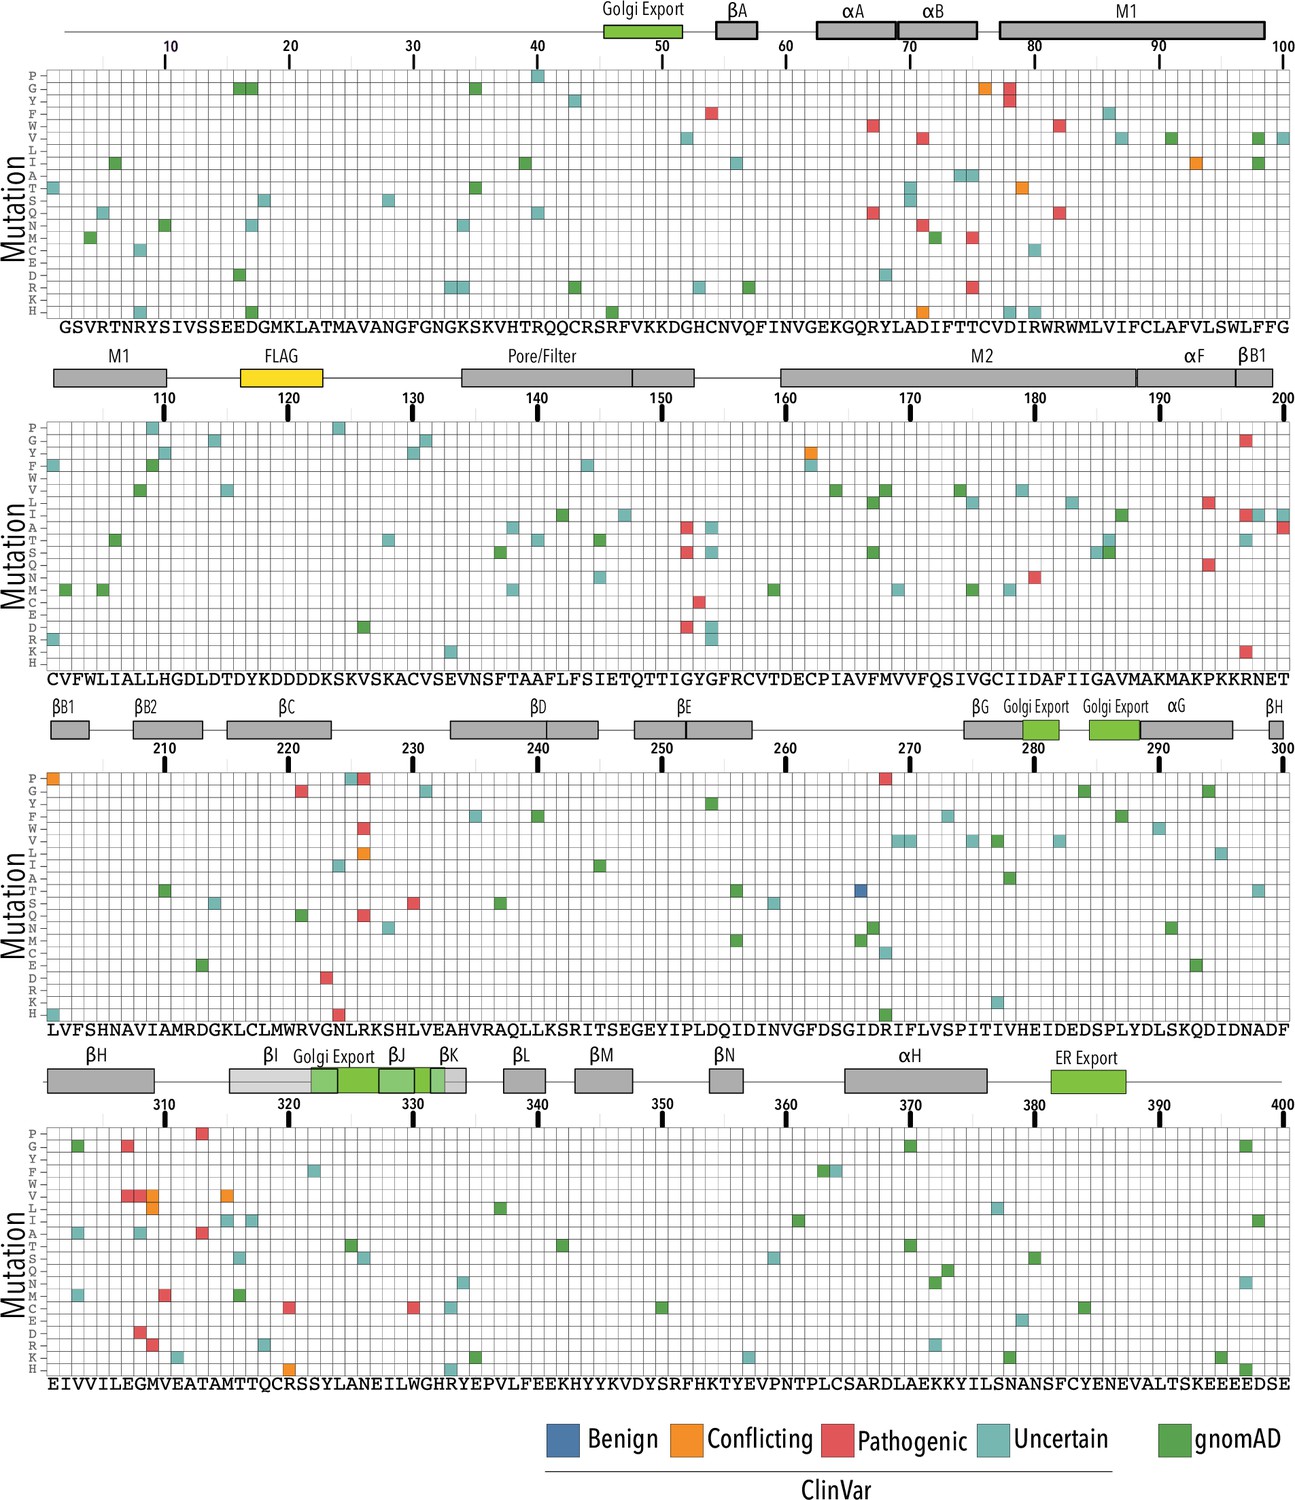
Kir2.1 variants reported in ClinVar and gnomAD.
Heatmap showing Kir2.1 variants reported in ClinVar (as of March 25, 2022) and gnomAD (v2.1.1) mapped by position, mutation, and pathogenicity interpretation (ClinVar only). Kir2.1 secondary structural elements are shown as gray boxes above each panel. Trafficking signals are colored green.
Figure 1—figure supplement 2
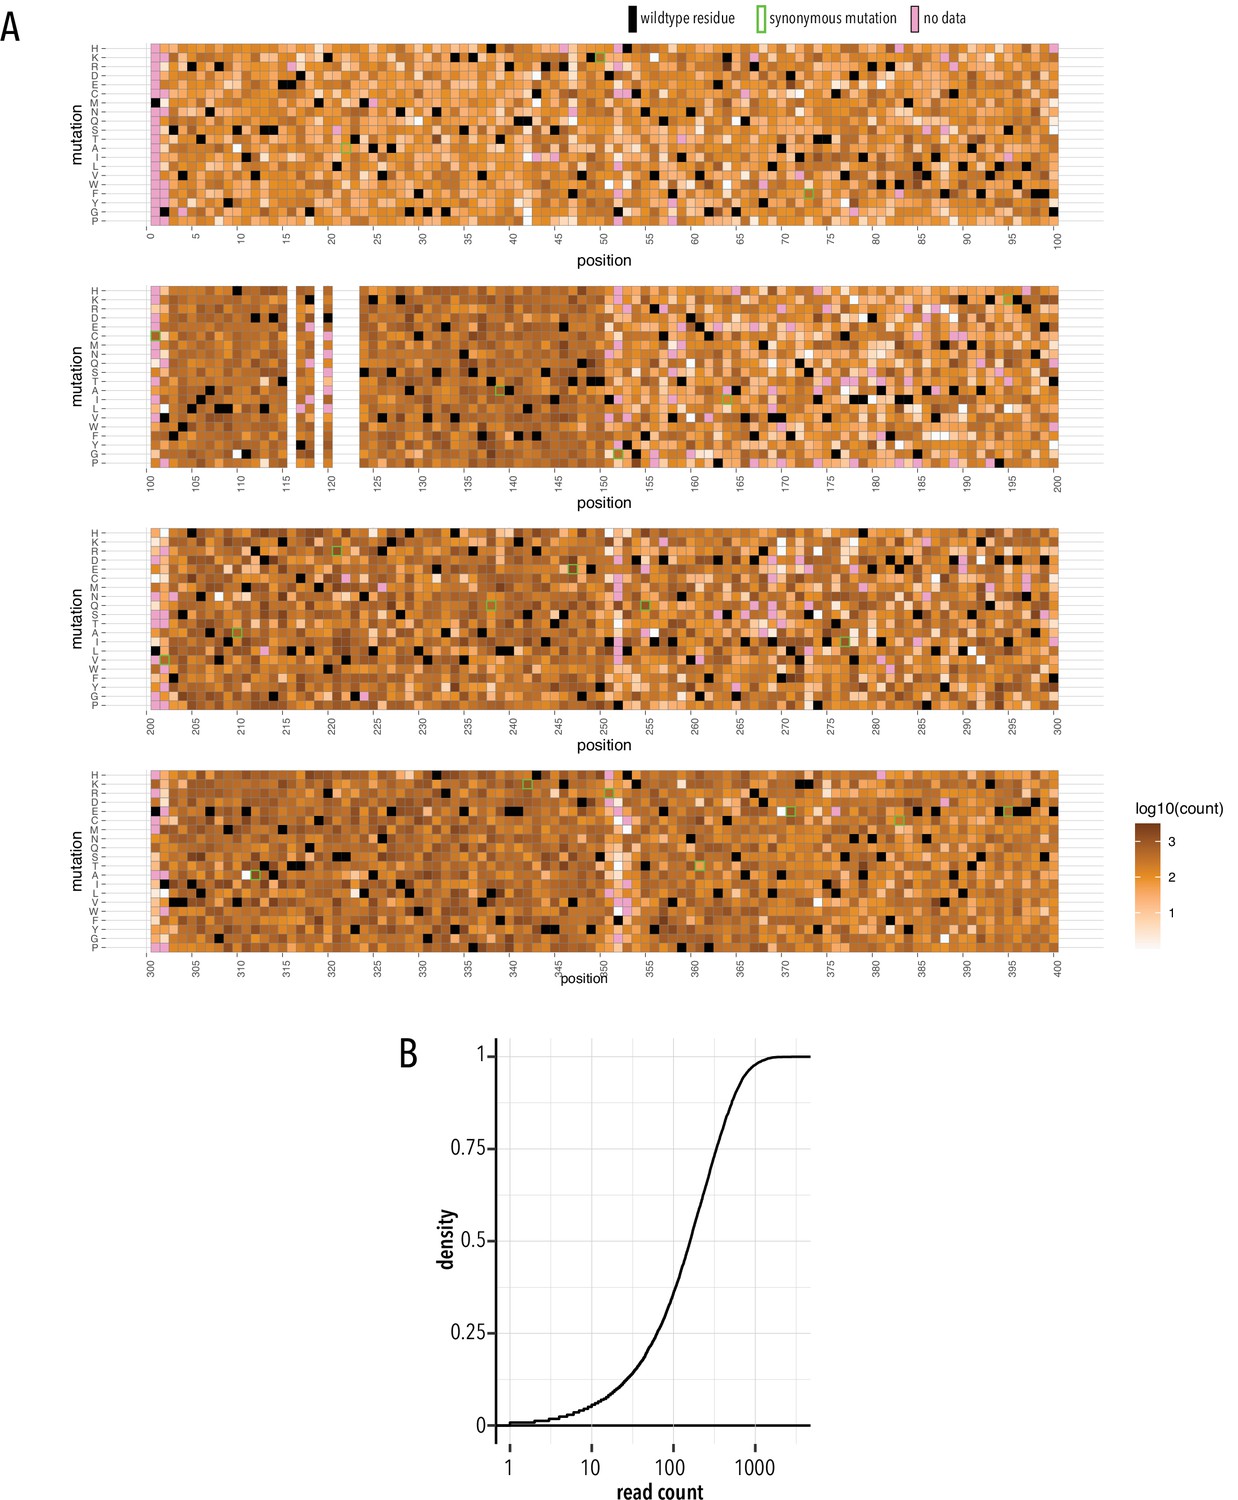
Stable library cell line quality control.
(A) Heatmap showing read counts (gradient white to brown) mapped to each position and mutation. Wildtype residues are shown as black boxes. Synonymous mutations carry green outlines. Missing data is shown as magenta boxes. (B) Cumulative density distribution of read count depth.
Figure 1—figure supplement 3
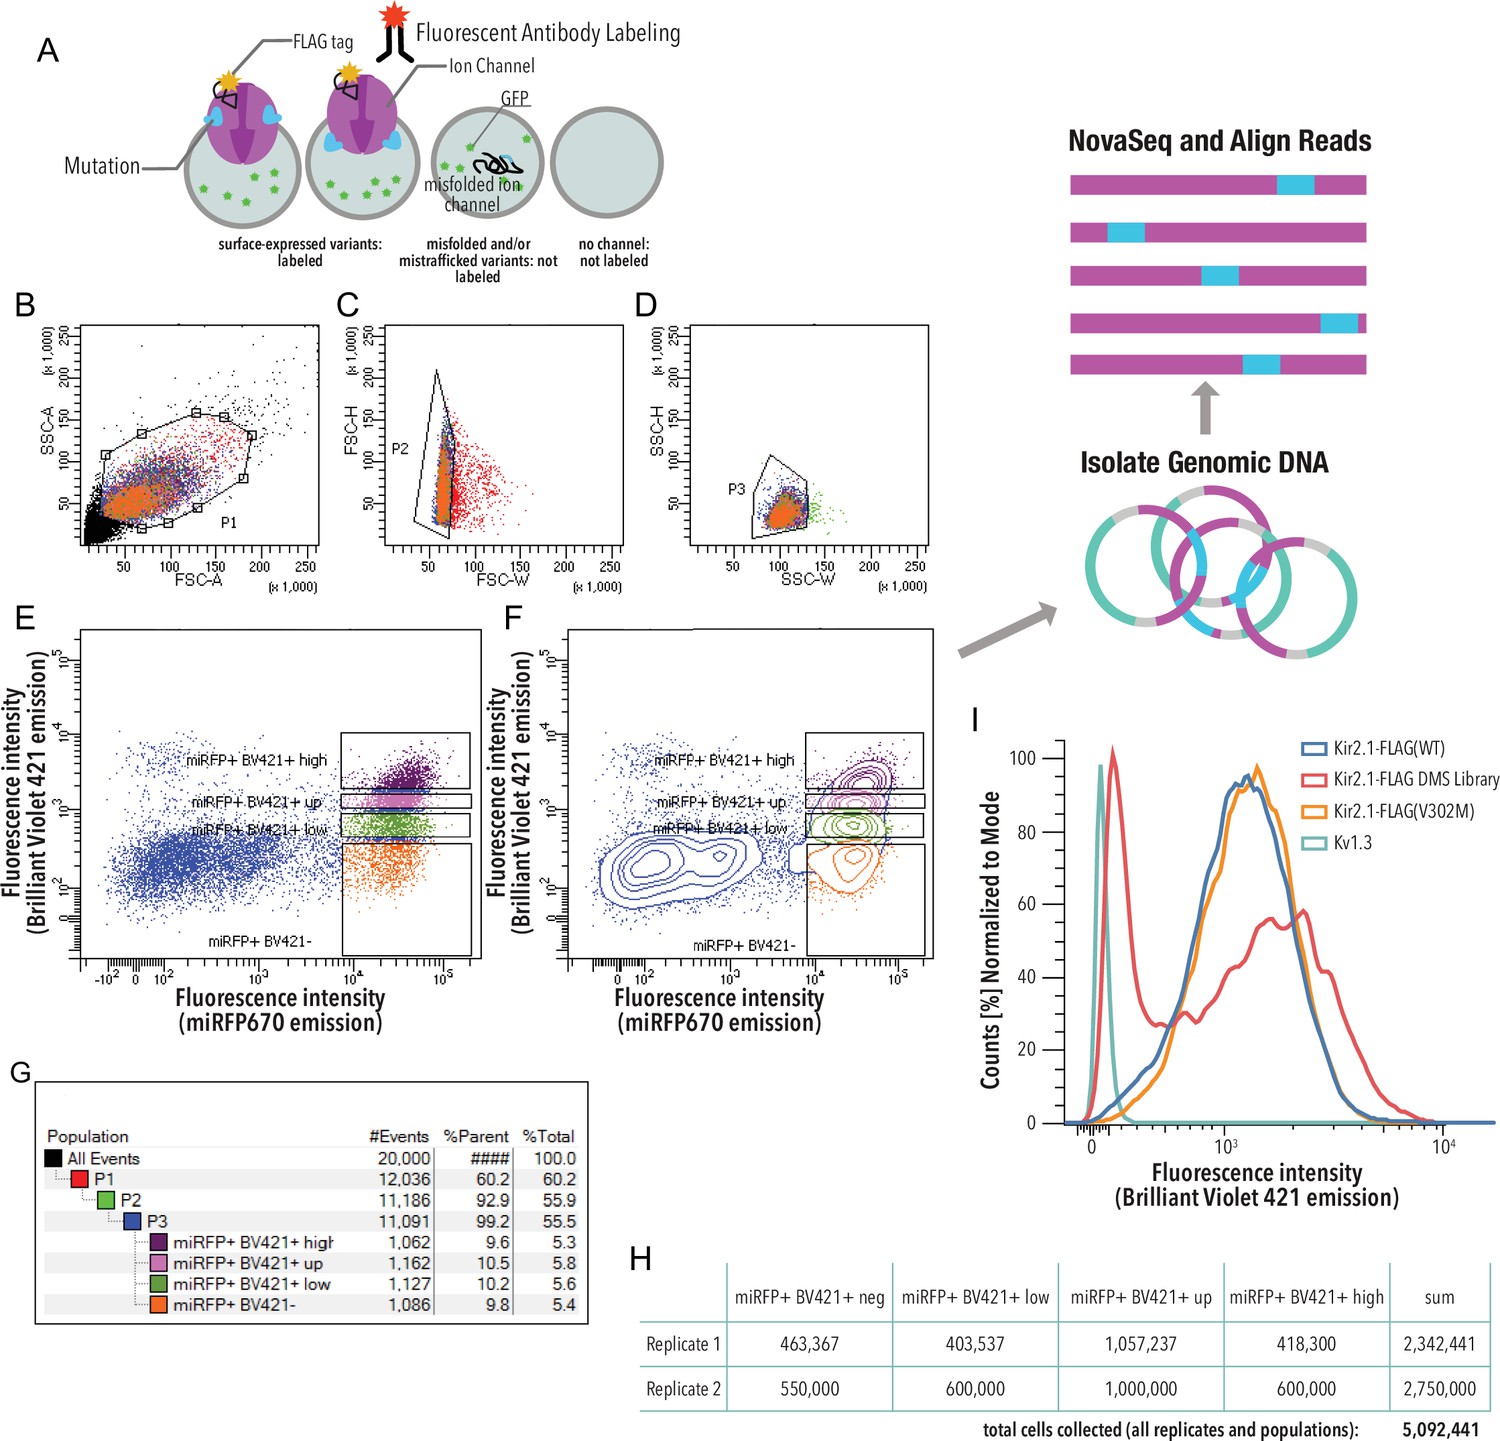
Kir2.1 surface expression assay.
(A) HEK293 cells expressing a single variant are incubated with a fluorescent (Brilliant Violet) antibody that recognizes a Flag-tag inserted into an extracellular loop (Kir2.1 position T115). Cells expressing channel variants that can fold, assemble, and traffic to the cell surface are labeled, while those that express variants with impaired folding, assembly, and/or trafficking are not labeled. (B–G) Gating scheme (shown for a representative example, downsampled to 20,000 cells). (B) Whole HEK293 cells are gated on side (SSC-A) and forward scattering (FSC-A). (C, D) Forward scattering height (FSC-H), forward scattering width (FSC-W), and side scattering width (SSC-W) are used to gate single cells. Nonsurface-expressed variants (miRFPhigh/Labellow) and surface-expressed variants (miRFPhigh/Labelhigh) populations are gated into ‘negative,’ ‘low,’ ‘up,’ and ‘high’ populations based an expression marker (miRFP670) of Anti-Flag Brilliant Violet-421 fluorescence. Scatter plot (E) and contour plot (F) shown. Contour plots represent 95% confidence intervals with outliers shown as dots. (G) Sort statistic for each gated cell population in the gating scheme example. (H) Total cell sort statistics for each collected cell population in (F). (I) Cell surface labeling fluorescence intensity distribution of representative samples (downsampled to 20,000 cells). Kir2.1-Flag(WT) is the positive control. The negative control is Kv1.3 (a channel lacking an extracellular Flag-tag). The V302M mutation affects gating of Kir2.1 without changing surface expression (Ma et al., 2007). Distribution of surface expression was bimodal for the Kir2.1 DMS library.
Figure 1—figure supplement 4
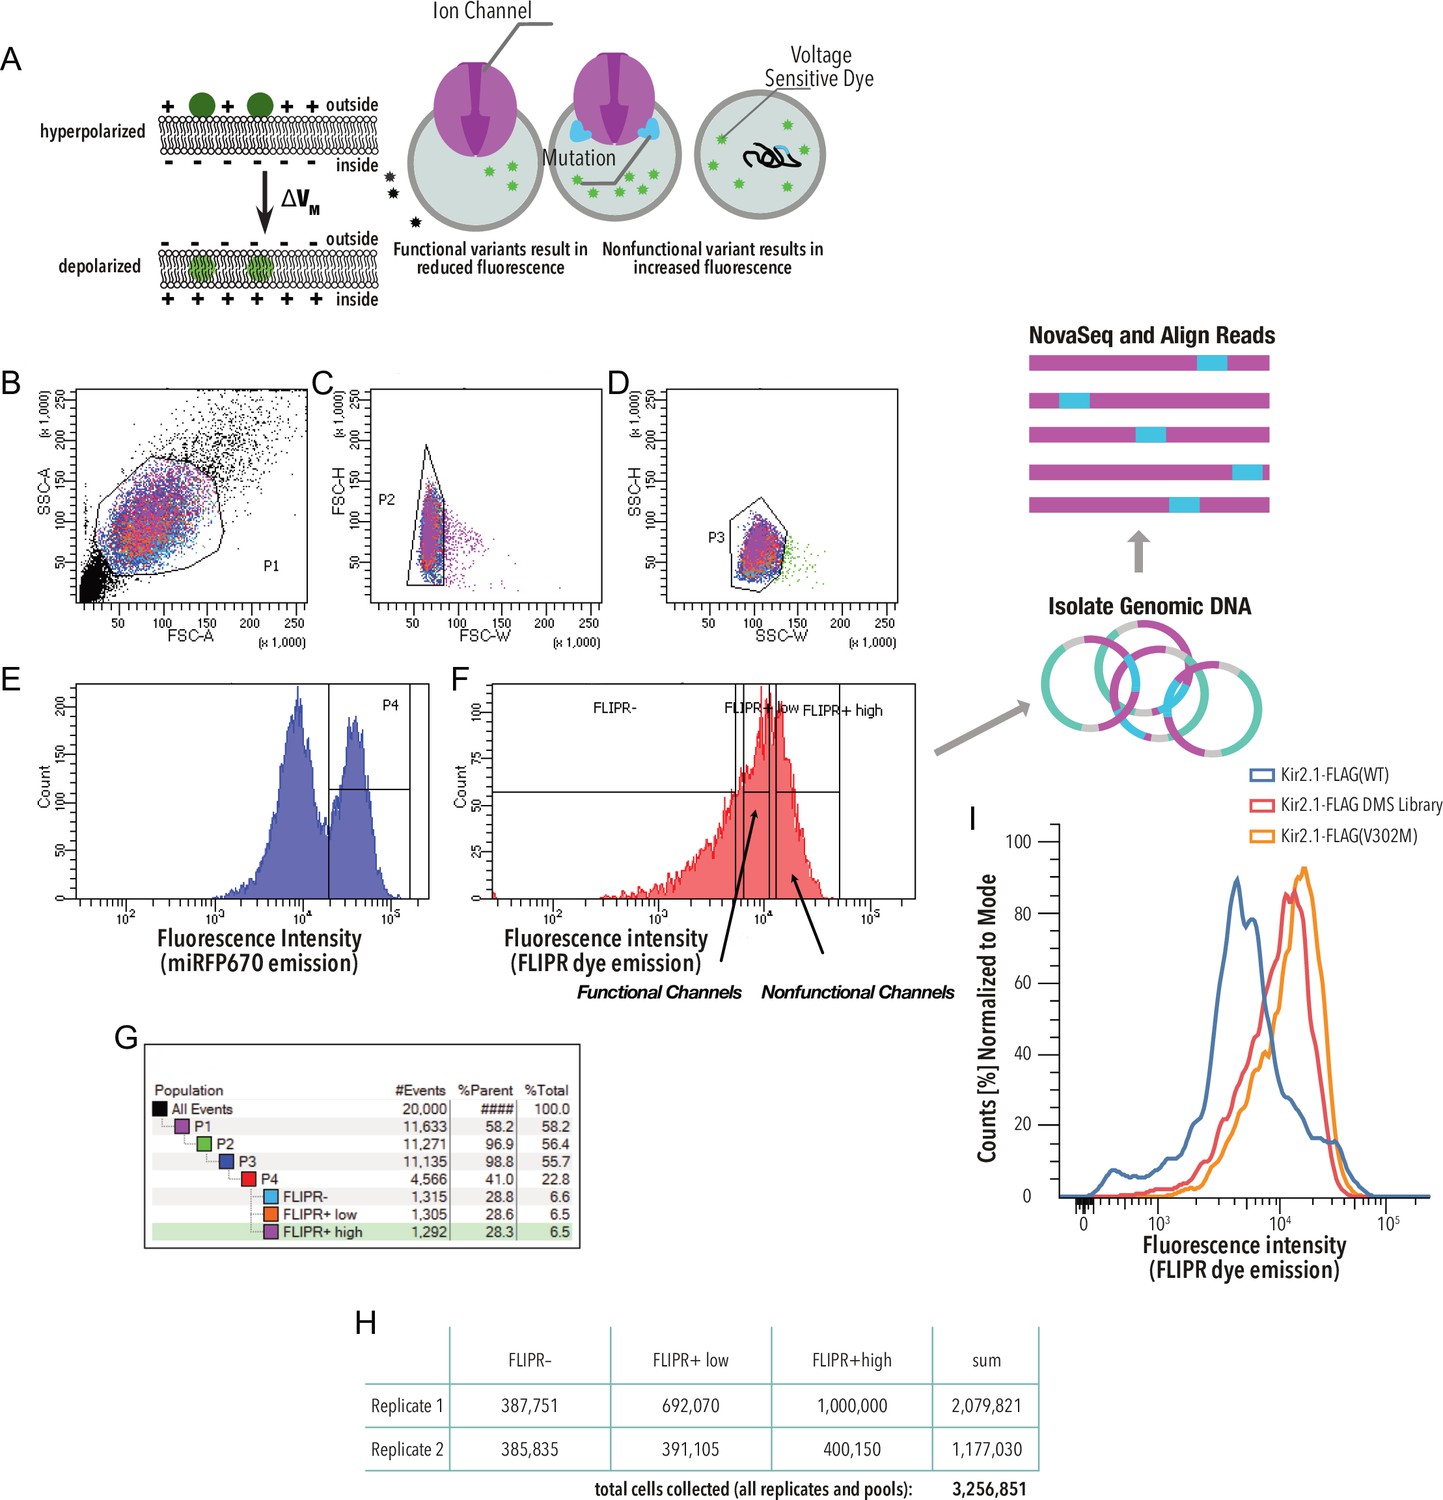
Kir2.1 functional fitness assay gating scheme.
(A) HEK293 cells expressing a single variant are incubated with a voltage-sensitive FLIPR dye. In strongly hyperpolarized cells, this dye partitions out the cell membrane into an aqueous environment, which decreases its extinction coefficient and thus decreases green fluorescence upon excitation with blue light. In depolarized cells, the FLIPR dye fluorescence is brighter because the dye partitions into the membrane, which increases its extinction coefficient. (B–G) Gating scheme (shown for a representative example, downsampled to 20,000 cells). (B) Whole HEK293 cells are gated on side (SSC-A) and forward scattering (FSC-A). (C, D) Forward scattering height (FSC-H), forward scattering width (FSC-W), and side scattering width (SSC-W) are used to gate single cells. (E) Cells are further gated using miRFP670 as an expression marker. (F) Nonfunctional and functional channel population are separated by sorting based on FLIPR dye fluorescence. (G) Sort statistic for each gated cell population in the gating scheme example. (H) Total cell sort statistics for each collected cell population in (F). (I) Optical voltage sensor (FLIPR dye) fluorescence intensity distribution of representative samples. Lower intensity = more hyperpolarization. Kir2.1-Flag(WT) is the positive control. The V302M mutation abolishes K+ conductance in Kir2.1 without changing surface expression (Ma et al., 2007).
Figure 2 with 5 supplements
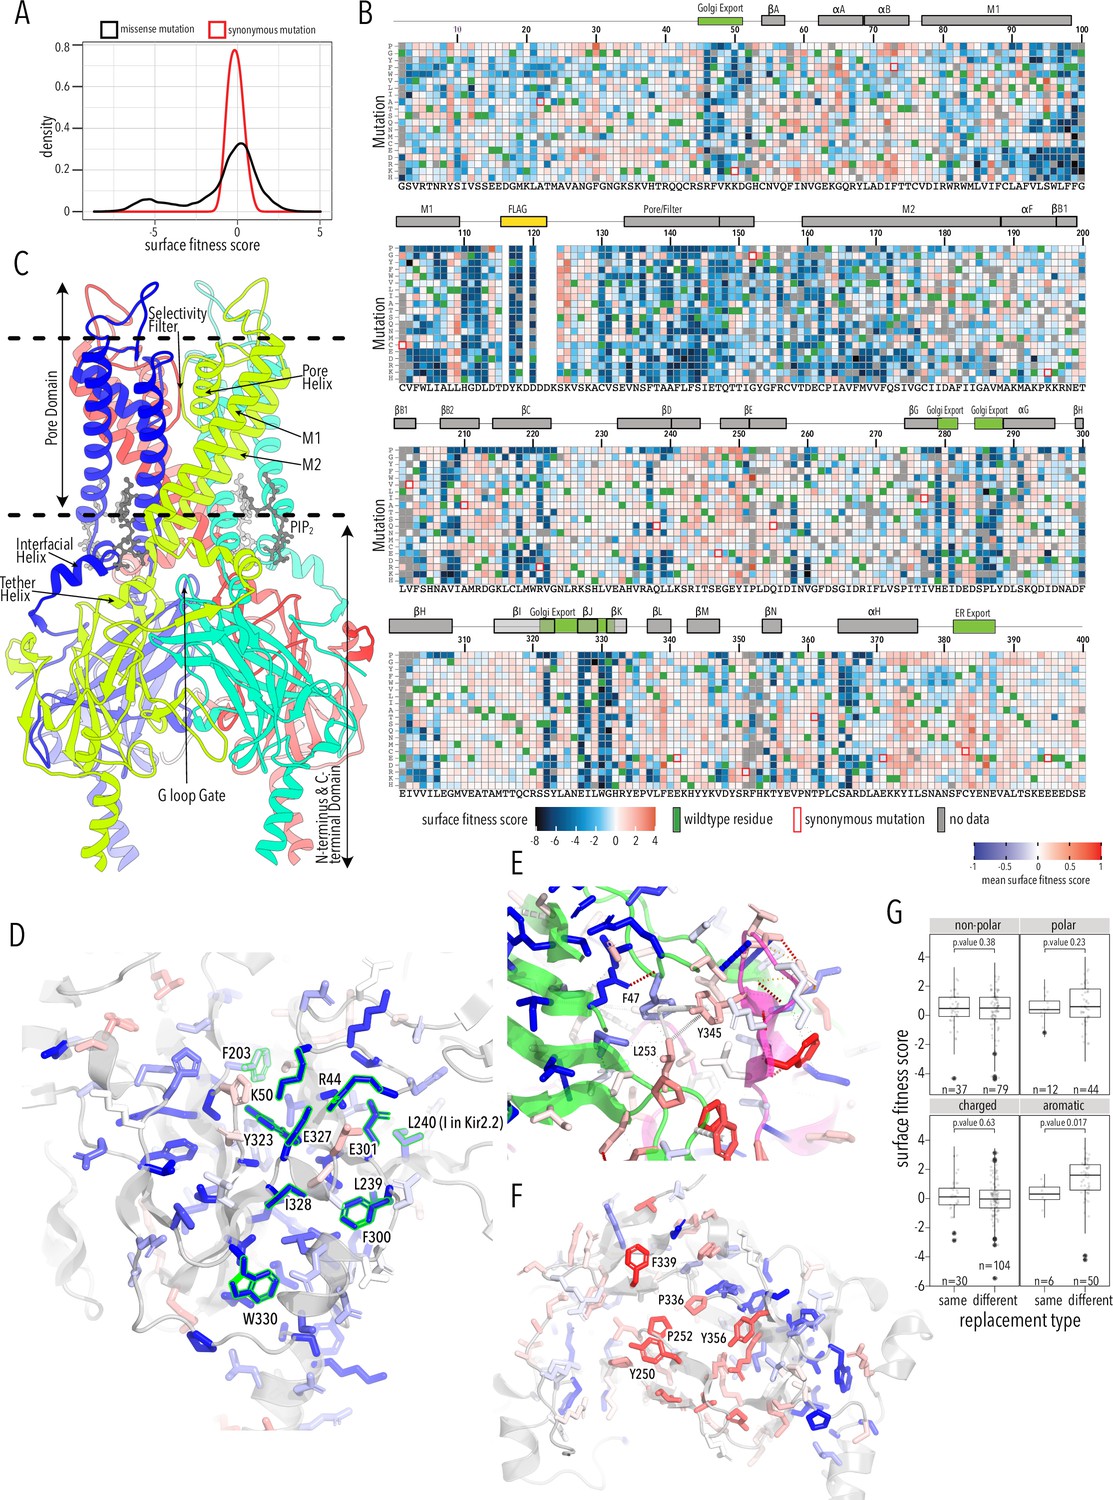
Surface expression fitness.
(A) Distribution of surface expression fitness scores for synonymous mutations (red line) and missense mutations (black line). (B) Heatmap of Enrich2-calculated surface expression fitness scores expressed as a gradient from blue (below wildtype [WT] fitness) over white (same as WT fitness) to red (above WT fitness). WT residues are indicated by filled green boxes. Missing data is indicated by filled dark gray boxes. Synonymous mutations are indicated by red box outlines. (C) Cartoon of Kir2.2 (PDB 3SPI, 70% identity with Kir2.1). Monomer chains shown in different colors. Lipid bilayer boundaries are indicated by dashed lines. (D) Close-up of core β-sheet of the C-terminal domain (CTD) with mean surface expression fitness (averaged across all measured mutations for that position) mapped onto each residue as a gradient from blue over white to red, corresponding to below WT, same as WT, and above WT fitness, respectively. Residues that comprise the Golgi export signal are outlined green. Numbering corresponds to Kir2.1-Flag. (E) Interface close-up of neighboring subunits (green and magenta cartoons). Sidechains are colored by surface fitness score; same scale as in (D). (F) Close-up of βDE and βLM loop mean surface expression fitness. (G) Boxplots showing surface fitness in the βDE and βLM loop if the WT residues of a specific type (e.g., glutamate, charged) is mutated to another residue of the same type (e.g., aspartate) or a different type (e.g., tryptophan, aromatic). Median is marked with a thick line, the vertical length of the box represents the interquartile range (IQR), upper fence: 75th percentile +1.5× IQR, lower fence: 25th percentile −1.5× IQR, outlier points are shown as solid black circles. All data points are indicated by transparent dots. Only replacing aromatic residues significantly increases surface expression. Significance is tested using one-sided t-tests; number of observations (n) and p-values are indicated for each comparison.
Figure 2—figure supplement 1
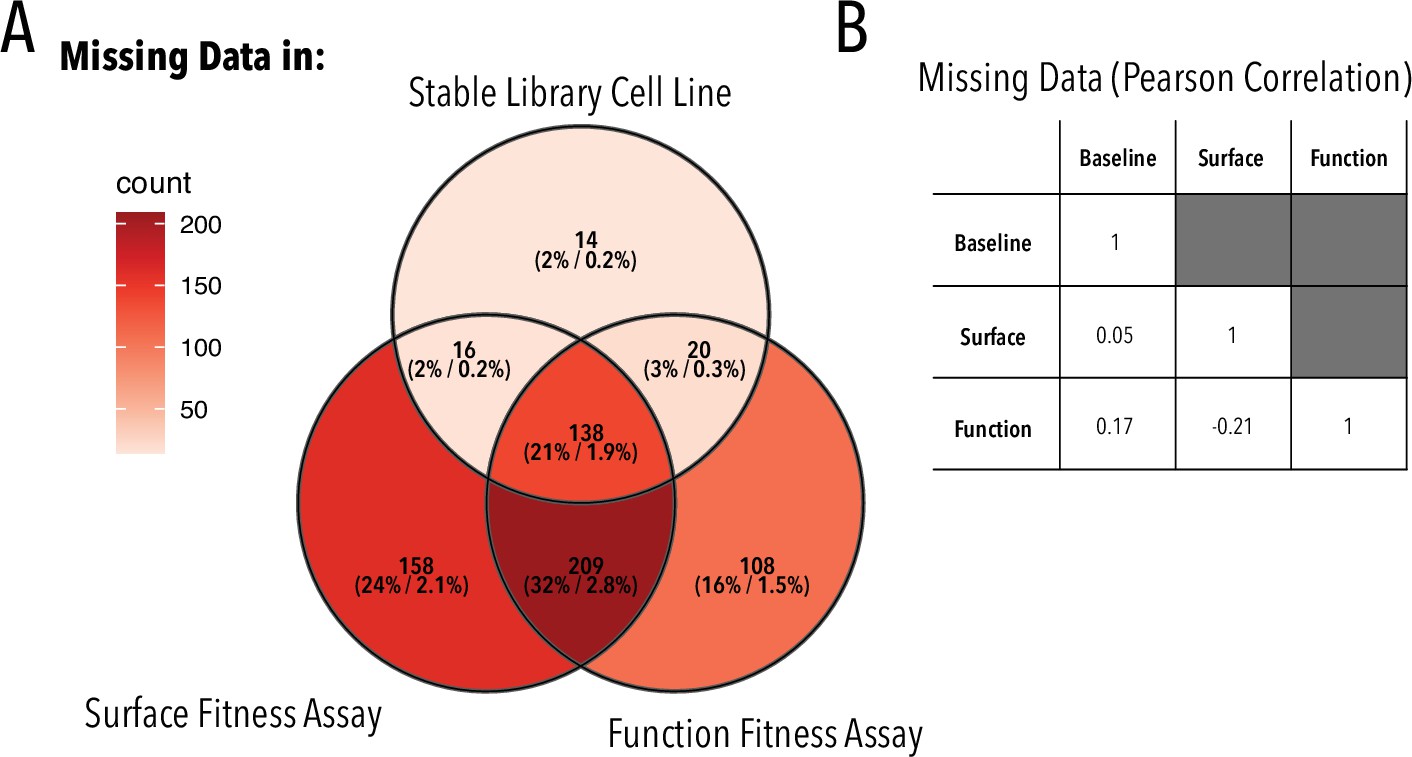
Missing variants.
(A) Overlap between variants missing in the stable library cell line, surface, and function fitness data. Each set is annotated as X (Y%/Z%), where X is the number of missing variants in each set, Y is the fraction of missing variants in each set vs. all missing variants, and Z is the fraction of missing variants in a given set vs. all possible variants. (B) Pearson correlation coefficient of missing variants in different sets.
Figure 2—figure supplement 2
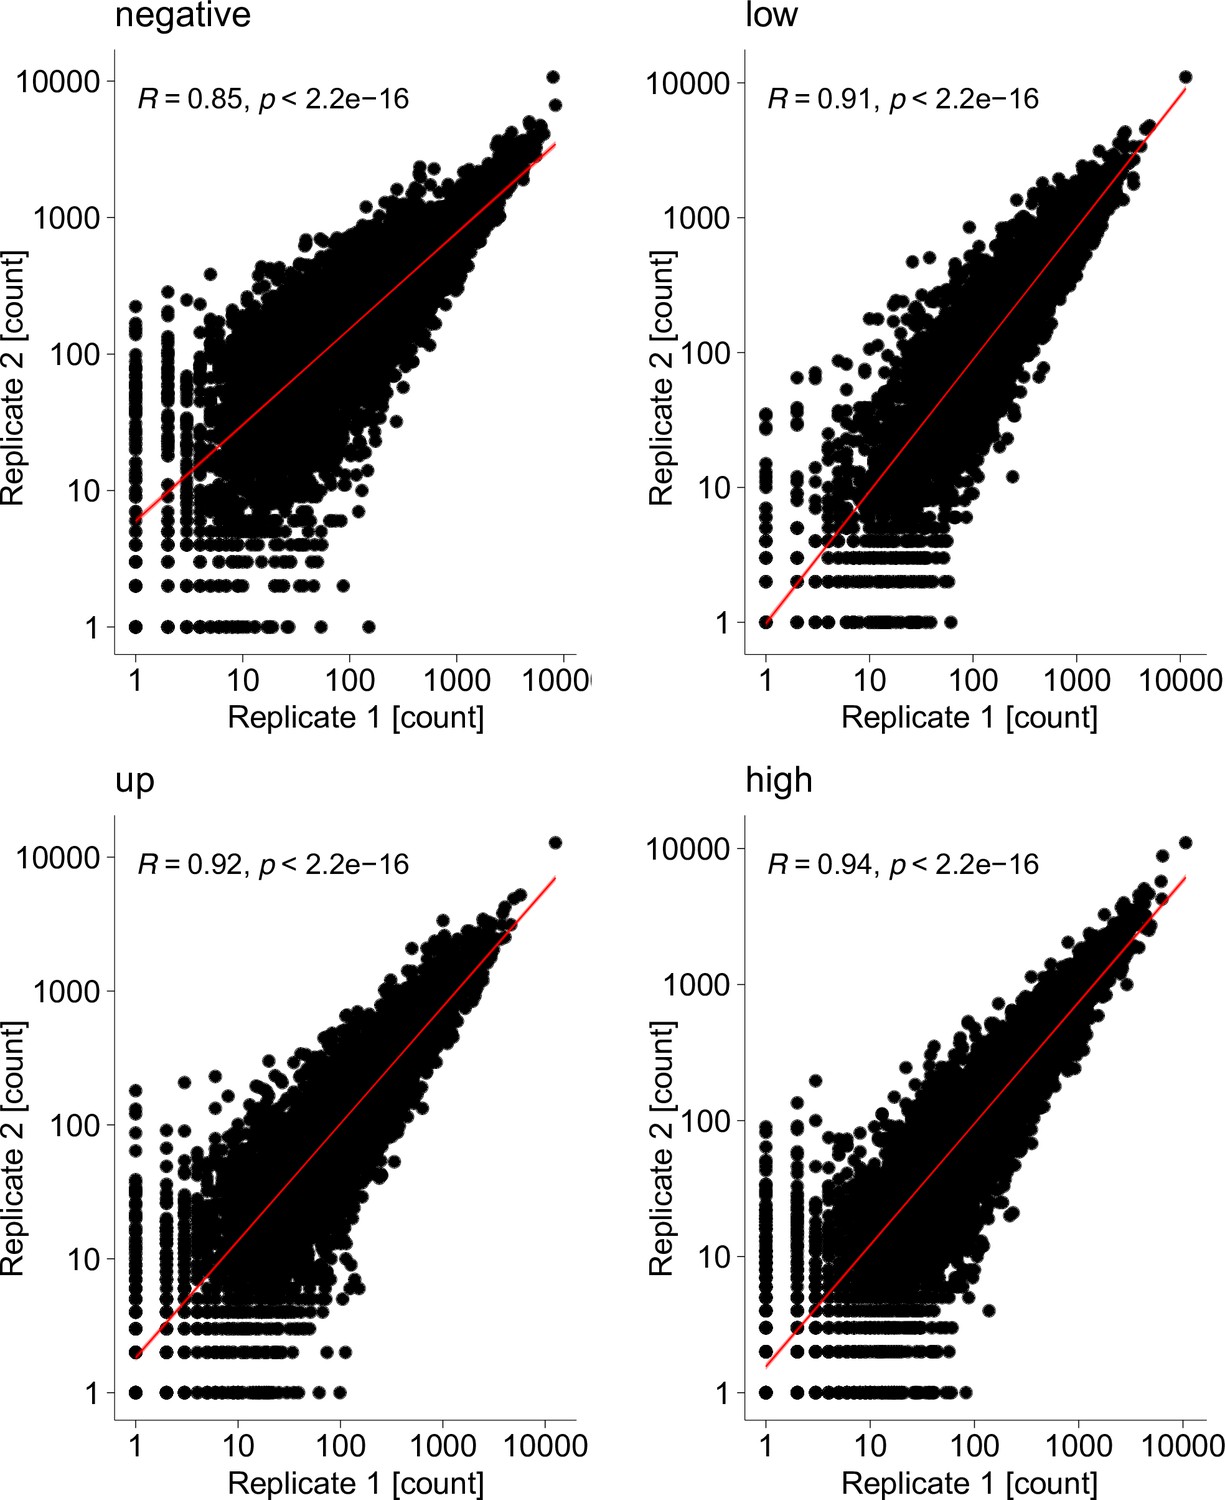
Surface fitness assay biological replicates.
Scatterplots show mapped read counts for each Kir2.1 variant in each replicate for different assay subpools. Spearman correlation coefficients are inset for each replicate pair. A linear model regression fit is shown as a red line.
Figure 2—figure supplement 3
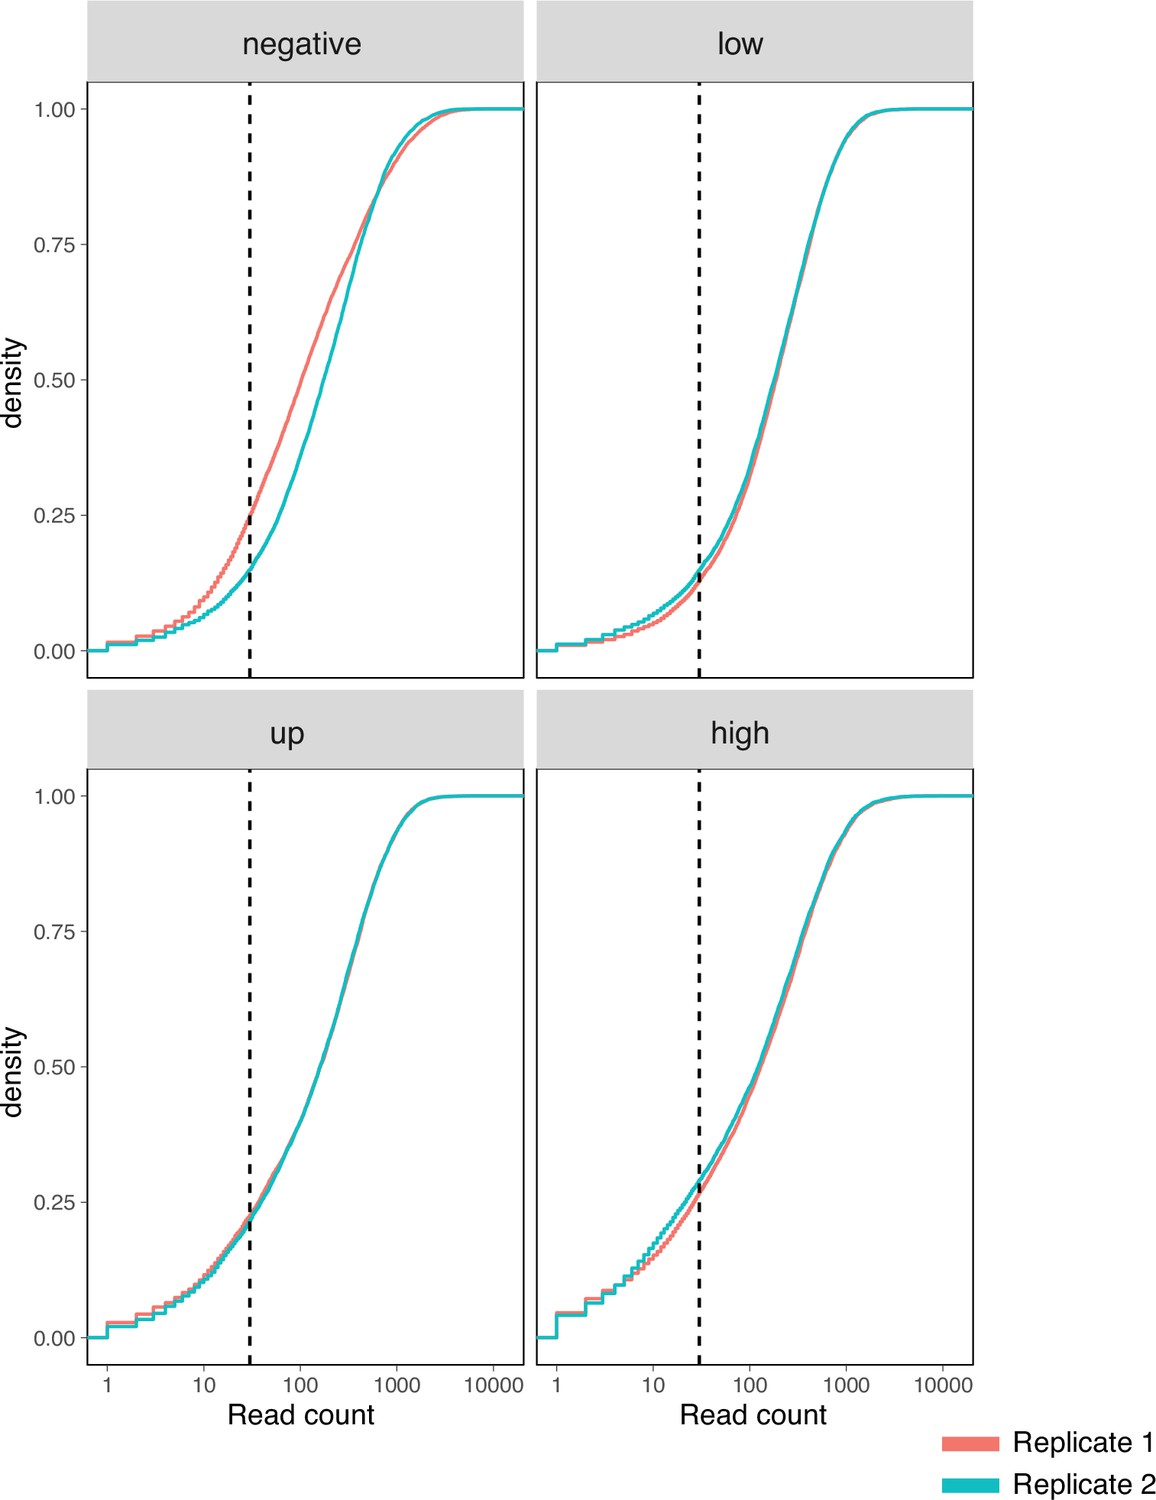
Surface fitness assay read count depth.
Cumulative density distribution of read counts for each replicate and assay condition subpool. Dashed vertical lines represent 30-fold coverage.
Figure 2—figure supplement 4
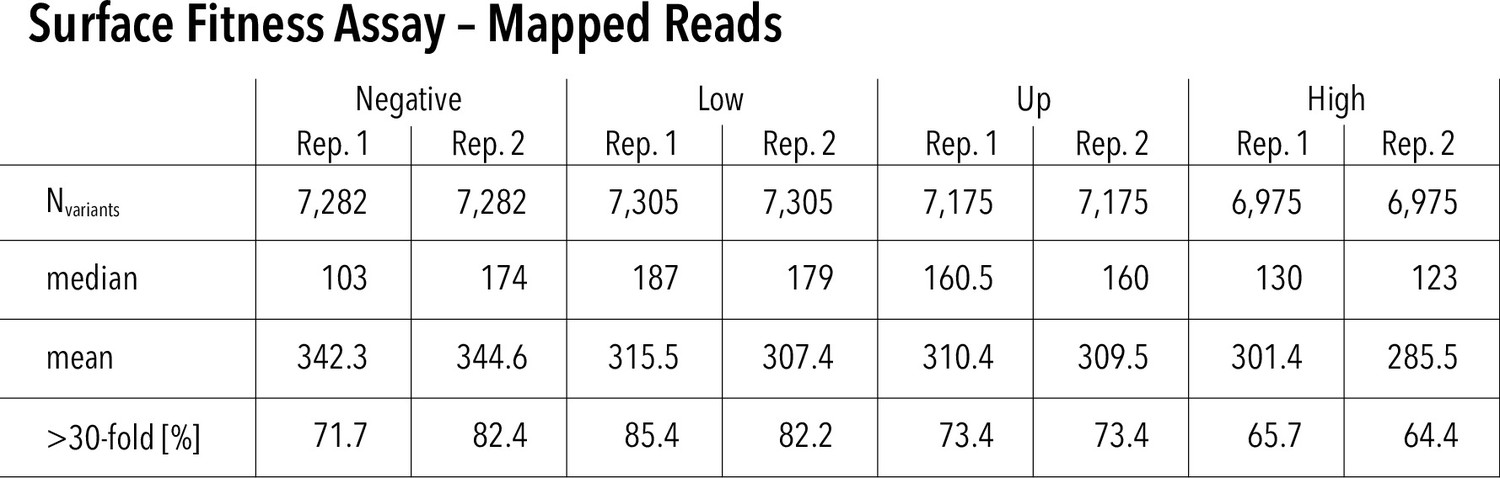
Surface assay read statistics and assay repeatability.
Mapped reads for each replicate and surface fitness assay subpool. Nvariants represented in each replicate (out of 7429 total), median read count per variant, mean read count per variant, and percentage of variants that have greater than 30-fold reach coverage.
Figure 2—figure supplement 5
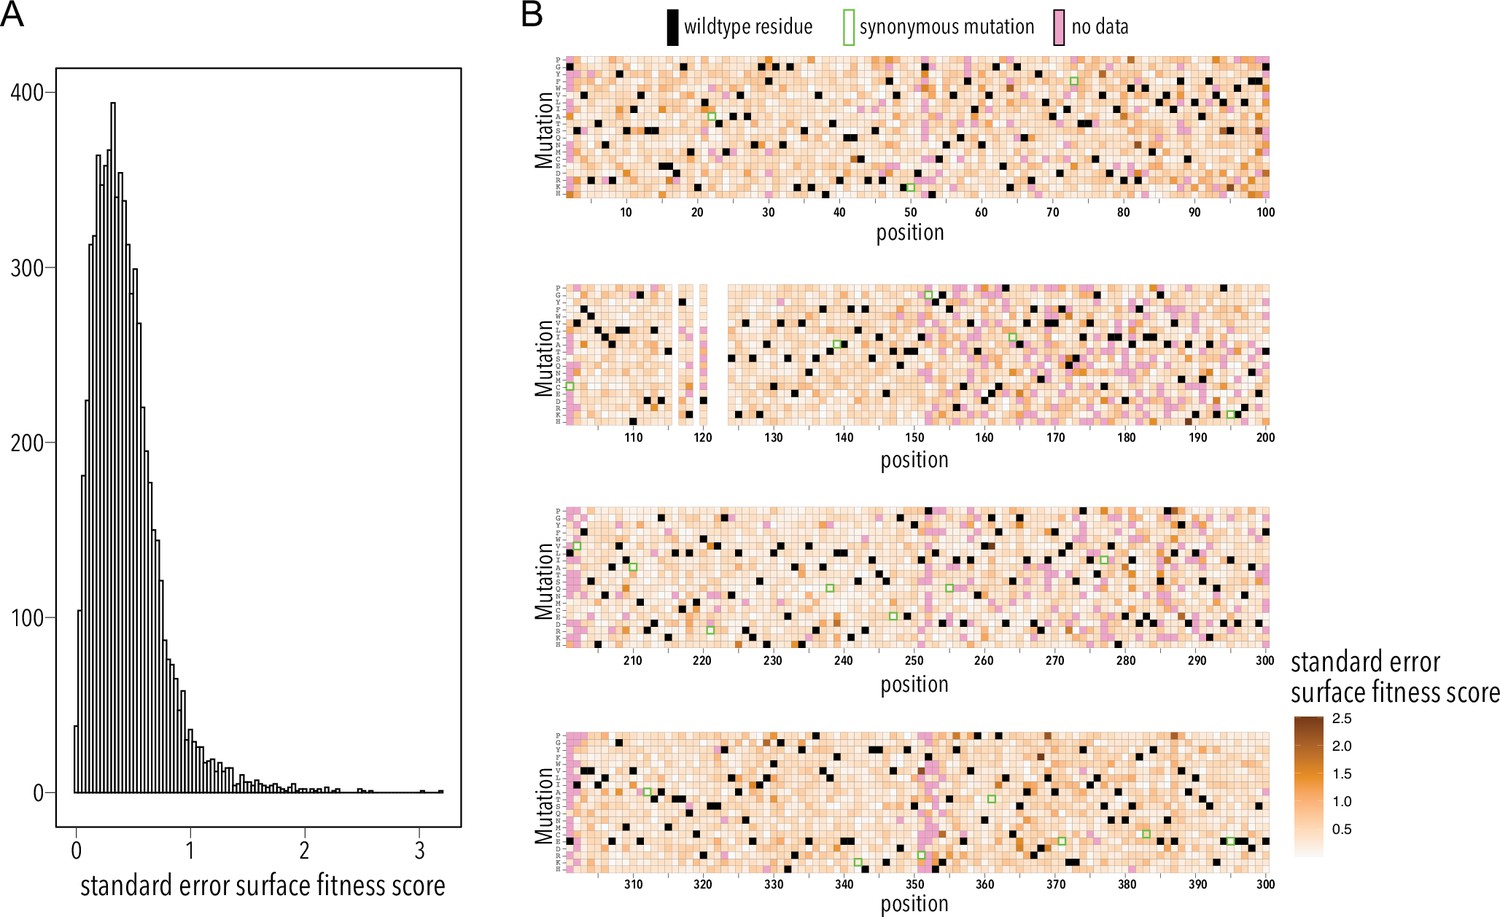
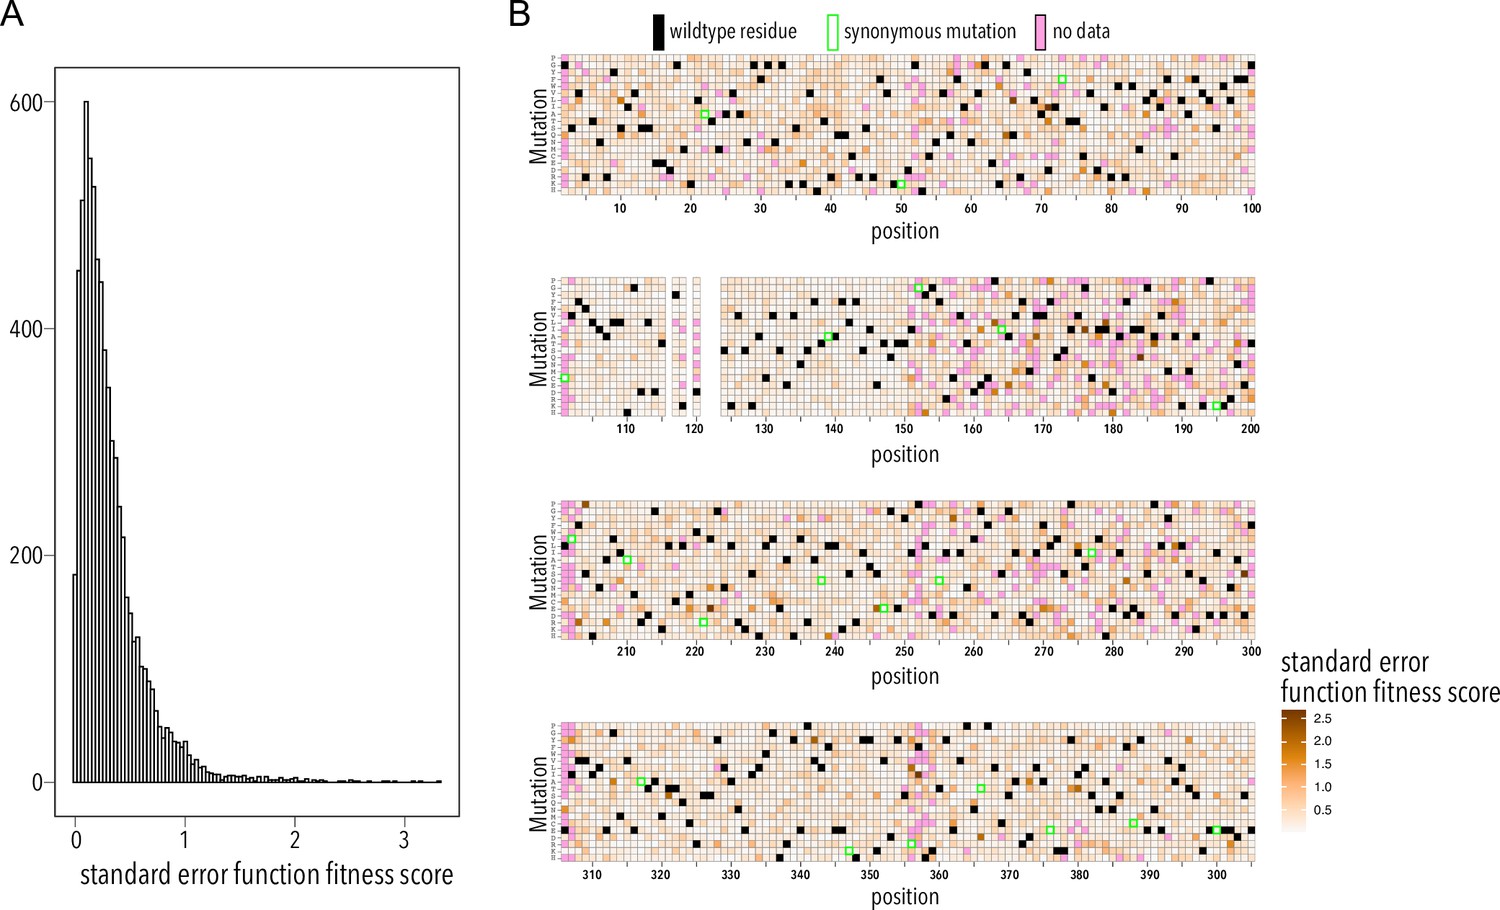
Surface fitness assay standard error distribution.
(A) Distribution of surface fitness score standard errors. (B) Heatmap showing surface fitness standard error (gradient white to brown) mapped to each position and mutation. Wildtype residues are shown as black boxes. Missing data is shown as magenta boxes. Synonymous mutations are indicated by a green outline.
Figure 3
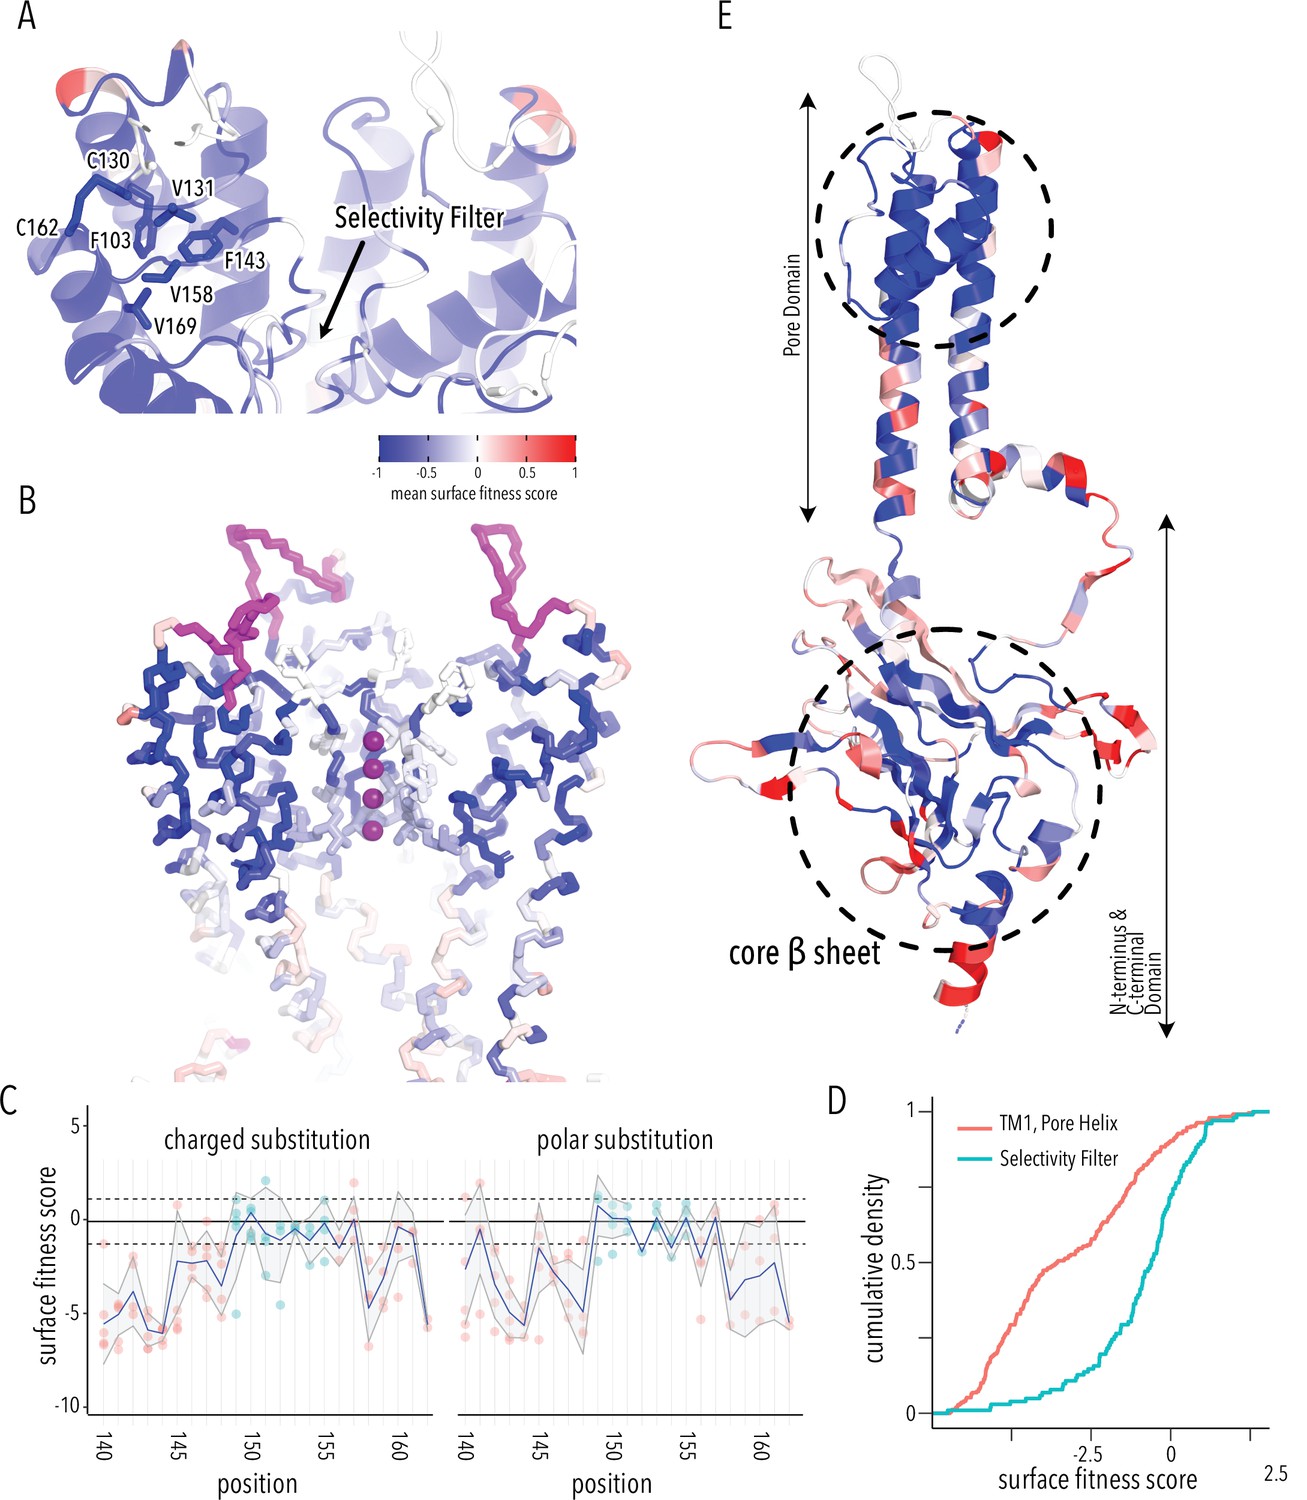
Determinants of improved surface expression and Kir2.1’s biogenic folding unit.
(A) Close-up of mean surface expression fitness scores in the pore domain. Residues that are part of the putative biogenic unit of Kir2.1 are shown as sticks. (B) Mean surface expression fitness of selectivity filter residues. K+ ions are shown as purple spheres. Regions with no data are shown in magenta. (C) Surface expression fitness of specific residues when replaced with charged (left panel) or polar residues (right panel). Selectivity filter residues are colored turquoise; neighboring residues are colored salmon. The solid horizontal line represents the median surface trafficking fitness of Kir2.1 synonymous mutations with dashed lines being ±1 SD. The gray-shaded ribbon represents a 90% confidence interval of mean surface fitness (n = 2–7) for each position (solid blue lines). (D) Cumulative density function of surface fitness score within the selectivity filter (turquoise line) and neighboring residues (salmon line). (E) Mean surface expression fitness scores mapped onto a single Kir2.1 monomer highlighting the importance of the biogenic folding unit in the pore domain and the core β-sheet of the C-terminal domain (CTD). All mapped mean surface fitness scores (averaged across all measured mutations for that position in A, B, and E) are represented as a gradient from blue over white to red, corresponding to below wildtype (WT), WT, and above WT fitness, respectively.
Figure 4 with 4 supplements
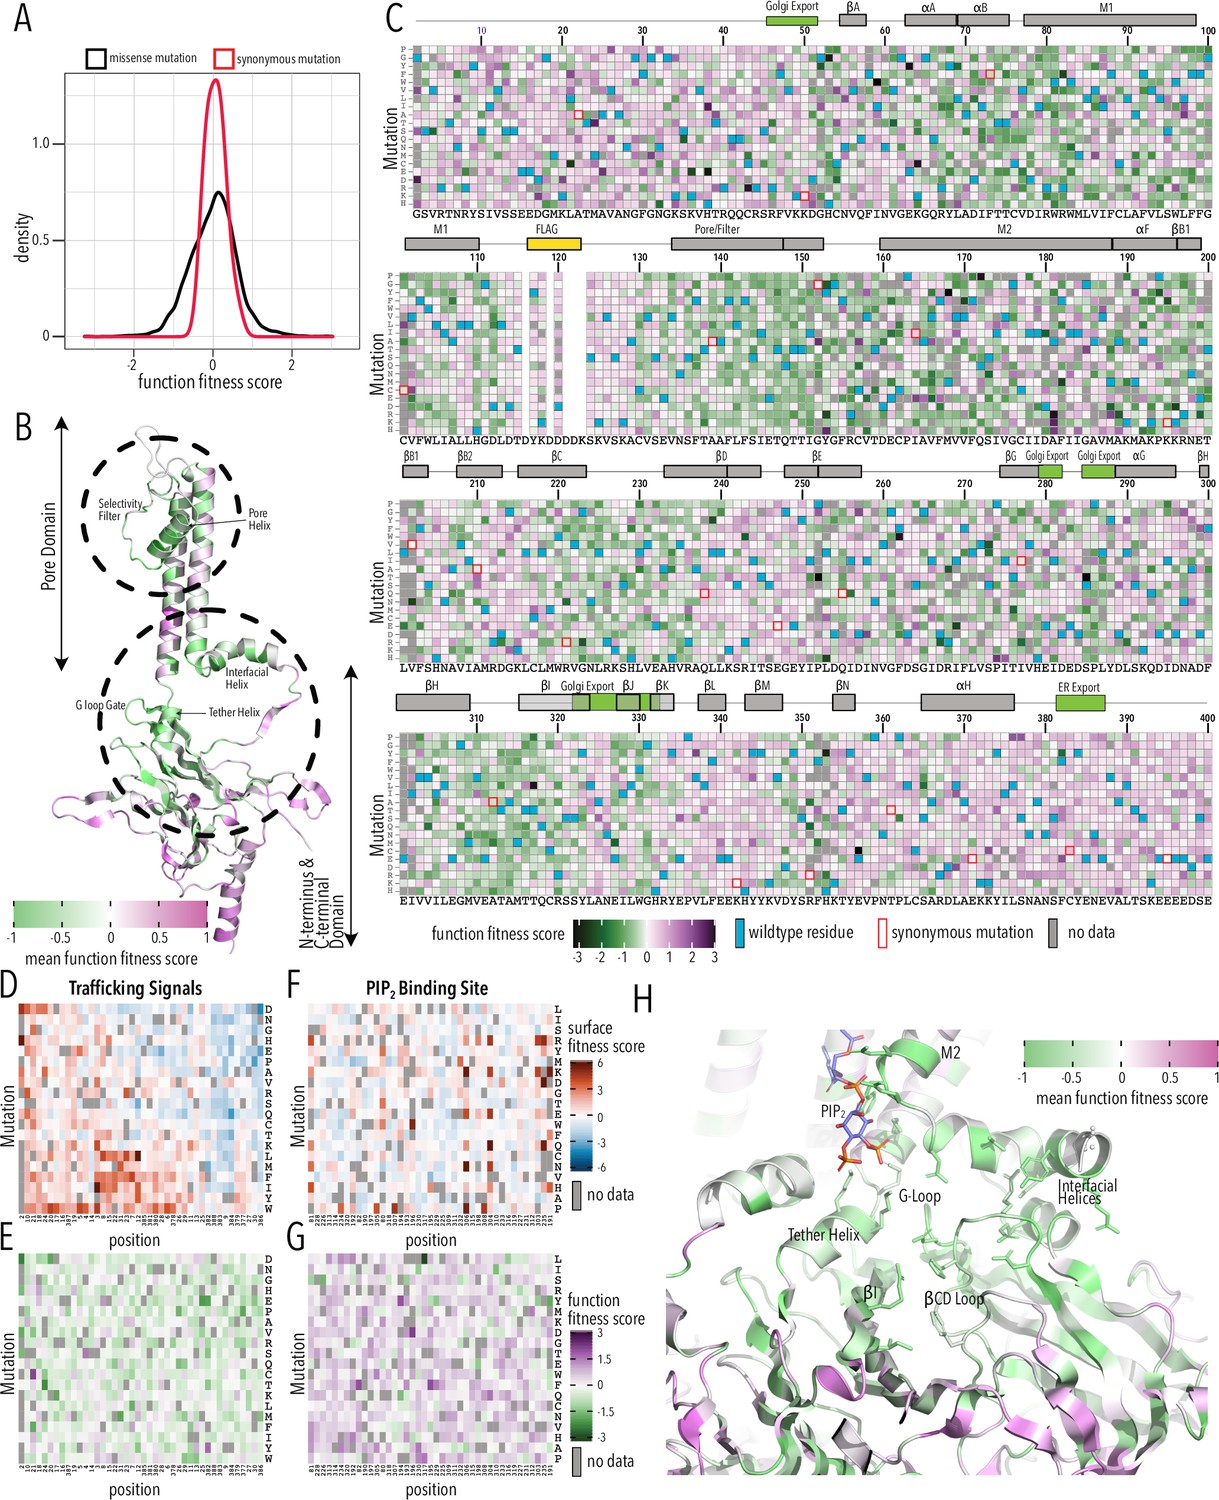
Function fitness.
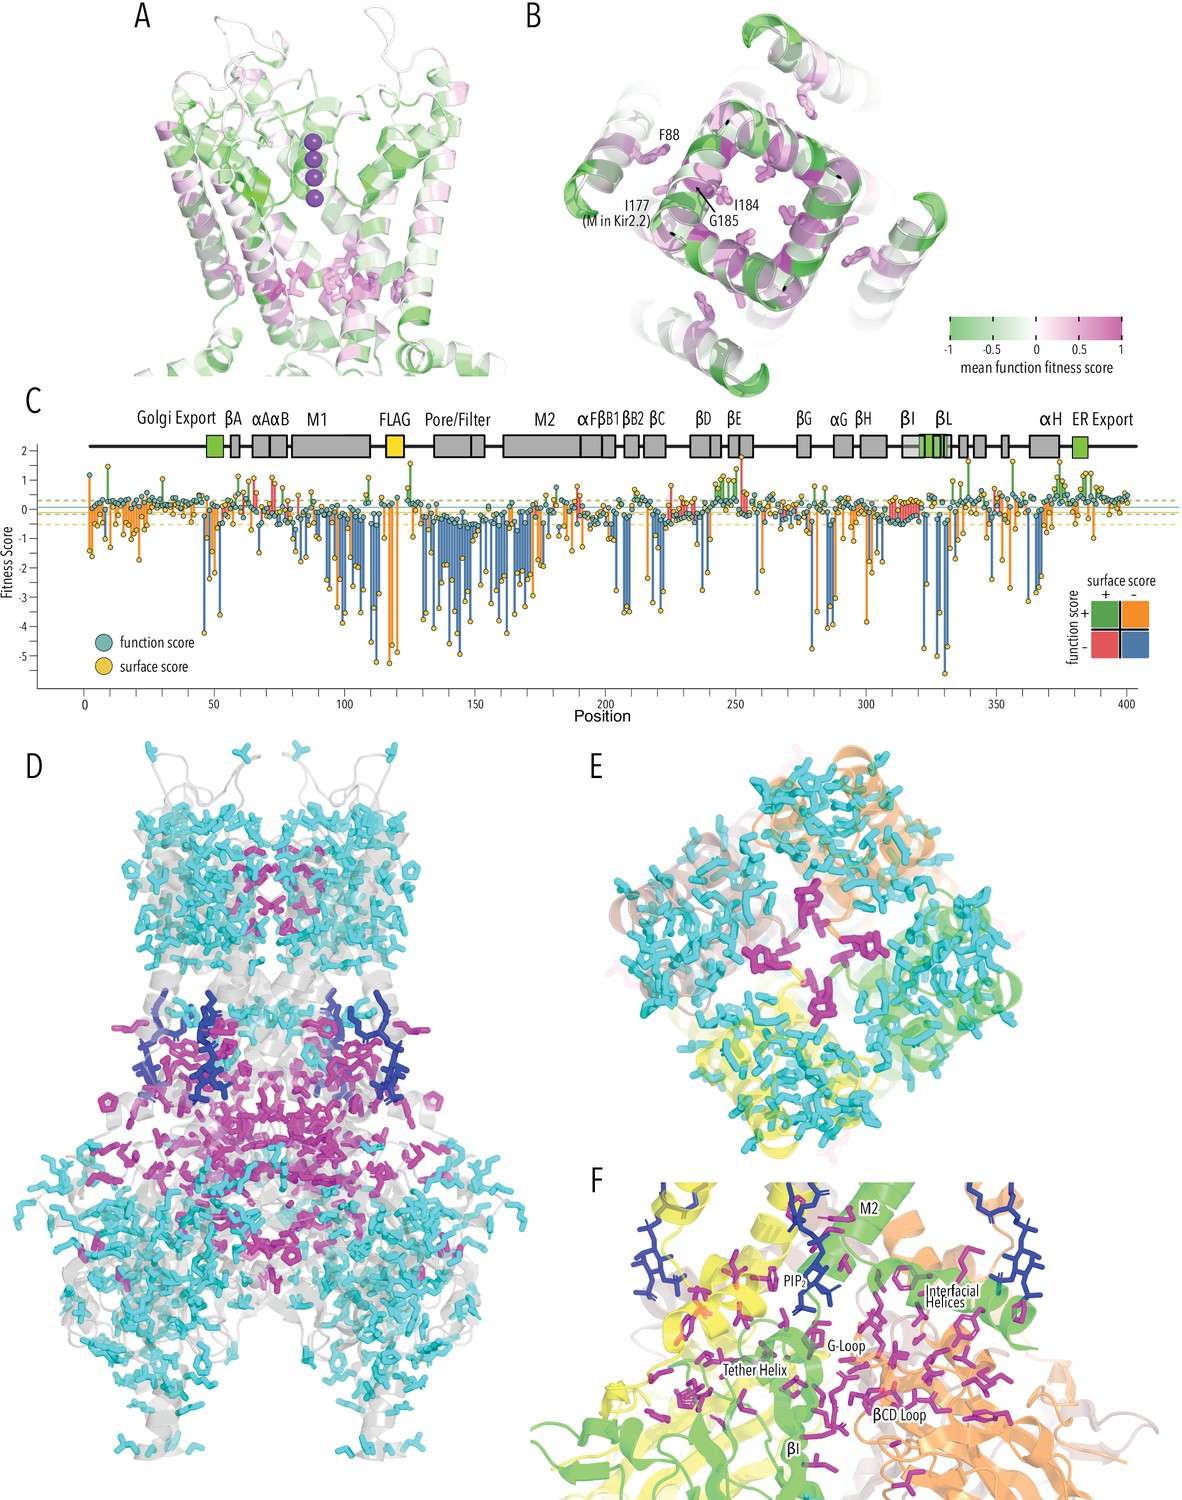
(A) Distribution of function expression fitness scores for synonymous mutations (red line) and missense mutations (black line). (B) Mean function fitness scores averaged across all measured mutations for that position mapped onto a single Kir2.1 monomer highlighting the importance of the pore helix, selectivity filter, and structural elements at the TM/C-terminal domain (CTD) interface (e.g., interfacial helix, tether helix, G-loop gate) for function. (C) Heatmap of function expression fitness scores. Wildtype (WT) residues are indicated by blue filled boxes. Missing data is indicated by filled dark gray boxes. Synonymous mutations are indicated by red box outlines. (D–G) Heatmap of fitness score in regions that contain bona fide trafficking signal (D, E; for surface and function scores, respectively) or the PIP2 binding site (F, G; for surface and function scores, respectively). (H) Close-up of function fitness at the TM/CTD interface. Allosteric ligand PIP2 is shown as sticks. Surface fitness in (D, F) is represented as a gradient from dark blue over white to dark red, while function fitness in B, C, E–H is represented as a gradient from green over white to magenta. Both gradient colors order corresponds to below WT, same as WT, and above WT fitness, respectively.
Figure 4—figure supplement 1
Function fitness assay biological replicates.
Scatterplots show mapped read counts for each Kir2.1 variant in each replicate for different assay subpools. Spearman correlation coefficients are inset for each replicate pair. A linear model regression fit is shown as a red line.
Figure 4—figure supplement 2
Function fitness assay biological replicates.
Cumulative density distribution of read counts for each replicate and function assay condition subpool. Dashed vertical lines represent 30-fold coverage.
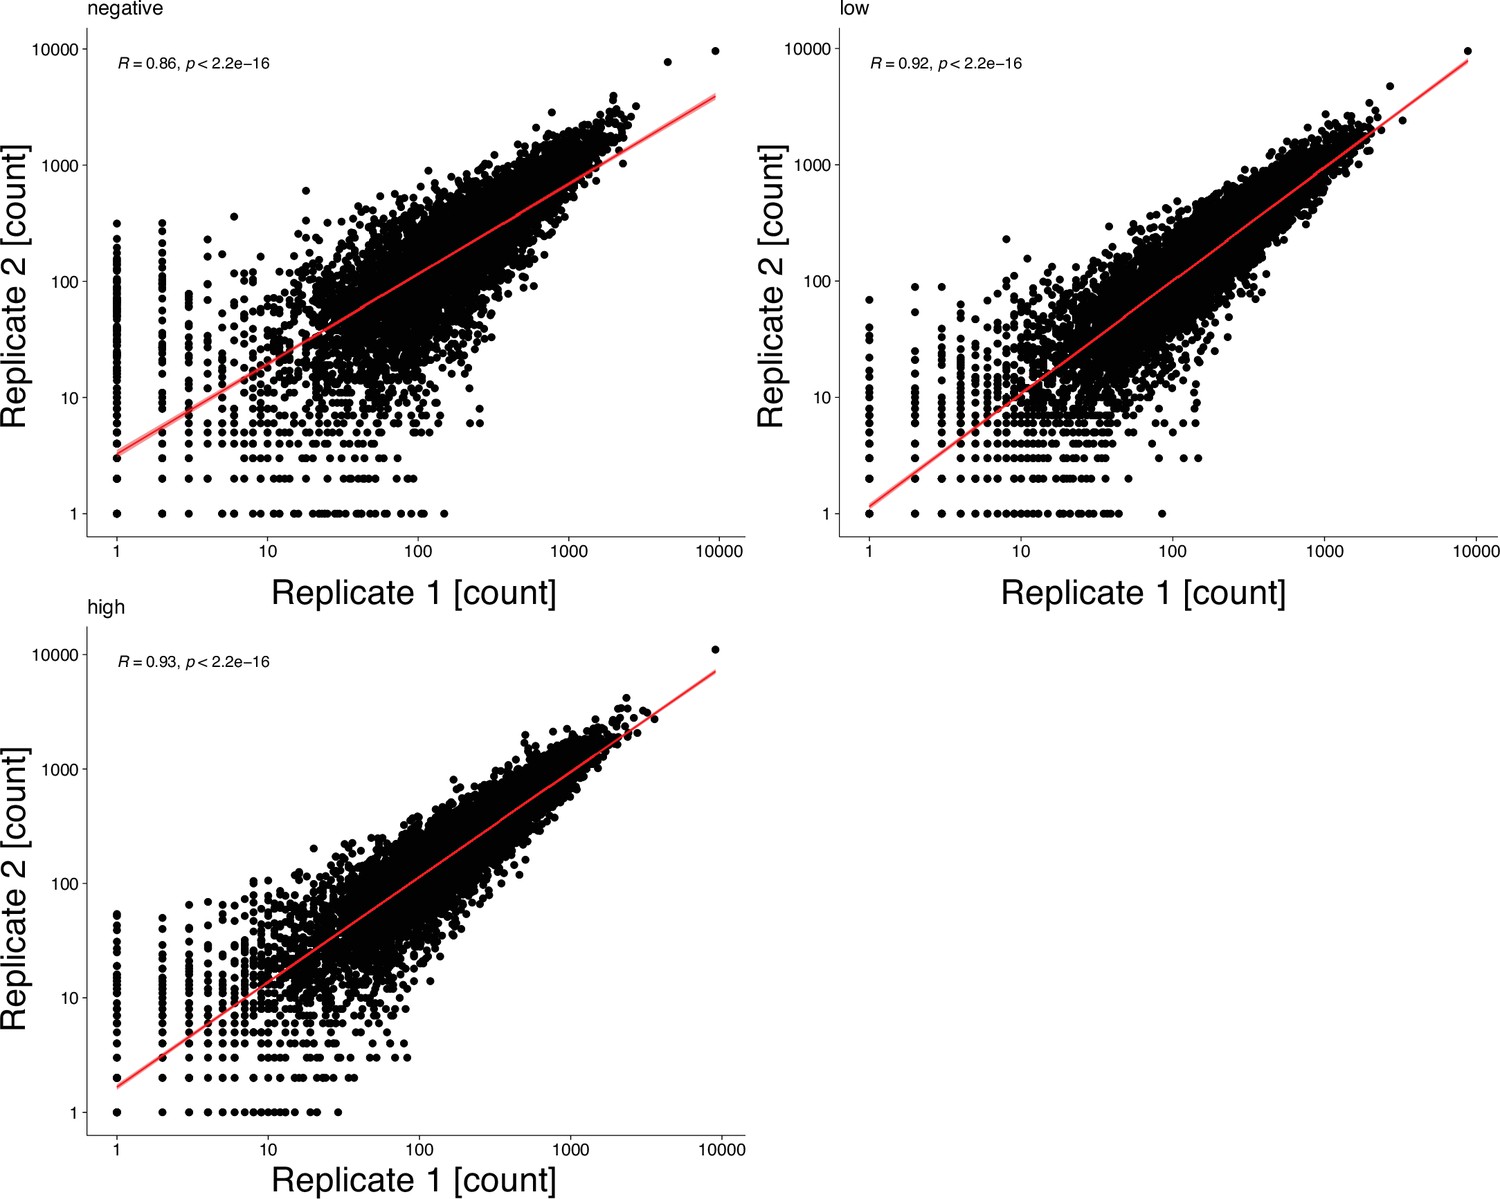
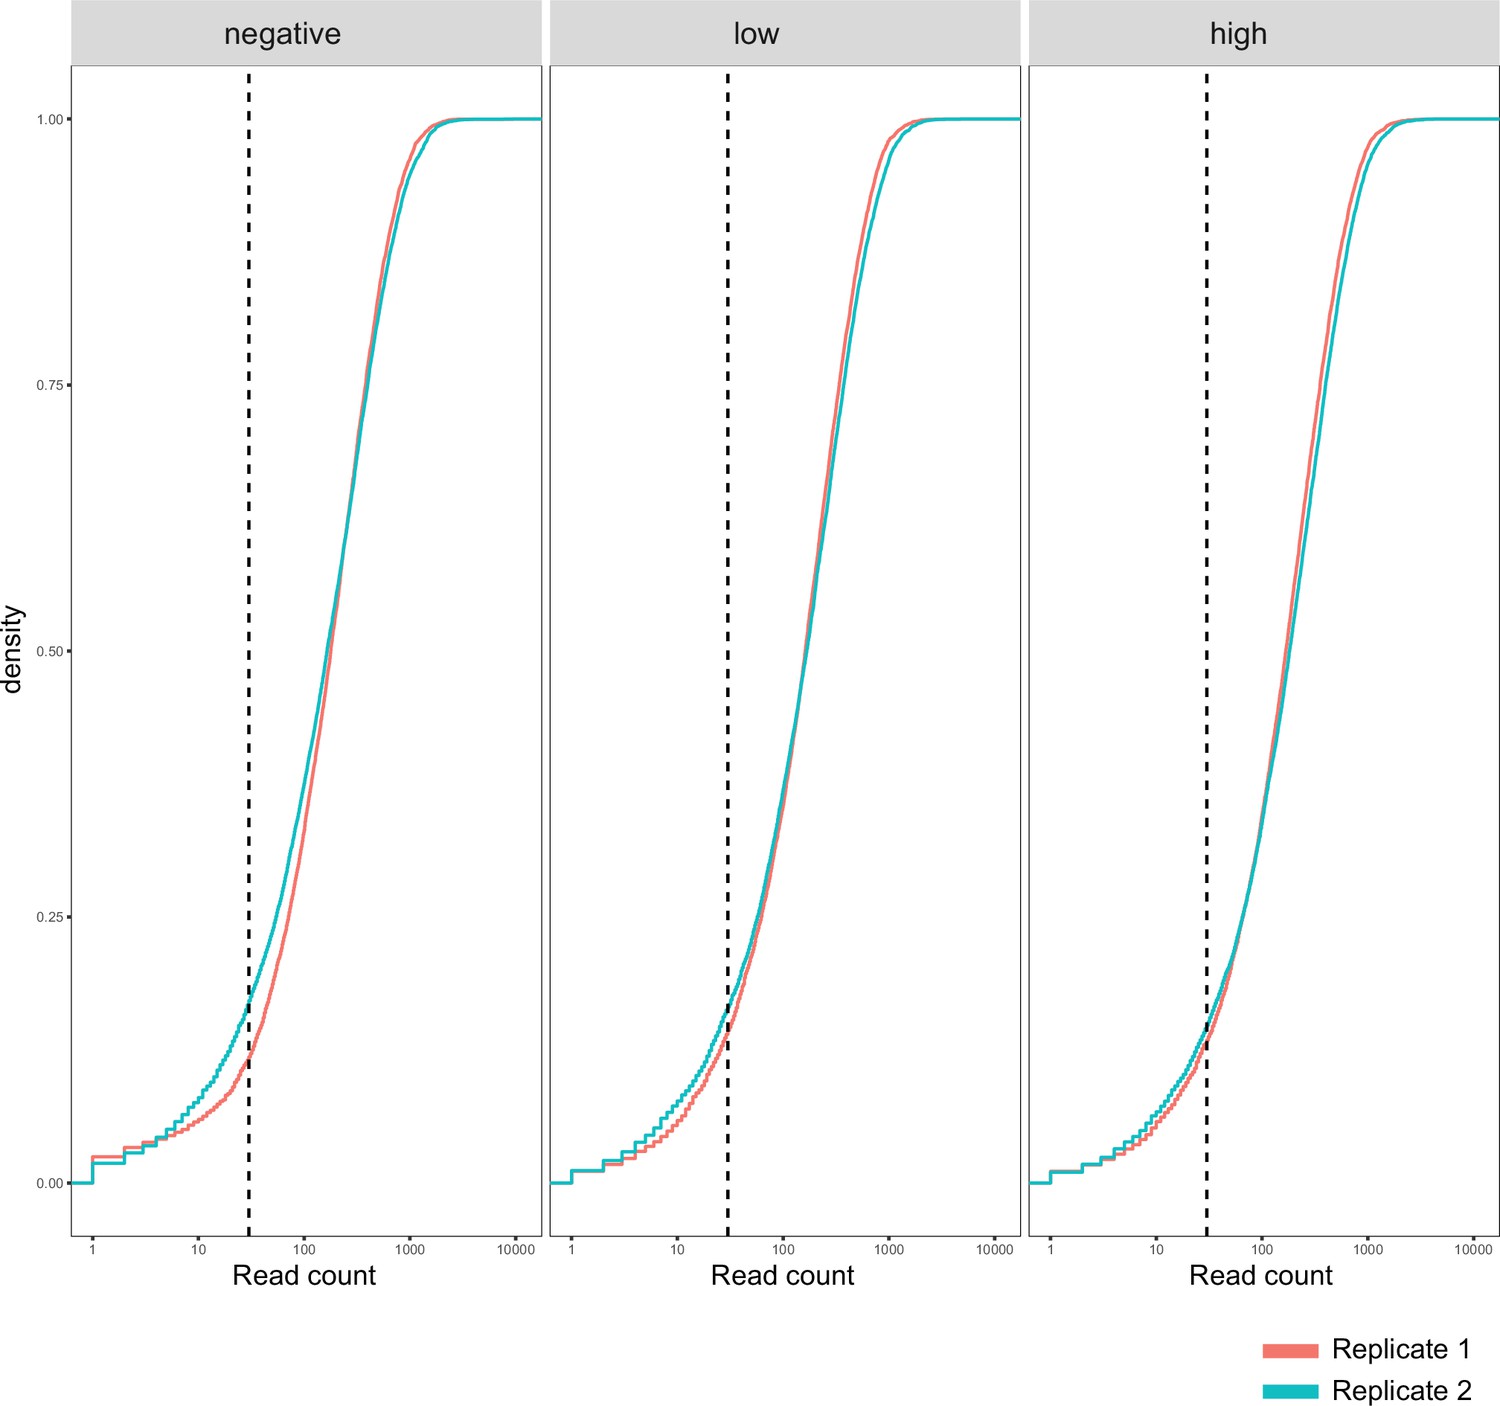
Figure 4—figure supplement 3
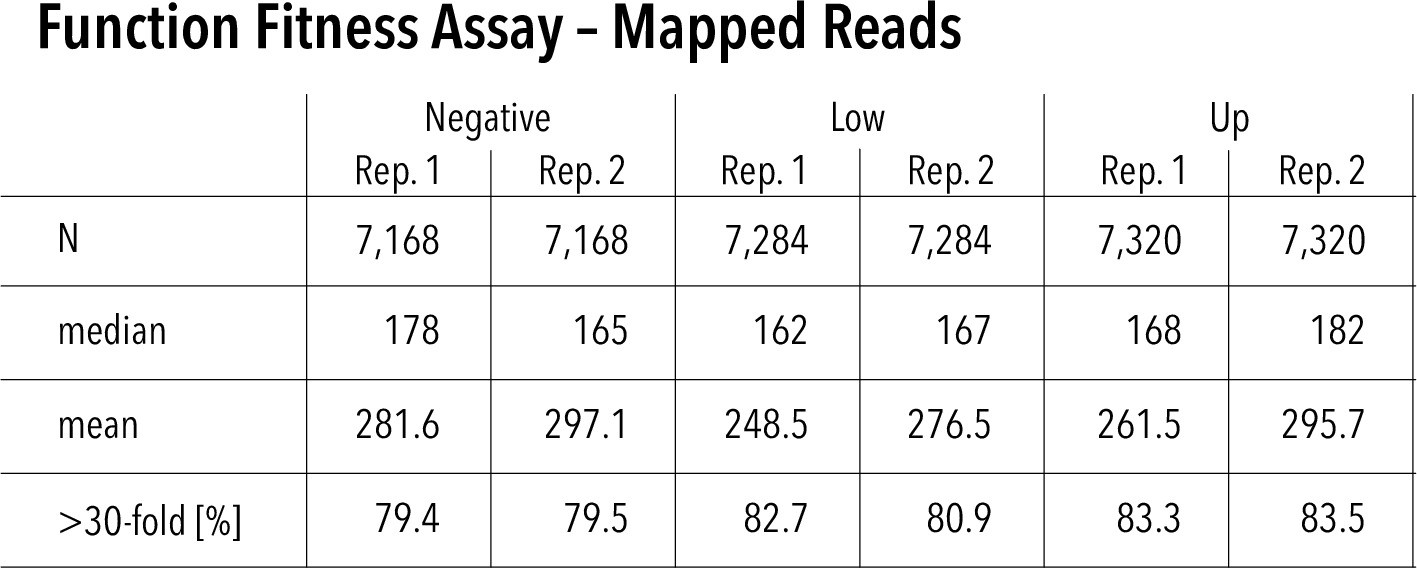
Function assay read statistics and assay repeatability.
Mapped reads for each replicate and function fitness assay subpool. Nvariants represented in each replicate (out of 7429 total), median read count per variant, mean read count per variant, and percentage of variants that have greater than 30-fold reach coverage.
Figure 4—figure supplement 4
Function fitness assay standard error distribution.
(A) Distribution of surface fitness score standard errors. (B) Heatmap showing surface fitness standard error (gradient white to brown) mapped to each position and mutation. Wildtype residues are shown as black boxes. Missing data is shown as magenta boxes. Synonymous mutations are indicated by a green outline.
Figure 5 with 1 supplement
HBC gate mutations and regions with distinct roles in stability and function.
(A) Function fitness (averaged across all measured mutations for that position) in the pore domain represented as a gradient from green over white to magenta, corresponding to below wildtype (WT), same as WT, and above WT fitness, respectively. One subunit is removed for clarity. K+ ions in the selectivity filter are shown as purple spheres. Sidechains of residues that are enriched for activating mutations are shown as sticks. (B) Detailed view of the HBC gate. Numbering corresponds to Kir2.1-Flag. (C) Surface fitness (orange circles) and function fitness (teal circles) for each position. The line length between each score represents the score difference and line color represents sign combination of both scores (both negative; one negative, one positive; etc.). Vertical solid and dashed lines represent median scores ±1 SD of synonymous Kir2.1 mutations for surface fitness (orange) and function fitness (teal). Kir2.1 secondary structural element are shown as gray boxes; trafficking signals are colored green. (D–F) Residues with significant function/surface fitness score differences are mapped onto the Kir2.2 structure (PBD 3SPI). Residues with mutations that predominantly reduced function are shown in magenta. Residues with mutations that predominantly reduced surface expression are shown in cyan. PIP2 is shown in blue. Overview (D), close-ups of selectivity filter (E), and TM/C-terminal domain (CTD) (F).
Figure 5—figure supplement 1
Comparison of intra- vs. intersubunit contact fitness scores.
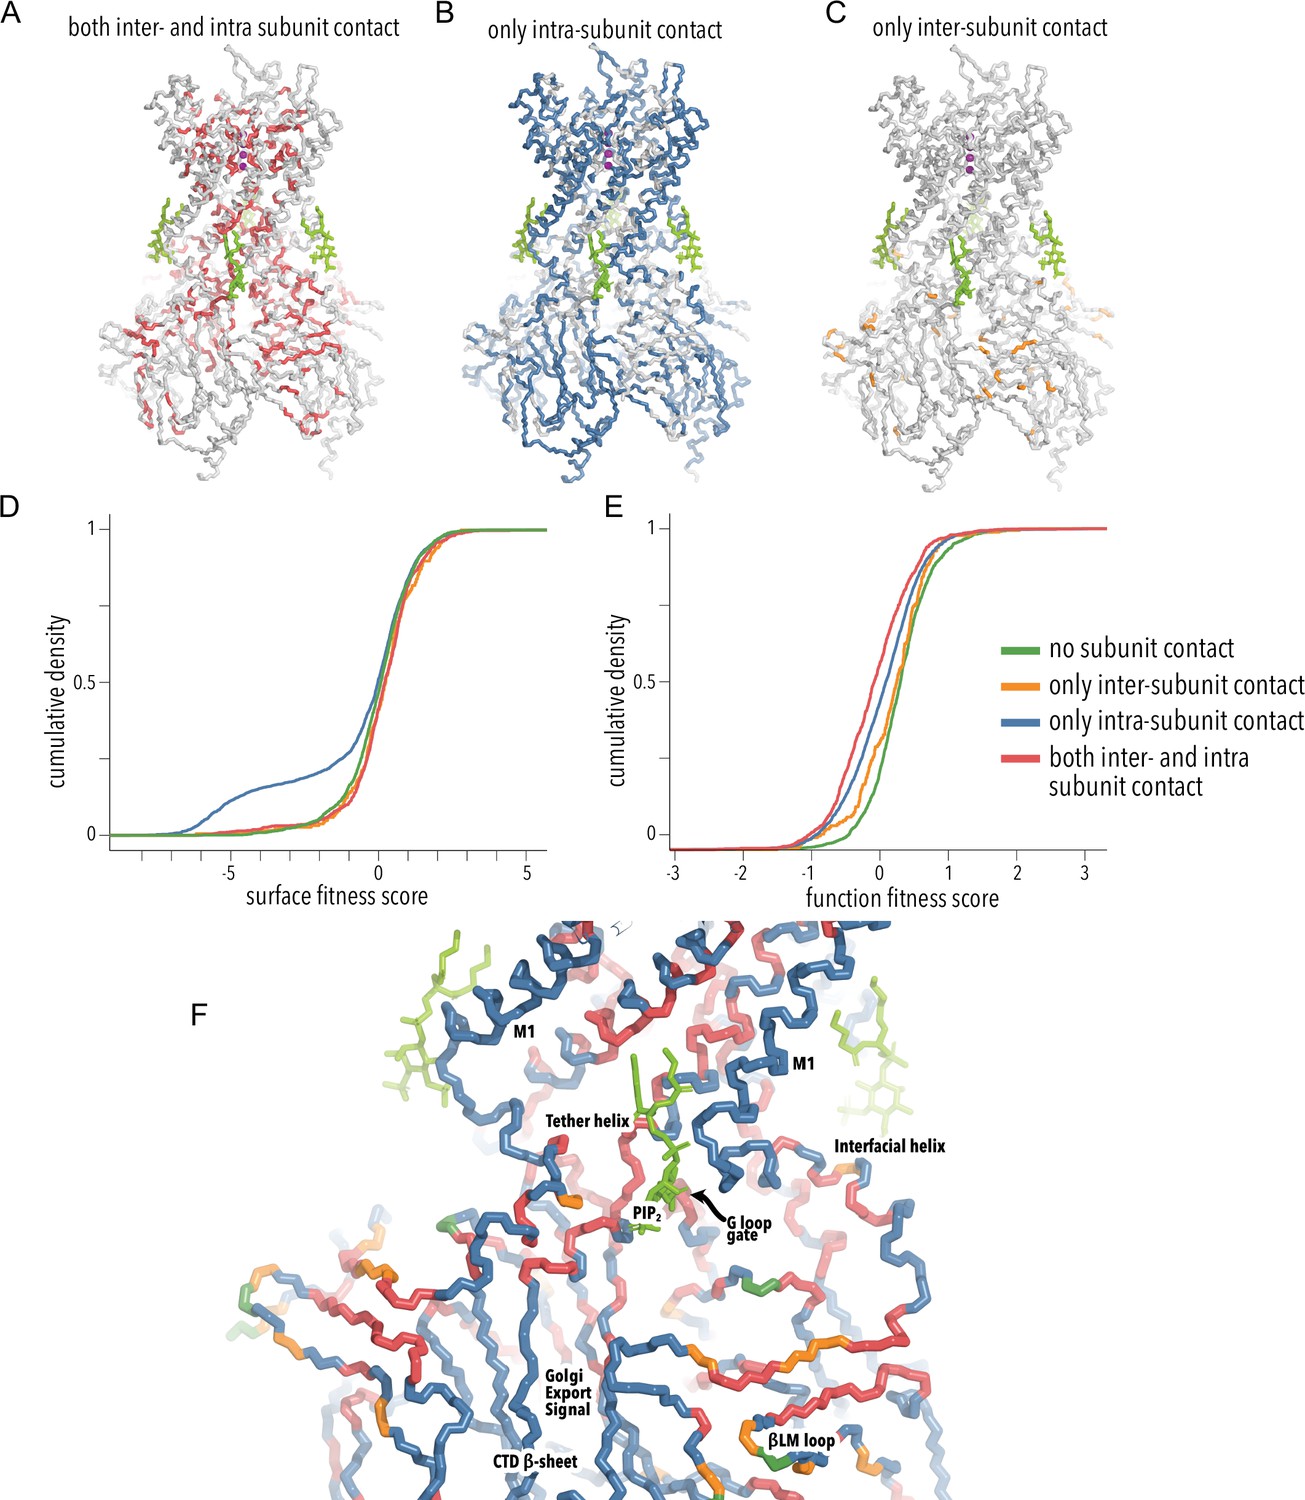
(A–C) Cartoon of Kir2.2 (PDB 3SPI) with residues colored by subunit contact-type category. Residues that participate in both intra- and intersubunit contacts (A), residues that make only intrasubunit contacts (B), and residues that make only intersubunit contacts (C). (D, E) Cumulative density functions of surface scores (D) and function scores (E) for variants of C-terminal domain (CTD) residues in different subunit contact-type categories (represented by line color). (F) Close-up of the TM/CTD regions shown as a main chain trace. Residues are colored by subunit contact category (see D and E). PIP2 ligand is shown as green sticks.
Figure 6
Comparison to prior studies.
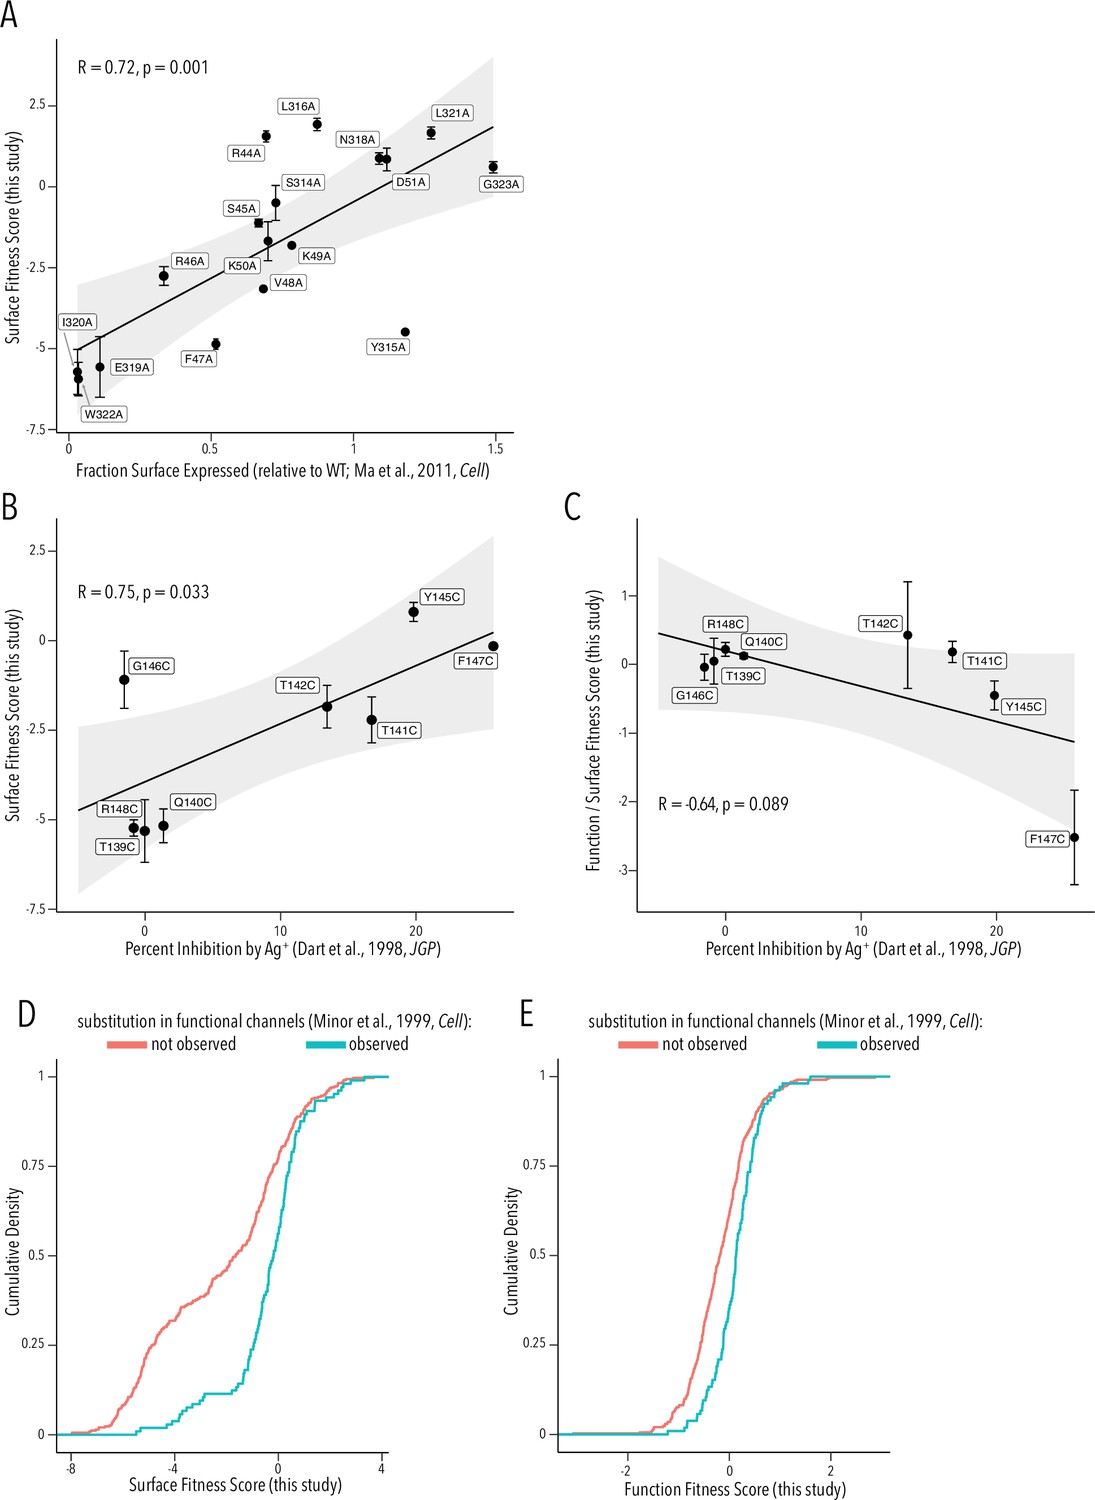
(A) Scatterplot of surface-expressed fraction (compared to Kir2.1) for alanine mutants tested in Ma et al., 2011 vs. their corresponding surface fitness score measured in this study. (B, C) Scatterplot of Ag+-mediated Kir2.1 inhibition report in Dart et al., 1998 vs. their corresponding surface fitness score (B) or surface fitness-normalized function score (C) measured in this study. For (A–C), the solid black line represents a linear regression with the gray-shaded ribbon being the 95% confidence interval. Pearson correlation coefficient and p-value are shown in inset. Numbering corresponds to Kir2.1-Flag. (D, E) Cumulative density function of surface scores (D) or function scores (E) for observed substitution (teal line) or not observed substitutions (red line) in Minor et al., 1999. All error bars represent Enrich2-calculated weighted-least-squares regression standard error.
Figure 7 with 1 supplement
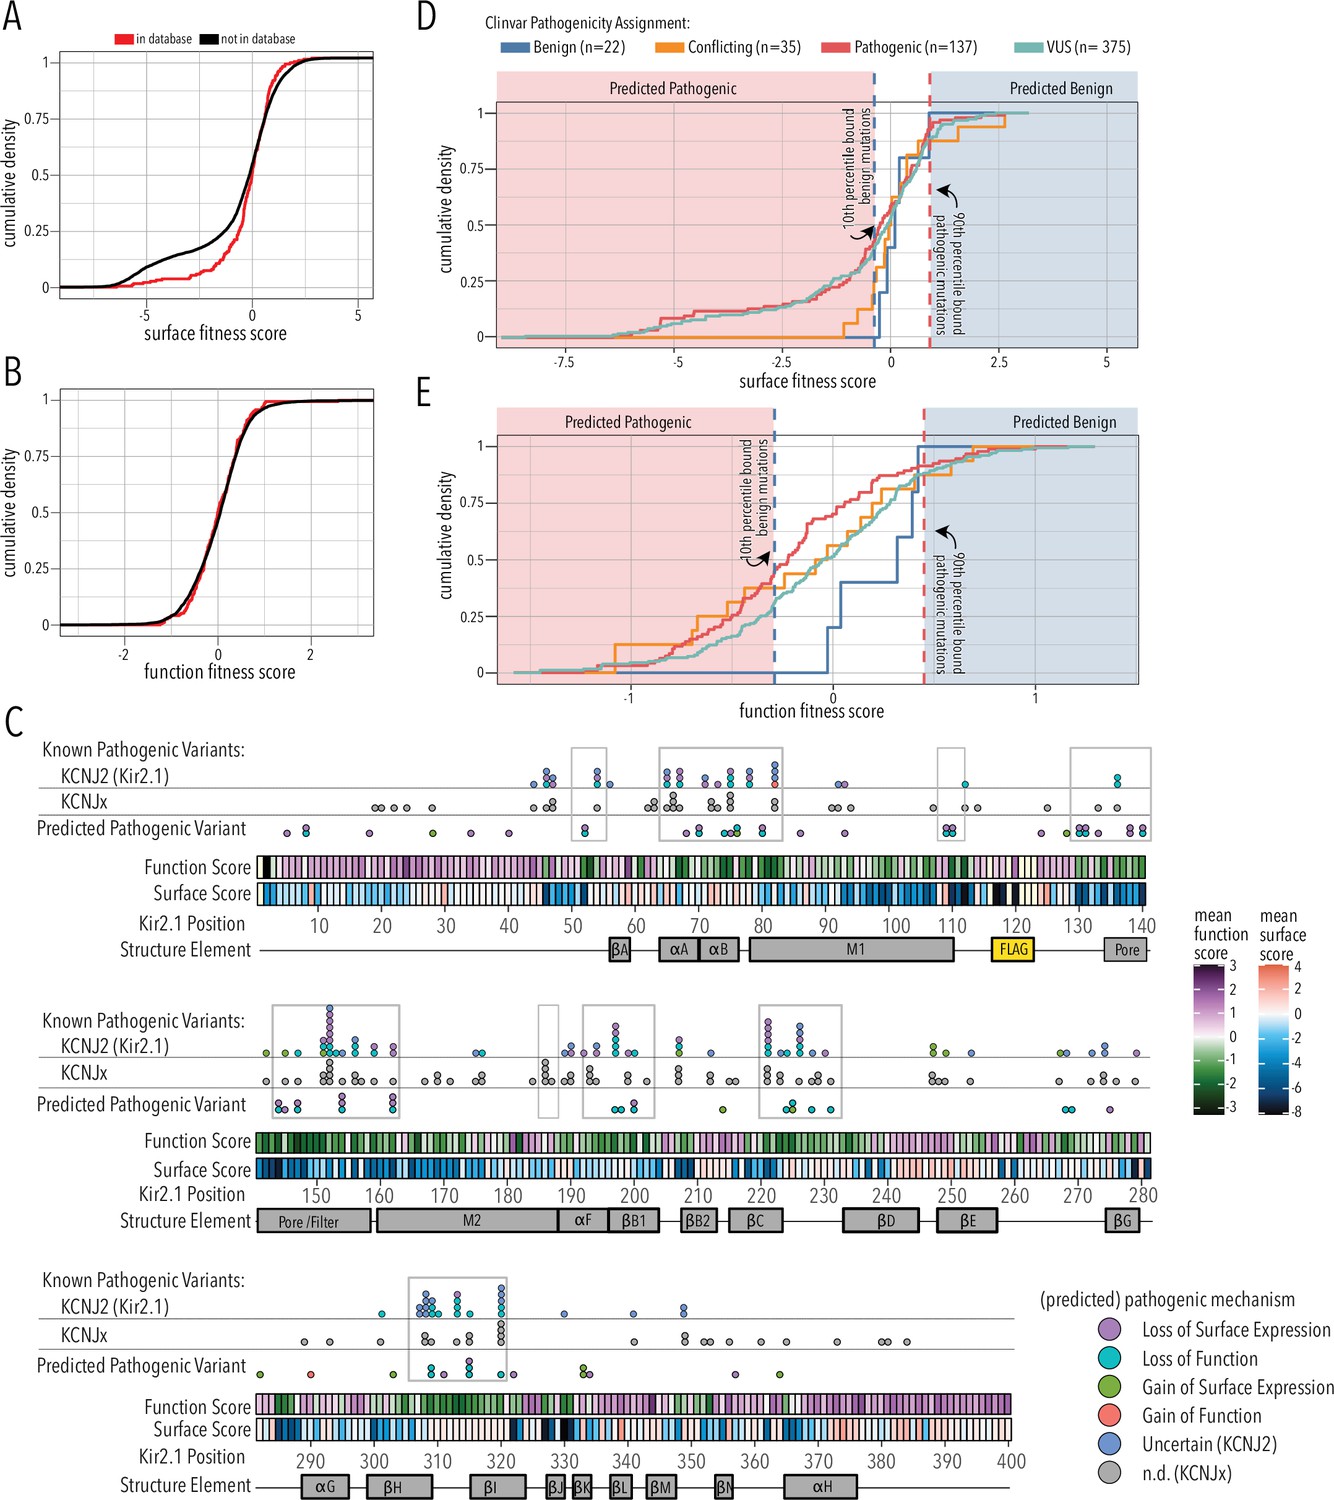
Folding and trafficking variants in clinical databases.
Cumulative distributions of surface (A) or function (B) fitness scores for variants that are represented in ClinVar and gnomAD (red line) or that are not (black line). (C) Line plot by position of mean function or surface fitness scores. Fitness scores below wildtype (WT), same as WT, and above WT fitness are represented as a gradient from dark blue over white to dark red for surface fitness and green over white to magenta for function fitness, respectively. Kir2.1 secondary structural elements are shown as gray boxes. In the top row, known pathogenic variants in Kir2.1 (KCNJ2) are mapped as circles filled with color indicating predicted pathogenic mechanism determined in this study. In the row below, known pathogenic mutations in other Kir (KCNJx) are mapped as gray circles. In the third row, reported variant of unknown significance (VUS) are mapped as circles filled with color indicating predicted pathogenic mechanism determined in this study. Mutation hotspots are indicated by gray outlines. (D, E) Distribution of surface fitness (D) and function fitness (E) by ClinVar pathogenicity assignment (represented as line color; ‘Conflicting’ means some studies interpreted a variant as benign, others as pathogenic). Vertical dashed lines represent 10th and 90th percentile boundaries of expert reviewed benign variants (blue) and pathogenic variants (blue), respectively. Variants with score below the 10th percentiles of known benign variant bound are predicted to be pathogenic (shaded red zone), while variants above the 90th percentile of known pathogenic variants are predicted to be benign (shaded blue zone).
Figure 7—figure supplement 1
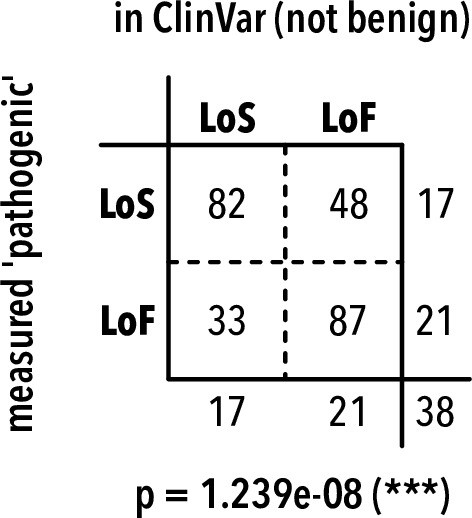
Pathogenic variant frequency tables.
Frequency of predicted pathogenic variants in ClinVar (including KCNJ2 and KCNJx with equivalent residues) and measured in this study. LoS, loss of surface expression; LoF, loss of function. Two-sided Fisher’s exact test p-value is shown below the table. The odds ratio is of predicting LoS for measured variants in this study vs. ClinVar is 4.47, suggesting that LoS variants are underrepresented in ClinVar.
Additional files
-
Supplementary file 1
Inward rectifier missense variants in ClinVar and gnomAD (as of March 25, 2022).
Inward rectifier variants listed in ClinVar and gnomAD along with their expert-reviewed clinical significance (if any). For variants in genes other than KCNJ2 (i.e., KCNJx), the corresponding Kir2.1 residue, Kir2.1-Flag residue, and amino are listed (‘kir21_resno,’ ‘kir21_FLAG_resno,’ ‘kir21_resid,’ respectively). If the residue in KCNJx is equivalent to KCNJ2, the ‘KCNJx_eq_KCNJ2’ column is flagged ‘1,’ and ‘0’ if the residue is different.
- https://cdn.elifesciences.org/articles/76903/elife-76903-supp1-v2.csv
-
Supplementary file 2
Protein Contact Atlas/residue–residue interactions.
Residue interaction as identified in the Protein Contact Atlas (Kayikci et al., 2018) for the closed state (PDB 3SPI) and the forced-open state (PDB 6M84) of chicken Kir2.2. Listed for each contact: chains, secondary structure, residue number, amino acid, atom types, chain types, distance (in Angstrom), and contact type.
- https://cdn.elifesciences.org/articles/76903/elife-76903-supp2-v2.csv
-
Supplementary file 3
Predicted phenotype of KCNJ2 variants of unknown significance.
For KCNJ2 variants listed in ClinVar (as of March 25, 2022) with unknown significance or conflicting interpretation, we predicted mechanism underlying the variants disease phenotype: 'lof_s': loss of surface expression; 'gof_s': gain of surface expression; 'lof_f': loss of function (conduction); 'gof_f': gain of function (conduction).
- https://cdn.elifesciences.org/articles/76903/elife-76903-supp3-v2.csv
-
Supplementary file 4
Predicted mechanism of pathogenic/conflicting interpretation inward rectifier variants.
For all inward rectifier variants listed in ClinVar (as of March 25, 2022) with pathogenic or conflicting interpretation, we predicted mechanism underlying the variants disease phenotype (‘predicted_phenotype’): 'lof_s': loss of surface expression; 'gof_s': gain of surface expression; 'lof_f': loss of function (conduction); 'gof_f': gain of function (conduction).
- https://cdn.elifesciences.org/articles/76903/elife-76903-supp4-v2.csv
-
Supplementary file 5
NextGen Sequencing (NGS) read and alignment statistics.
Read statistics for each sequenced variant pool (‘sample’). ‘Unexpected/expected mutations’ is the fraction of mutations that was not encoded in the OLS pool; only expected mutations were used in the analysis.
- https://cdn.elifesciences.org/articles/76903/elife-76903-supp5-v2.csv
-
Transparent reporting form
- https://cdn.elifesciences.org/articles/76903/elife-76903-transrepform1-v2.pdf
-
Source data 1
Processed data and scripts to reproduce manuscript figures.
- https://cdn.elifesciences.org/articles/76903/elife-76903-data1-v2.zip
Download links
A two-part list of links to download the article, or parts of the article, in various formats.
Downloads (link to download the article as PDF)
Open citations (links to open the citations from this article in various online reference manager services)
Cite this article (links to download the citations from this article in formats compatible with various reference manager tools)
Determinants of trafficking, conduction, and disease within a K+ channel revealed through multiparametric deep mutational scanning
eLife 11:e76903.
https://doi.org/10.7554/eLife.76903


