Target binding triggers hierarchical phosphorylation of human Argonaute-2 to promote target release
- Cold Spring Harbor Laboratory School of Biological Sciences, United States
- Howard Hughes Medical Institute, W. M. Keck Structural Biology Laboratory, United States
- Department of Chemistry and Biochemistry, University of California, San Diego, United States
Figures
Figure 1 with 1 supplement

Target binding triggers phosphorylation of the hAgo2 eukaryotic insertion (EI).
(a) Conservation of the EI in eukaryotic miRNA-handling Argonaute proteins. Phosphorylatable residues are highlighted in orange. The four serines are highly conserved in higher eukaryotes, while the threonine is specific to hAgo2. Residue numbering is based on hAgo2. Hs, Homo sapiens; Ce, Caenorhabditis elegans; Dm, Drosophila melanogaster; Mm, Mus musculus; Pf, Pyrococcus furiosus; Tt, Thermus thermophilus. (b) Guide/target pair schematic for miR-200 and a 30-mer target RNA (ZT1) corresponding to a natural and validated miR-200-binding site located in the 3’ UTR of ZEBT1. Nucleotides in the target complementary to the miR-200 seed sequence are labeled in red and the seed and 3' supplementary pairing regions are indicated. (c) Target binding, but not guide binding, dramatically increases CK1a-mediated phosphorylation of hAgo2 as measured by in vitro phosphorylation assays using the guide/target pair shown in b. Quantification of phosphorylation was done by liquid scintillation and comparison to a spotted ATP standard. Data are presented as the mean ± standard error (SE) for three technical replicates.
Figure 1—figure supplement 1
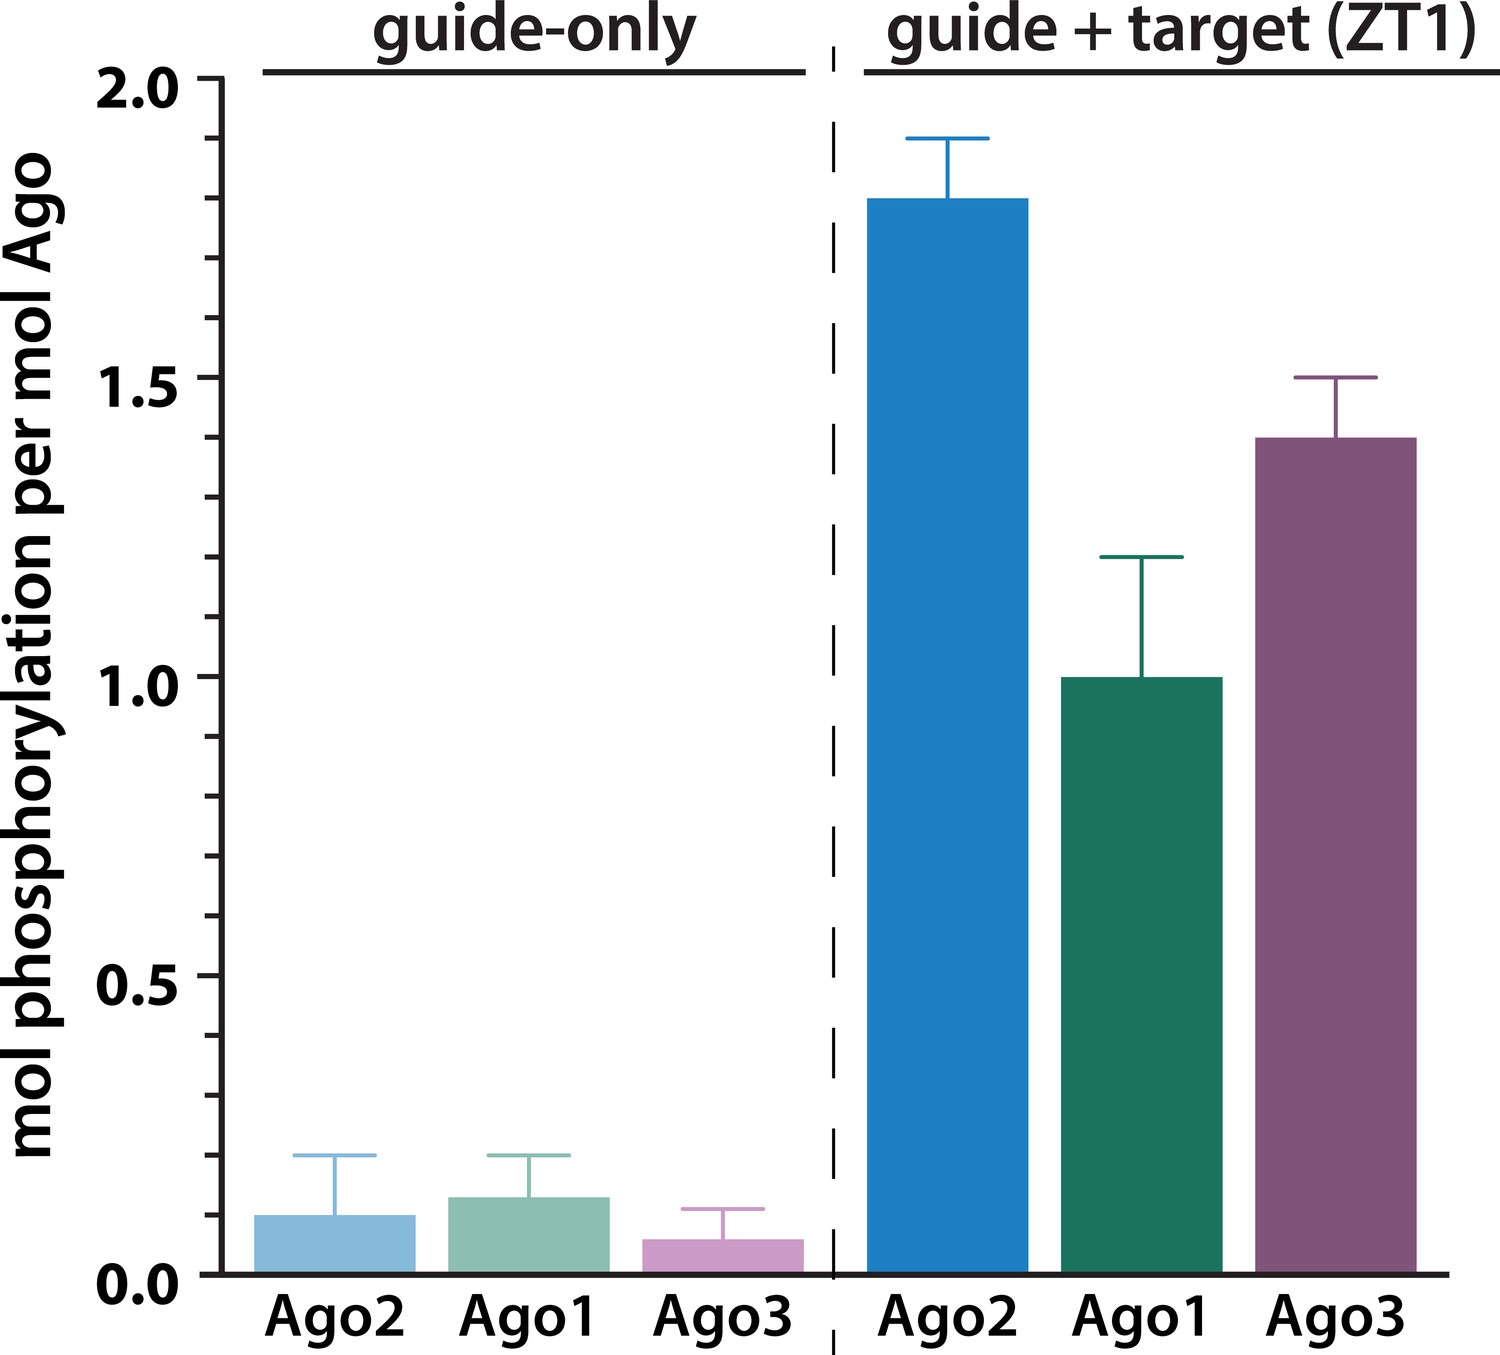
Target binding triggers phosphorylation of the EI in hAgo1 and hAgo3.
In vitro phosphorylation assays of human Agos show that hAgo1–3 all undergo target-triggered phosphorylation. hAgo4 was not tested due to difficulty in its expression. Quantification of phosphorylation was done by liquid scintillation and comparison to a spotted ATP standard. Data are presented as the mean ± standard error (SE) for three technical replicates.
Figure 2 with 2 supplements
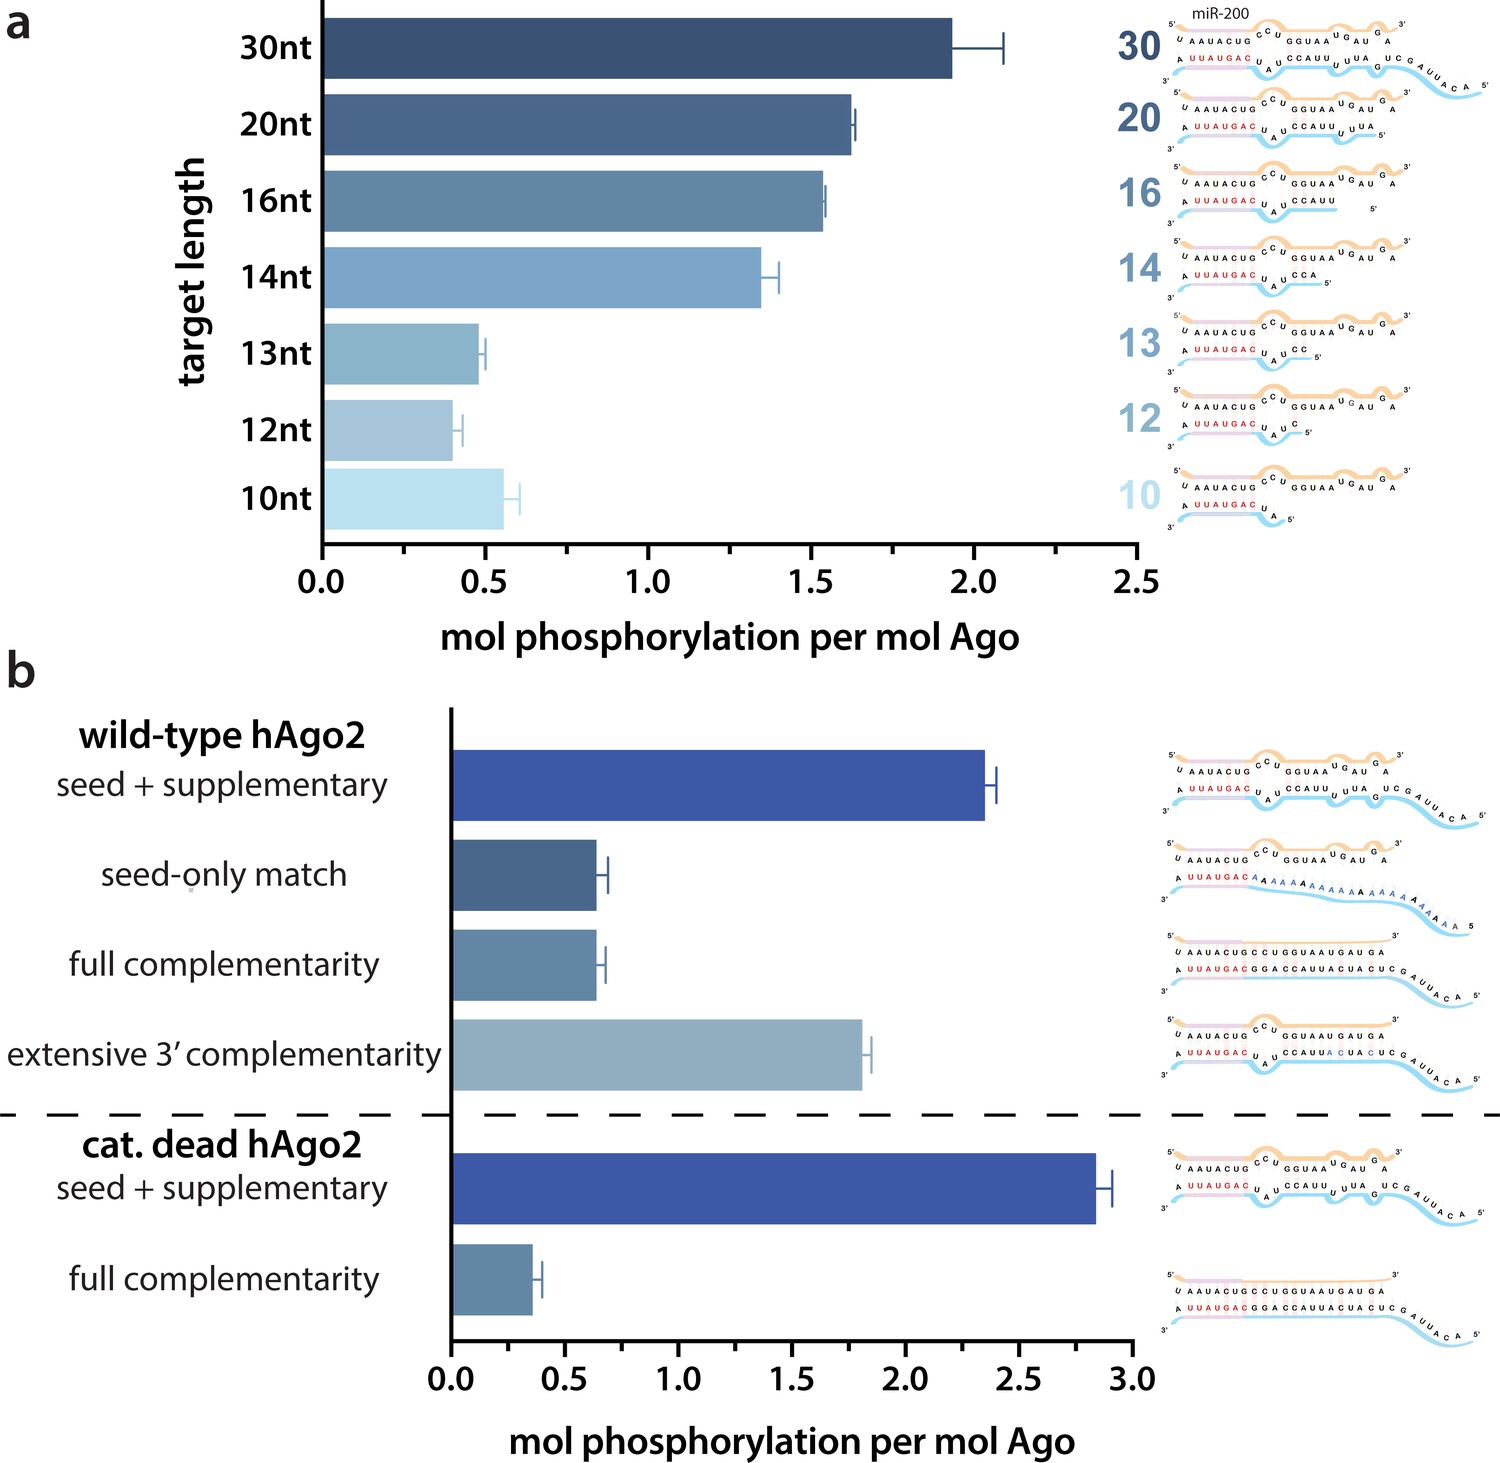
Target length and complementarity requirements.
(a) In vitro phosphorylation assays with ZT1-based targets of varying lengths show that a minimum of 14 nucleotides is needed to trigger robust phosphorylation. (b) Assays with ZT1-based targets with different levels of complementarity to the guide (miR-200) show that the seed + 3’ supplementary configuration is best able to induce phosphorylation. A catalytically inactivated (cat-dead) hAgo2, hAgo2(669N), is included to control for possible slicing of the fully complementary target. Quantification of phosphorylation was done by liquid scintillation and comparison to a spotted ATP standard. Data are presented as the mean ± standard error (SE) for three technical replicates.
Figure 2—figure supplement 1
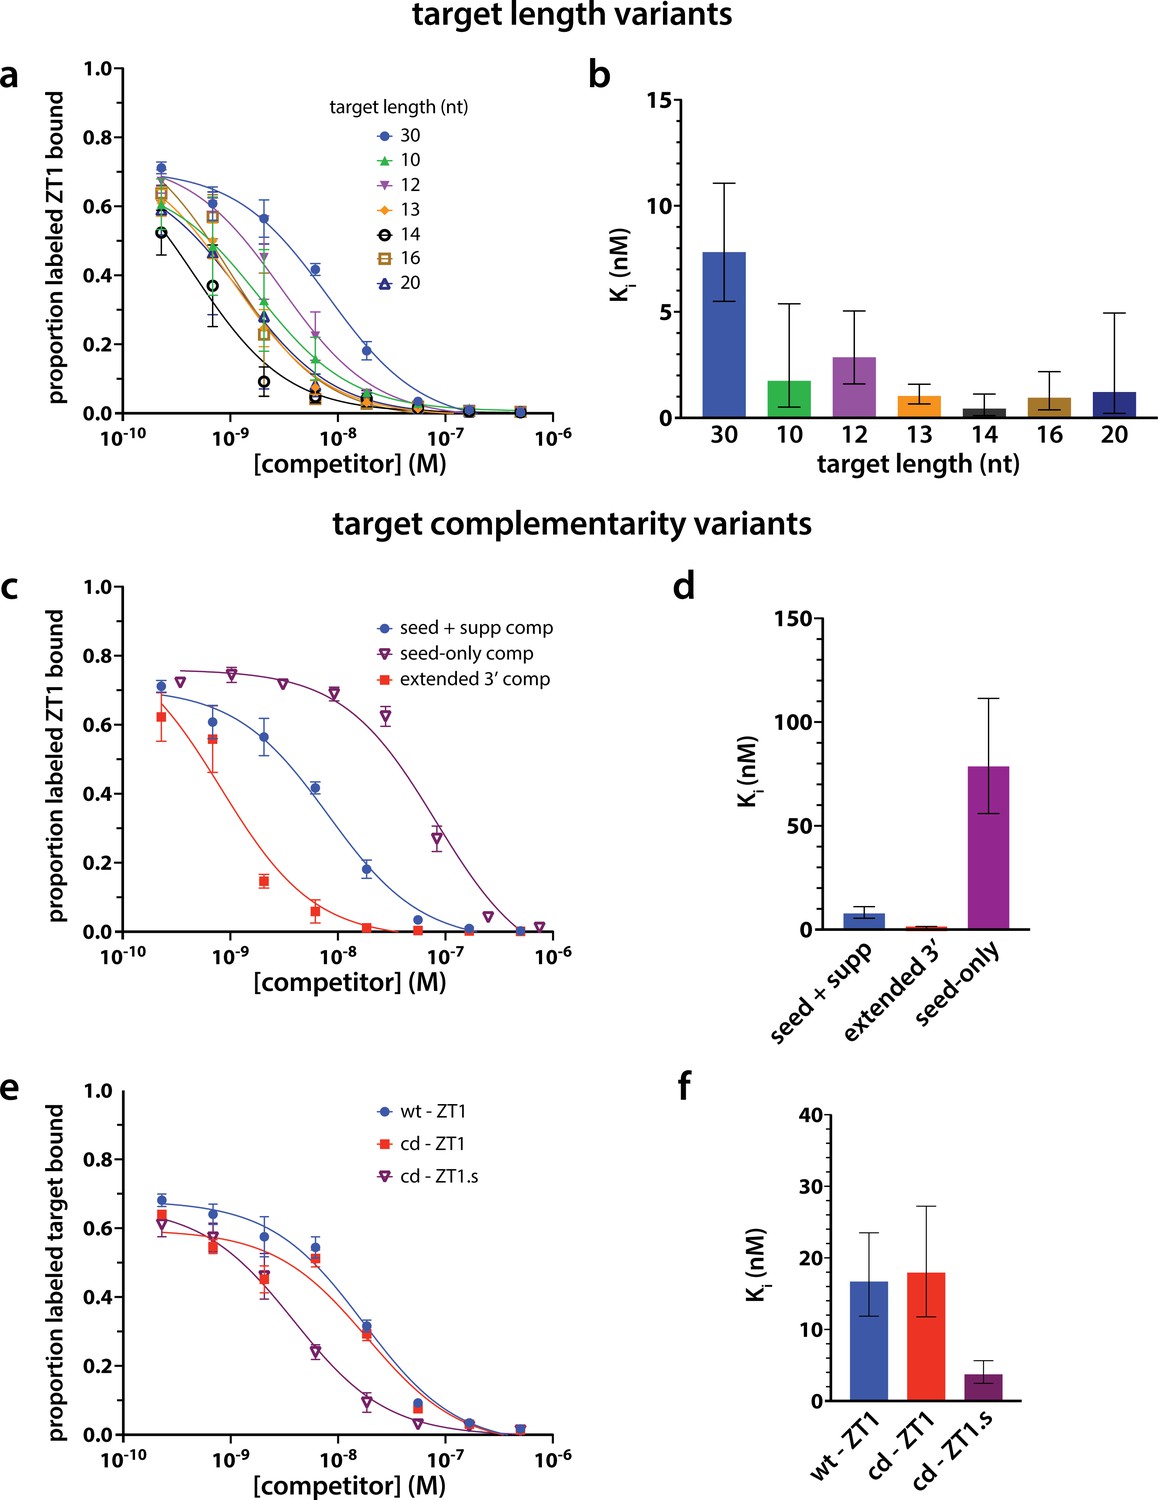
Strength of target binding to hAgo2 and phosphorylation are not strictly correlated.
To measure binding of targets of varying length (a–b) and complementarity (c–e) to hAgo2, we performed competitive inhibition filter-binding assays where hAgo2 was first bound to radiolabeled ZT1 target and then the fraction bound was competed off by challenging with varying concentrations of unlabeled targets (varying length/complementarity). The fraction-bound data was then fit to a One site – Ki function in Prism to calculate an inhibition constant, Ki, for each target. Ki is the concentration required to produce half-maximal inhibition of ZK1 binding and is an indirect measure of the equilibrium dissociation constant for binding of unlabeled targets to hAgo2. The larger the Ki, the weaker the binding of target to Ago2.
Figure 2—figure supplement 2
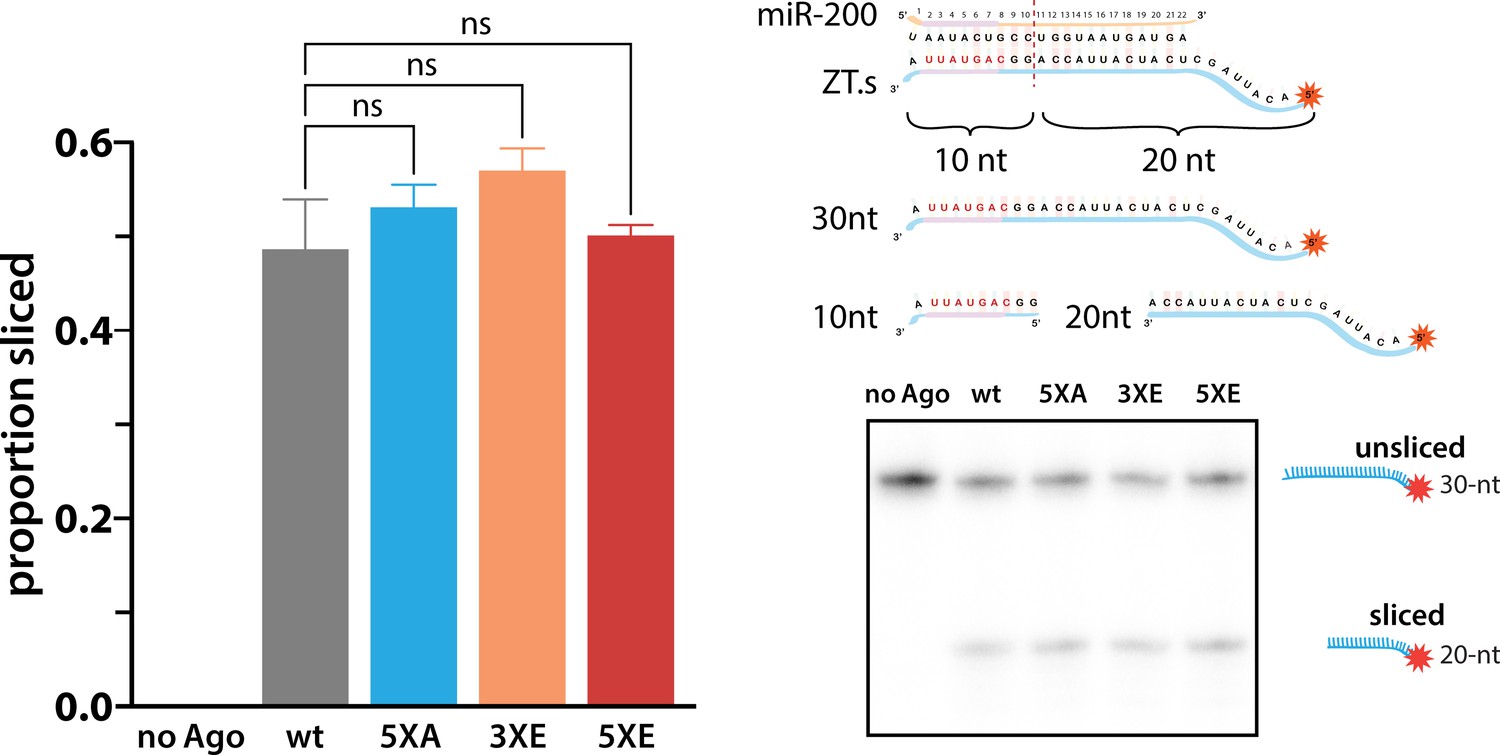
Phosphomimicking doesn’t impact slicing.
The ability of various hAgo2 eukaryotic insertion (EI) states to slice a perfectly complementary ZT1 target (ZT1.s) were tested with a slicer assay. Reactions were performed in triplicate (technical replicates) and a representative urea PAGE gel is shown on the right with proportion sliced graphed on the left ± standard error (SE). ns, non-significant (p < 0.05), as determined by one-way ANOVA using GraphPad Prism.
Figure 3 with 3 supplements
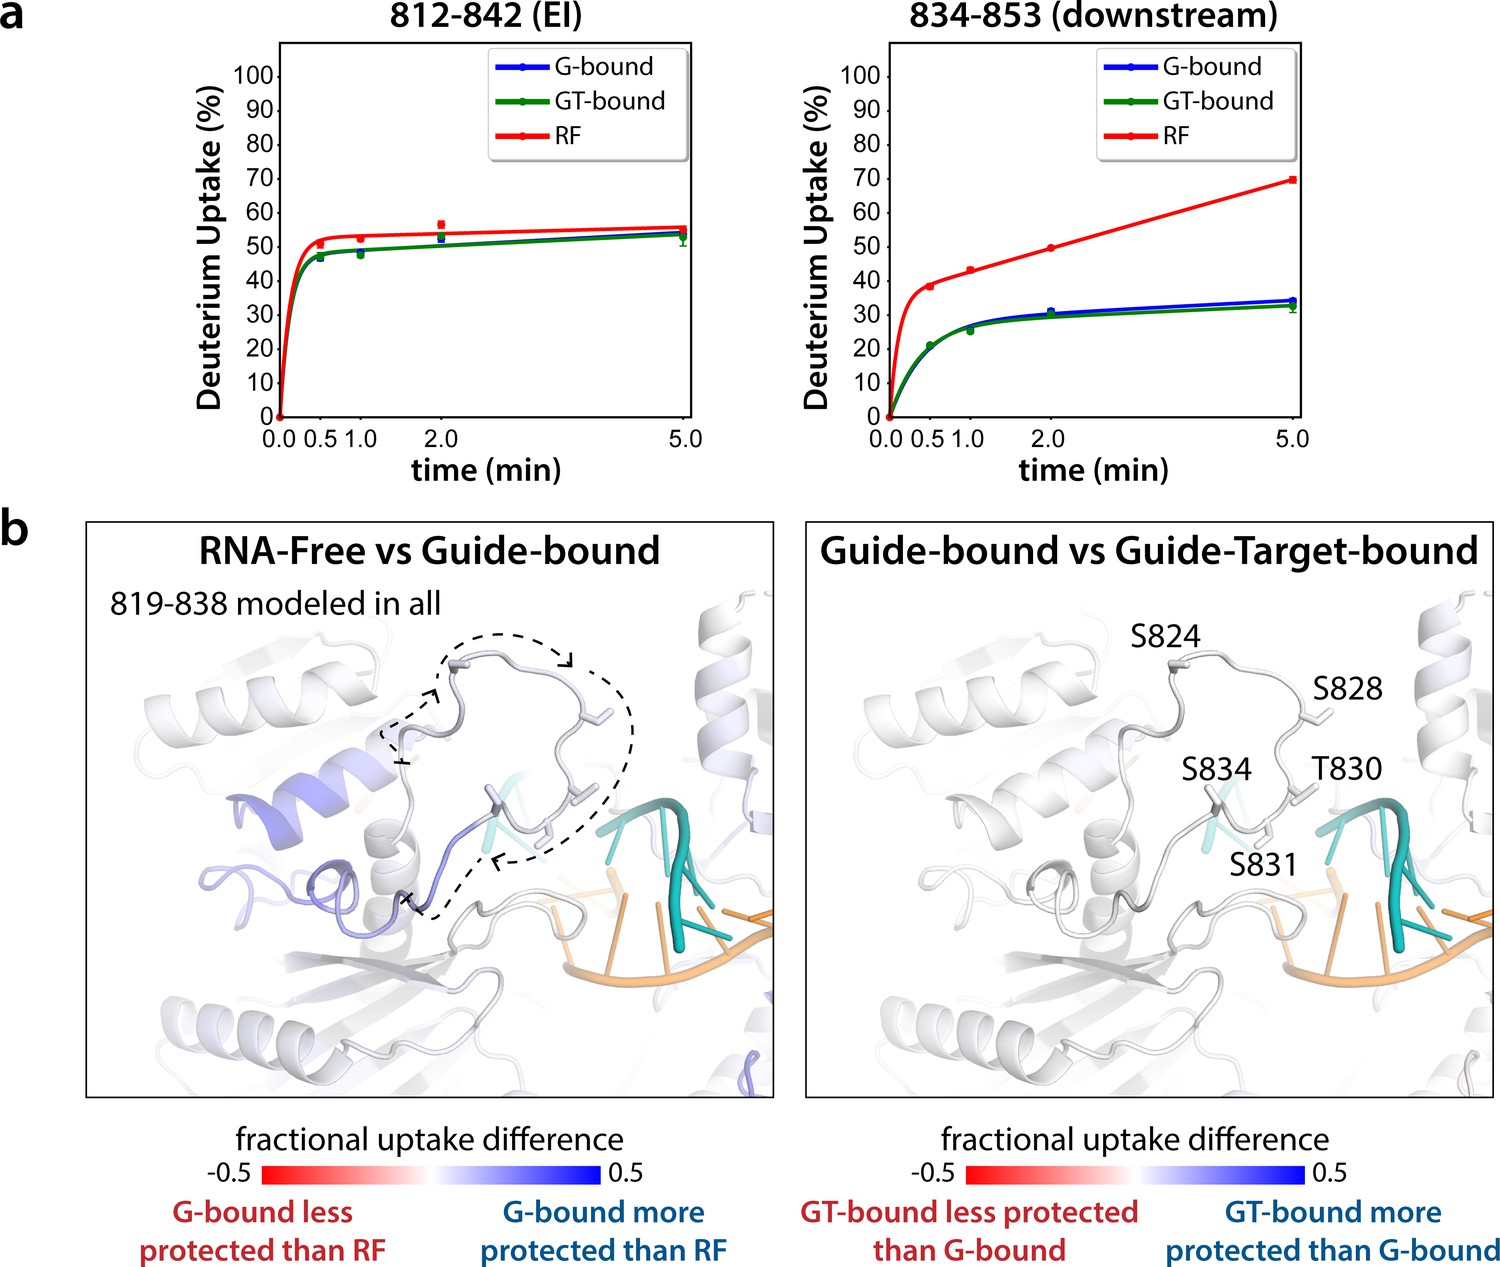
Hydrogen-deuterium exchange mass spectrometry (HDX-MS) of the hAgo2(5XA) eukaryotic insertion (EI).
(a) Deuterium uptake plots for the shortest peptide covering the EI shows no significant difference between the guide-bound (G-bound) and guide + target-bound (GT-bound) states. The increased uptake in the RNA-free (RF) state can be accounted for by increased uptake in region downstream of the phosphorylation sites. (b) Fractional uptake differences between the RF and G-bound (left) or the G-bound and GT-bound hAgo2(5XA) (right). Residues 819–838 were modeled into the structure of hAgo2 bound to a target with seed and supplementary pairing (PDB code 6N4O) in Chimera using MODELLER’s loop refine tool. Peptides were filtered for significant differences and filtered data for the 30 s timepoint are mapped onto the model structure. Phosphorylatable residues are displayed in stick representation and labeled.
Figure 3—figure supplement 1
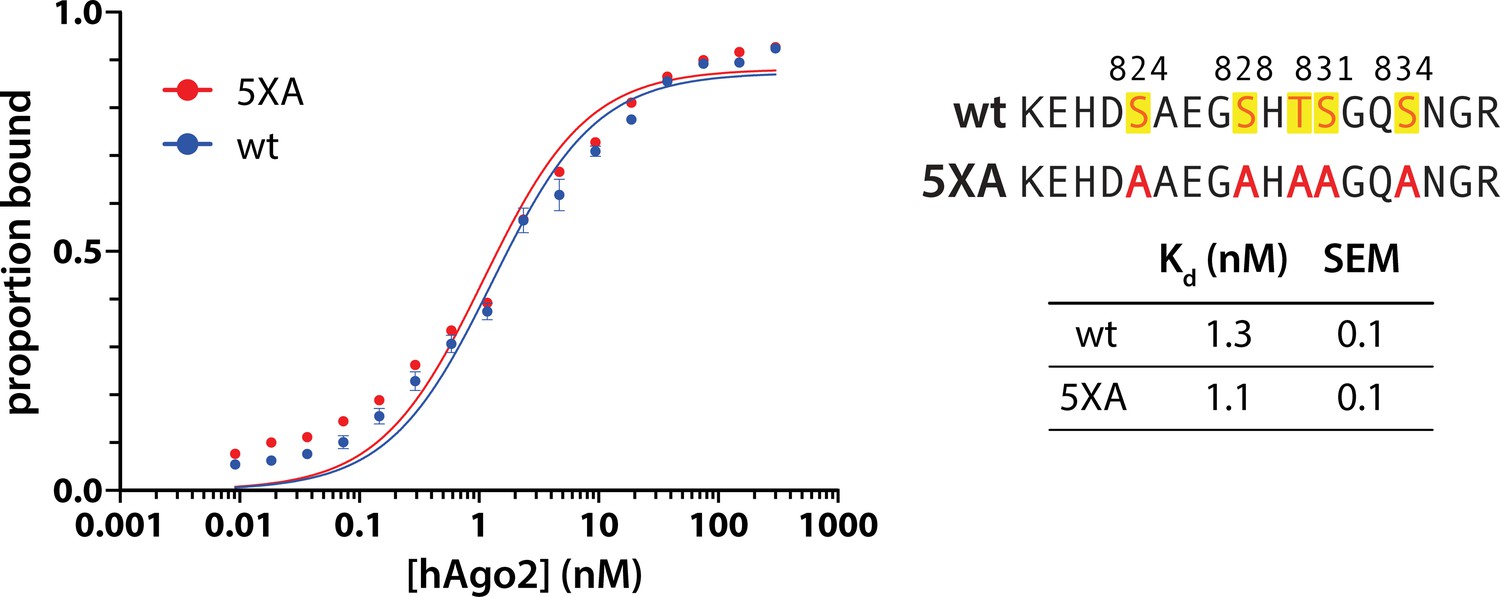
5XA substitution does not alter hAgo2’s target affinity.
Filter-binding assays of miR-200-bound wild-type (wt) and 5XA hAgo2 with ZT1 target were carried out in triplicate (technical replicates). Data (shown as mean ± standard error [SE]) and fits are shown on the left, with the calculated Kd for each target, determined through non-linear regression fit to a one site-specific binding equation, shown on the right.
Figure 3—figure supplement 2
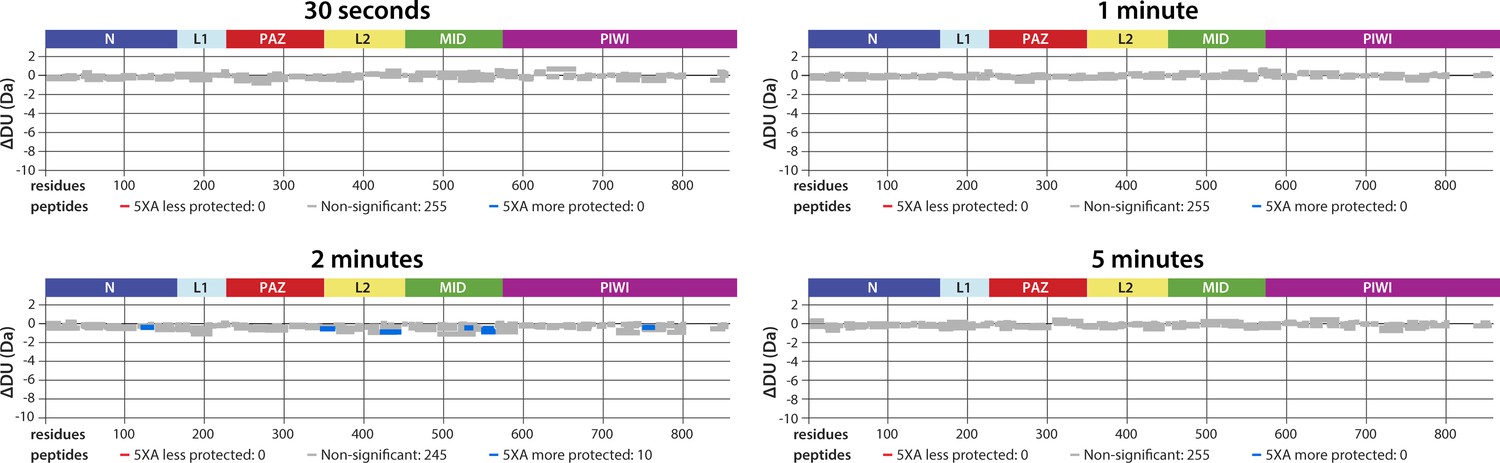
5XA and wild-type (wt) hAgo2 show near-identical deuterium exchange patterns, including in regions surrounding the eukaryotic insertion (EI), indicating that 5XA can serve as a proxy for the wt, for which we were unable to collect data with reliable EI coverage.
Wood’s differential plots comparing the absolute deuterium uptake of RNA-free wt hAgo2 and RNA-free 5XA hAgo2 at each timepoint. Statistically different (p < 0.1) peptides are highlighted with blue indicating that the 5XA is more protected than the wt. Positions of hAgo2 domains are displayed above. There were no statistically different peptides at 30 s, 1 min, or 5 min. Very minor, yet statistically significant (p < 0.01), differences were seen at the 2 min timepoint and were restricted to 10 (out of 255) peptides, none of which were in the region surrounding the EI.
Figure 3—figure supplement 3
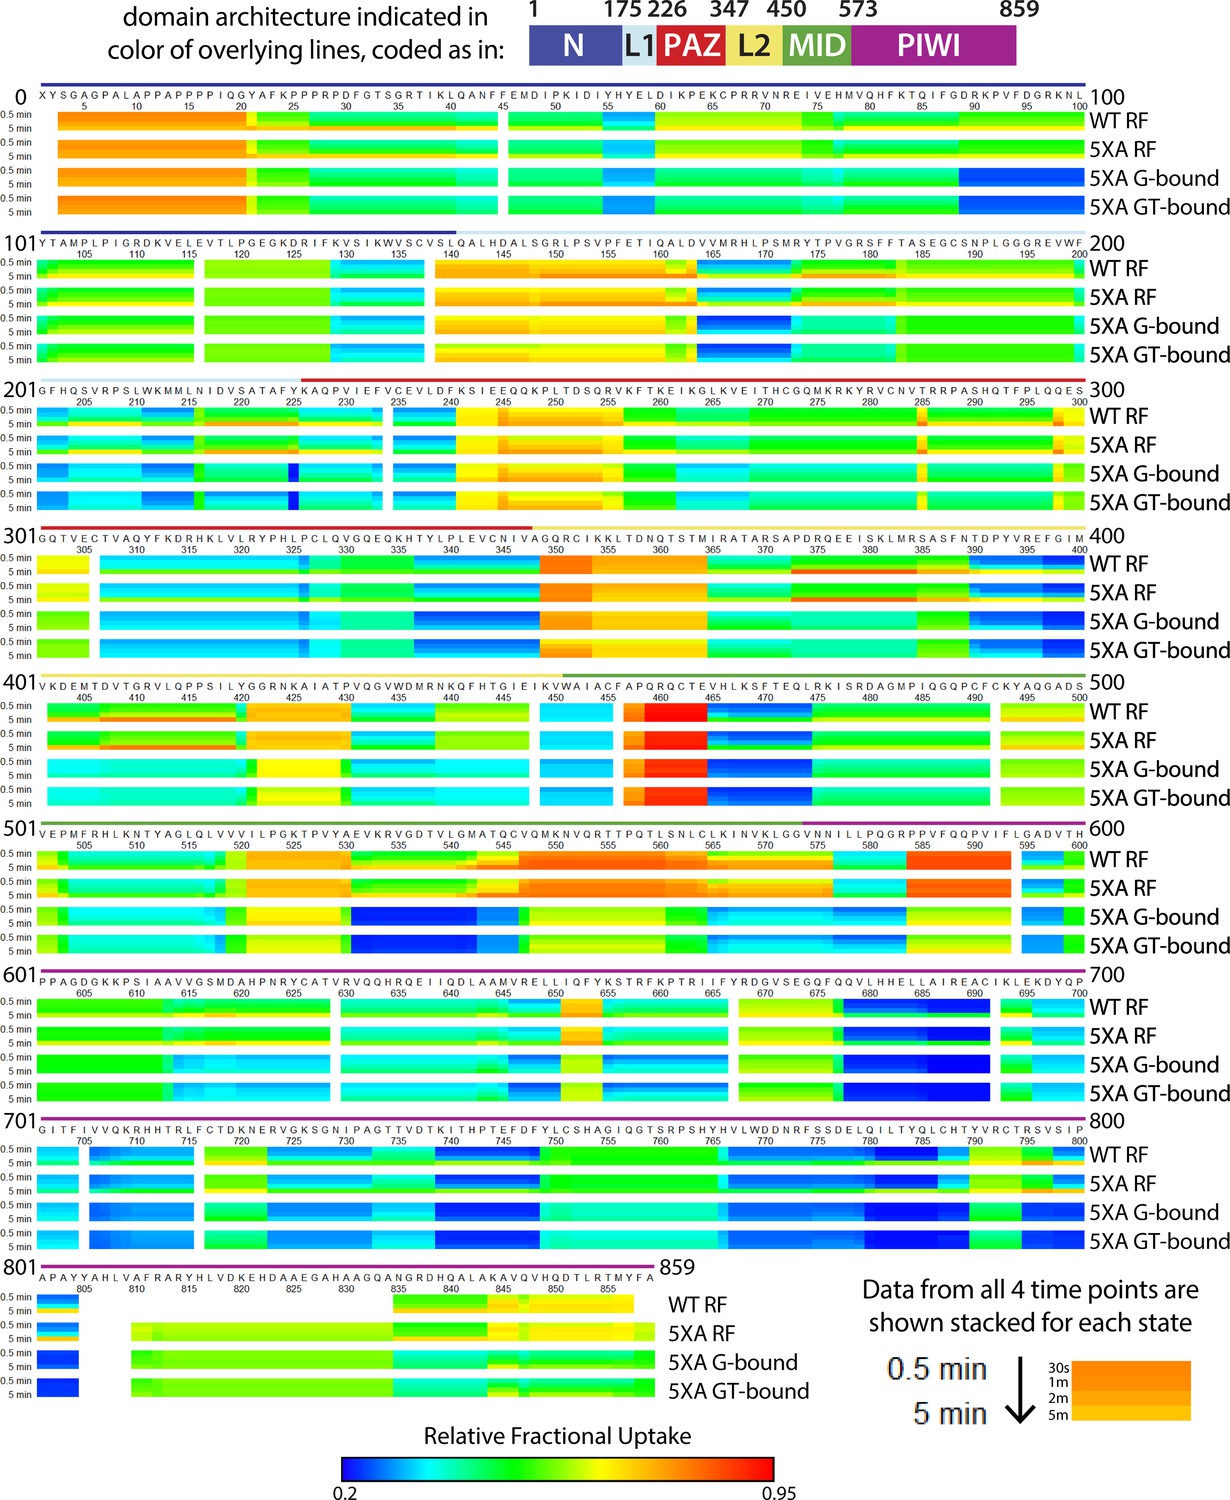
Heat map showing relative deuterium uptake for wild-type (wt) hAgo2 in RNA-free (RF) state, and 5XA hAgo2 in RF, guide-bound (G-bound), and guide + target-bound (GT-bound) states across the entire protein and all timepoints.
Data for all four timepoints (30 s, 1, 2, and 5 min) are stacked and colored on a rainbow spectrum with dark blue indicating least deuterium uptake (most-protected regions) and dark red indicating highest levels of deuterium uptake (least-protected regions). The color of the overlying lines indicates the corresponding domain.
Figure 4 with 1 supplement
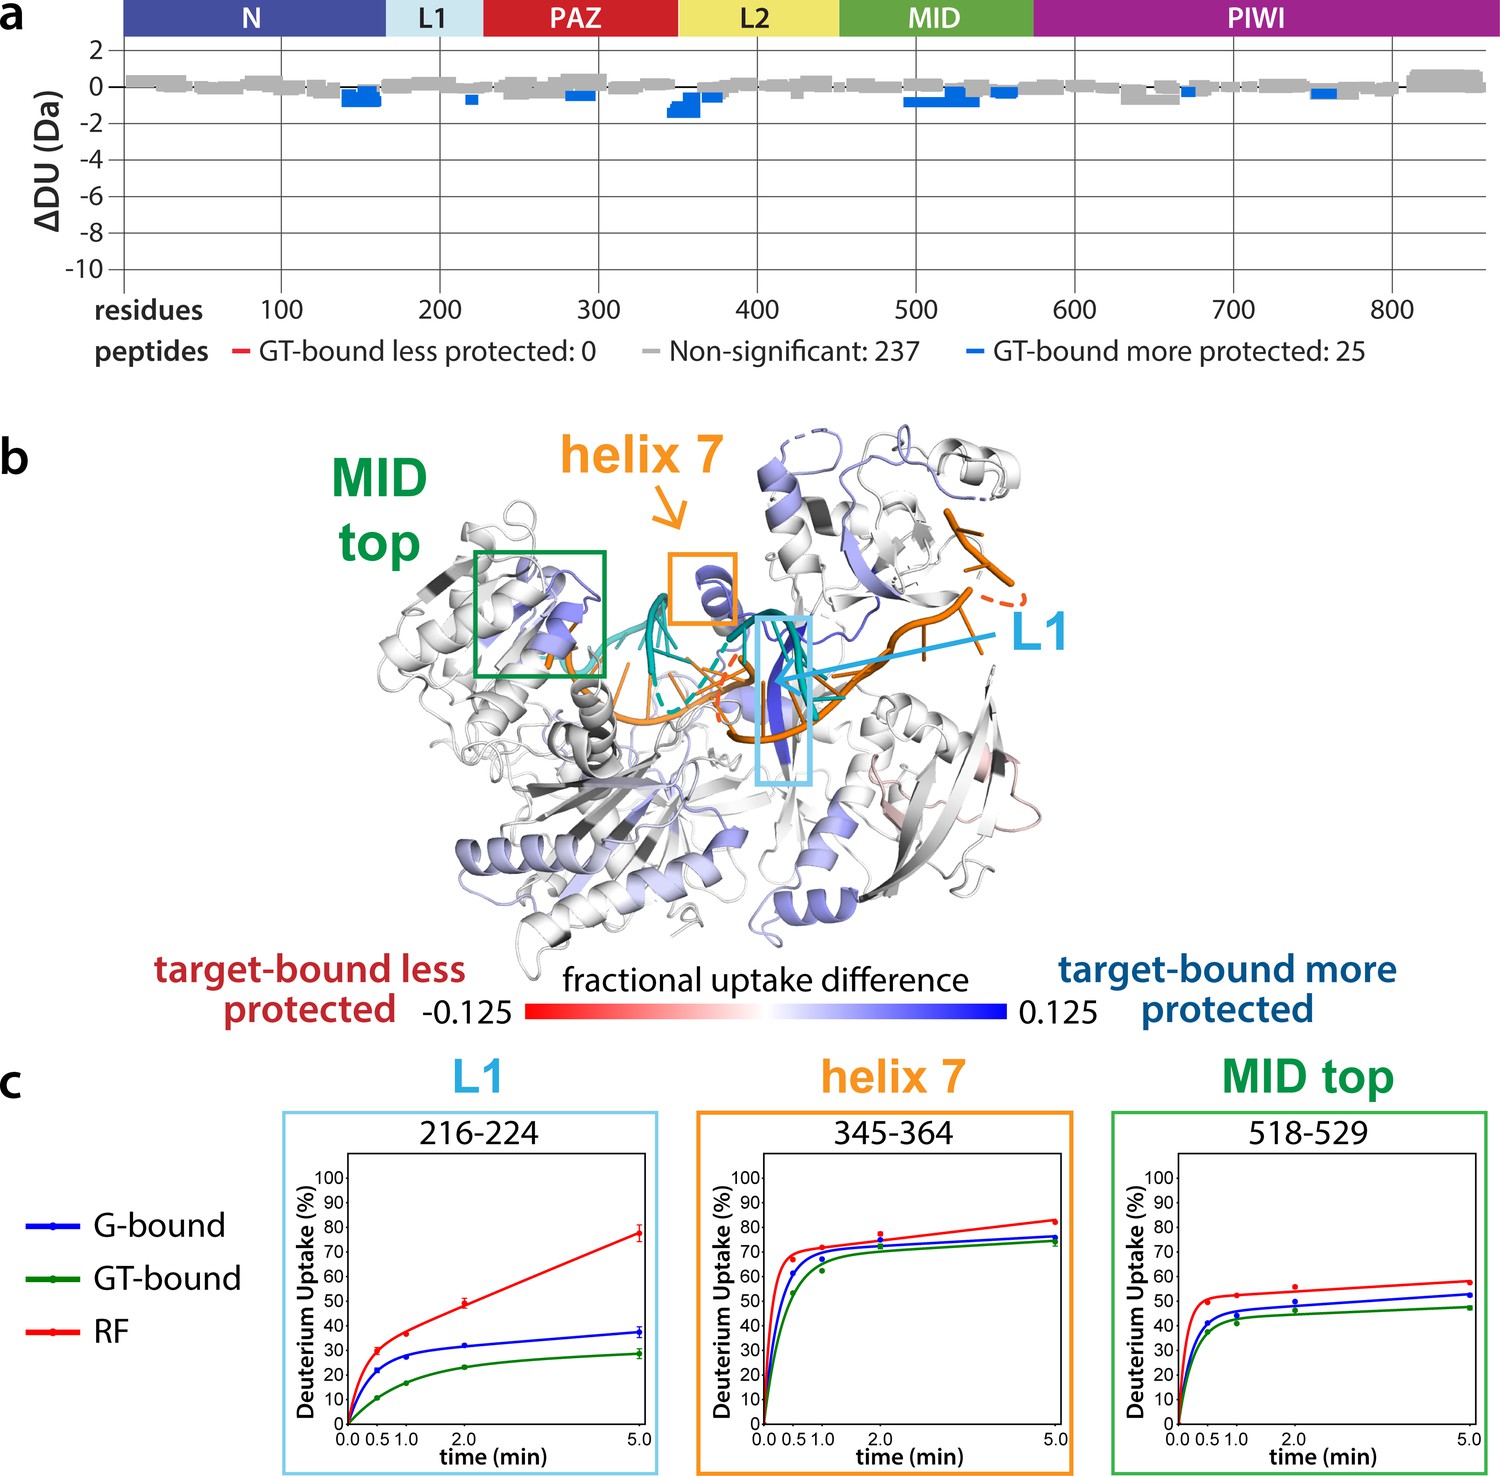
Effects of target-binding on deuterium exchange are structurally concentrated and small in magnitude.
(a) Wood’s plot comparing the absolute deuterium uptake of guide-bound 5XA hAgo2 (G-bound) and guide + target-bound 5XA hAgo2 (GT-bound) at the 30 s timepoint. Statistically different (p < 0.1) peptides are highlighted in blue indicating that the GT-bound is somewhat more protected than the G-bound. Positions of hAgo2 domains are displayed above. (b) Fractional uptake difference comparing G-bound and GT-bound 5XA hAgo2 at the 30 s timepoint. Peptides were filtered for significant differences and filtered data are displayed on the structure of hAgo2 bound to a guide and target with seed and supplementary pairing (PDB code 6N4O, Sheu-Gruttadauria et al., 2019b; Sheu-Gruttadauria et al., 2019a), scaled to the data range (dark red where target-bound is 12.5% less protected to dark blue where target-bound is 12.5% more protected). (c) Deuterium uptake plots for peptides representative of three main areas showing protection offered upon target binding.
Figure 4—figure supplement 1
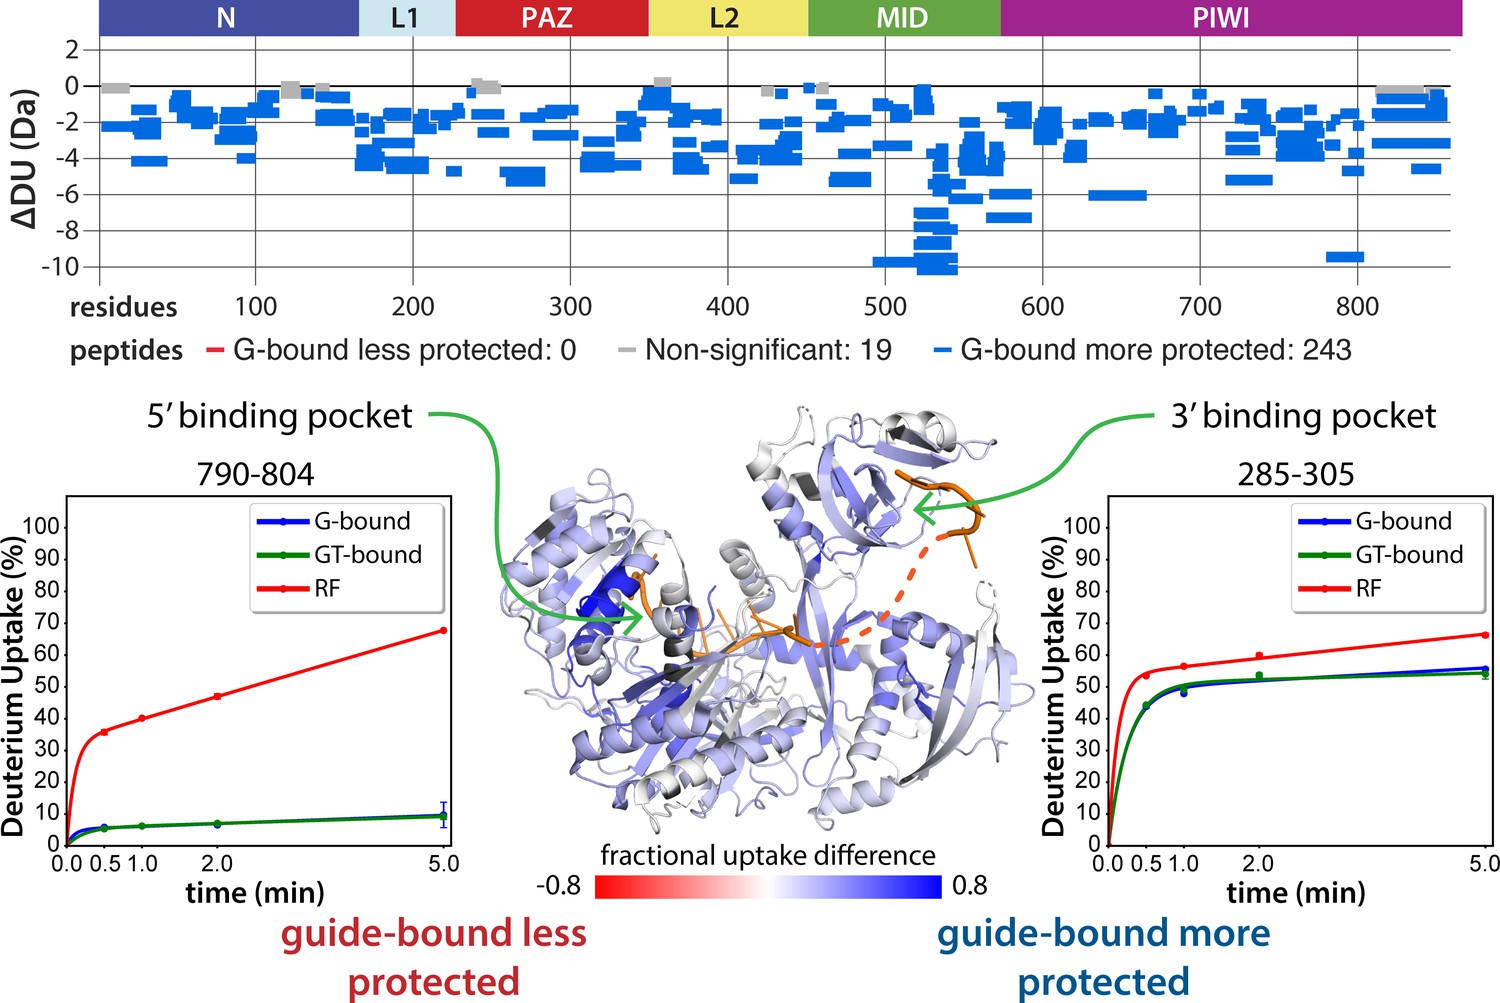
Guide-binding offers strong protection from deuterium exchange over most of hAgo2.
Top: Wood’s differential plot comparing the absolute deuterium uptake of RNA-free 5XA hAgo2 (RF) and guide-bound 5XA hAgo2 (G-bound) at the 5 min timepoint. Statistically different (p < 0.1) peptides are highlighted in blue indicating that the guide-bound is more protected than the RNA-free. Positions of hAgo2 domains are displayed above. Bottom middle: Fractional uptake difference comparing guide-bound and RNA-free hAgo2 at the 5 min timepoint. Peptides were filtered for significant differences and filtered data are displayed on the structure of hAgo2 in complex with miR-20 (PDB code 4F3T, Elkayam et al., 2012), scaled to the data range (dark red where guide-bound is 80% less protected to dark blue where guide-bound is 80% more protected). Regions lacking hydrogen-deuterium exchange mass spectrometry (HDX-MS) coverage are colored dark gray in this and similar figures. Insets show deuterium uptake plots for peptides in the 5’ binding pocket (left) and 3’ binding pocket (right) showing protection offered upon guide binding.
Figure 5 with 2 supplements
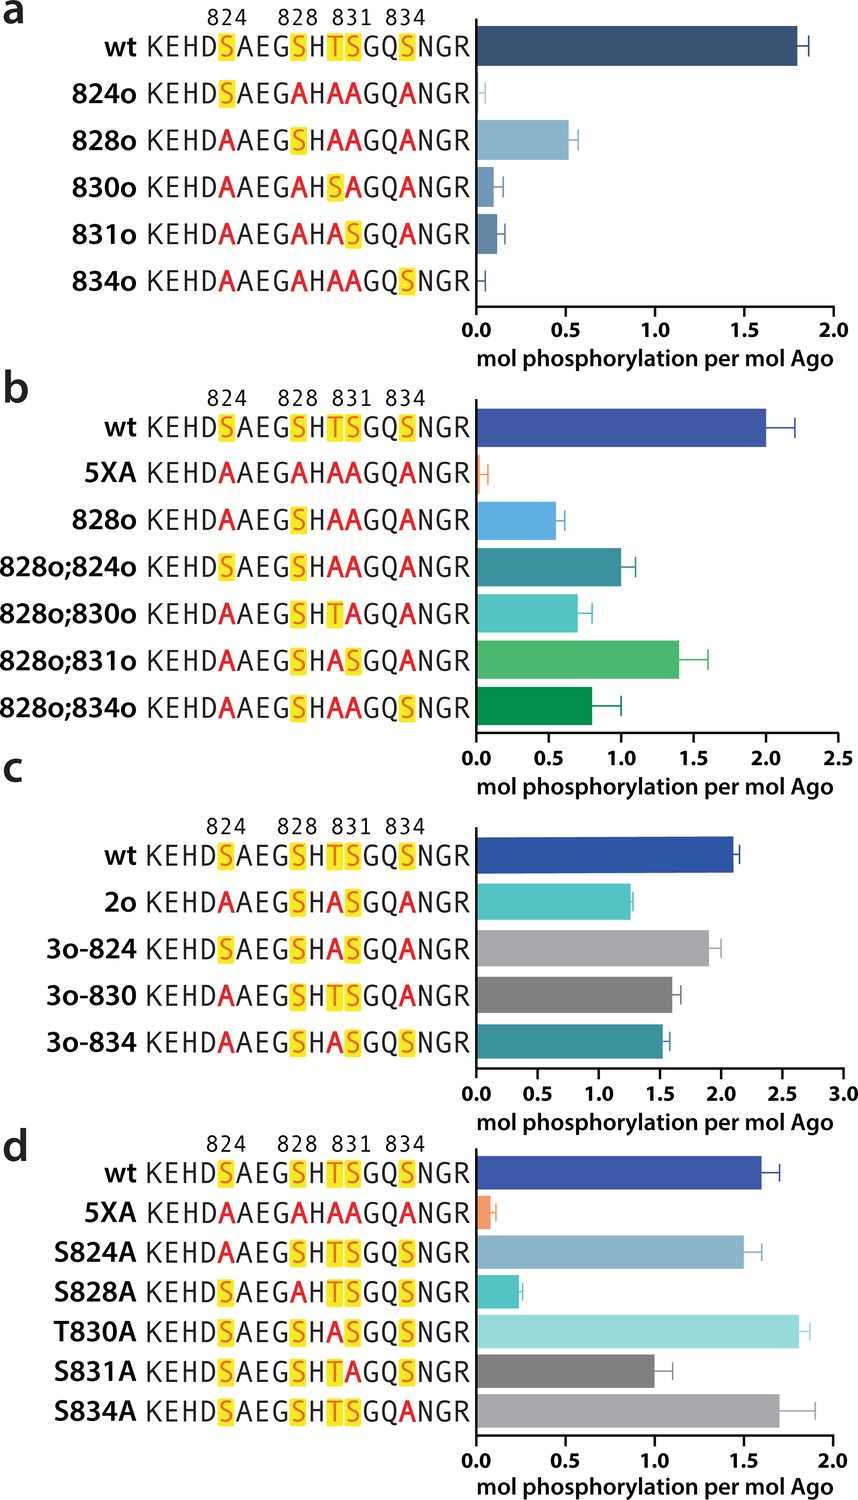
Phosphorylation of the hAgo2 eukaryotic insertion (EI) occurs hierarchically.
(a) CK1α-mediated phosphorylation of miR-200/ZT1-bound wild-type (wt), 5XA, and ‘single open’ mutants in which only a single potential phosphosite is open for phosphorylation by CK1α, with the rest mutated to alanine, shows that S828 is the only site capable of CK1α-mediated phosphorylation without previous priming phosphorylation. (b) 'Double open’ mutants in which only two sites are open for phosphorylation, S828 and one other site, show that S828 is capable of priming for S831 phosphorylation. (c) 'Triple open’ mutants in which only three sites are open for phosphorylation, S828, S831, and S834, show that S831 is capable of priming for further phosphorylation, but that the third site phosphorylation is more heterogeneous. (d) Similar effects of single alanine substitutions for S824, T830, and S834 underscore the heterogeneous nature of the third phosphorylation site. Quantification of phosphorylation was done by liquid scintillation and comparison to a spotted ATP standard. Data are presented as the mean ± standard error (SE) for three technical replicates.
Figure 5—figure supplement 1

The cluster of upstream acidic residues does not play a priming role.
In vitro phosphorylation assays show no effect on measured phosphorylation of hAgo2 when the residues proposed to play a priming role are neutralized, hAgo2(E821Q/D823N/E826Q). Quantification of phosphorylation was done by liquid scintillation and comparison to a spotted ATP standard. Data are presented as the mean ± standard error (SE) for three technical replicates.
Figure 5—figure supplement 2
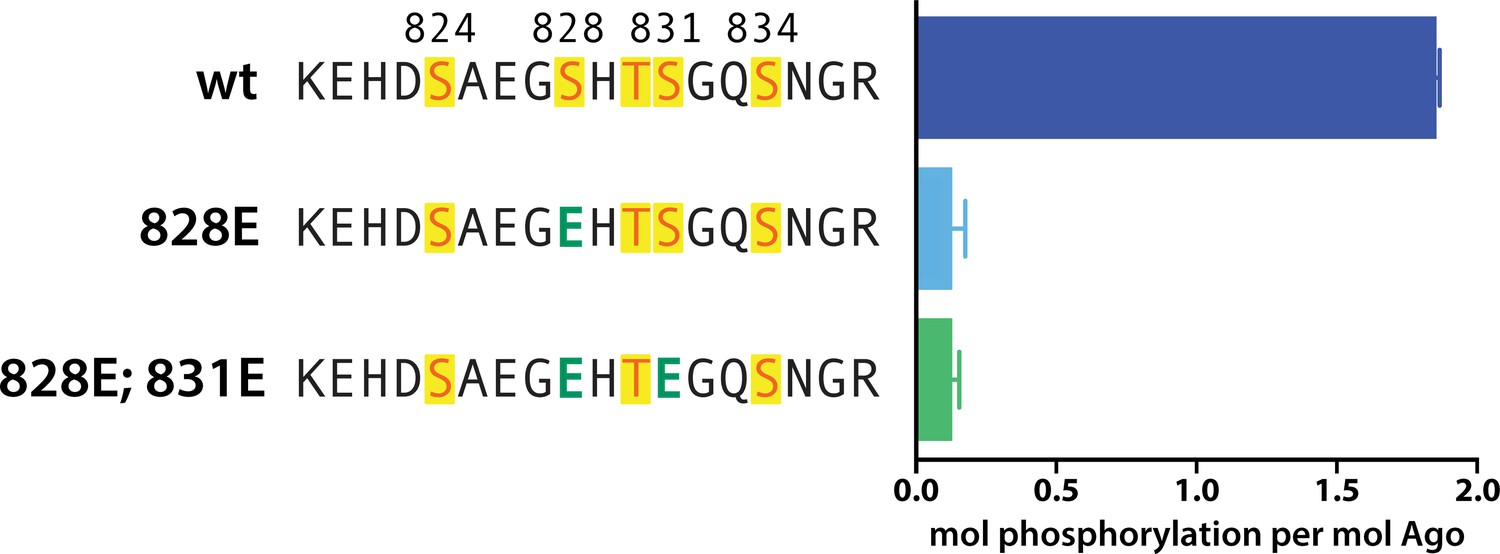
Phosphomimetics failed to prime for phosphorylation.
In vitro phosphorylation assays show lack of phosphorylation of hAgo2 when serine 828 is mutated to a glutamate, with or without additional mutation of serine 831 to glutamate. Quantification of phosphorylation was done by liquid scintillation and comparison to a spotted ATP standard. Data are presented as the mean ± standard error (SE) for three technical replicates.
Figure 6 with 1 supplement
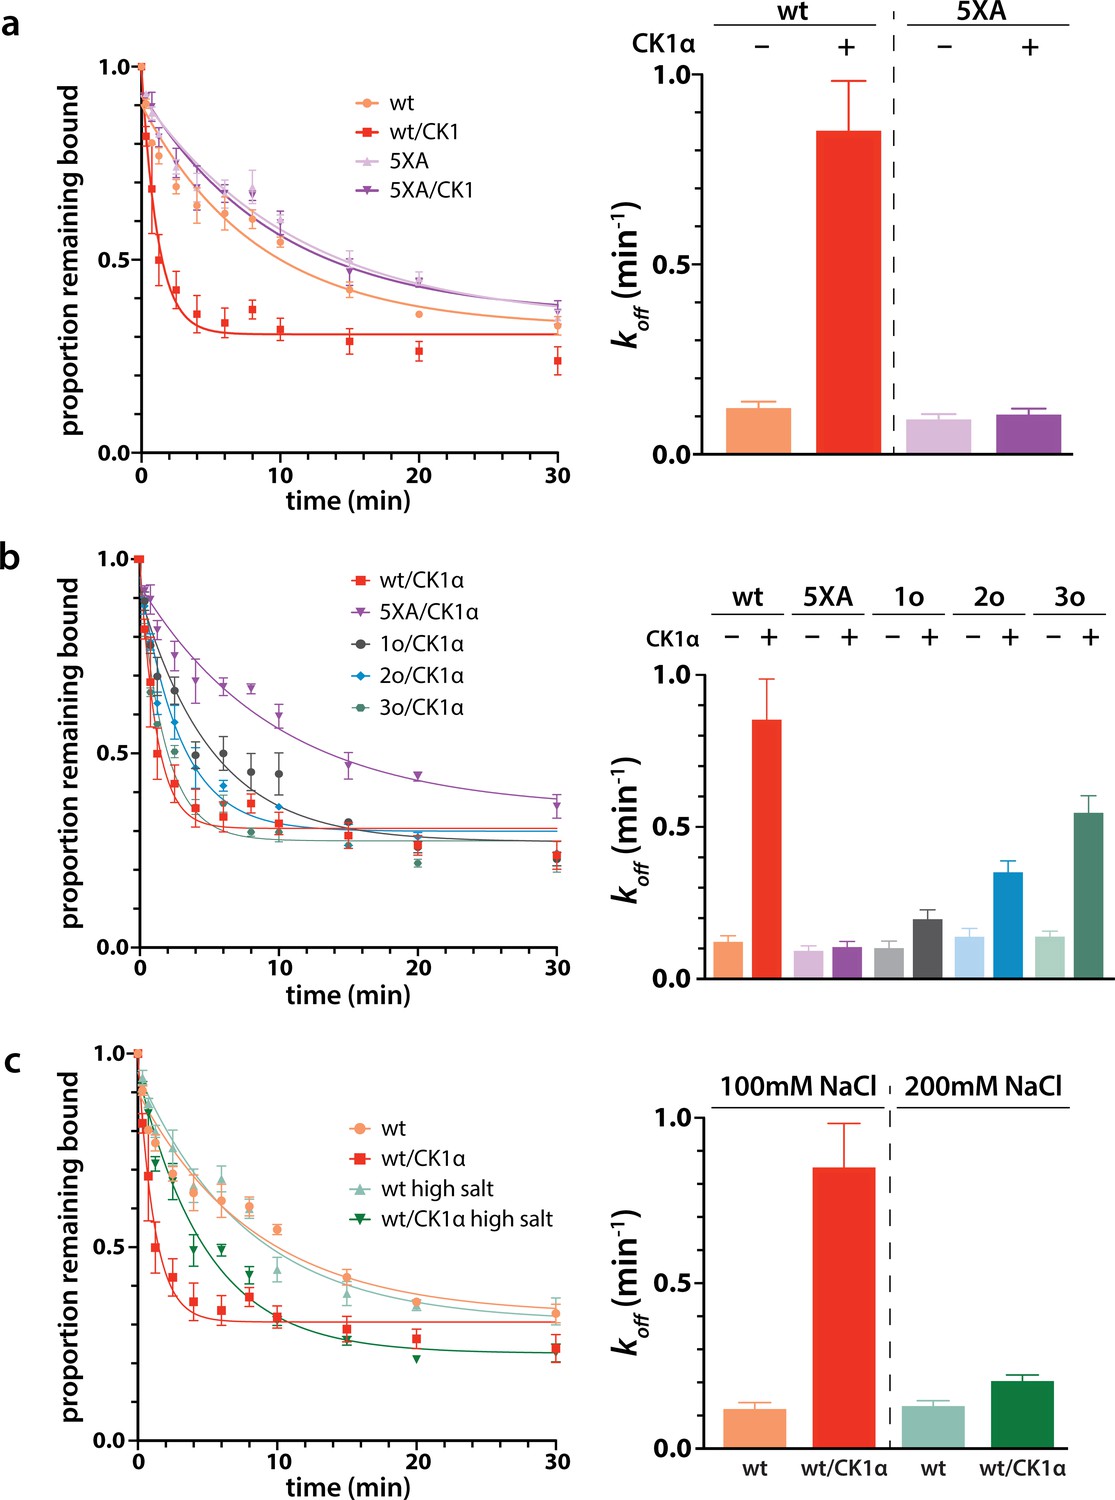
Phosphorylation promotes target release.
(a) Filter-binding-based target release assay tracking the release of labeled target from wild-type (wt) hAgo2 phosphorylated while bound to unlabeled target. (b) Target release assays performed as in a with 1 open, 2 open, and 3 open (824o;828o;831o) hAgo2 mutants show that increasing phosphorylation decreases half life. (c) The effects of phosphorylation on target release are minimal under high salt conditions (200 mM NaCl vs. 100 mM NaCl), showing that the effect on target release is largely electrostatic. (a–c) Proportion of target remaining bound over time since addition of an unlabeled target chase is plotted with 95% CI (left) and half lives calculated by fitting to a single-phase exponential decay equation are shown ± standard error (SE) (right). n = 4 technical replicates for 3o-834/CK1α, n = 3 technical replicates for others.
Figure 6—figure supplement 1
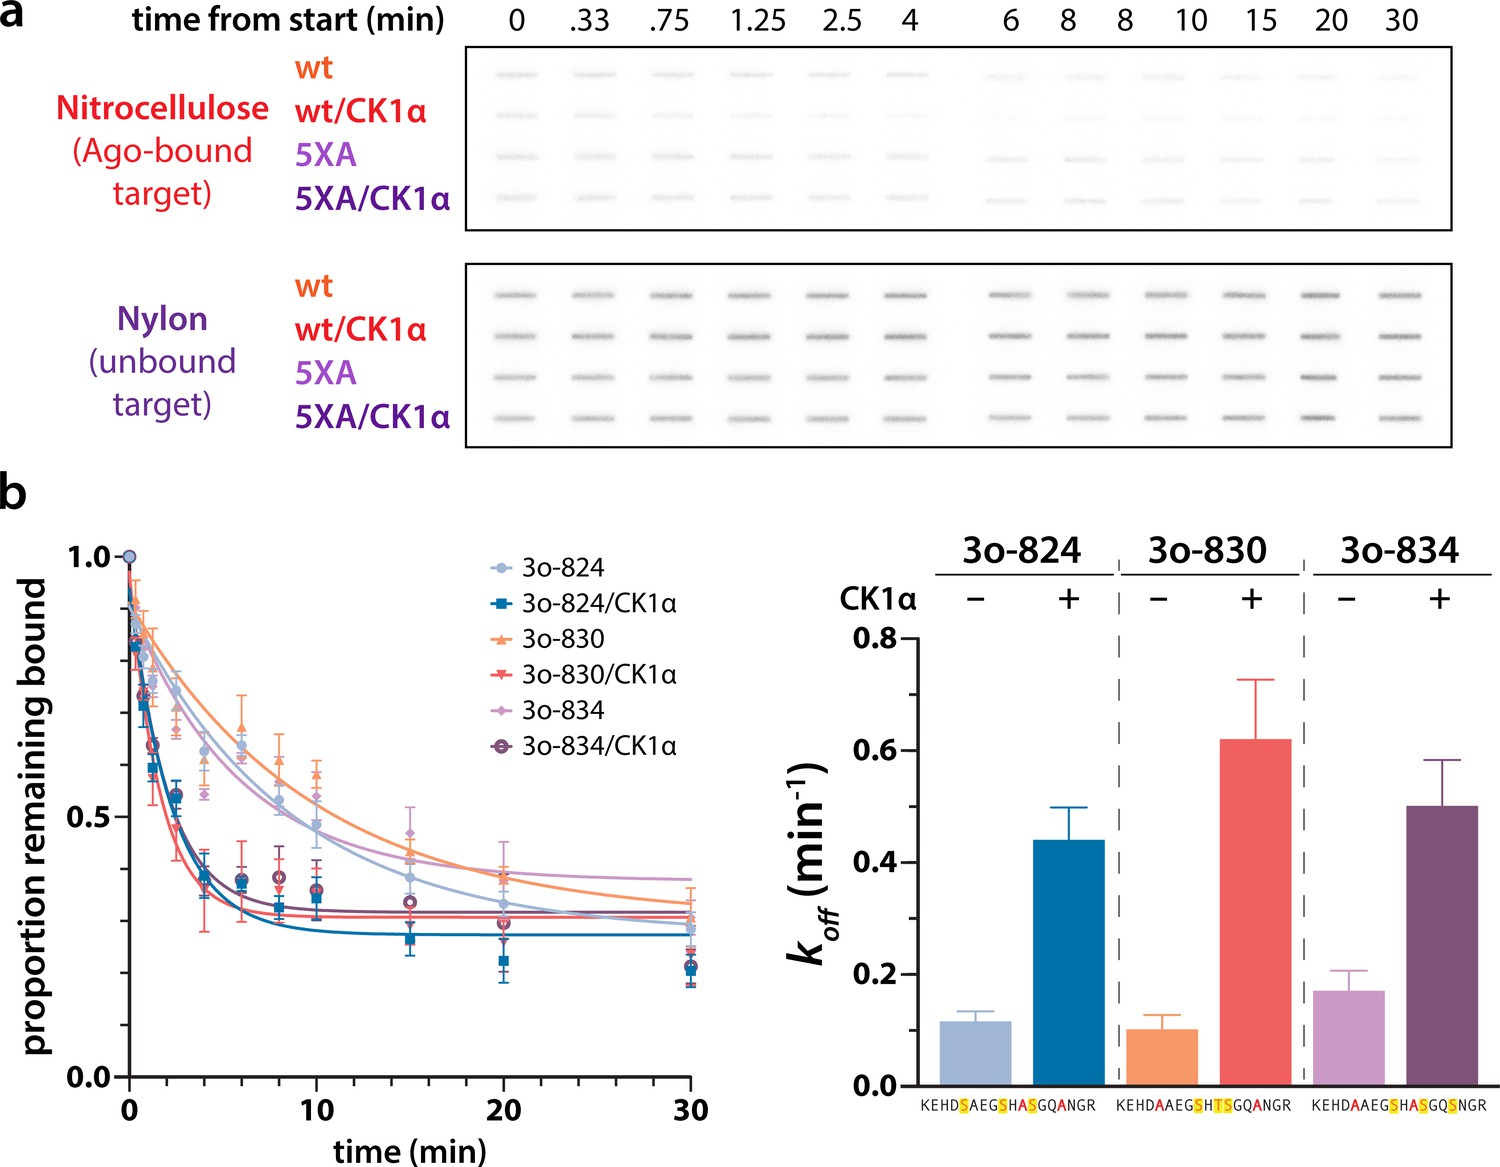
Different triple open combinations show similar decreases in target half life in response to phosphorylation.
(a) Representative slot bolts from target release assays showing the decrease in target bound to hAgo2 (captured on the top, nitrocellulose membrane) over time in the absence or presence of phosphorylation. (b) Different triple open combinations show similar decreases in half life in response to phosphorylation, suggesting that overall quantity of phosphorylation, rather than its location, is important for promoting target release. Proportion of target remaining bound over time since addition of an unlabeled target chase is plotted with 95% CI (left) and half lives calculated by fitting to a single-phase exponential decay equation are shown ± standard error ( SE) (right). n = 3 technical replicates. 3o-824, hAgo2(830A, 831A); 3o-830, hAgo2(824A, 831A); 3o-831, hAgo2(824A, 830A).
Figure 7
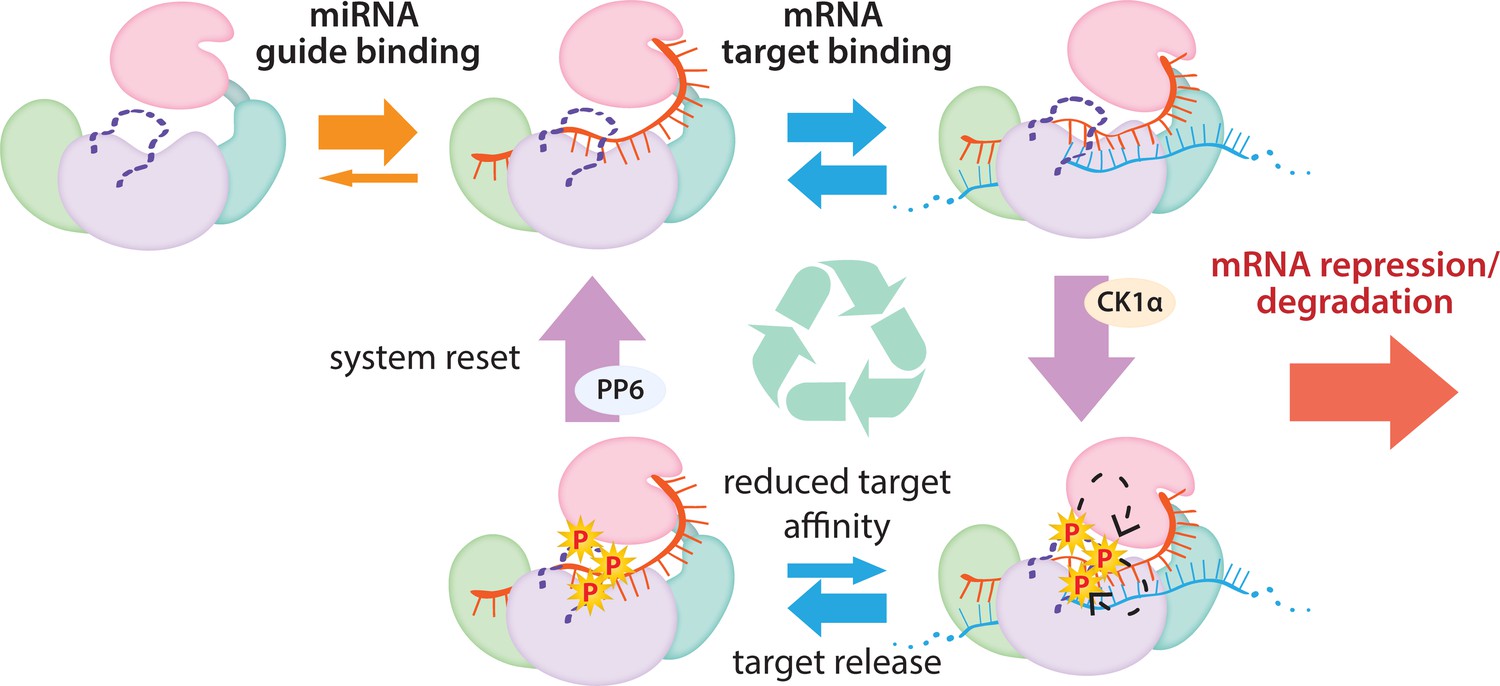
The cycle of phosphorylation/dephosphorylation plays a regulatory role in silencing.
In order to repress a target mRNA, Ago binds to a small RNA guide to form the core RISC complex, which subsequently binds to target mRNAs containing sequence complementarity to the guide to effect repression. The core RISC complex (Ago/guide) is incredibly stable but would have to release target mRNA prior to repression of additional targets. We propose that this release is facilitated by CK1α-mediated phosphorylation of the eukaryotic insertion (EI). We showed that phosphorylation is triggered by binding to targets that are not fully complementary, but that contain complementarity to the seed and 3’ supplementary pairing regions of the guide. Binding to such targets results in the complex adopting a productive conformation for EI phosphorylation. We suggest this may be due to orienting of the RNA backbone phosphates to serve as non-canonical priming phosphates. EI phosphorylation occurs hierarchically starting at S828 and the additive negative charges of the phosphates electrostatically repel the target RNA, leading to target release. The phosphorylated RISC has reduced affinity for further target binding. However, the system is quickly reset by dephosphorylation. This allows the RISC complex to bind to and repress additional sites, helping to explain how RISC can function efficiently and effectively in the context of excess target sites.
Additional files
-
Supplementary file 1
HDX summary data.
- https://cdn.elifesciences.org/articles/76908/elife-76908-supp1-v1.pdf
-
Transparent reporting form
- https://cdn.elifesciences.org/articles/76908/elife-76908-transrepform1-v1.pdf
Download links
A two-part list of links to download the article, or parts of the article, in various formats.
Downloads (link to download the article as PDF)
Open citations (links to open the citations from this article in various online reference manager services)
Cite this article (links to download the citations from this article in formats compatible with various reference manager tools)
Target binding triggers hierarchical phosphorylation of human Argonaute-2 to promote target release
eLife 11:e76908.
https://doi.org/10.7554/eLife.76908


