Complementary evolution of coding and noncoding sequence underlies mammalian hairlessness
- Carnegie Mellon-University of Pittsburgh PhD Program in Computational Biology, United States
- Department of Computational Biology, University of Pittsburgh, United States
- Department of Human Genetics, University of Utah, United States
Figures
Figure 1 with 11 supplements
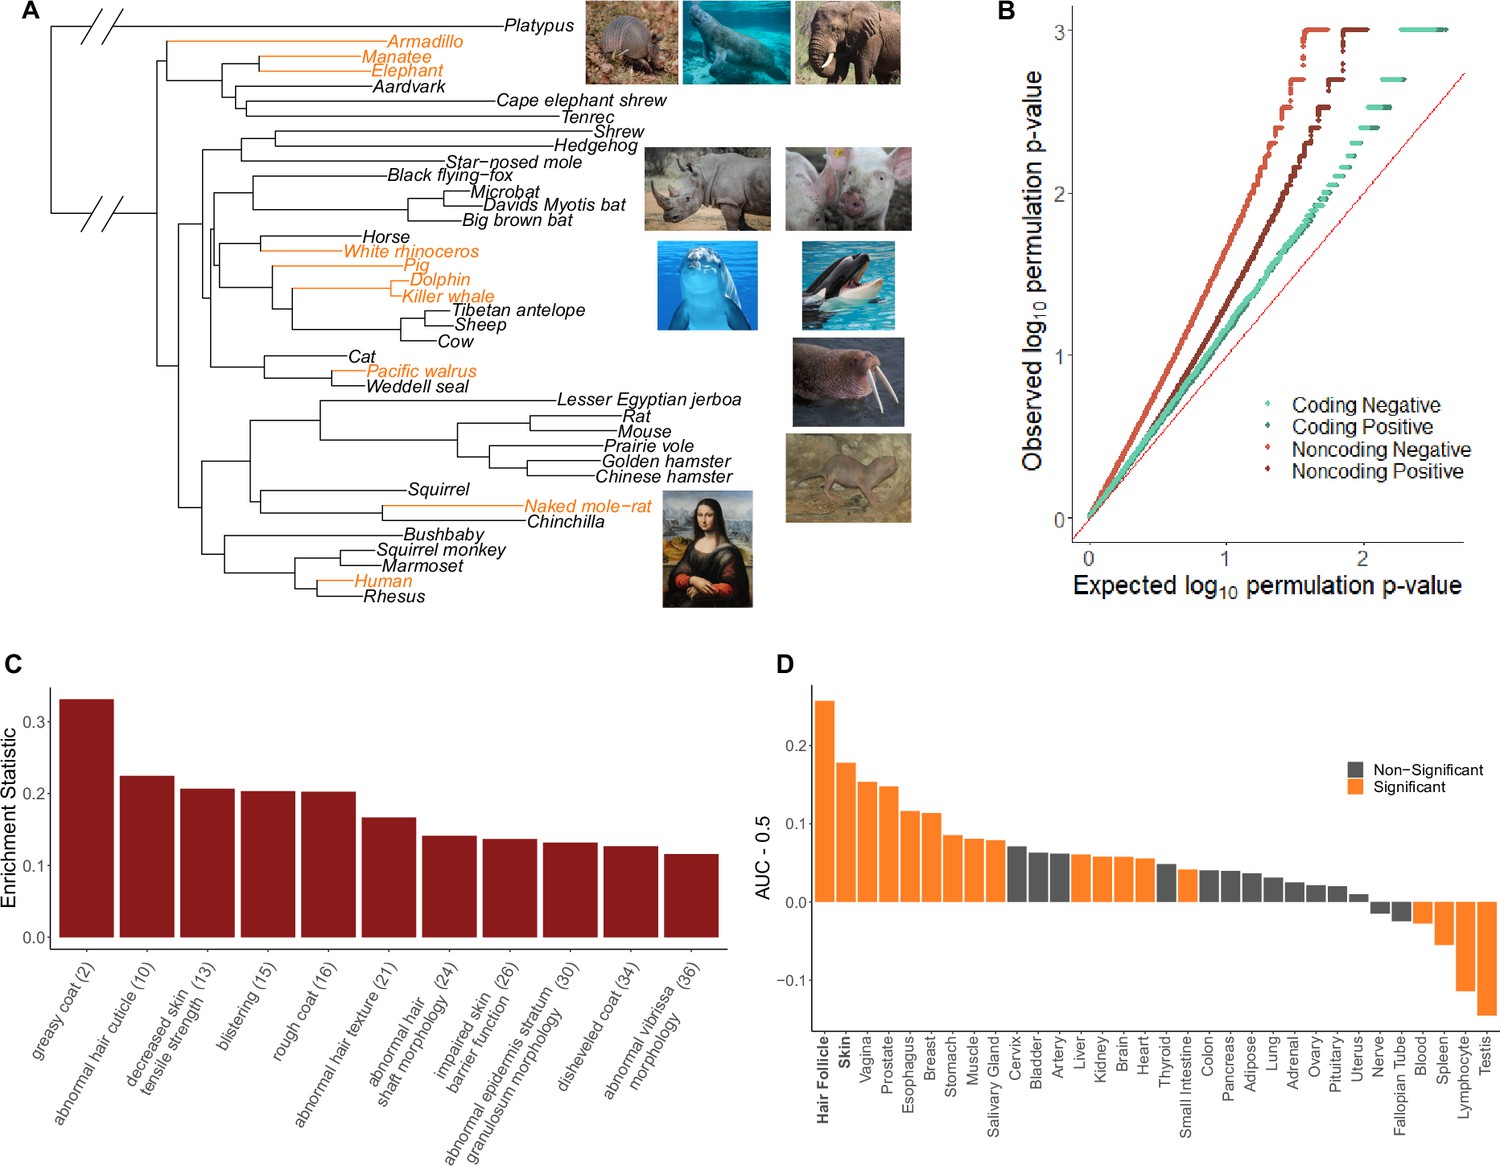
Hairless species show an enrichment of hair-related genes and noncoding elements whose evolutionary rates are significantly associated with phenotype evolution.
(A) Phylogenetic tree showing a subset of the 62 mammal species used for analyses. Note that all 62 species were included in analyses and only a subset are shown here for visualization purposes. Foreground branches representing the hairless phenotype are depicted in orange alongside photographs of the species. (B) Q-Q plots for uniformity of permulation p-values for association tests per genetic element for coding and noncoding elements. Shown are both positive associations that indicate accelerated evolution in hairless species and negative associations that indicate decelerated evolution in hairless species. The deviation from the red line (the identity) indicates an enrichment of low permulation p-values – there are more significant permulation p-values than we would observe under the uniform null expectation. This indicates significant evolutionary rate shifts for many genes and noncoding elements in hairless mammals. (C) Hair-related Mouse Genome Informatics (MGI) category genes are under significantly accelerated evolution in hairless species. Shown are the AUC (Area Under the Receiver Operating Characteristic curve) values minus 0.5 (maximum enrichment statistic = 0.5, minimum enrichment statistic = –0.5; statistic = 0 indicates no enrichment) for each hair- or skin-related pathway with a permulation p-value≤0.01. In parentheses are the statistic-based ranks of those pathways among all pathways under accelerated evolution in hairless mammals with permulation p-values≤0.01. (D) Skin- and hair-expressed genes are under significant evolutionary rate acceleration in hairless species. All genesets except hair follicle are from the GTEx tissue expression database. Hair follicle genes are the top 69 most highly expressed genes from Zhang et al., 2017 hair follicle RNA sequencing that are not ubiquitously expressed across GTEx tissue types.
-
Figure 1—source data 1
Phenotypes.
Species phenotype information (weight, marine status, and hairless status), names, and genome codes.
- https://cdn.elifesciences.org/articles/76911/elife-76911-fig1-data1-v2.csv
-
Figure 1—source data 2
Gene results.
Full gene results, including gene name, UCID, RERconverge results, Bayes factor results, and enrichment statistics, for nearby noncoding regions.
- https://cdn.elifesciences.org/articles/76911/elife-76911-fig1-data2-v2.xlsx
-
Figure 1—source data 3
Conserved noncoding element results.
Conserved noncoding element RERconverge results.
- https://cdn.elifesciences.org/articles/76911/elife-76911-fig1-data3-v2.csv
-
Figure 1—source data 4
Positive selection results.
Results from branch-site models to test for positive selection on KRTs, KRTAPs, and genes under accelerated evolution in hairless species.
- https://cdn.elifesciences.org/articles/76911/elife-76911-fig1-data4-v2.csv
-
Figure 1—source data 5
Pathway enrichment results.
Pathway enrichment results from coding and noncoding regions.
- https://cdn.elifesciences.org/articles/76911/elife-76911-fig1-data5-v2.xlsx
-
Figure 1—source data 6
Pathway enrichment results with no KRT or KRTAP genes.
Pathway enrichment results from coding regions after removing all KRT and KRTAP proteins.
- https://cdn.elifesciences.org/articles/76911/elife-76911-fig1-data6-v2.xlsx
-
Figure 1—source data 7
hg19 coordinates for conserved noncoding elements.
Human genome (hg19) coordinates for all conserved noncoding elements.
- https://cdn.elifesciences.org/articles/76911/elife-76911-fig1-data7-v2.txt
-
Figure 1—source data 8
mm10 coordinates for conserved noncoding elements.
Mouse genome (mm10) coordinates for all conserved noncoding elements.
- https://cdn.elifesciences.org/articles/76911/elife-76911-fig1-data8-v2.txt
-
Figure 1—source data 9
Shared genes in Mouse Genome Informatics (MGI) and tissue expression pathway annotations.
Number of genes annotated and number of annotated genes shared for MGI and tissue expression enrichment results in Figure 1C and D.
- https://cdn.elifesciences.org/articles/76911/elife-76911-fig1-data9-v2.xlsx
Figure 1—figure supplement 1
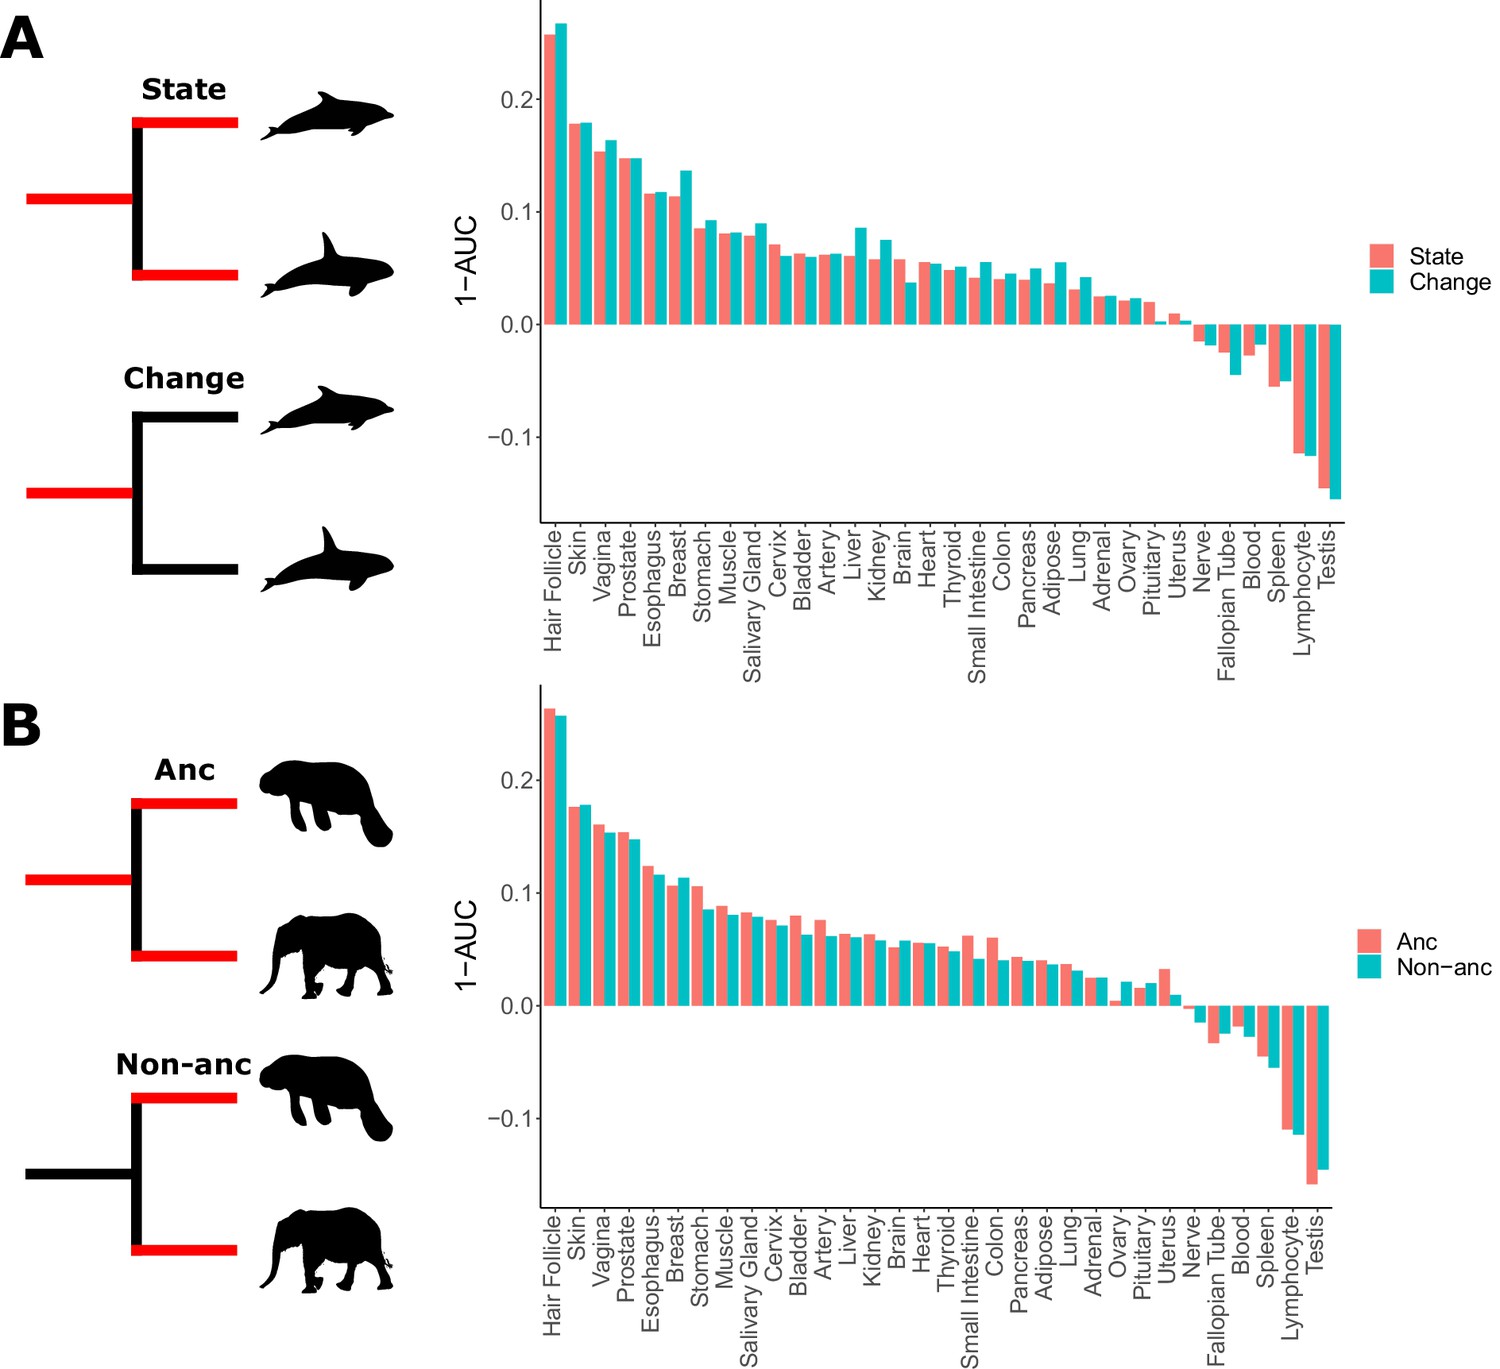
Skin-related genes evolve faster in hairless species.
(A) When considering either the state of being hairless as the foreground or the process of changing from haired to hairless as the foreground, enrichment of skin-related genes shows little difference. (B) When considering the elephant/manatee ancestor as haired or hairless, an area of uncertainty in phenotype evolution, enrichment of skin-related genes shows little difference.
Figure 1—figure supplement 2

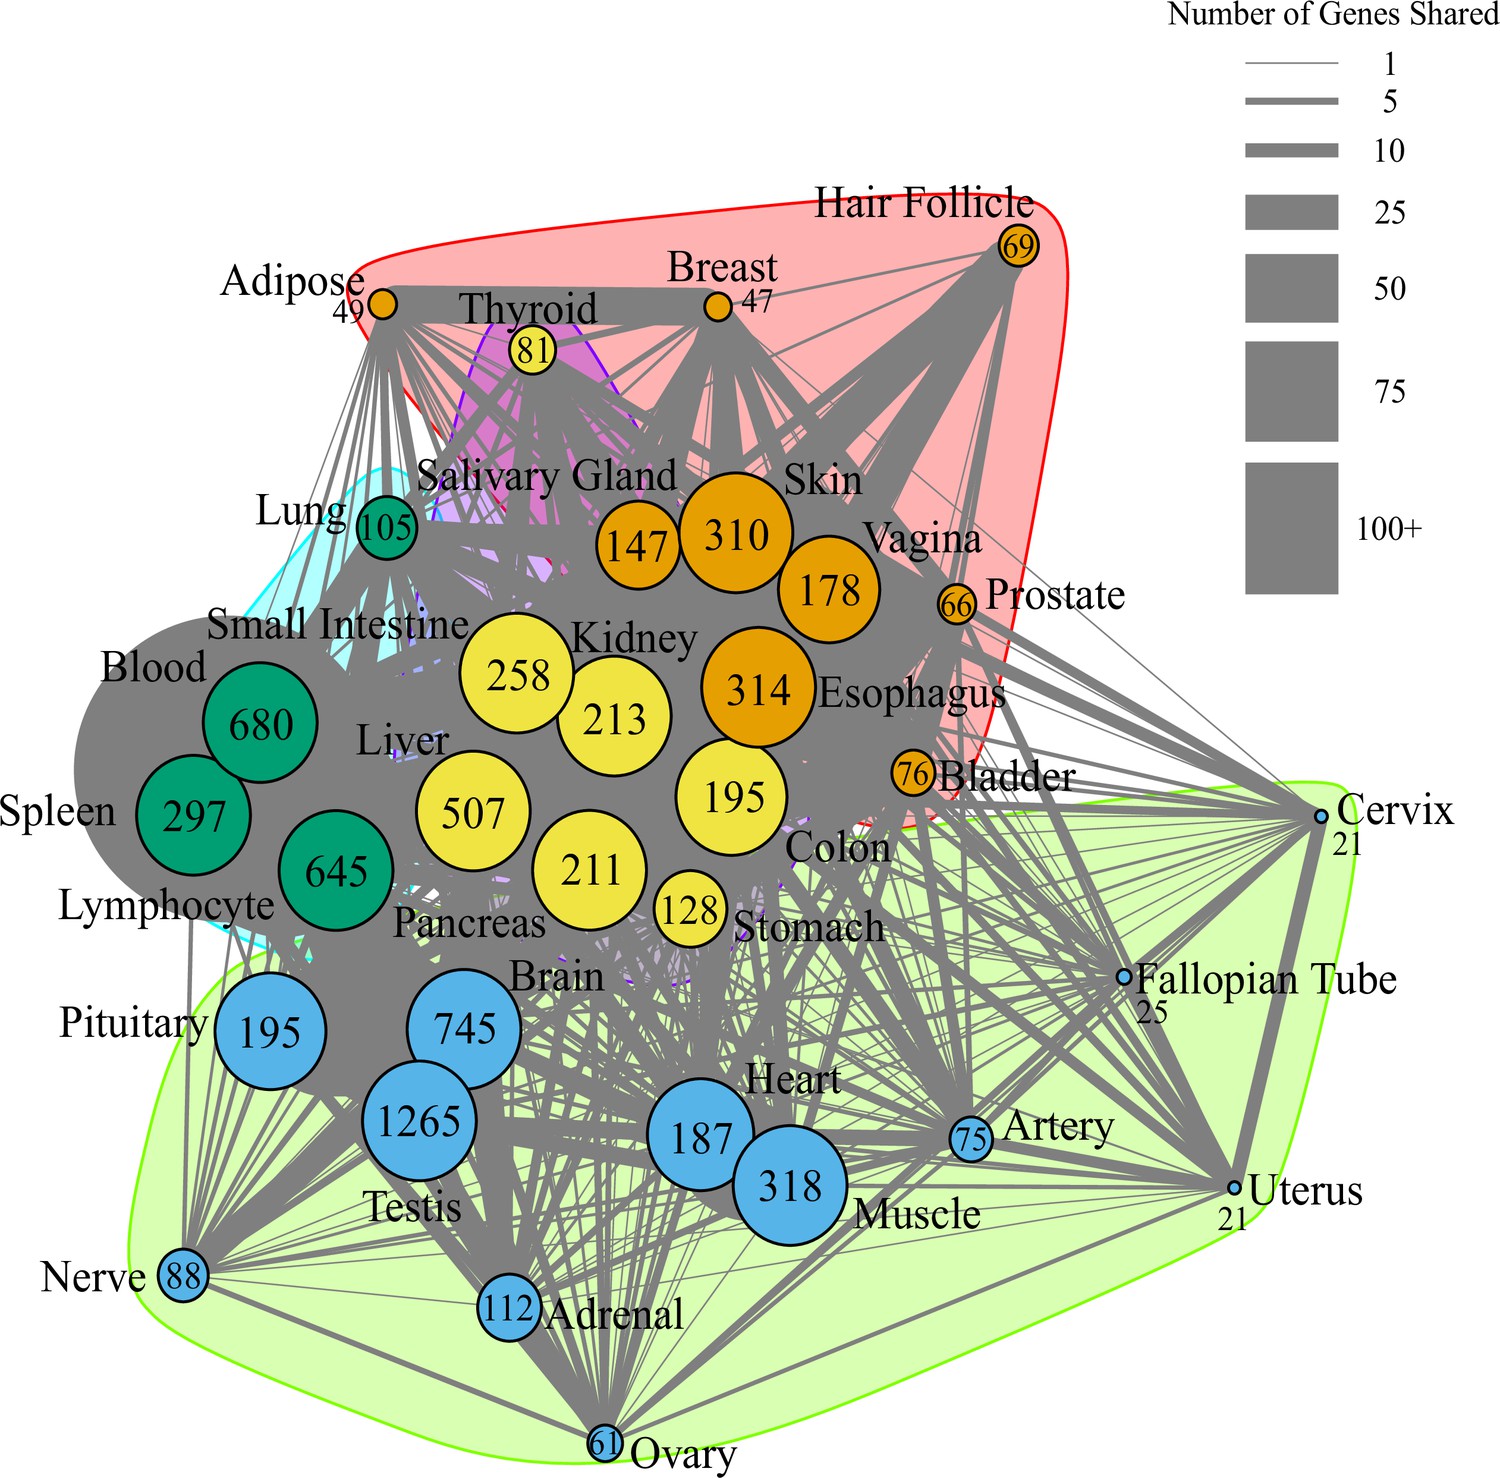
Network of pathway annotations shown in Figure 1C.
Size of nodes and numbers in nodes indicate the number of genes in the pathway. Width of lines connecting nodes indicates the number of genes shared between pathways. Values for node sizes and edge widths are given in Figure 1—source data 9. Visualization was generated using igraph (Csardi and Nepusz, 2006) with optimal clustering to identify groups shown with different colored nodes and shading.
Figure 1—figure supplement 3
Network of pathway annotations shown in Figure 1D.
Size of nodes and numbers in nodes indicate the number of genes in the pathway. Note that pathways with more than 200 genes were binned to the same node size for clarity of visualization. Width of lines connecting nodes indicates the number of genes shared between pathways. Values for node sizes and edge widths are given in Figure 1—source data 9. Visualization was generated using igraph (Csardi and Nepusz, 2006) with optimal clustering to identify groups shown with different colored nodes and shading.
Figure 1—figure supplement 4
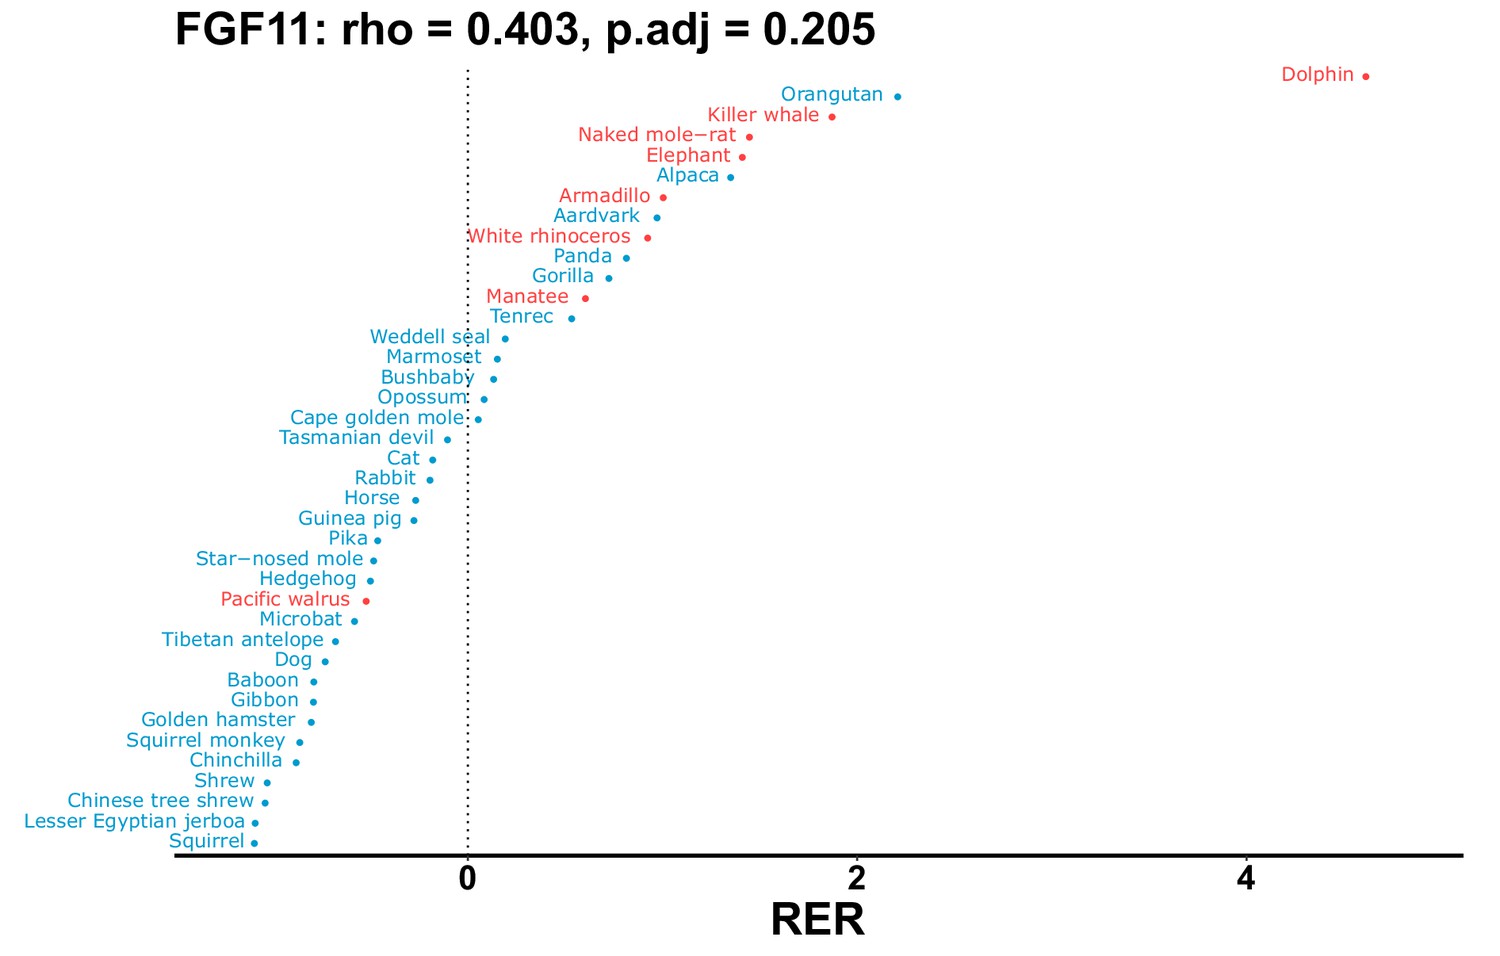
Plot of RER values for each species for the FGF11 gene.
Figure 1—figure supplement 5
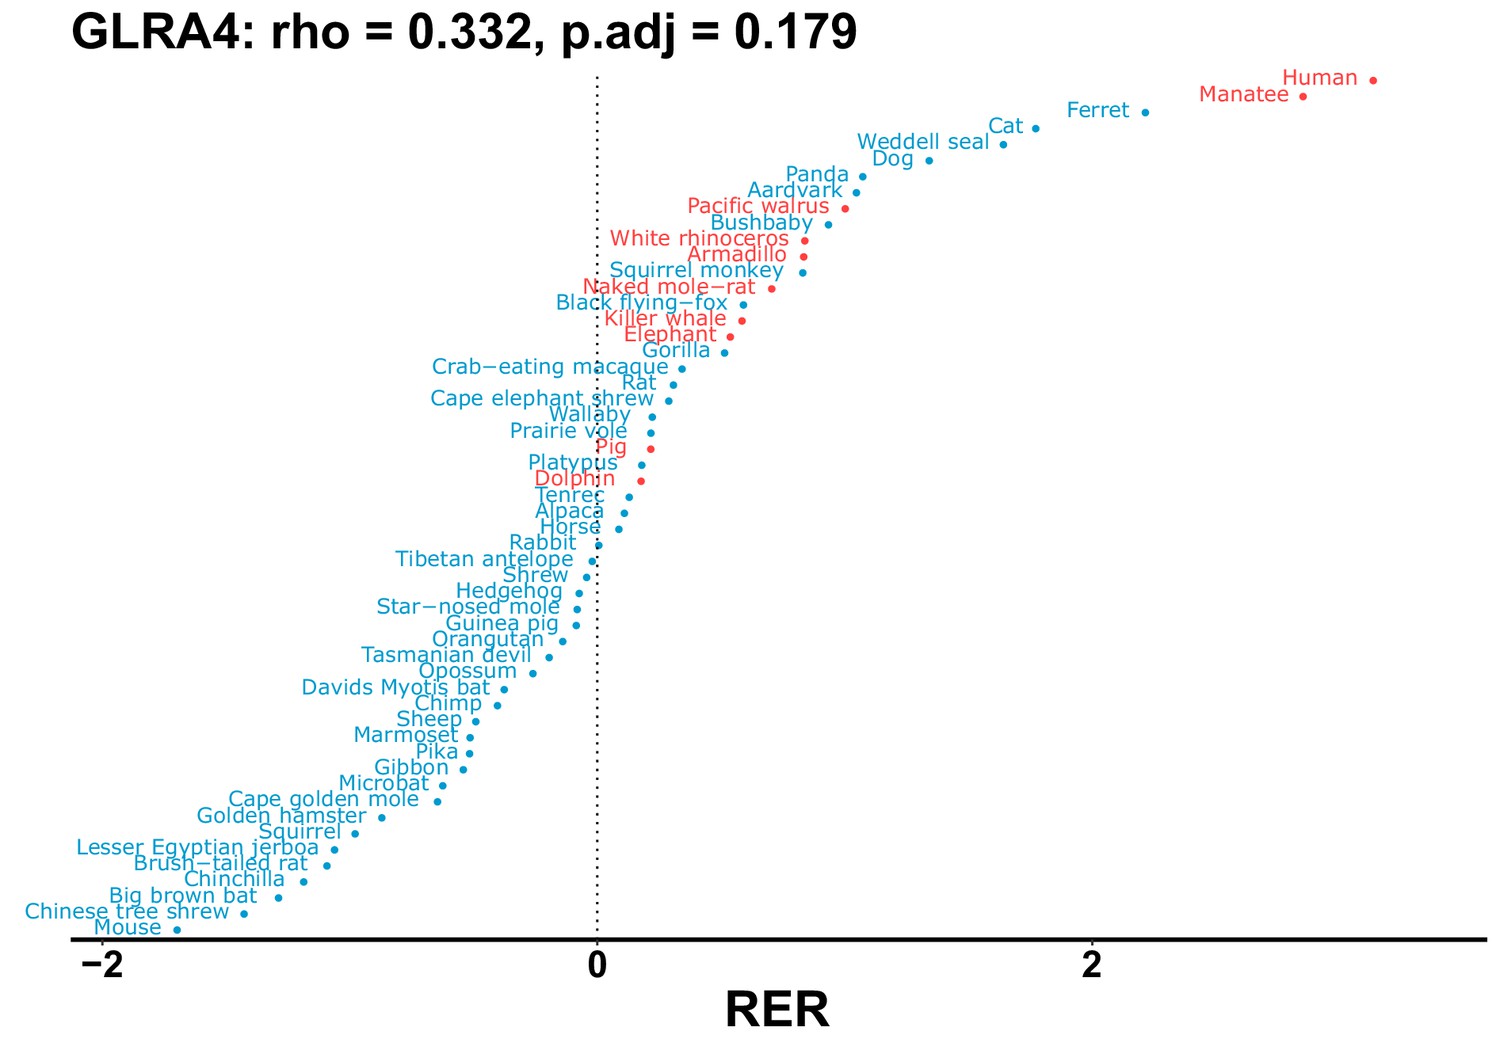
Plot of RER values for each species for the GLRA4 gene.
Figure 1—figure supplement 6
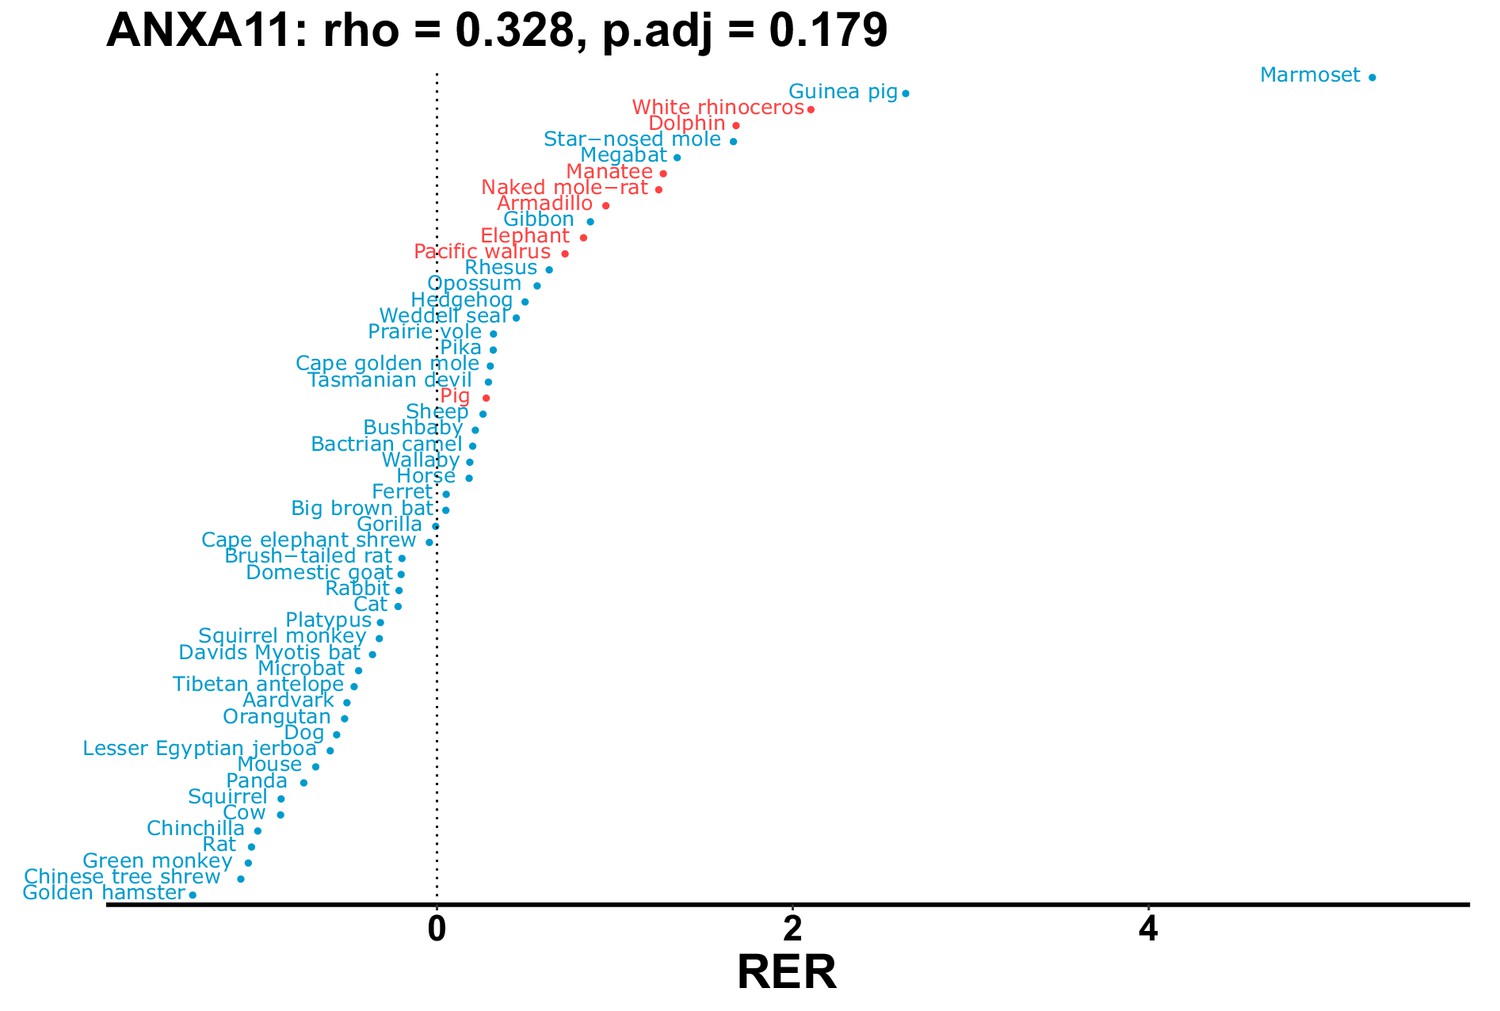
Plot of RER values for each species for the ANXA11 gene.
Figure 1—figure supplement 7
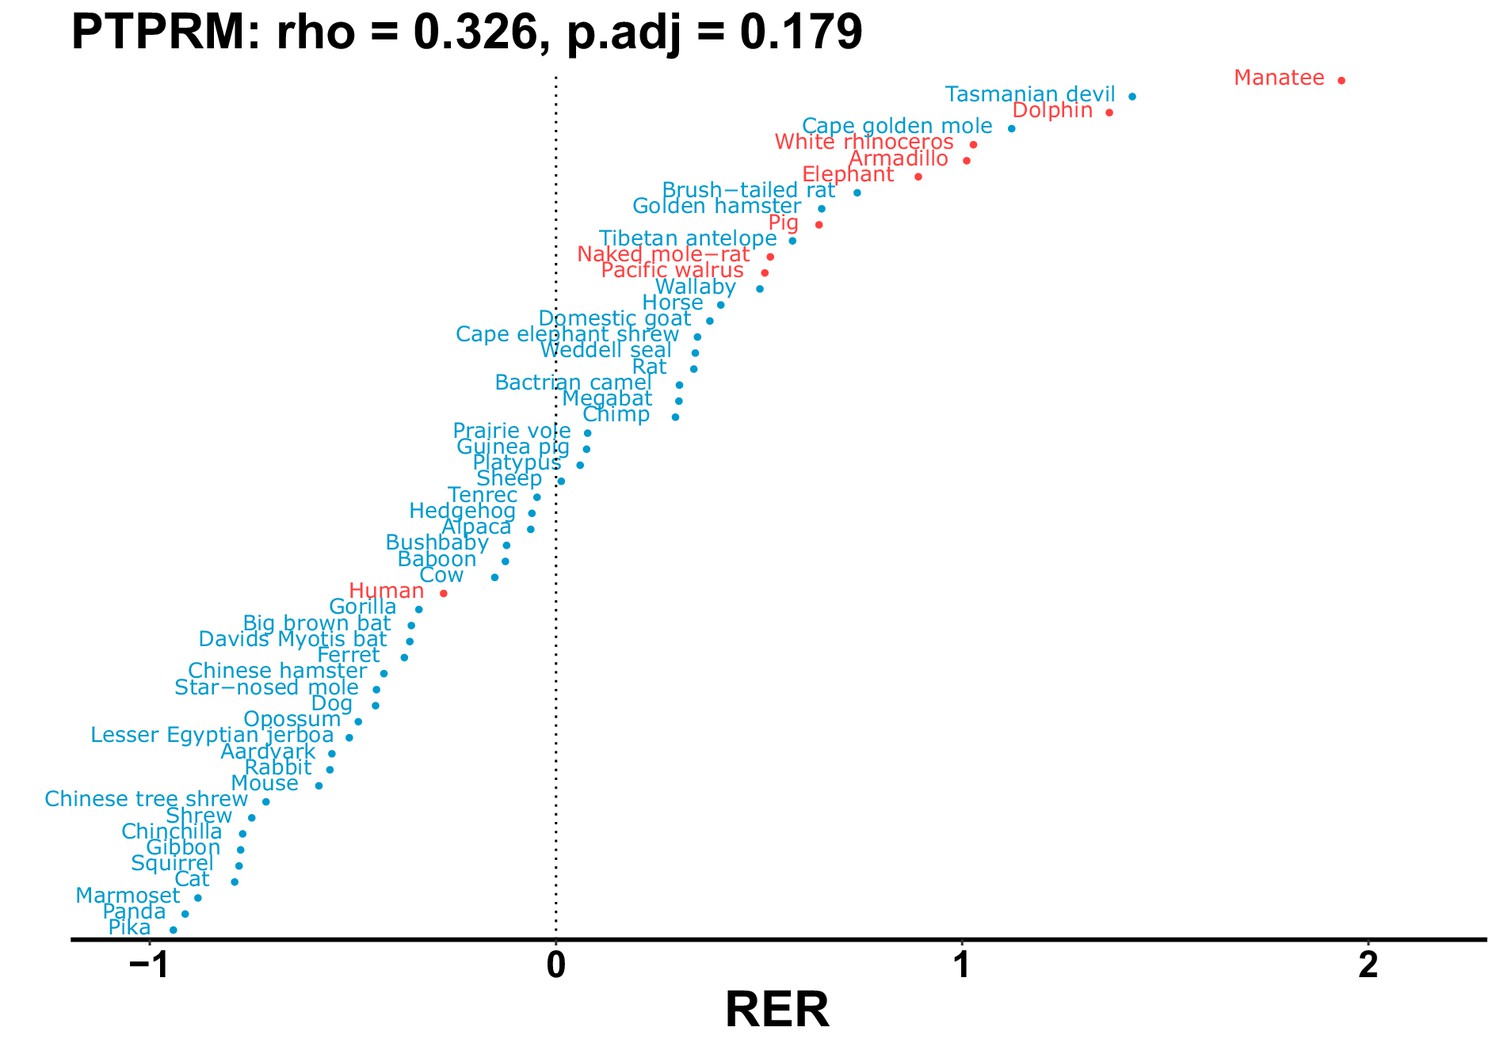
Plot of RER values for each species for the PTPRM gene.
Figure 1—figure supplement 8
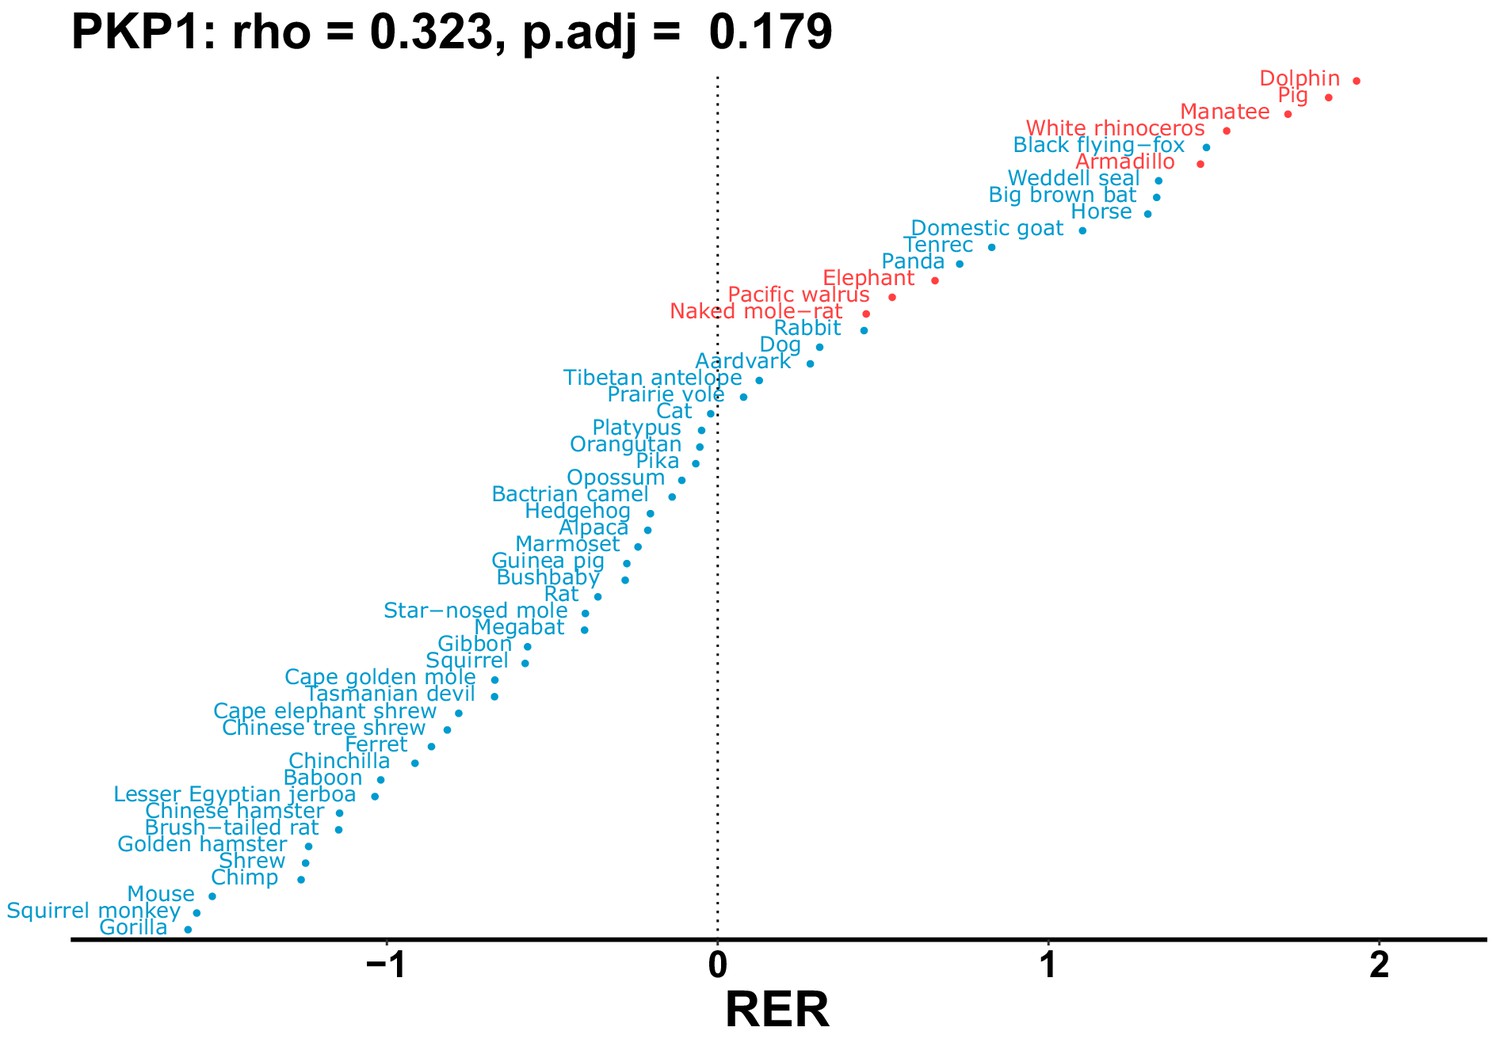
Plot of RER values for each species for the PKP1 gene.
Figure 1—figure supplement 9
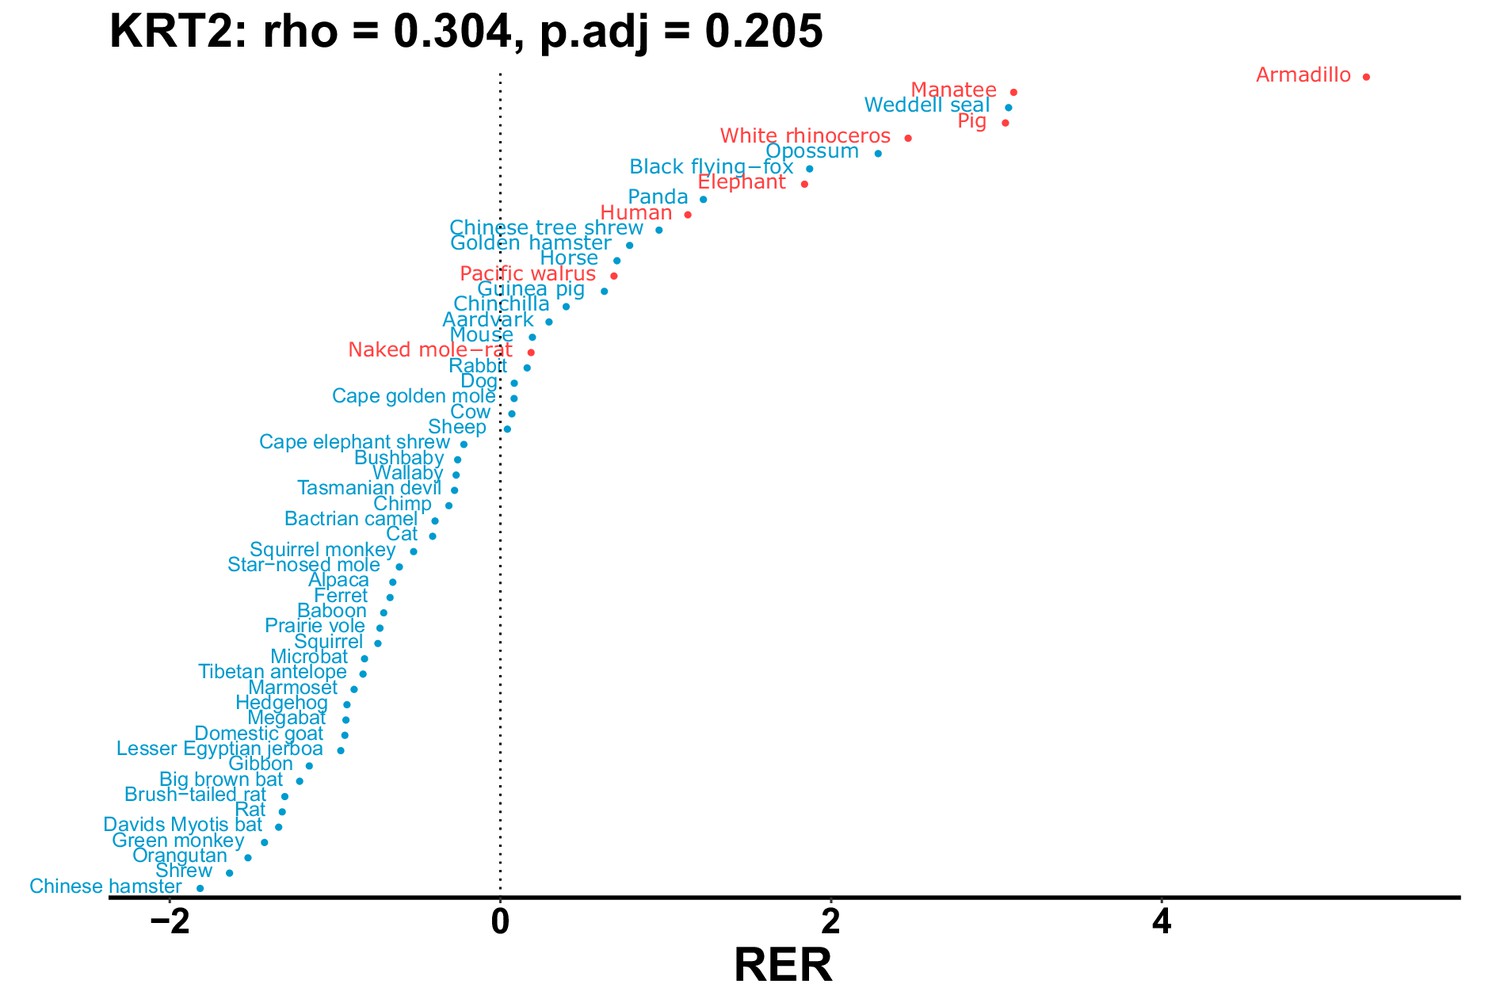
Plot of RER values for each species for the KRT2 gene.
Figure 1—figure supplement 10

Plot of RER values for each species for the MYH4 gene.
Figure 1—figure supplement 11
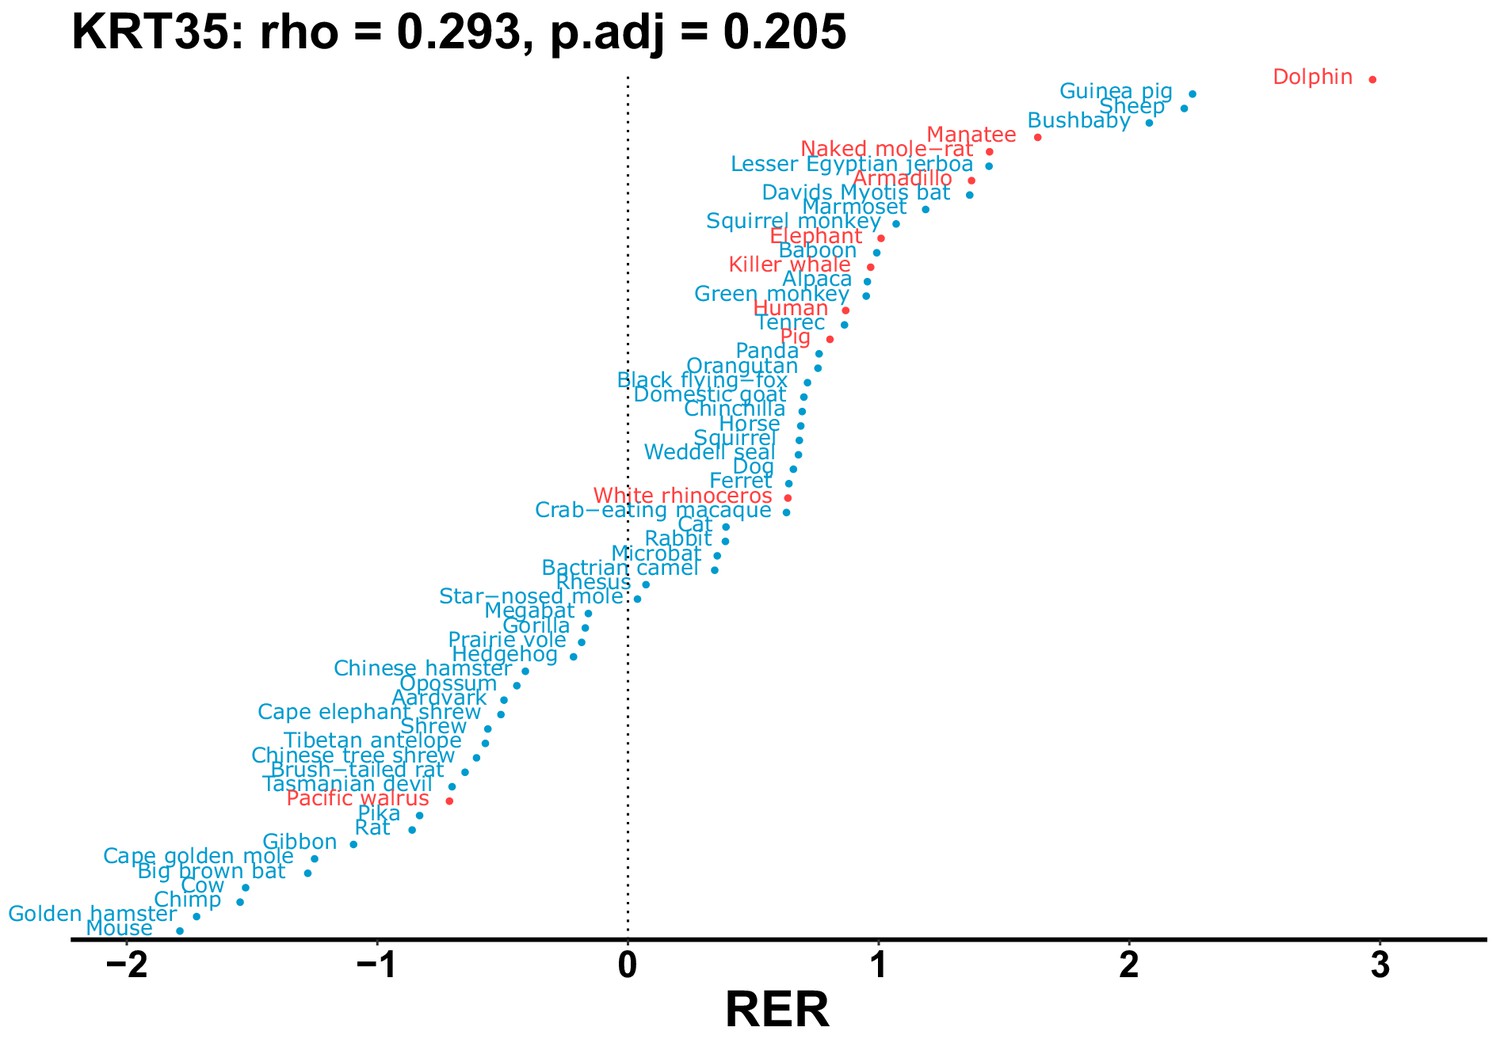
Plot of RER values for each species for the KRT35 gene.
Figure 2
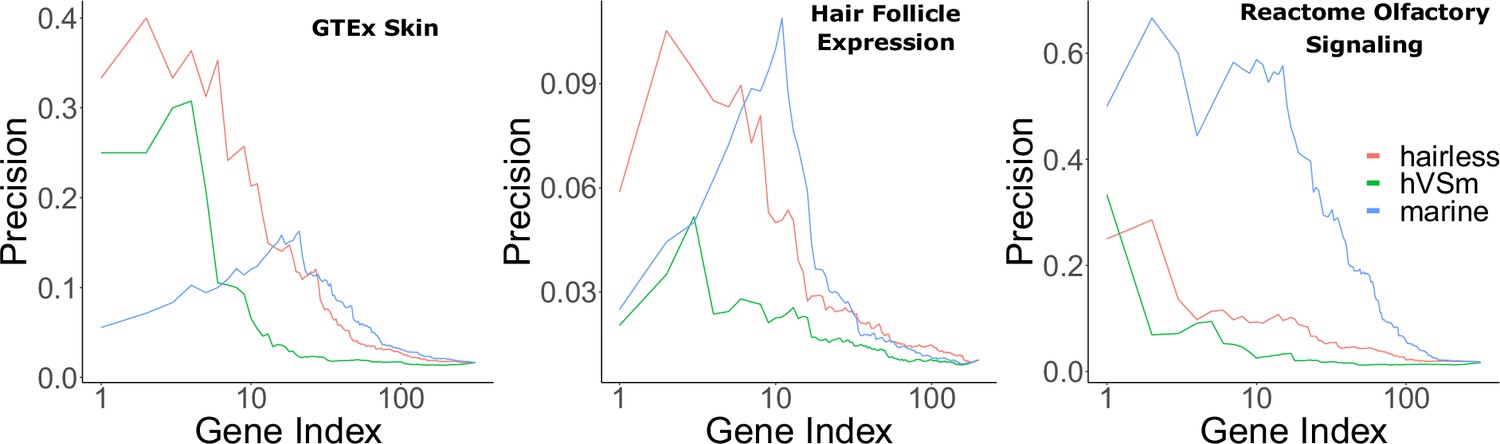
Bayes factors reveal the proportion of signal driven by the marine phenotype versus the hairless phenotype.
Depicted are precision-recall curves demonstrating how Bayes factors of the contrasting hairless and marine phenotypes rank genes related to skin, hair, and olfaction. Also plotted is a ranking based on the ratio of hairlessness and marine Bayes factors (hVSm = hairlessness Bayes factor/marine Bayes factor). The ratio of the Bayes factors quantifies the amount of support for the hairless phenotype beyond the support for the marine phenotype per gene. In other words, a high Bayes factor ratio indicates a signal of evolutionary convergence associated with hairlessness that is not only driven by signals of convergence in hairless marine mammals. The hairless phenotype had much greater power to enrich for genes expressed in skin (GTEx data) compared to the marine phenotype, indicating that accelerated evolution is driven more strongly by hairlessness. Both the marine and hairless phenotypes enriched for genes in hair follicle expression genes, indicating that both contribute to accelerated evolution of those genes. Olfactory genes, on the other hand, are expected to show acceleration only related to the marine phenotype. As expected, the marine phenotype is much more strongly enriched for olfactory genes than the hairless phenotype.
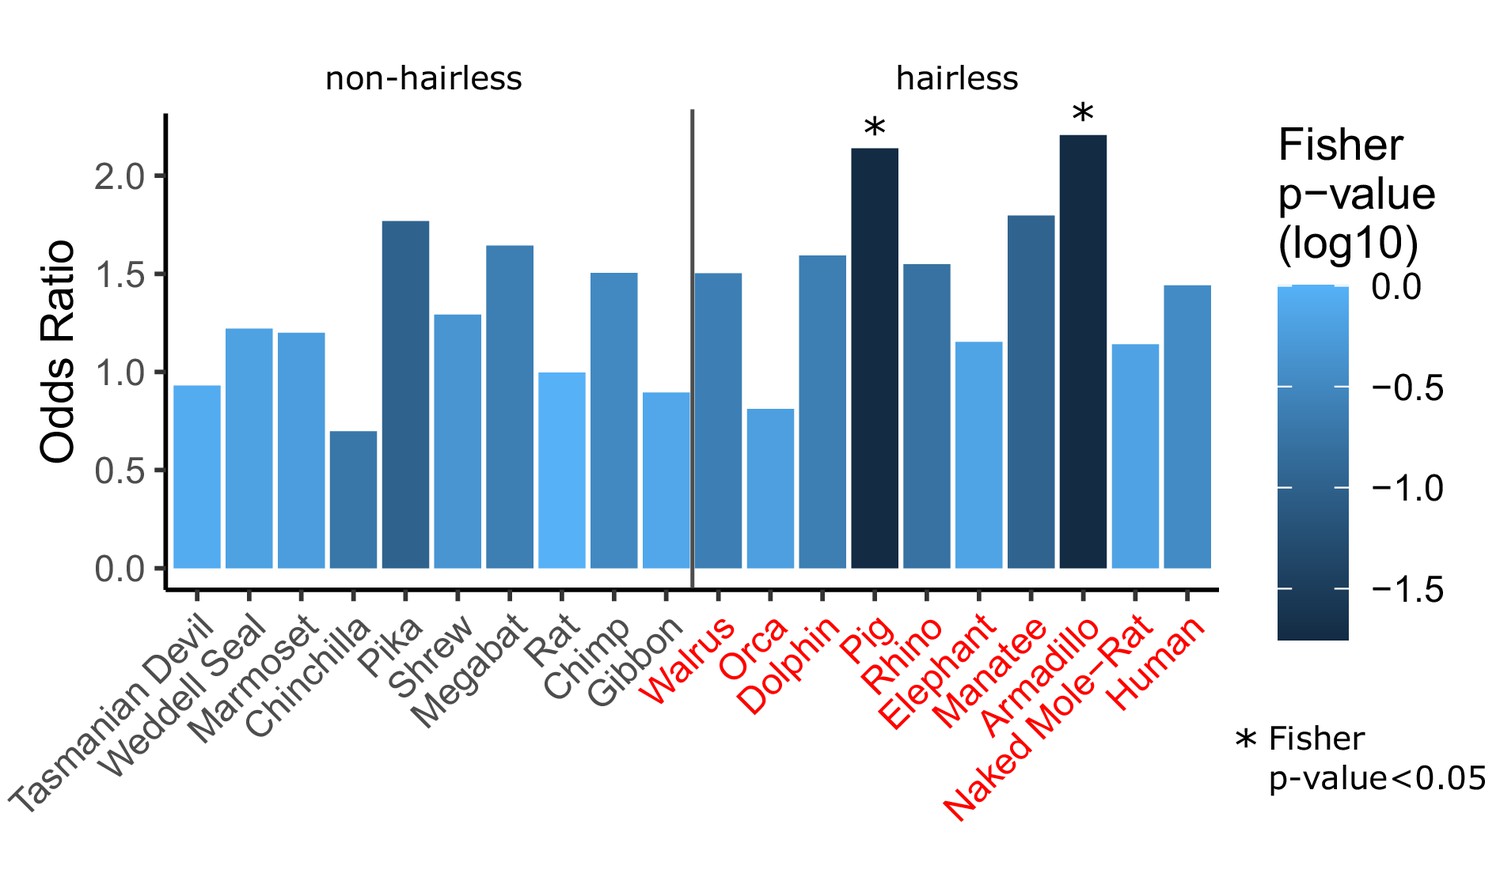
Figure 3 with 1 supplement
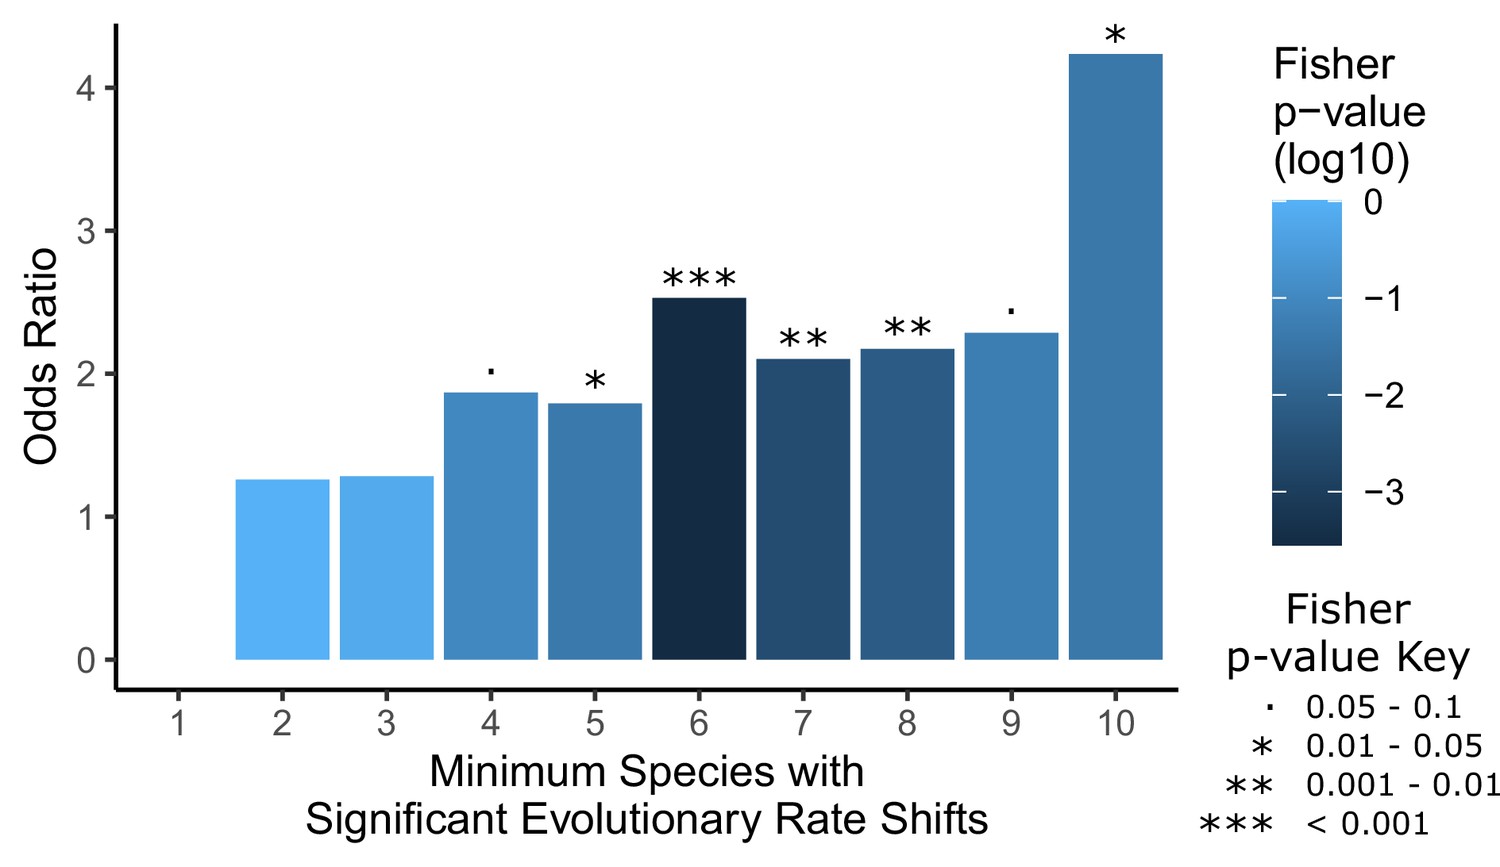
Convergent analyses show stronger enrichment for hair-related genes than single-species analyses.
Each hairless species was individually tested for a significant rate shift compared to non-hairless species using a Wilcoxon signed-rank test. Then a Fisher’s exact test was used to test for an enrichment of hair follicle genes (as shown in Figure 1D) with a minimum number of hairless species, ranging from 1 species to all 10 species, with significant rate shifts. Note that the odds ratio for an enrichment with a minimum of one species is not well defined because most genes genome-wide have at least one hairless species with a significant rate shift (18,582 genes out of 18,822 that could be tested), including all hair follicle genes, and their enrichment was not significant (p=0.64). Overall, enrichment strength increases moving from left to right on the plot as the geneset of interest becomes restricted to genes with a larger number of species with rate shifts, although p-values are less extreme because there are simply fewer genes in those categories with higher numbers of species. This demonstrates the convergent signal that allows for detection of hair-related genetic elements based on shared rate shifts.
-
Figure 3—source data 1
Species-specific analysis results.
Species-specific analysis results shown in Figure 2 and its supplement. Included are Wilcoxon signed-rank test results per species per gene, hair enrichment per species, hair enrichment per minimum species cutoff, and total number of genes with significant shifts per species.
- https://cdn.elifesciences.org/articles/76911/elife-76911-fig3-data1-v2.xlsx
Figure 3—figure supplement 1
Single-species analyses show inconsistent enrichment of hair follicle genes.
For each species listed (all 10 hairless species and 10 randomly selected non-hairless species), Wilcoxon signed-rank tests were run per gene to detect significant rate shift in the specified species compared to other species. A Fisher’s exact test was then run to test for enrichment of hair follicle genes (as shown in Figure 1D) among genes with significant rate shifts. Although two hairless species do show significant rate shifts, the trend is not consistent across all hairless species, most of which show similar enrichment to non-hairless species. This suggests that studying single species alone is often insufficient to identify hair-related genes. Further, genes with substantial changes in individual species may represent species-specific adaptation that do not apply globally across species that share similar phenotypes. Finally, single-species analyses are insufficient to distinguish genetic element functions may be related to a variety of species-specific adaptations and they are unable to prioritize function-related elements due to the large number of unique changes observed in each species (see Figure 3—source data 1, counts range from 5,641 for orca to 12,103 for manatee).
Figure 4

Hair-related pathways are enriched for genes with evolutionary rates significantly accelerated in hairless species.
Enrichment is consistent even when individual hairless species are removed.
Figure 5
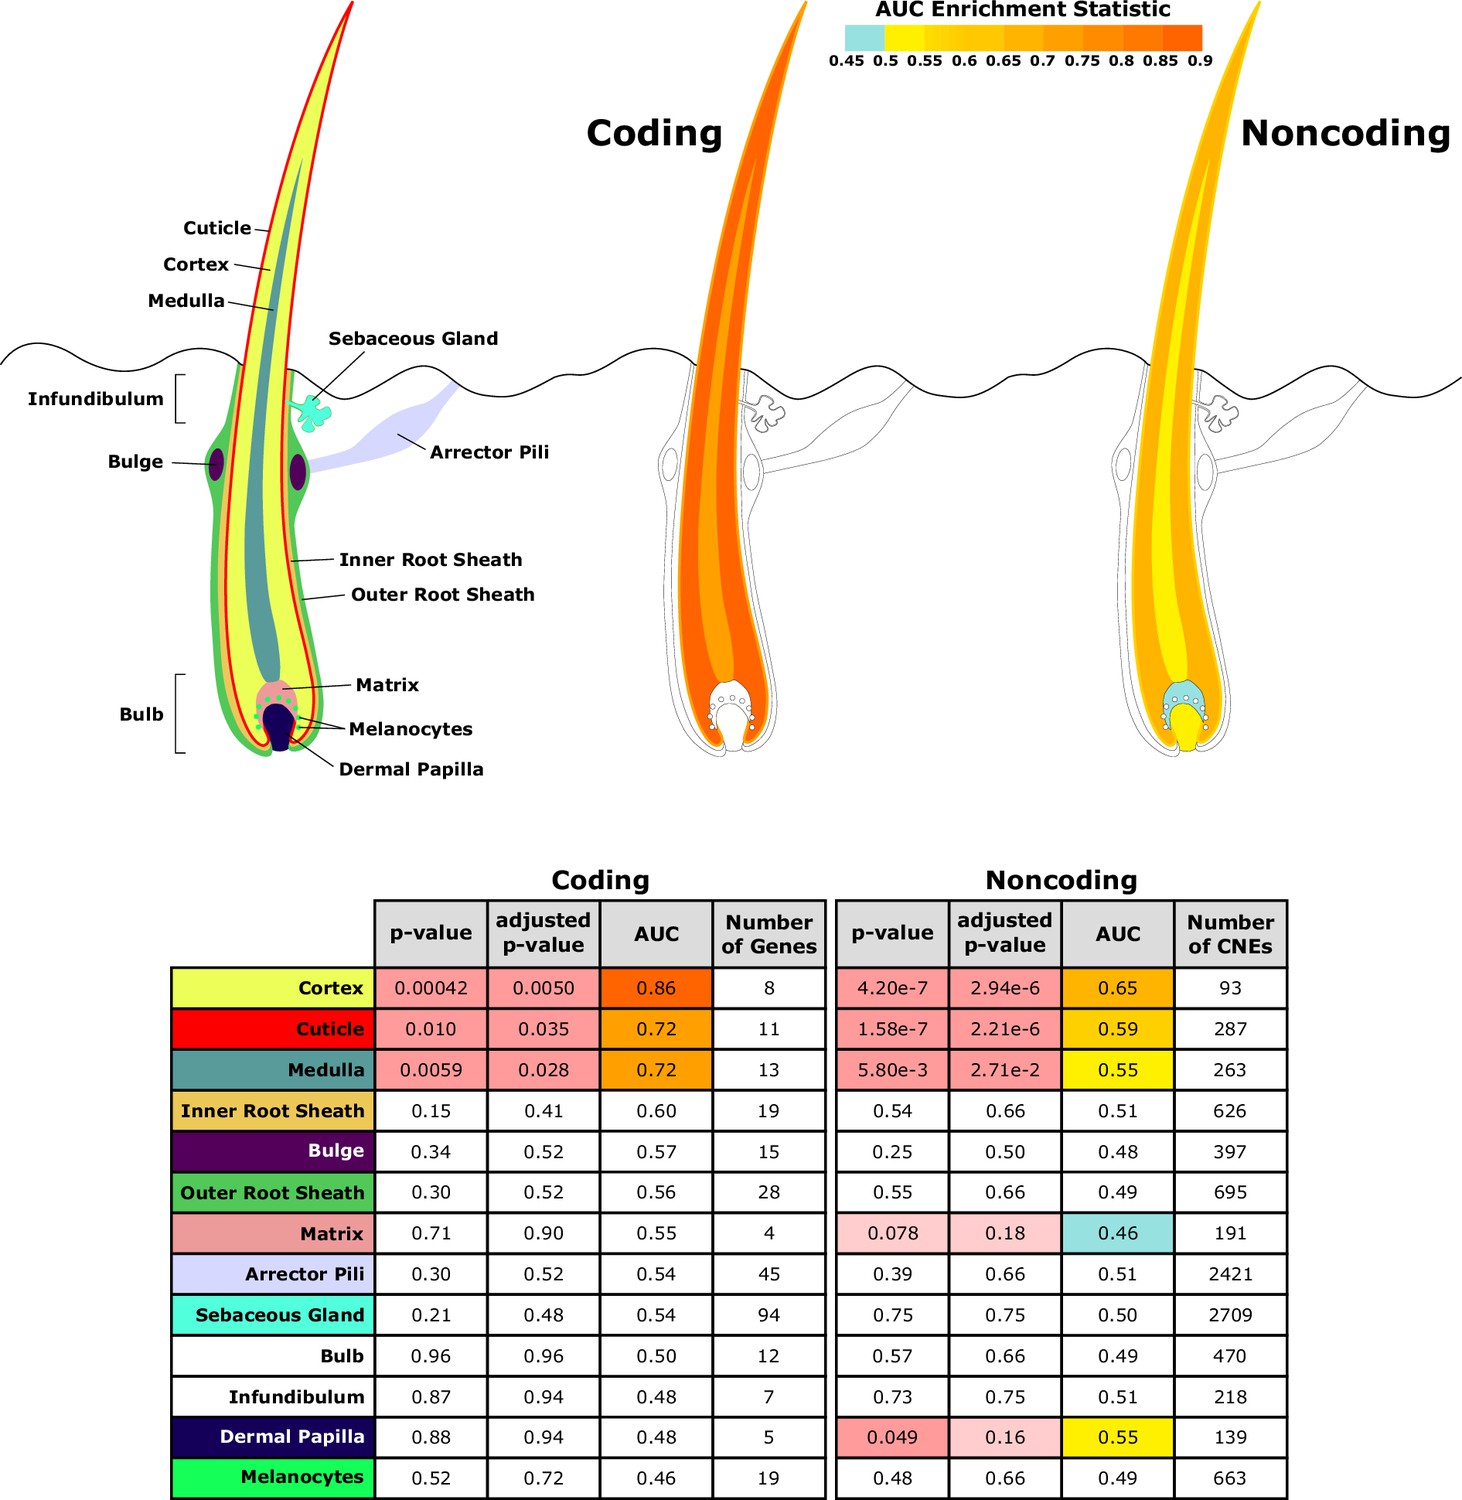
Diagram of hair shaft and follicle with shading representing region-specific enrichment for coding and noncoding sequence.
Both coding and noncoding sequence demonstrate accelerated evolution of elements related to hair shaft (cortex, cuticle, and medulla). Noncoding regions demonstrate accelerated evolution of matrix and dermal papilla elements not observed in coding sequence. All compartment genesets were compiled from Mouse Genome Informatics (MGI) annotations that contained the name of the compartment except the arrector pili geneset (Santos et al., 2015).
Figure 6
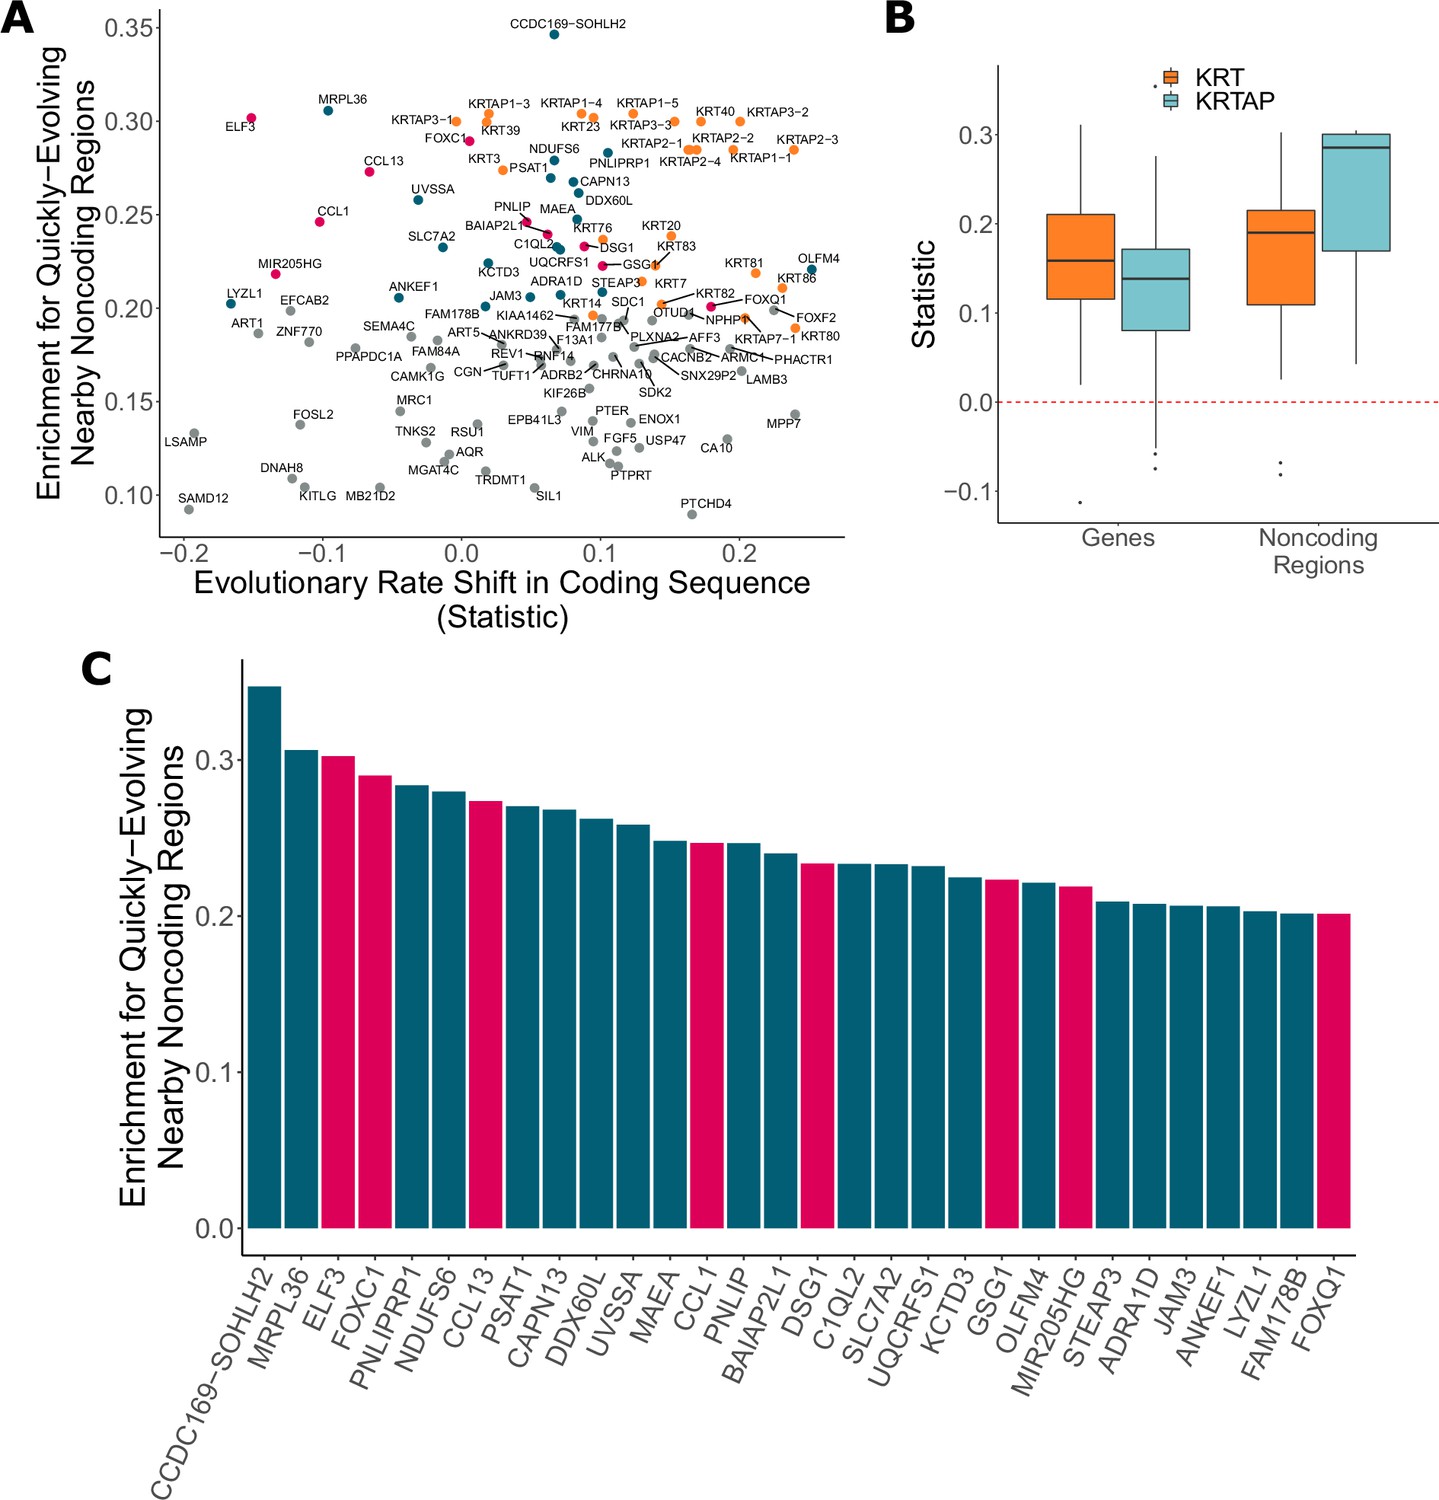
Noncoding regions near hair-related genes evolve faster in hairless species.
(A) Genes with a significant enrichment for quickly evolving nearby noncoding regions (permulation p-value of 0.03 or less) only sometimes demonstrate evolutionary rate shifts in their protein-coding sequences. In orange are keratins and keratin-associated proteins, which tend to show accelerated evolutionary rates in both genes and nearby noncoding regions. In pink are top genes, also in pink in panel (C). In blue are all other genes in panel (C). (B) Keratin (KRT) and keratin-associated protein (KRTAP) genes and nearby noncoding sequence show enrichment for accelerated evolutionary rates. Shown are rate shift statistics for genes and enrichment statistics for noncoding regions. (C) Many top-ranked genes for nearby quickly evolving noncoding regions are hair-related. Depicted are the top 30 genes (KRTs and KRTAPs excluded) based on enrichment statistic with enrichment permulation p-value of 0.03 or less. No genes had significant evolutionary rate shifts in coding sequence except OLFM4, which evolves faster in hairless species. In pink are genes with hair-related functions in the literature (citations: ELF3 [Blumenberg, 2013], FOXC1 [Lay et al., 2016], CCL13 [Michel et al., 2017; Suárez-Fariñas et al., 2015], CCL1 [Nagao et al., 2012], DSG1 [Zhang et al., 2017], GSG1 [Umeda-Ikawa et al., 2009], MIR205HG [Wang et al., 2013], FOXQ1 [Ashburner et al., 2000; Carbon et al., 2019]).
Figure 7

Top miRNAs with nearby noncoding regions with evolutionary rates significantly associated with the hairless phenotype.
(A) Wilcoxon rank-sum enrichment statistics and Benjamini–Hochberg corrected p-values for top-ranked miRNAs. (B) Precision recall curve of statistic ranks for CNEs near mir205 demonstrates an enrichment of CNEs with accelerated evolution near mir205 compared to all noncoding regions near microRNAs. (C) The chromosomal region around mir205 shows a large number of CNEs accelerated in hairless species, as seen for RERconverge and Bayes factor scores. Note the relative decline of peaks in the vicinity of nearby protein-coding genes such as CAMK1G to the right. (D) mir205 is well-known to be associated with hair and skin growth and structure. Its transcriptional unit on chromosome 1 shows clear read pileups from hair follicle RNAseq data (Zhang et al., 2017). Gray peaks represent the number of RNAseq read coverage, and blue curves represent splice junctions.
Tables
Table 1
Genes whose evolutionary rates are significantly associated with the hairless phenotype with significant parametric p-values, significant permulation p-values, positive statistic, and hairless versus marine Bayes factors (BF) greater than five.
BF marine and BF hairless are BF for those phenotypes individually, while BF hairless/BF marine is the ratio of the two. The ratio of the BF quantifies the amount of support for the hairless phenotype beyond the support for the marine phenotype per gene. In other words, a high BF ratio indicates a signal of evolutionary convergence associated with hairlessness that is not only driven by signals of convergence in hairless marine mammals. Also shown are enrichment statistics for noncoding regions near top genes. Adjusted p-values are Benjamini–Hochberg corrected. Note that permulation p-values observed as 0 were adjusted to 0.001 (the smallest observable permulation p-value) prior to multiple hypothesis testing correction. Cells with missing values (for ‘Enrichment statistic (noncoding)’ and ‘Enrichment p-adj (noncoding)’) do not have enough observations to calculate enrichment statistics because too few conserved noncoding elements were detected in the vicinity of those genes. Pseudogene calls are based on premature stop codons reported in Meyer et al., 2018.
| Gene | Statistic(gene) | p-adj(gene) | BF hairless/BF marine(gene) | BFhairless(gene) | BFmarine(gene) | Perm p-adj(gene) | Pseudogene (hairless species) | Enrichmentstatistic(noncoding) | Enrichment p-adj(noncoding) |
|---|---|---|---|---|---|---|---|---|---|
| FGF11 | 0.403 | 0.205 | 116.4 | 6354.7 | 54.6 | 0.201 | Dolphin | –0.115 | 0.051 |
| GLRA4 | 0.332 | 0.179 | 22.6 | 1908.3 | 84.3 | 0.201 | Manatee | –0.159 | 0.068 |
| ANXA11 | 0.328 | 0.179 | 25.5 | 45.2 | 1.8 | 0.201 | No | ||
| PTPRM | 0.326 | 0.179 | 51.7 | 4393.6 | 85.0 | 0.201 | No | 0.146 | 1.19e-9 |
| PKP1 | 0.323 | 0.179 | 5.6 | 2669.0 | 478.9 | 0.201 | No | 0.117 | 0.410 |
| KRT2 | 0.304 | 0.205 | 2235.7 | 27034.4 | 12.1 | 0.201 | Armadillo, naked mole-rat, orca, manatee | 0.175 | 0.181 |
| MYH4 | 0.297 | 0.205 | 28.0 | 11447.2 | 409.3 | 0.201 | Dolphin, orca | 0.147 | 0.311 |
| KRT35 | 0.293 | 0.205 | 8.6 | 1954.5 | 227.3 | 0.201 | Dolphin | 0.142 | 0.211 |
Additional files
-
Transparent reporting form
- https://cdn.elifesciences.org/articles/76911/elife-76911-transrepform1-v2.docx
-
Source data 1
Supplementary data include all gene, noncoding, and enrichment results, noncoding region coordinates, and other source data shown in figures.
- https://cdn.elifesciences.org/articles/76911/elife-76911-data1-v2.zip
Download links
A two-part list of links to download the article, or parts of the article, in various formats.
Downloads (link to download the article as PDF)
Open citations (links to open the citations from this article in various online reference manager services)
Cite this article (links to download the citations from this article in formats compatible with various reference manager tools)
Complementary evolution of coding and noncoding sequence underlies mammalian hairlessness
eLife 11:e76911.
https://doi.org/10.7554/eLife.76911


