A native chemical chaperone in the human eye lens
- Department of Chemistry and Chemical Biology, Harvard University, United States
- Department of Biochemistry, University of Washington, United States
- Center for Nanoscale Systems, Harvard University, United States
Figures
Figure 1 with 4 supplements
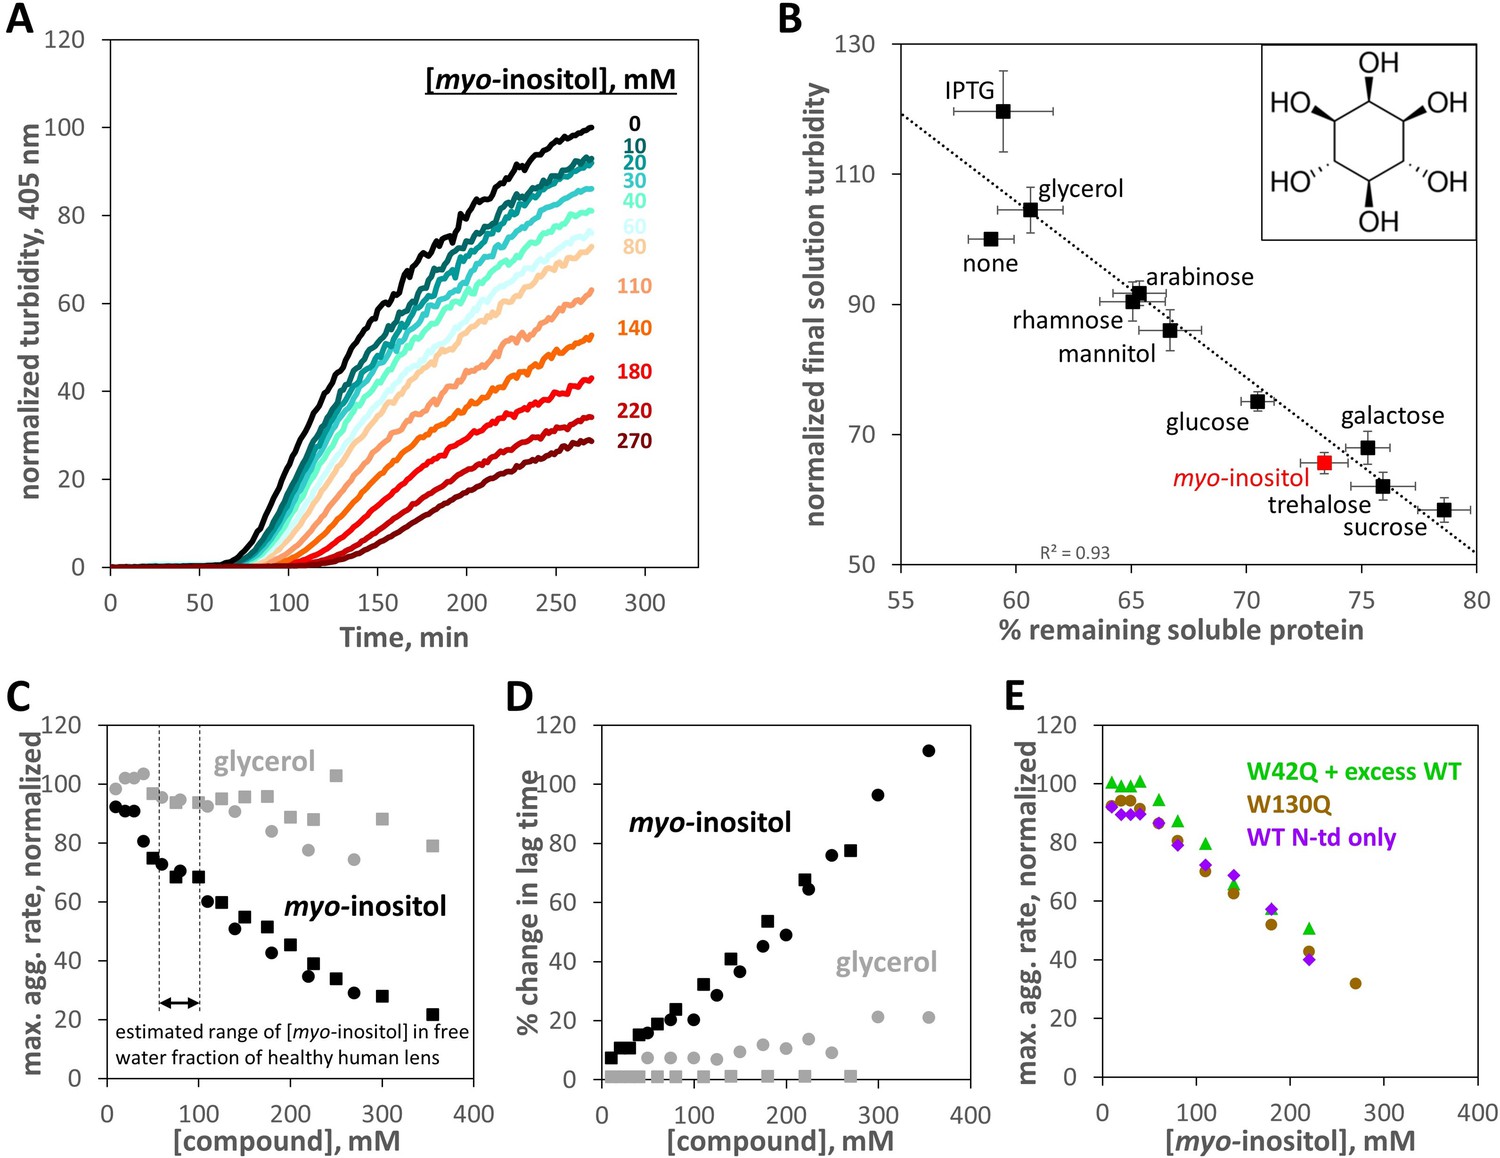
Suppression of human γD-crystallin aggregation by myo-inositol.
Oxidative aggregation of the cataract-mimicking W42Q variant of HγD was initiated as previously described (Serebryany et al., 2018). (A) Normalized turbidity traces for the oxidative aggregation of 40 μM HγD W42Q with varying concentrations of myo-inositol. (B) Sugars and sugar alcohols, each at 100 mM, suppressed HγD W42Q aggregation to varying degrees. Isopropyl-β-D-thiogalactoside (IPTG) moderately enhanced turbidity development. Myo-inositol (structure shown in inset) consistently and strongly suppressed turbidity development, second only to the disaccharides, trehalose and sucrose. A total of 8 independent replicates, at pH 7.4 (HEPES), pH 6.7 (PIPES), or pH 6.0 (MES) and 150 mM NaCl all produced similar results and were averaged together. Notably, the strong linear correlation between reduction in solution turbidity and increase in the proportion of protein remaining soluble indicated these compounds (except perhaps IPTG) did not significantly change aggregate geometry. Raw data are available as Figure 1—source data 1. (C) Dose response for aggregation suppression by myo-inositol compared to glycerol. Notably, myo-inositol had a significant effect in the physiological concentration range. Data from two independent replicates (circles, squares) are shown; black circles correspond to the data in panel A. All aggregation rates were normalized to the rate without myo-inositol. (D) Percent change in aggregation lag time for the same experiments as in Panel C. (E) Suppression of oxidative aggregation by myo-inositol generalizes to other HγD constructs: Green triangles, 20 μM W42Q whose aggregation is catalyzed by 180 μM WT HγD at 37 °C; Beige circles, 40 μM W130Q at 42 °C; Purple diamonds, 50 μM wild-type isolated N-terminal domain of HγD at 44 °C. All experiments were carried out in 10 mM PIPES pH 6.7, 150 mM NaCl, 1 mM EDTA, with 0.5 mM GSSG as the oxidant. Raw data and fitting for panels C,D,E are available as Figure 1—source data 2.
-
Figure 1—source data 1
Raw numerical values for turbidity endpoint assays in Figure 1B.
- https://cdn.elifesciences.org/articles/76923/elife-76923-fig1-data1-v2.xlsx
-
Figure 1—source data 2
Raw numerical data and fittings for solution turbidity data in Figure 1C,D,E.
- https://cdn.elifesciences.org/articles/76923/elife-76923-fig1-data2-v2.xlsx
Figure 1—figure supplement 1
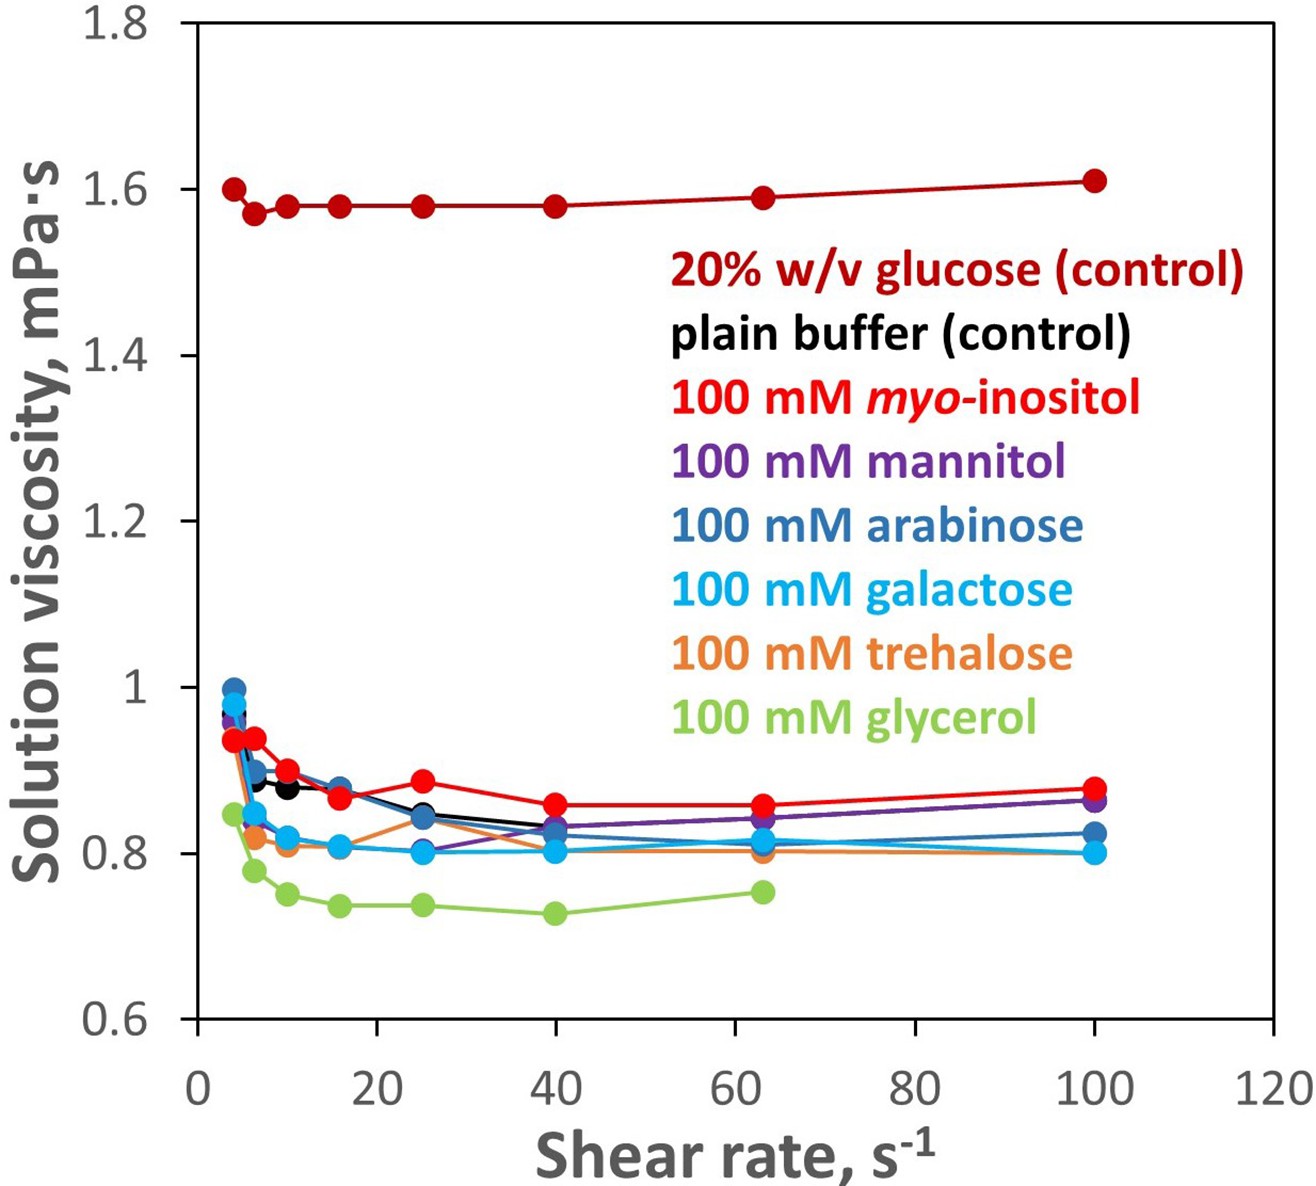
100 mM inositol does not significantly affect bulk solution properties.
Solution rheometry was used to measure viscosity of the aqueous buffer (10 mM PIPES, pH 6.7) with and without 100 mM myo-inositol or select other compounds. No meaningful difference was observed between 100 mM myo-inositol and plain buffer. Changes produced by the other compounds were minor. As a positive control, 20% w/v glucose is shown; this concentration (~1.1 M) is more typical of the range in which stabilizing effects of protective osmolytes are observed.
Figure 1—figure supplement 2
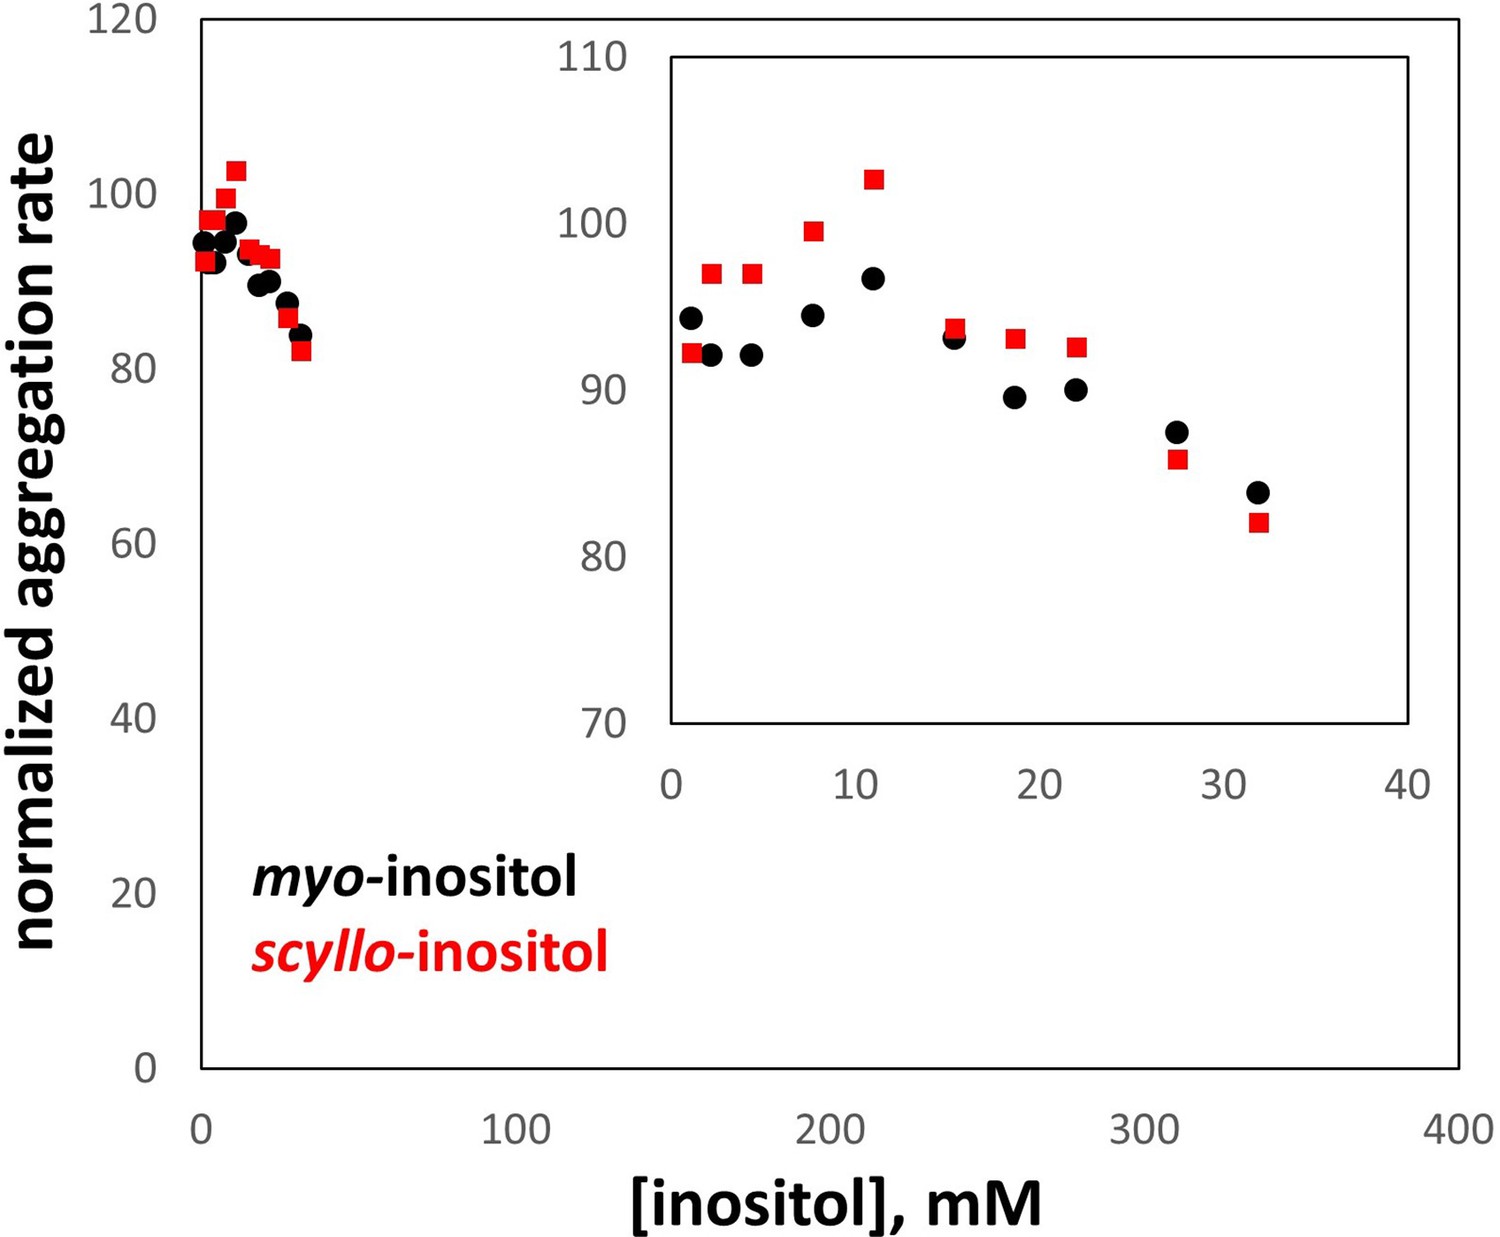
Comparison of myo- and scyllo-inositol.
Both compounds were tested in parallel for their ability to suppress aggregation of the W42Q HγD variant, exactly as in Figure 1A. However, scyllo-inositol’s solubility is an order of magnitude lower than that of the more common myo- isomer, which strictly constrained the testable concentration range. In this range, no significant difference was observed between myo- and scyllo-inositol. The axes are scaled to match Figure 1C and D; the inset shows a zoom-in of the data series. All aggregation rates are expressed as % of the rate without inositol.
Figure 1—figure supplement 3
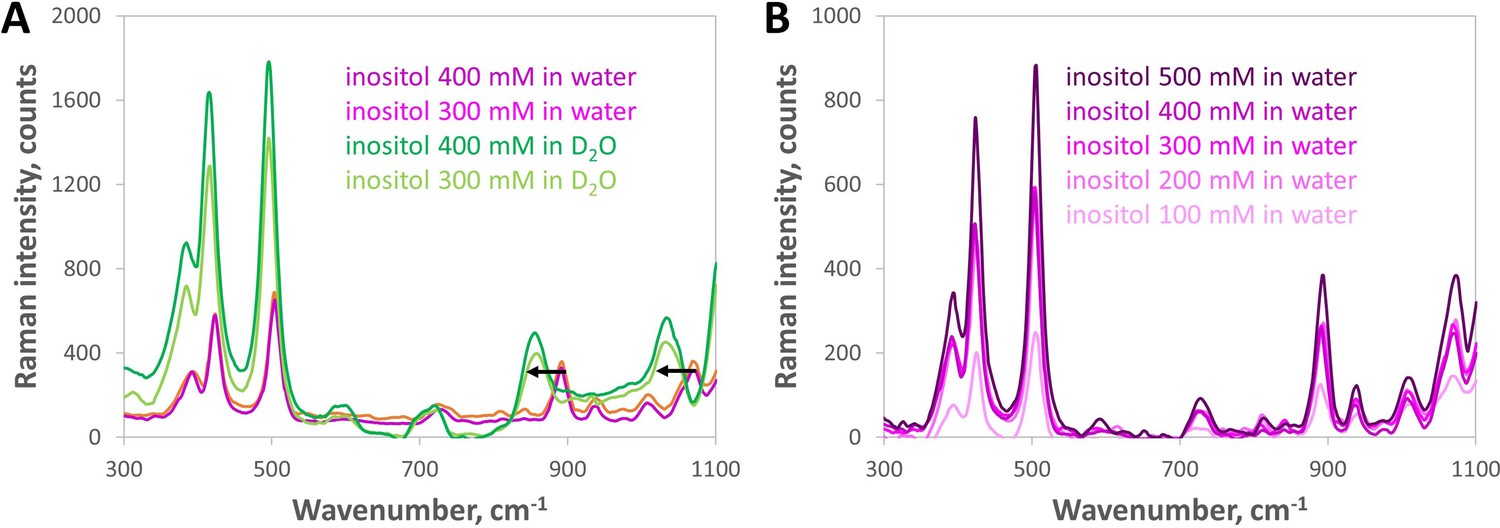
Raman spectroscopy shows no signature of increased inositol self-association between 100 and 500 mM.
(A) Baseline-subtracted low-wavenumber Raman spectra showed peaks at 892 and 1071 cm–1 for inositol in water shifted by –45 and –39 cm–1, respectively, in D2O (black arrows), which suggests they are reporter peaks for inositol-water hydrogen bonding. This range includes C—O and C—C—O vibrational modes of alcohols (see Larkin, P. J. Infrared and raman spectroscopy: principles and spectral interpretation. Elsevier, 2011.) The peaks at 423 and 504 cm–1 gained intensity in D2O but showed a much smaller shift (–8 cm–1); we tentatively assign them to C—C vibrational modes within the inositol molecule. (B) Low-wavenumber Raman spectral readouts (300–1100 cm–1) of inositol in water did not show any new feature emerging as the inositol concentration increased from 100 to 500 mM, only increasing intensity of both solvent-sensitive and solvent-insensitive peaks. This indicates no significant change in physico-chemical properties that would have been expected from direct inositol-inositol hydrogen bonding (or other self-association) across the concentrations tested.
Figure 1—figure supplement 4
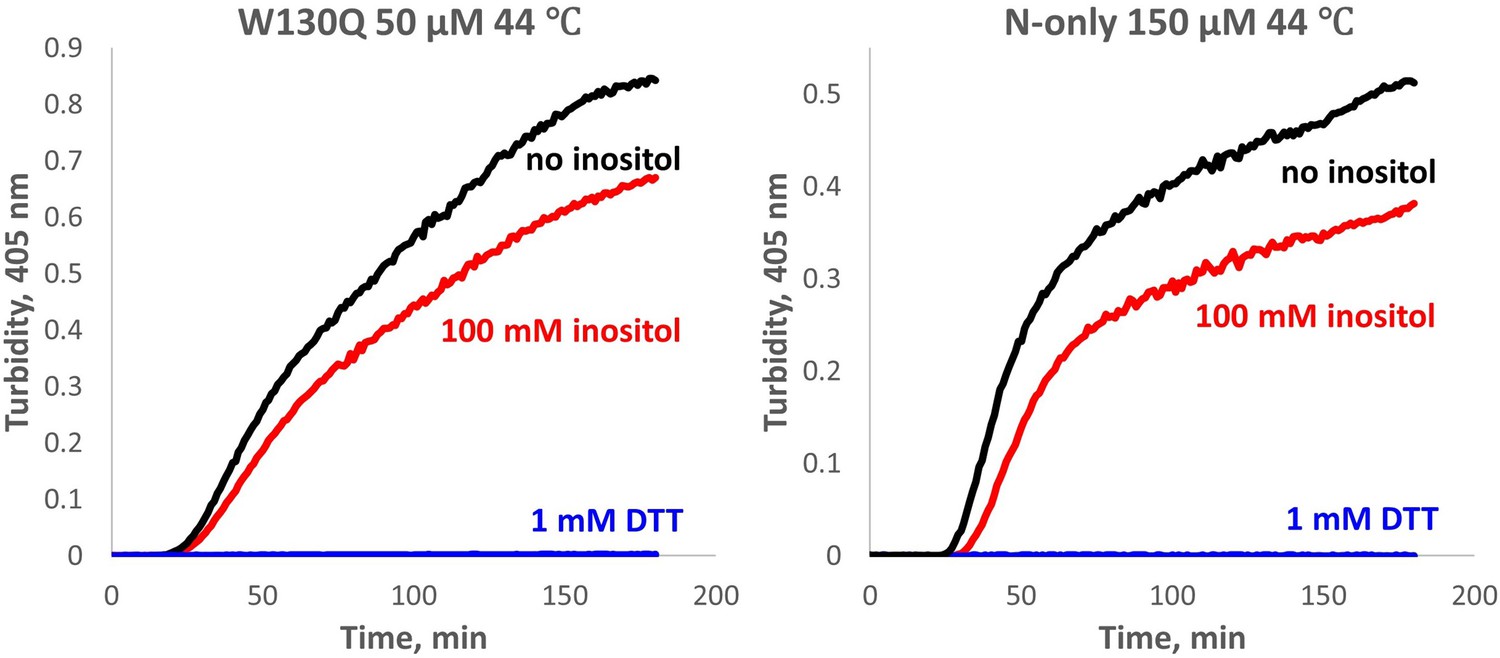
Aggregation of W130Q and isolated WT N-terminal domain is completely redox-dependent.
The proteins were aggregated in 10 mM PIPES pH6.7, 150 mM NaCl buffer with 0.5 mM GSSG and 1 mM EDTA, at the temperature and concentrations shown, with or without 100 mM myo-inositol. In the control reactions, 0.5 mM GSSG was replaced with 1 mM DTT, resulting in no detectable aggregation (blue traces).
Figure 2 with 2 supplements
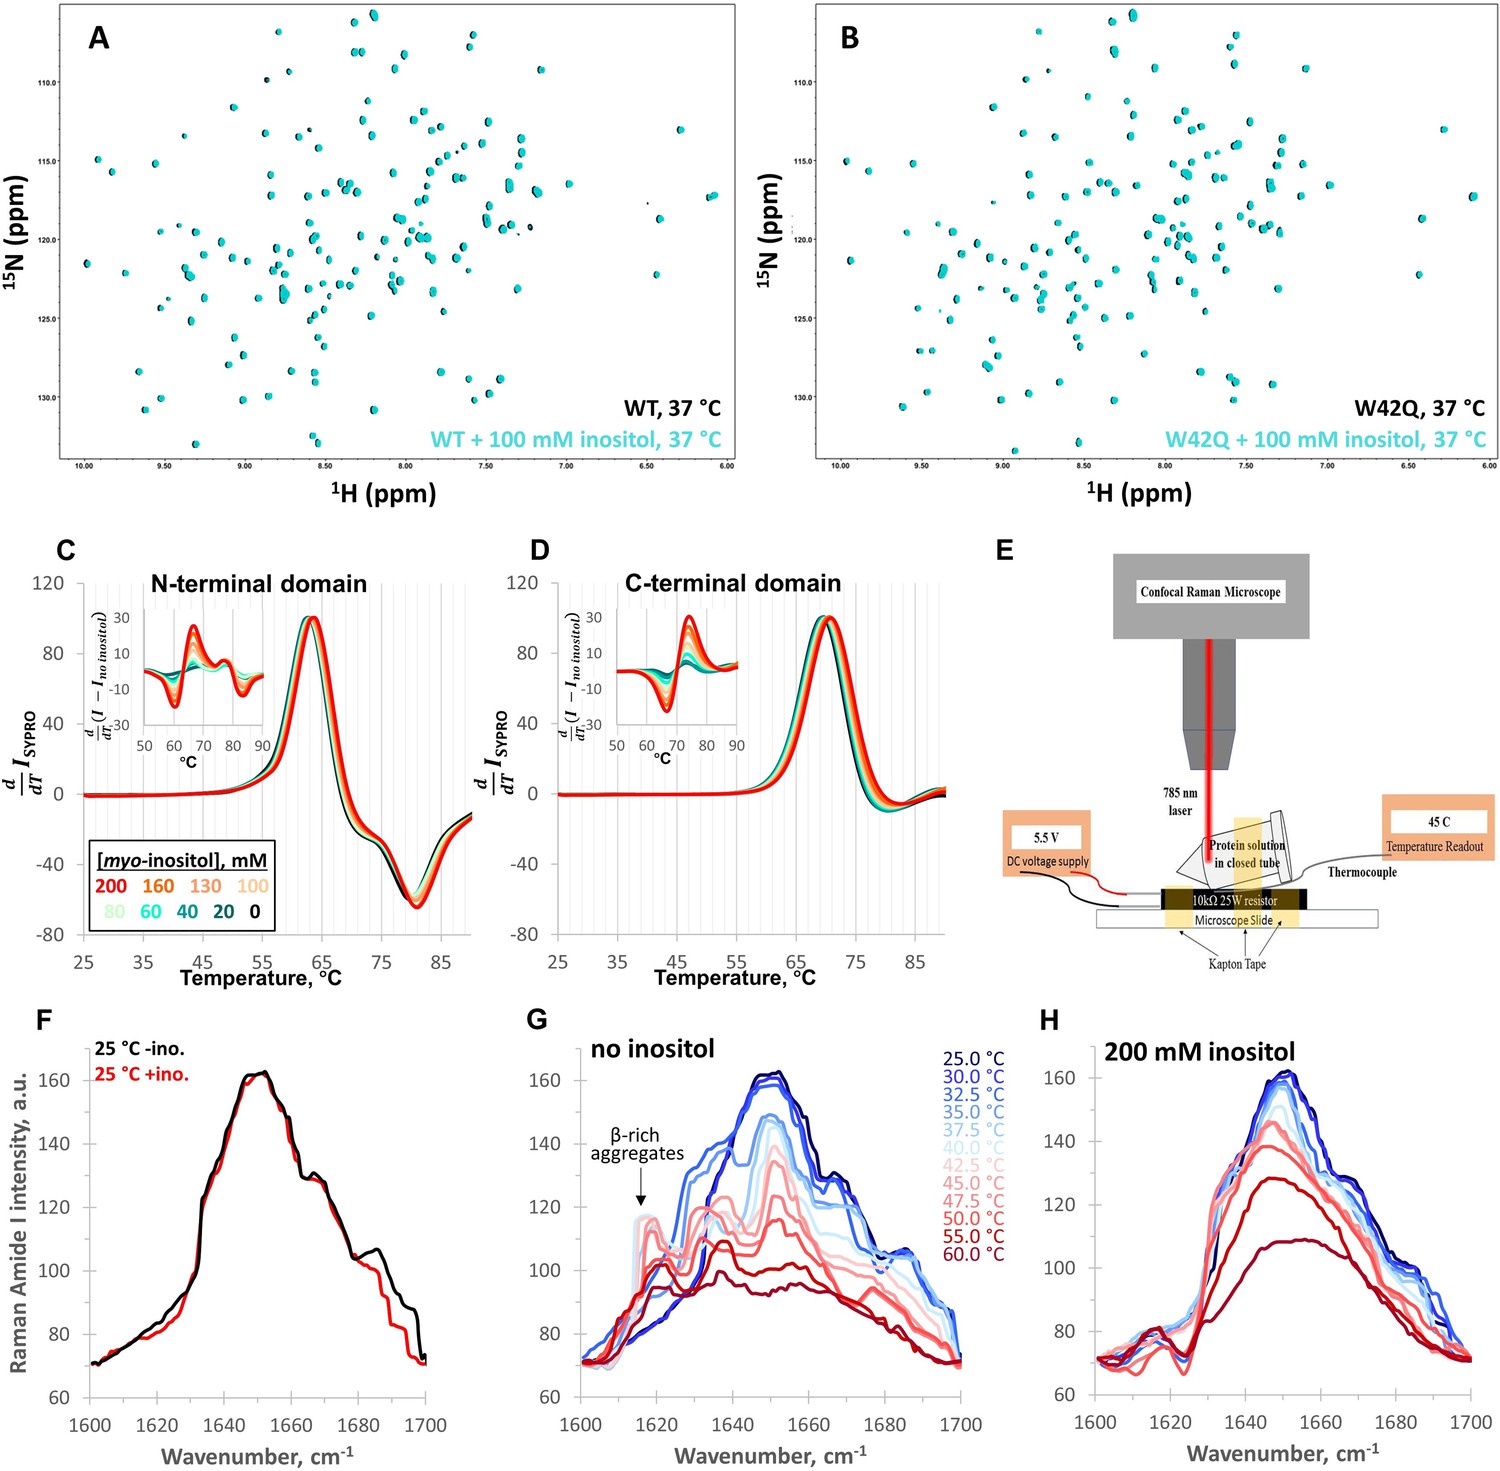
Myo-inositol has no effect on the native structure and only minor effects on stability.
(A, B) 1H-15N HSQC NMR spectra of full-length WT and W42Q HγD at 37 °C showed no evidence of interaction between myo-inositol and the protein’s native structure. (C, D) Differential scanning fluorometry with SYPRO Orange as the hydrophobicity probe revealed no change within the temperature range of aggregation but very small dose-dependent shifts toward higher melting temperatures. Normalized first derivative curves of SYPRO Orange fluorescence intensity are shown for both the N- and C-terminal domains, where peak positions correspond to Tm; insets show the difference curves. (E) Schematic of the design of the thermal scanning Raman spectroscopy apparatus. (F) Raman Amide I band spectra of the isolated N-terminal domain were likewise overlapping at low temperatures. (G, H) At 32.5 °C and 35.0 °C without inositol, a β-sheet peak ~1630 cm–1 became prominent, while a ~1620 cm–1 peak, typical of β-sheet-rich aggregates, was observed above 35.0 °C. Both features were strongly suppressed by 200 mM inositol.
Figure 2—figure supplement 1

Histograms of chemical shift perturbations in WT and W42Q HγD upon addition of 100 mM myo-inositol.
The NMR spectra are shown in Figure 2A and B. The total number of peaks was 152 for WT and 147 for W42Q. We used the Shapiro-Wilk test to determine whether the variability in chemical peak shifts beyond the minor systematic shift of ~0.008 ppm was randomly distributed. The largest chemical shift in either sample was 0.018 ppm (0.010 ppm from the mean). A normal distribution could not be ruled out for the CSPs of W42Q (p=0.13), while WT’s distribution had a marginal deviation from normality (p=0.011). Lack of a specific binding site is the most likely interpretation.
Figure 2—figure supplement 2
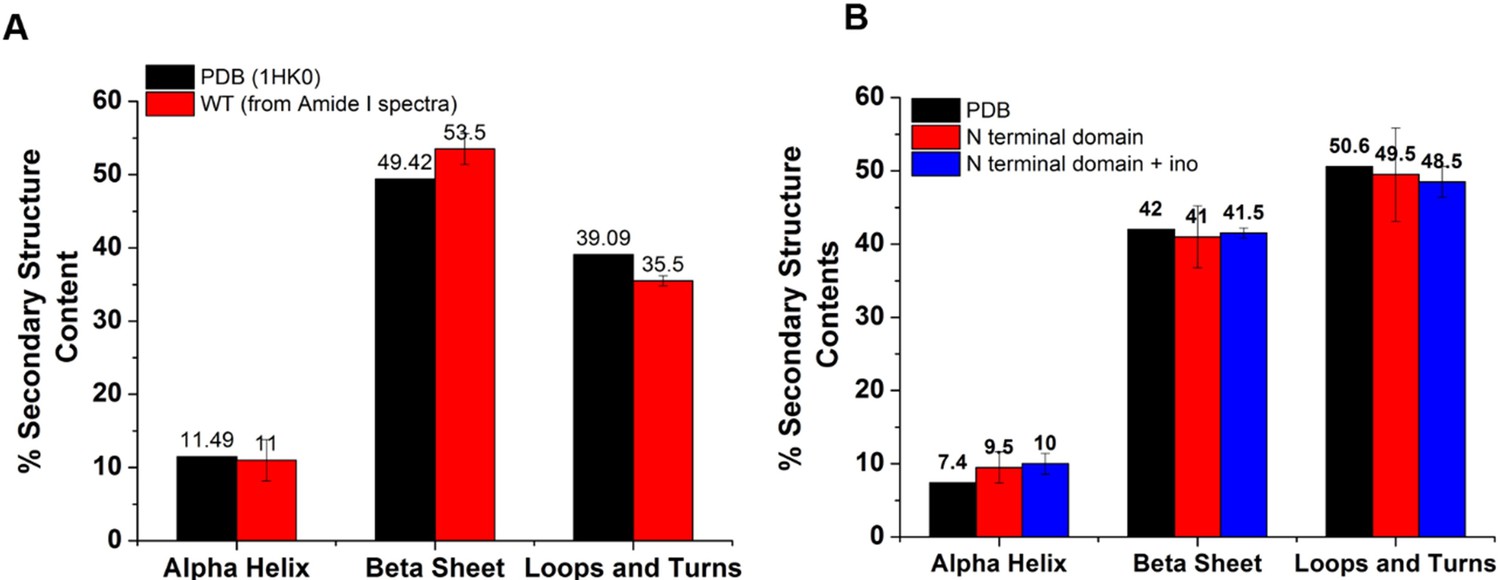
Secondary structure content of the WT and N terminal domain obtained upon deconvolution of the Amide I Raman spectra was comparable to the reported crystal structure (1HK0).
(A) To check the quality of the Raman Spectra (Amide I range, 1600–1700 cm–1), we compared the secondary structure content (i.e. % of α-helix, β-sheet, and loops and turns) of the WT with the reported crystal structure (1HK0). Comparative bar plot shows comparable secondary structure content. (B) Comparative bar plot for the secondary structure contents shows N-terminal domain secondary structure content (at 25 °C) was comparable to the reported structure (1HK0-truncated N-terminal domain). Furthermore, the N-terminal domain with and without inositol had very similar secondary structure content, showing that inositol had no effect on the native secondary structure of the N-terminal domain (temperature = 25 °C).
Figure 3
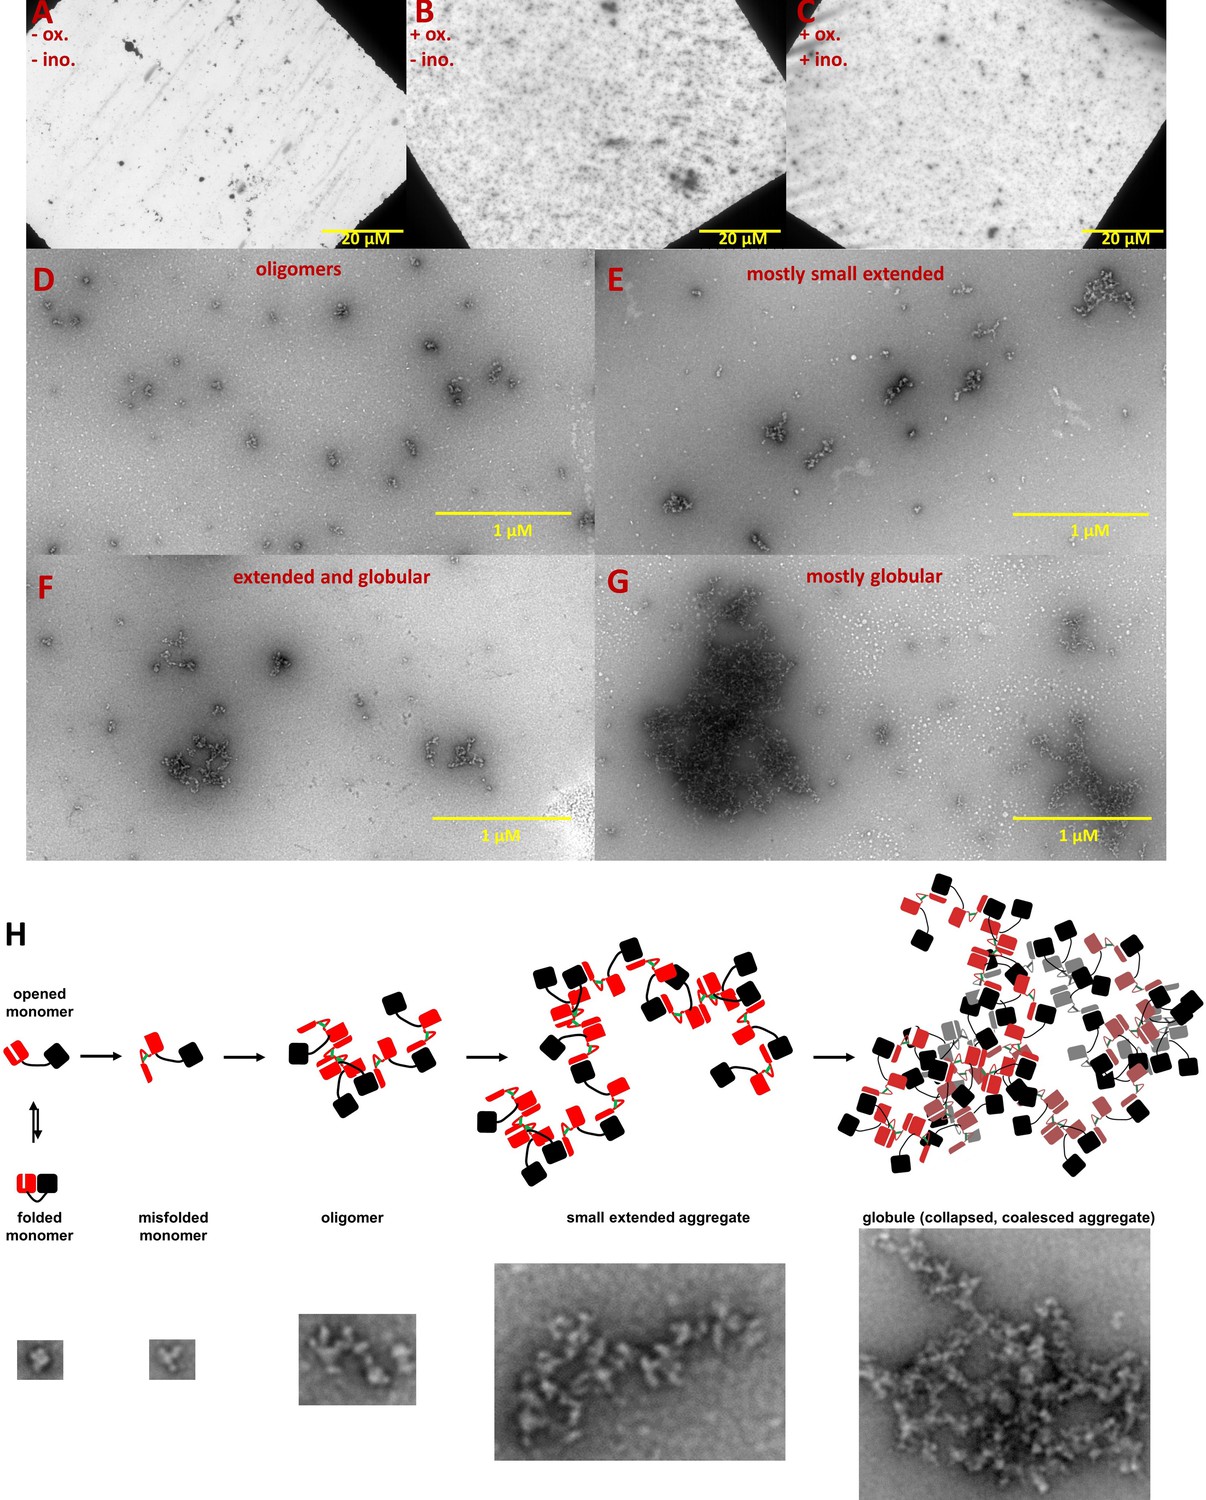
Negative-stain TEM images of HγD W42Q aggregates reveal short extended and large globular structures.
Aggregation of 40 μM protein in pH 6.7 PIPES buffer with 150 mM NaCl and 1 mM EDTA was triggered by addition of oxidant (0.5 mM GSSG) and incubation at 37 °C for 4 hr. End-point samples were deposited on carbon-coated copper grids and stained with uranyl acetate. The top row shows survey images of whole grids for (A) control sample incubated in the absence of GSSG; (B) turbid sample in the presence of GSSG; and (C) turbid sample in the presence of GSSG and 100 mM myo-inositol. Panels D-G show the variety of aggregate morphologies observed in representative magnified images from these grids, with (D) showing mostly small oligomers (not counted as aggregates in Figure 4); (E) showing mostly small extended aggregates; (F) showing extended aggregates in the process of collapsing and coalescing; and (G) showing highly coalesced globular aggregates; (H) Graphical model of HγD aggregation and its suppression by myo-inositol: aggregation begins with oxidative misfolding of a mutant or damaged protein, as we have previously found (Serebryany et al., 2016b), followed by assembly of short extended chains via domain swap-like interactions (Serebryany et al., 2016b; Serebryany et al., 2018), and finally coalescence to globular particles. Examples of TEM evidence of each type of structure in this study are shown in the bottom row (not all to scale).
Figure 4
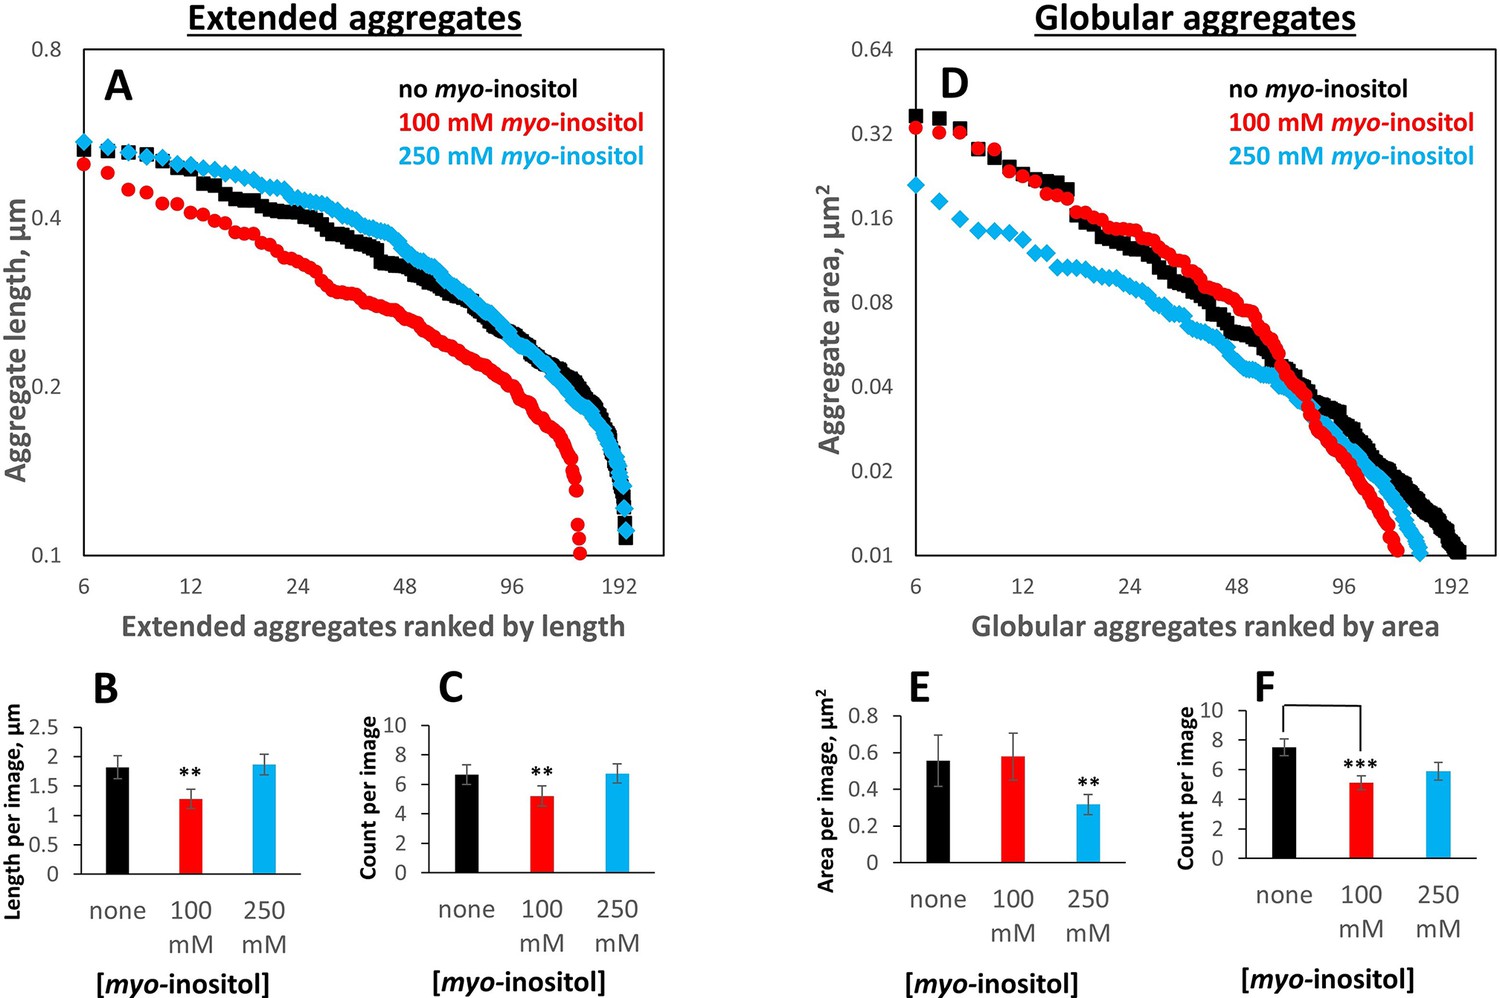
Myo-inositol produces only modest shifts in the aggregate particle size distribution.
Aggregates generated as in Figure 1 in the presence of 0, intermediate (100 mM) or high (250 mM) myo-inositol were imaged and analyzed by negative-stain transmission electron microscopy (Figure 3) in a double-blinded procedure, with a total of 103 separate images used for analysis (30, 29, and 30 for 0, 100, and 250 mM inositol, respectively, plus 14 control images). Aggregates were classified by inspection into extended (irregular fibrils) vs. globular (collapsed/coalesced) based on whether a curve could be unambiguously traced from end to end. (A, B, C) 100 mM myo-inositol decreased both the number and the length of extended aggregates, but 250 mM myo-inositol did not. Error bars represent S.E.M. of particle counts and their combined lengths per image. Two-sample T-test p=0.04 and 0.02 between 0 and 100 mM and 100 and 250 mM, respectively, in (B) and 0.13 and 0.11, respectively, in (C). (D, E, F) 100 mM myo-inositol depleted the smallest globular aggregates, slightly increased the size of intermediate ones, and left the largest ones unchanged, but 250 mM myo-inositol reduced the size of the largest aggregates. Two-sample T-test p=0.12 and 0.07 between 0 and 250 mM and 100 and 250 mM, respectively, in (E), and p=0.003 between 0 and 100 mM in (F).
-
Figure 4—source data 1
Raw numerical data for aggregate particle size distributions.
- https://cdn.elifesciences.org/articles/76923/elife-76923-fig4-data1-v2.xlsx
Figure 5
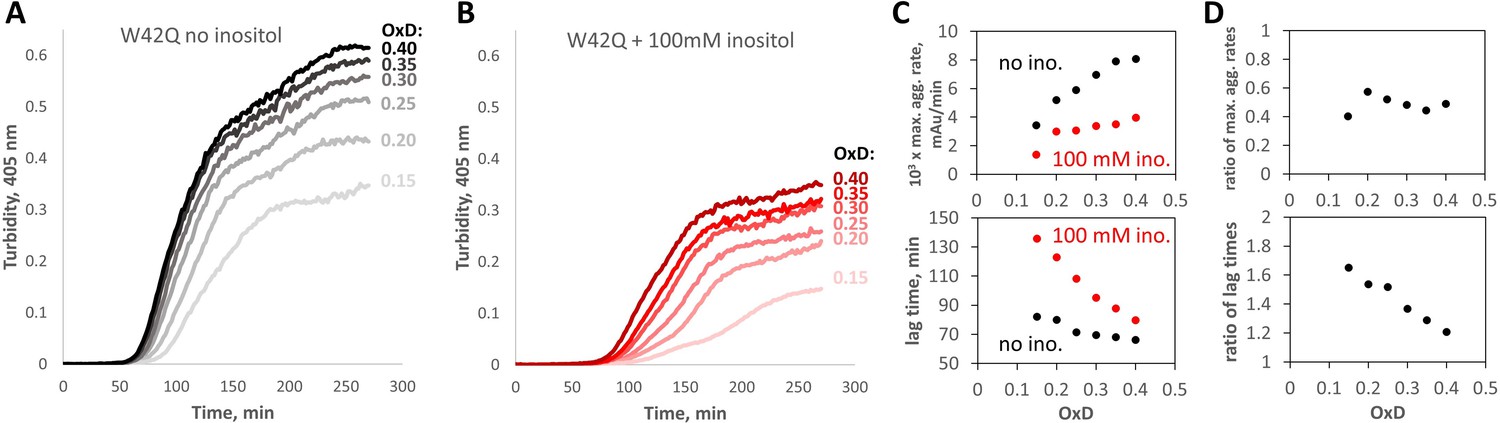
Myo-inositol suppresses aggregation more strongly in redox buffers.
(A, B) Turbidity traces of 50 μM W42Q in buffers with set redox potentials using the glutathione redox couple, where OxD = 2[GSSG]/([GSH]+2[GSSG]), and ([GSH]+2[GSSG])=2 mM in all cases. The OxD range shown is consistent with what is observed during cataract development (Hains and Truscott, 2007). Notably, in the least-oxidizing buffers with myo-inositol, the turbidity curves became biphasic. (C) Quantification of the maximum aggregation rates and lag times for the curves in (A) and (B) showed stronger aggregation suppression by 100 mM myo-inositol than in Figure 1A and B. (D) Ratios of maximum aggregation rates (+inositol/-inositol) (top) and aggregation lag times (bottom), for the data shown in panel (C). Averaged across the six OxD buffers, mean ± S.E.M. for inositol’s inhibitory effect on the aggregation rate was 51±2% vs 35 ± 3% observed in the fully oxidizing buffer.
Figure 6 with 2 supplements
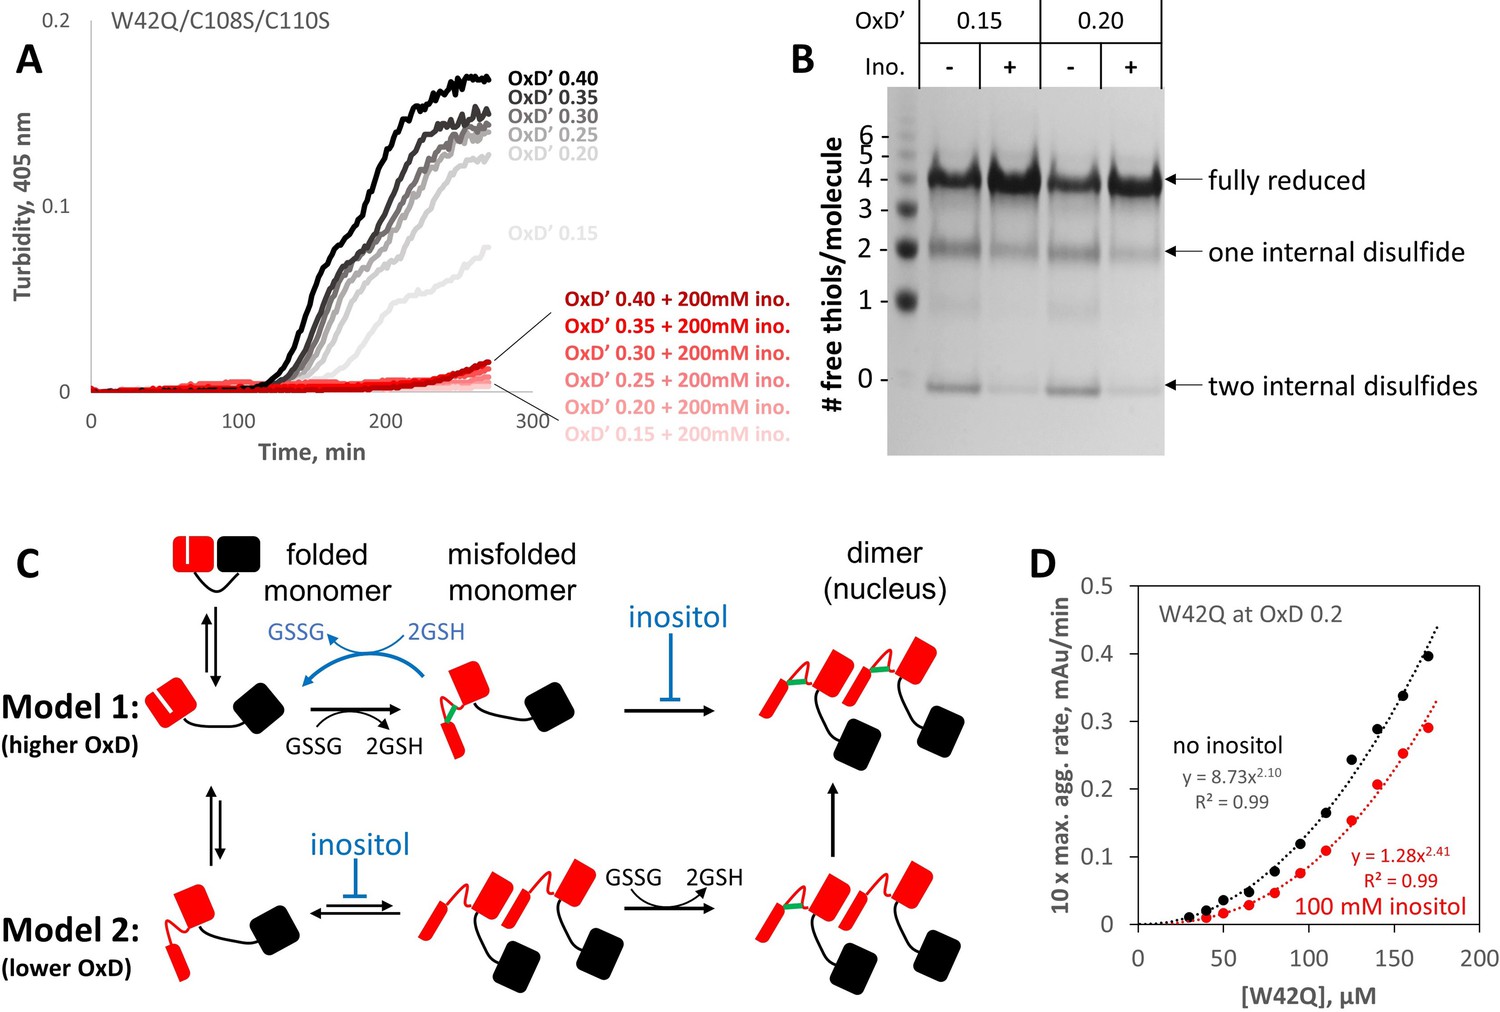
Myo-inositol targets the rate-limiting bimolecular interaction and indirectly favors reduction of disulfide-locked misfolded aggregation precursors.
(A) Aggregation of the W42Q/C108S/C110S triple-mutant (lacking the redox-active site in the C-terminal domain) was almost completely suppressed by 200 mM myo-inositol. Here ([GSH]+2[GSSG]) was only 0.5 mM to facilitate subsequent reaction of the protein with PEG-maleimide; as such, the redox buffers are designated OxD’ to distinguish them from those in Figure 5. (B) PEGylation gel-shift assays of the end-points of aggregation reactions in panel A reveal the redox state distributions of the protein, where four free thiols per molecule indicate it is fully reduced; two free thiols indicate one internal disulfide; and 0 free thiols, two internal disulfides. Markers were generated by limited PEGylation of the WT protein, which contains six thiols. The differential effect of inositol was maximal at OxD’ 0.15 and 0.2; results for higher and lower OxD’ values are shown in the figure supplement. (C) Two alternative graphical models explaining how myo-inositol, despite being redox-inert, can alter the redox state distribution indirectly in redox-buffered solutions. Models 1 and 2 are not mutually exclusive and differ from each other by the order of misfolding and oxidation: high and low OxD is expected to favor Model 1 and Model 2, respectively. When disulfide bonding is reversible, inositol may favor reduction and refolding by suppressing the transition from misfolded monomer to transient dimer. (D) Concentration dependence of W42Q aggregation at OxD 0.2 with and without 100 mM myo-inositol. The rightward shift in the curve with inositol (smaller pre-exponential factor) suggests that inositol makes it less likely that a bimolecular interaction will be productive for aggregation, while the larger exponent in the power law further indicates that in the presence of inositol assembly beyond the dimer makes a greater relative contribution to aggregation. Raw data and fitting are available as Figure 6—source data 1.
-
Figure 6—source data 1
Raw numerical data and fittings for solution turbidity experiments in Figure 6D.
- https://cdn.elifesciences.org/articles/76923/elife-76923-fig6-data1-v2.xlsx
Figure 6—figure supplement 1
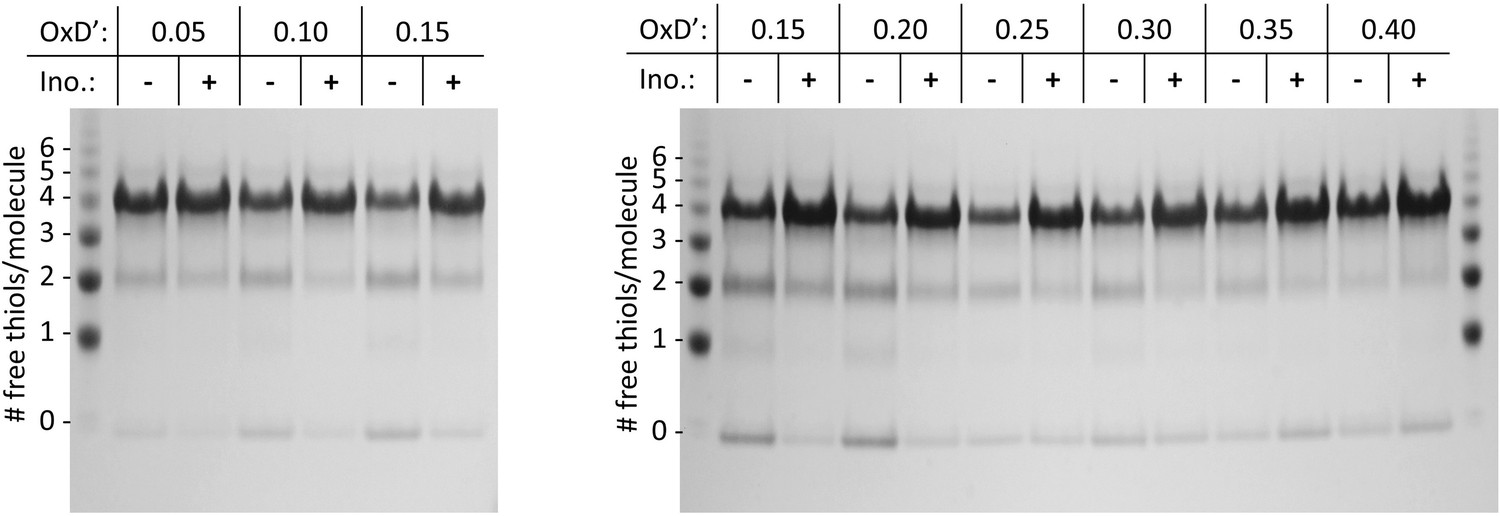
PEGylation gel shift assays reveal shifts in the redox distribution of the W42Q/C108S/C110S protein induced by 200 mM myo-inositol.
SDS-PAGE gels from two separate experiments are shown, at the OxD’ values indicated. The differences are greatest in the intermediate OxD’ range (0.10–0.30). The left marker lane and first four sample lanes are what is shown in Figure 6B. At OxD’ 0.05, too little aggregation took place for the differences to become clear. Beyond OxD’ 0.3, the singly and doubly disulfide-bonded precursors were lost from the inositol-free samples, and the two distributions showed hints of a reversal. The likely explanation is that at high OxD’ without inositol, precursors have already aggregated and precipitated by the end-point of the assay at the higher OxD’ values, while in the presence of inositol a fraction of doubly-disulfide bonded aggregates is still soluble, along with the fraction that remains fully reduced. It is also worth noting that precipitation of the aggregated protein leads to removal of disulfide bonds from the solution, so the true final OxD’ value is lower in the absence of inositol when protein aggregation is sufficiently extensive to lower soluble [GSSG]. Full unedited gels are available in the Figure 6—figure supplement 1—source data 1 folder.
-
Figure 6—figure supplement 1—source data 1
Full unedited images of gels in Figure 6—figure supplement 1.
- https://cdn.elifesciences.org/articles/76923/elife-76923-fig6-figsupp1-data1-v2.zip
Figure 6—figure supplement 2
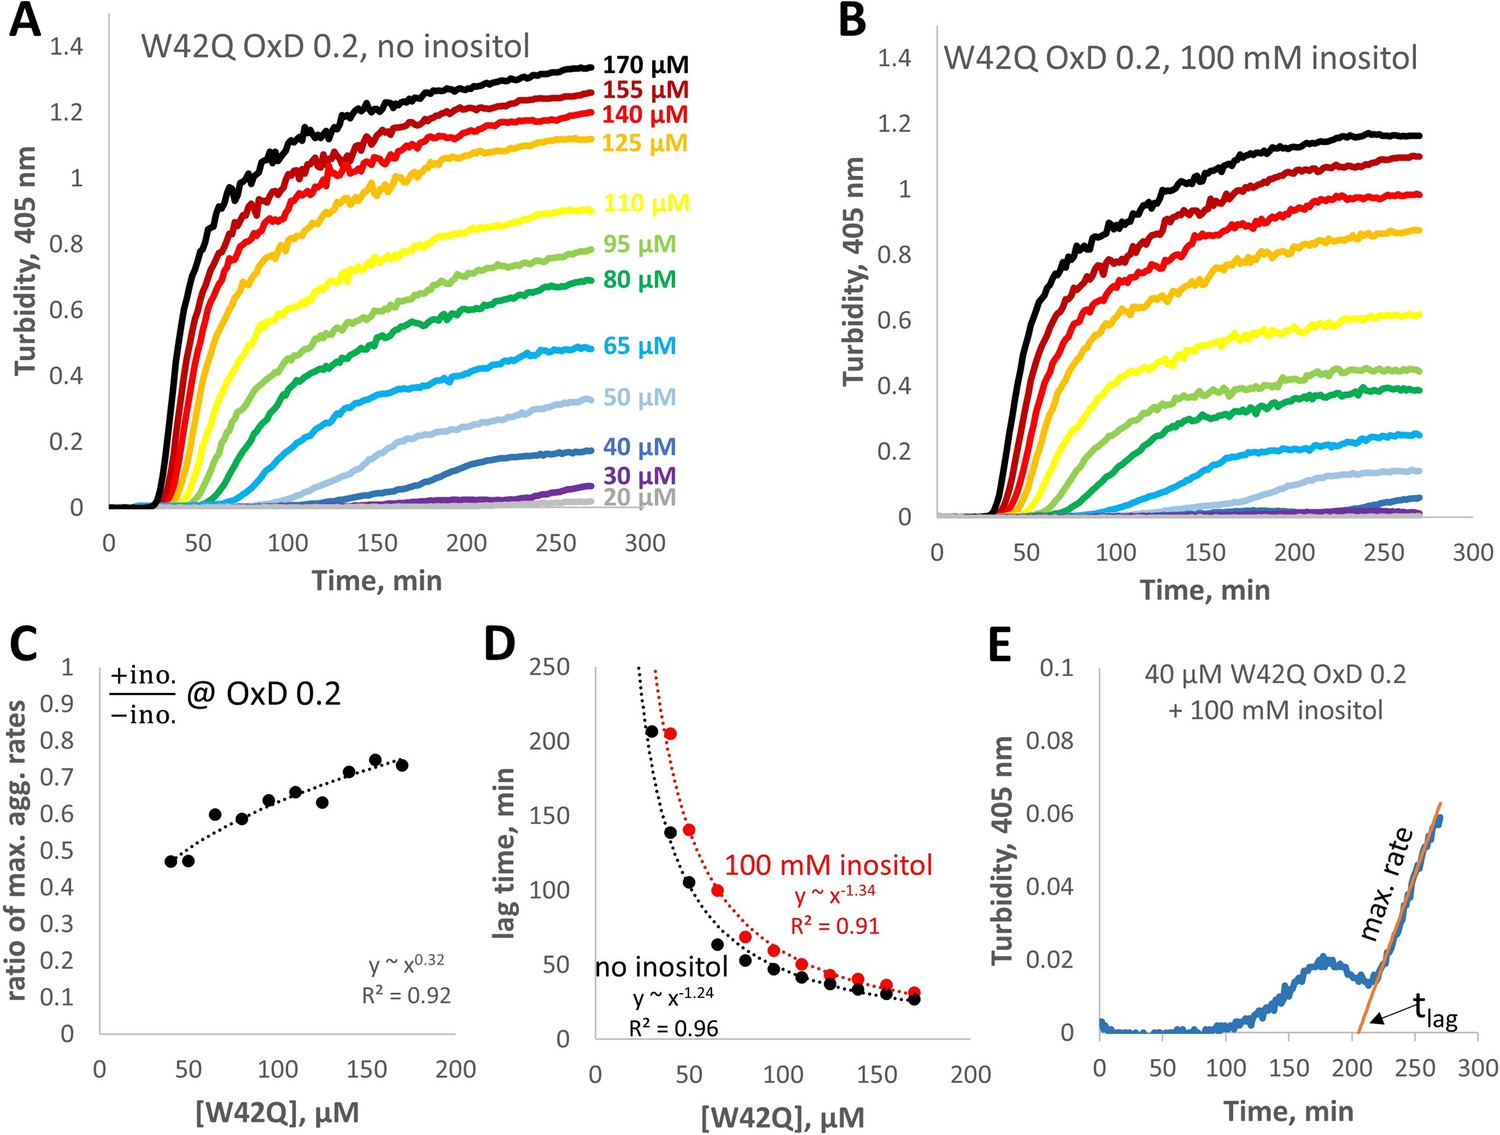
Concentration-dependence of W42Q aggregation curves with and without myo-inositol.
(A,B) The full solution turbidity traces, from which maximum rates were extracted for Figure 6D. (C) Ratios of the maximum aggregation rate show dependence on concentration; in other words, inositol was most effective at suppressing aggregation at lower [W42Q], as should be expected from a suppressor of aggregate formation rather than coalescence. (D) Lag times for the curves in panels A and B. (E) An illustration of the empirical fitting procedure for extracting the maximum rates and lag times from the solution turbidity curves, on the example of the second-lowest curve in panel B. Note that when the aggregation curves were biphasic the fits were applied only to phase 2, when turbidity rose the most rapidly. This fitting procedure was also the main reason for the large increase in apparent lag times in Figure 5C.
Figure 7 with 1 supplement
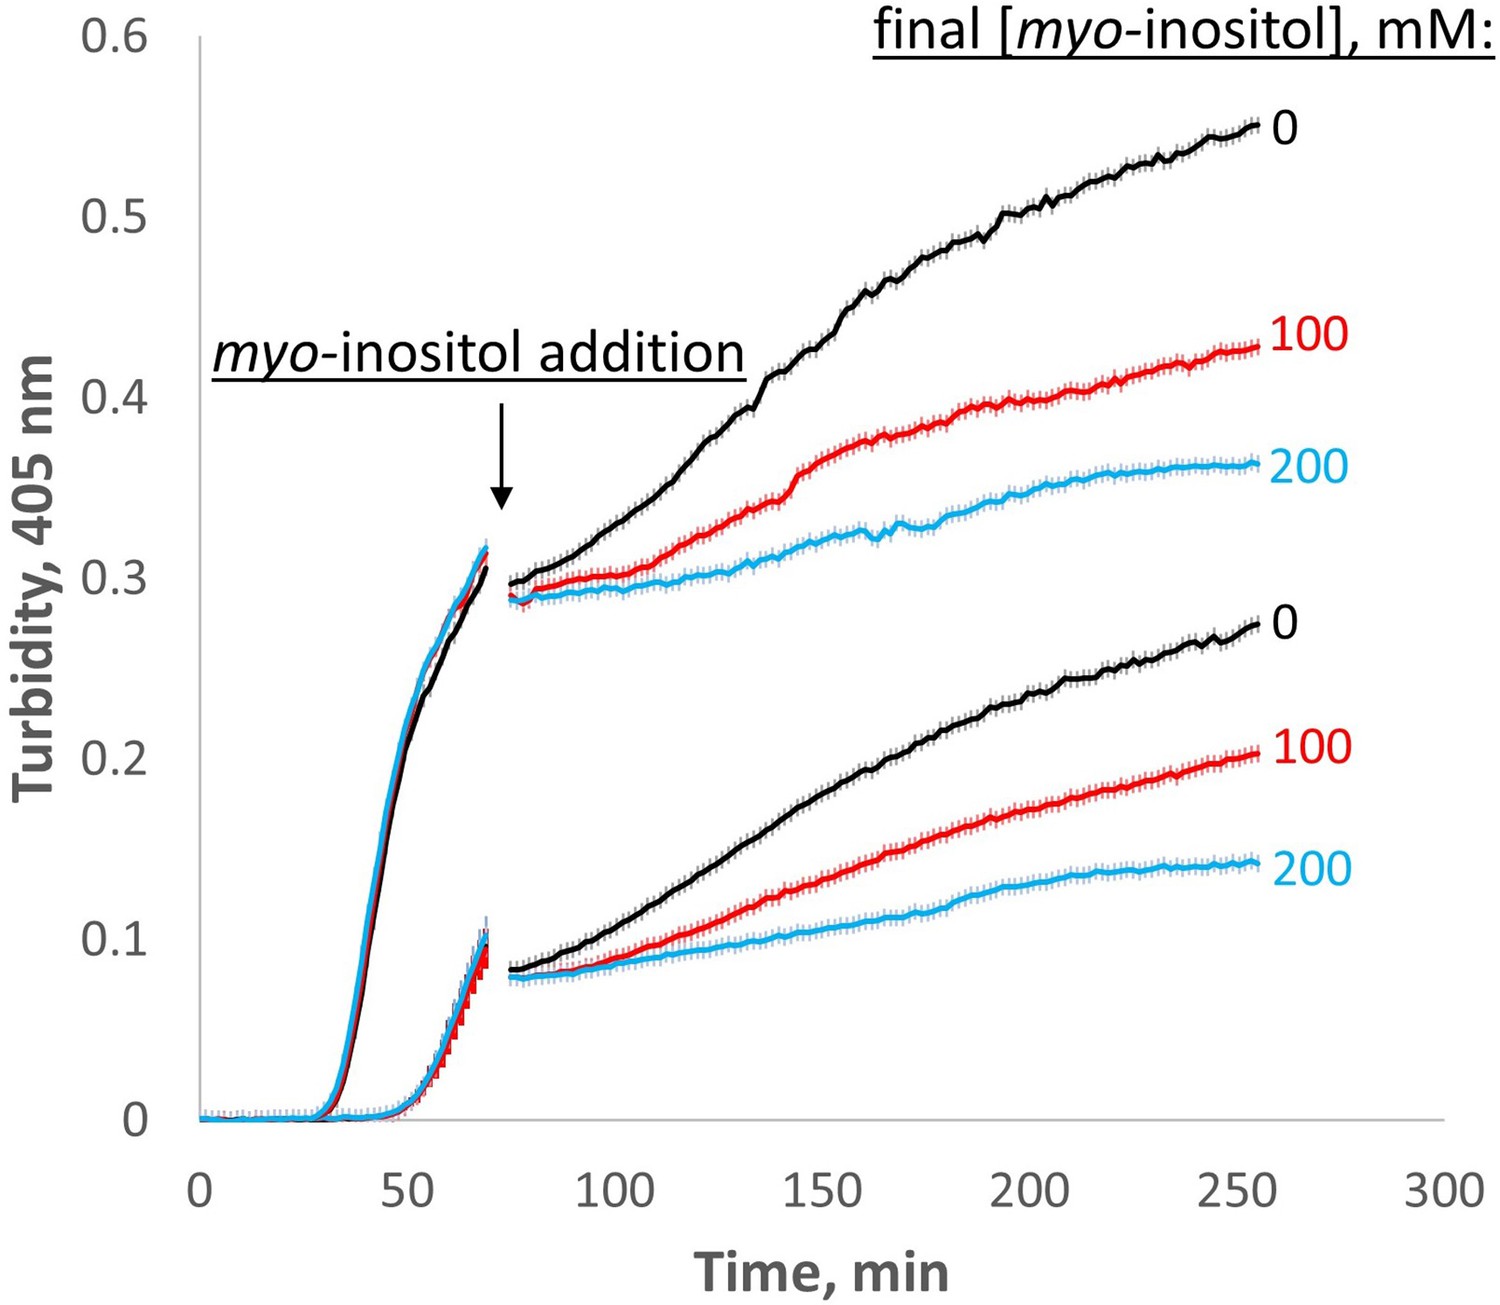
Myo-inositol inhibits aggregation even at later stages.
When added late in the aggregation process, myo-inositol slowed down the rate of subsequent aggregation in a dose-dependent manner. Triplicate W42Q samples were allowed to aggregate initially in 60 μl volume, then 40 μl of myo-inositol solutions or blank buffer was added and the incubation resumed. Light scattering did not change greatly on dilution due to the vertical optics of the plate reader. The discontinuity in the curves shows the dead time of myo-inositol addition and mixing. The curves shown are averages of four technical replicates at each of two different [W42Q] (upper curve, 75 μM; lower curve, 50 μM) in OxD 0.2 buffer, with error bars showing S.E.M. for each turbidity reading (every 90 s).
Figure 7—figure supplement 1
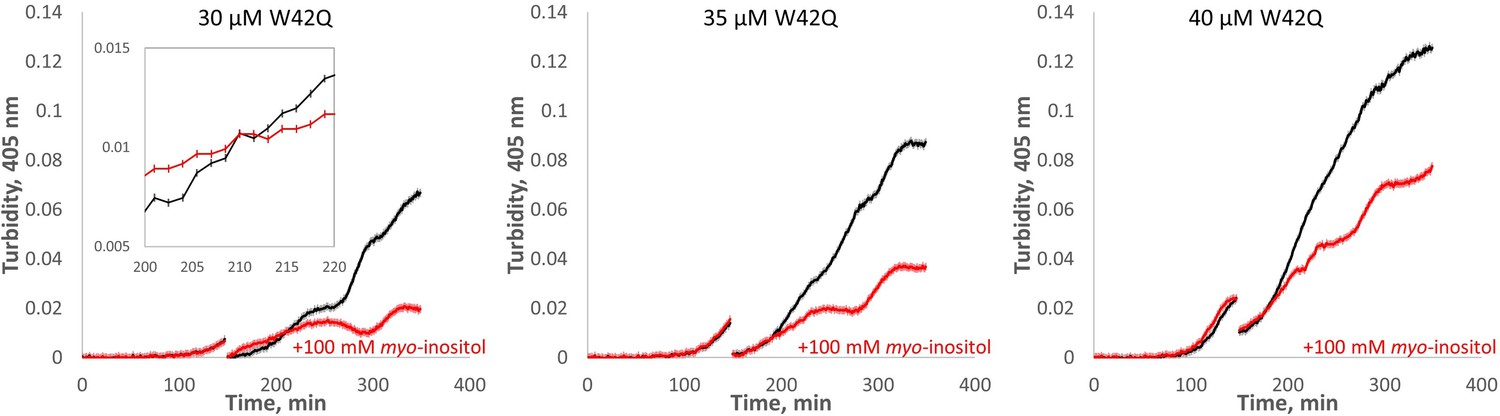
Myo-inositol extends the first (slow) phase of aggregation when added early in the aggregation process.
HγD W42Q samples at the indicated concentrations were allowed to begin aggregating in 75 μl volume, followed by addition of 25 μl buffer or inositol to the final concentration of 100 mM along with sufficient W42Q to maintain total [W42Q] at the indicated value. The discontinuities in the curves are the times of inositol addition and mixing. Four technical replicates were carried out in parallel for each set of curves, and the curves shown consist of averages ± S.E.M. of the replicates. Inset is a zoom-in of part of the plot for 30 μM W42Q showing the error bars for turbidity readings.
Additional files
Download links
A two-part list of links to download the article, or parts of the article, in various formats.
Downloads (link to download the article as PDF)
Open citations (links to open the citations from this article in various online reference manager services)
Cite this article (links to download the citations from this article in formats compatible with various reference manager tools)
A native chemical chaperone in the human eye lens
eLife 11:e76923.
https://doi.org/10.7554/eLife.76923


