The RNA helicase DDX39B activates FOXP3 RNA splicing to control T regulatory cell fate
- Department of Biochemistry and Molecular Biology, University of Texas Medical Branch, United States
- National Research Center for the Control and Prevention of Infectious Disease, Nagasaki University, Japan
- Autoimmunity Biological Solutions, United States
- Human Pathophysiology and Translational Medicine Program, Institute for Translational Sciences, University of Texas Medical Branch, United States
- Department of Molecular Genetics and Microbiology, Duke University, United States
- Duke Molecular Physiology Institute, Duke University, United States
- Department of Preventive Medicine and Population Health, University of Texas Medical Branch, United States
- Department of Population and Quantitative Health Sciences, School of Medicine, Case Western Reserve University, United States
- Department of Neurology, Duke University School of Medicine, United States
- Division of Infectious Diseases, Department of Medicine, Duke University, United States
- Transplant Division, Department of Surgery, University of Texas Medical Branch, United States
- Institute of Human Infections and Immunity, University of Texas Medical Branch, United States
- Department of Internal Medicine, University of Texas Medical Branch, United States
- Department of Microbiology, Immunology and Cancer Biology, University of Virginia, United States
Figures
Figure 1 with 5 supplements
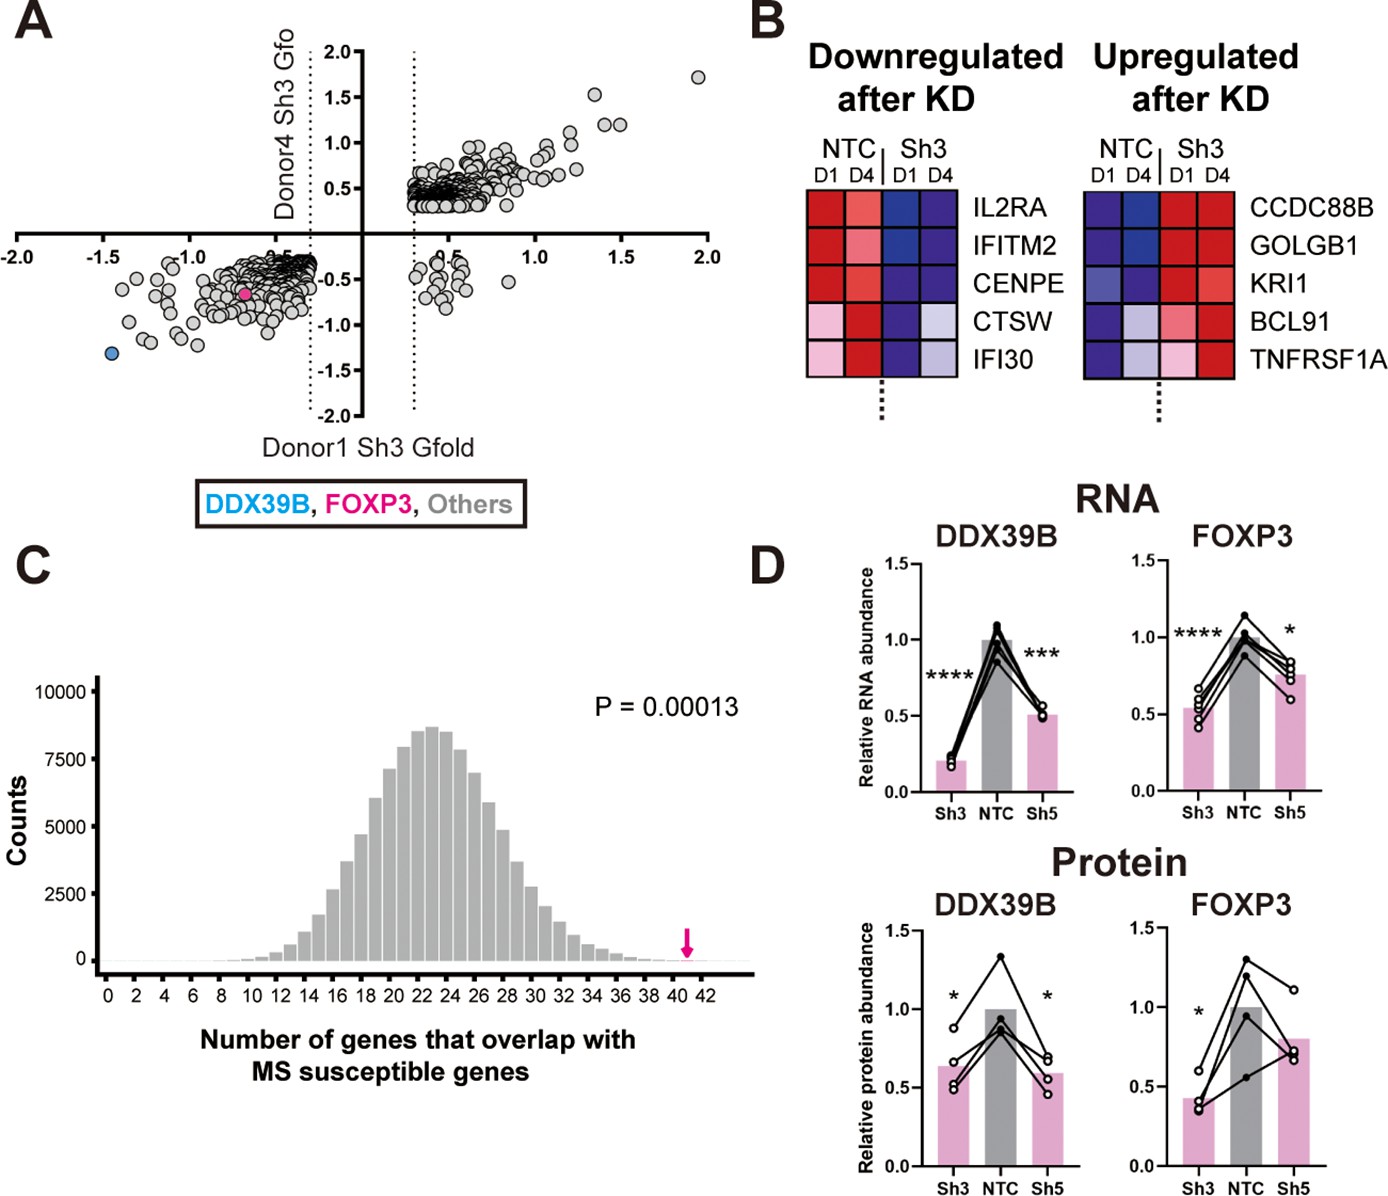
Loss of FOXP3 expression in DDX39B-depleted T cells.
(A) RNA abundance changes between control (NTC) and DDX39B-depleted (Sh3) CD4+ T cells from two healthy individuals (Donor 1 and Donor 4) identified by RNAseq. Data points for DDX39B (cyan) and FOXP3 (magenta) are indicated. (B) Examples of MS susceptibility genes differentially expressed upon DDX39B knockdown. The heat map shows expression of five genes between control (NTC) and DDX39B depleted (Sh3) CD4+ T cells. (C) Enrichment analysis of MS susceptibility genes in DEGs following DDX39B depletion. Resampling 100,000 times resulted in a distribution of the number of genes that overlap by chance, with 23 being the most common result. The observed overlap of 41 (Magenta arrow) demonstrates substantial enrichment (empirical p=0.00013). (D) Levels of DDX39B RNA and FOXP3 RNA, normalized to EEF1A1 RNA levels, after DDX39B depletion in CD4+ T cells and levels of DDX39B and FOXP3 protein relative to Tubulin after DDX39B depletion in CD4+ T cells. Connected dots indicate samples from the same donor. In all figures the error bars indicate standard deviation. *: p<0.05, **: p<0.01, ***: p<0.001 and ****: p<0.0001.
Figure 1—figure supplement 1

Transcript level changes upon DDX39B depletion in primary human CD4+ T cells.
DDX39B was depleted in primary CD4+ T cells from two healthy donors (donors 1 and 4) using DDX39B targeting (Sh3 and Sh5) shRNAs. RNAseq was used to examine transcript level changes between these cells and those treated with control (NTC) shRNA. The figure illustrates the comparison of the transcripts whose expression changed significantly (up or down) for each donor and shRNA combination. Criteria for inclusion were (a) transcripts were required to have RPKM ≥2 and (b) transcript level changes between conditions had |Gfold values|≥0.3 for Sh3 or ≥0.1 for Sh5.
Figure 1—figure supplement 2

Schematic diagram of the enrichment analysis of MS-susceptibility genes among genes whose expression is altered by DDX39B knockdown.
List of odds ratio (OR) of Risk-SNP and Susceptibility genes were obtained from Patsopoulos et al., 2019. Detail of the classification is described in the Methods section. The list of the MS_Pathogenic and MS_Protective genes is shown in Supplementary file 3.
Figure 1—figure supplement 3
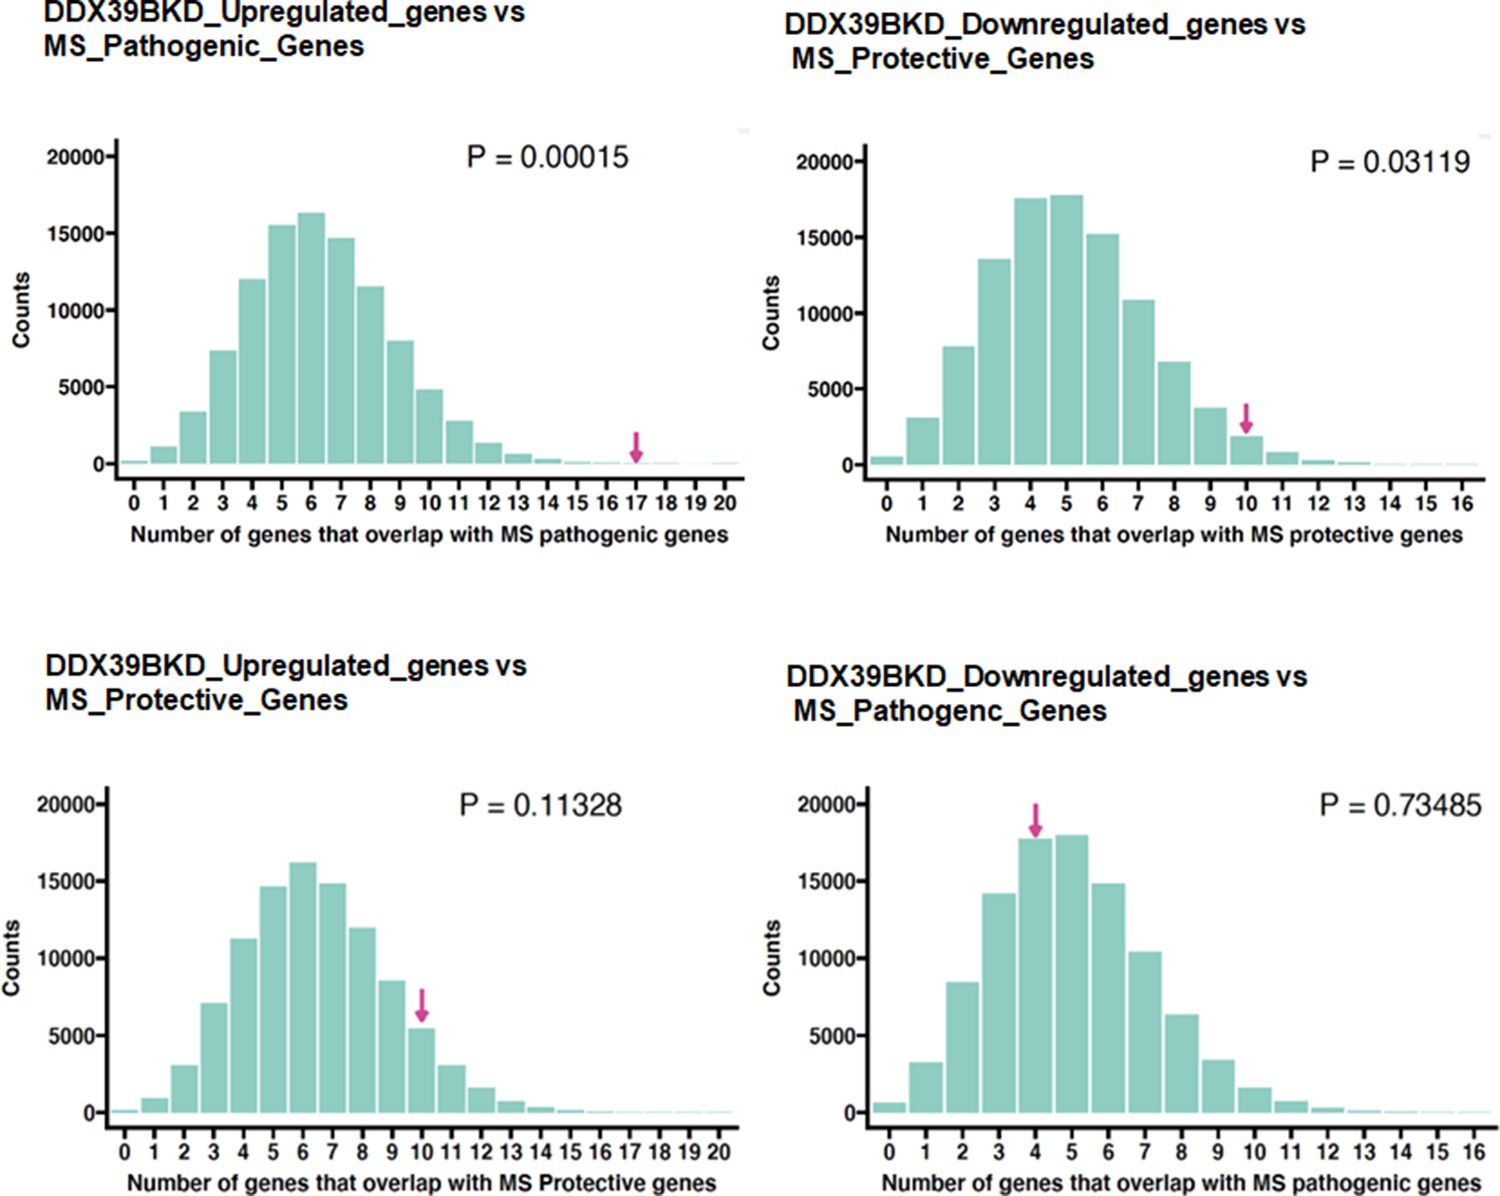
Enrichment analysis of the MS_Pathogenic or MS_Protective genes.
Resampling 100,000 times resulted in a distribution of the number of genes that overlap by chance with experimental overlap indicated by magenta arrow. p Value was calculated based on the fraction of instances. Details of the analysis are described in the Materials and methods section.
Figure 1—figure supplement 4
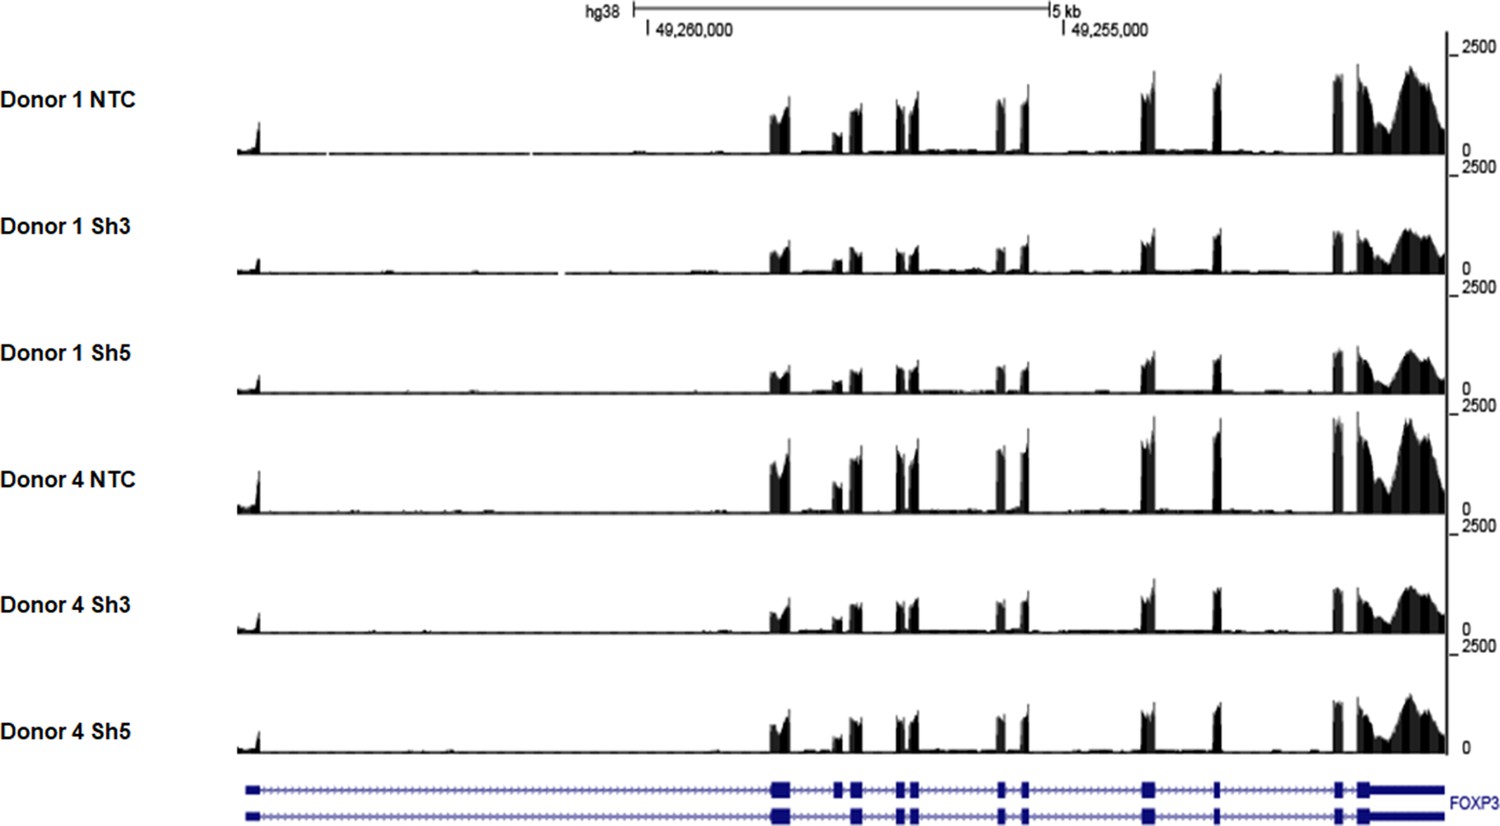
Coverage tracks of reads mapping to the FOXP3 gene in control and DDX39B-depleted CD4+ T cells.
The figure shows coverage of RNAseq reads mapping to the FOXP3 gene in control (NTC) or DDX39B-depleted (Sh3 or Sh5) CD4+ T cells from two healthy donors (Donors 1 and 4).
Figure 1—figure supplement 5

Western blot analysis of FOXP3 expression upon DDX39B depletion in CD4+ T cells.
FOXP3 protein abundance was analyzed by western blot in CD4+ T cells from four donors transduced with either control (NTC) or DDX39B targeting (Sh3 or Sh5) shRNAs. The data were normalized to a-tubulin. Densitometry quantification of these data is shown in Figure 1D.
-
Figure 1—figure supplement 5—source data 1
Two va files have been uploaded for all gels/blots shown in this figure: (1) the original files of the full raw unedited gels or blots and; (2) figures with the uncropped gels or blots with the relevant bands clearly labeled.
- https://cdn.elifesciences.org/articles/76927/elife-76927-fig1-figsupp5-data1-v1.zip
Figure 2
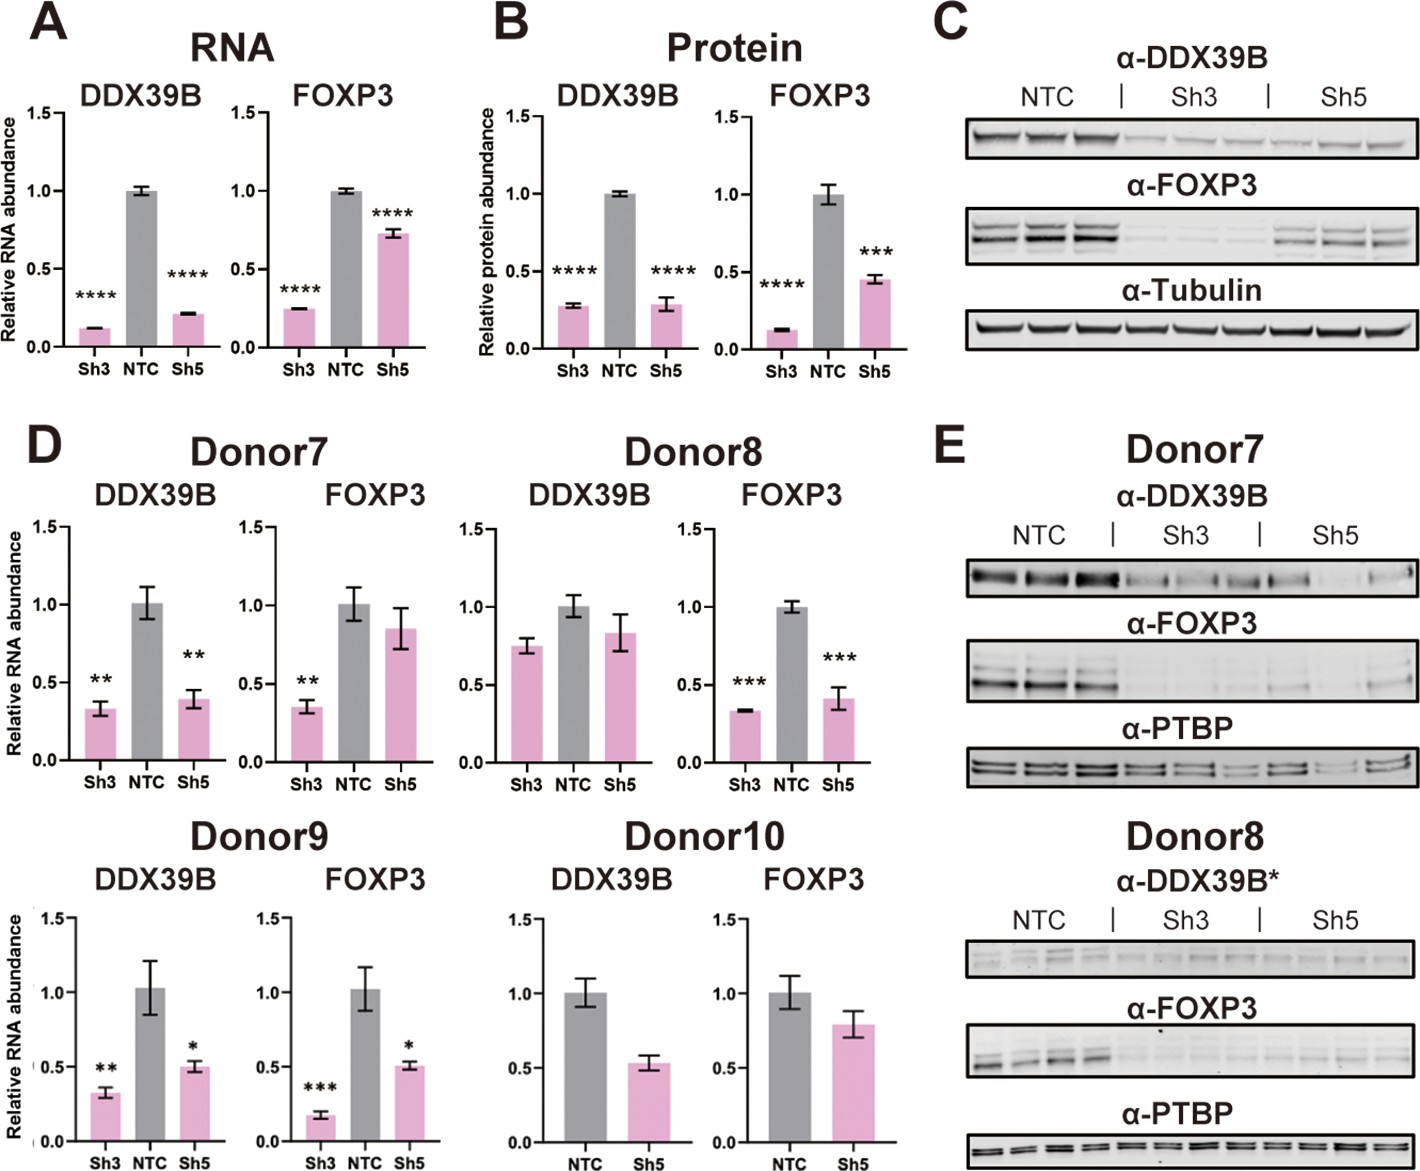
Effect of DDX39B depletion on FOXP3 RNA and protein expression.
(A) Quantification of DDX39B and FOXP3 RNA between control (NTC) and DDX39B-depleted (Sh3 and Sh5) MT-2 cells. DDX39B and FOXP3 RNA abundance was measured by RT-qPCR and normalized to EEF1A1 RNA expression. (B) Quantification of DDX39B and FOXP3 protein expression between control (NTC) and DDX39B-depleted (Sh3 and Sh5) MT-2 cells from western blot in (C). DDX39B and FOXP3 protein abundance was normalized to alpha-tubulin. (D) DDX39B and FOXP3 expression upon DDX39B depletion in primary or induced Tregs. DDX39B was depleted in primary Tregs (Donors 7 and 8) and induced Tregs (Donors 9 and 10) via lentivirus transduction with either non-targeting control (NTC) or DDX39B targeting (Sh3 and/or Sh5) shRNAs. DDX39B and FOXP3 RNA abundance was measured by RT-qPCR and normalized to EEF1A1 RNA expression. (E) Western blot of DDX39B and FOXP3 expression between control (NTC) and DDX39B-depleted (Sh3 and Sh5) primary Tregs. PTBP was used as a loading control. Error bars indicate SEM except for NTC in Donor 10 where error bars represent range due to loss of one replicate sample; *: p<0.05, **: p<0.01, ***: p<0.001 and ****: p<0.0001.
-
Figure 2—source data 1
Two versions of source data files have been uploaded for all gels/blots shown in this figure: (1) the original files of the full raw unedited gels or blots and; (2) figures with the uncropped gels or blots with the relevant bands clearly labeled.
- https://cdn.elifesciences.org/articles/76927/elife-76927-fig2-data1-v1.zip
Figure 3 with 3 supplements
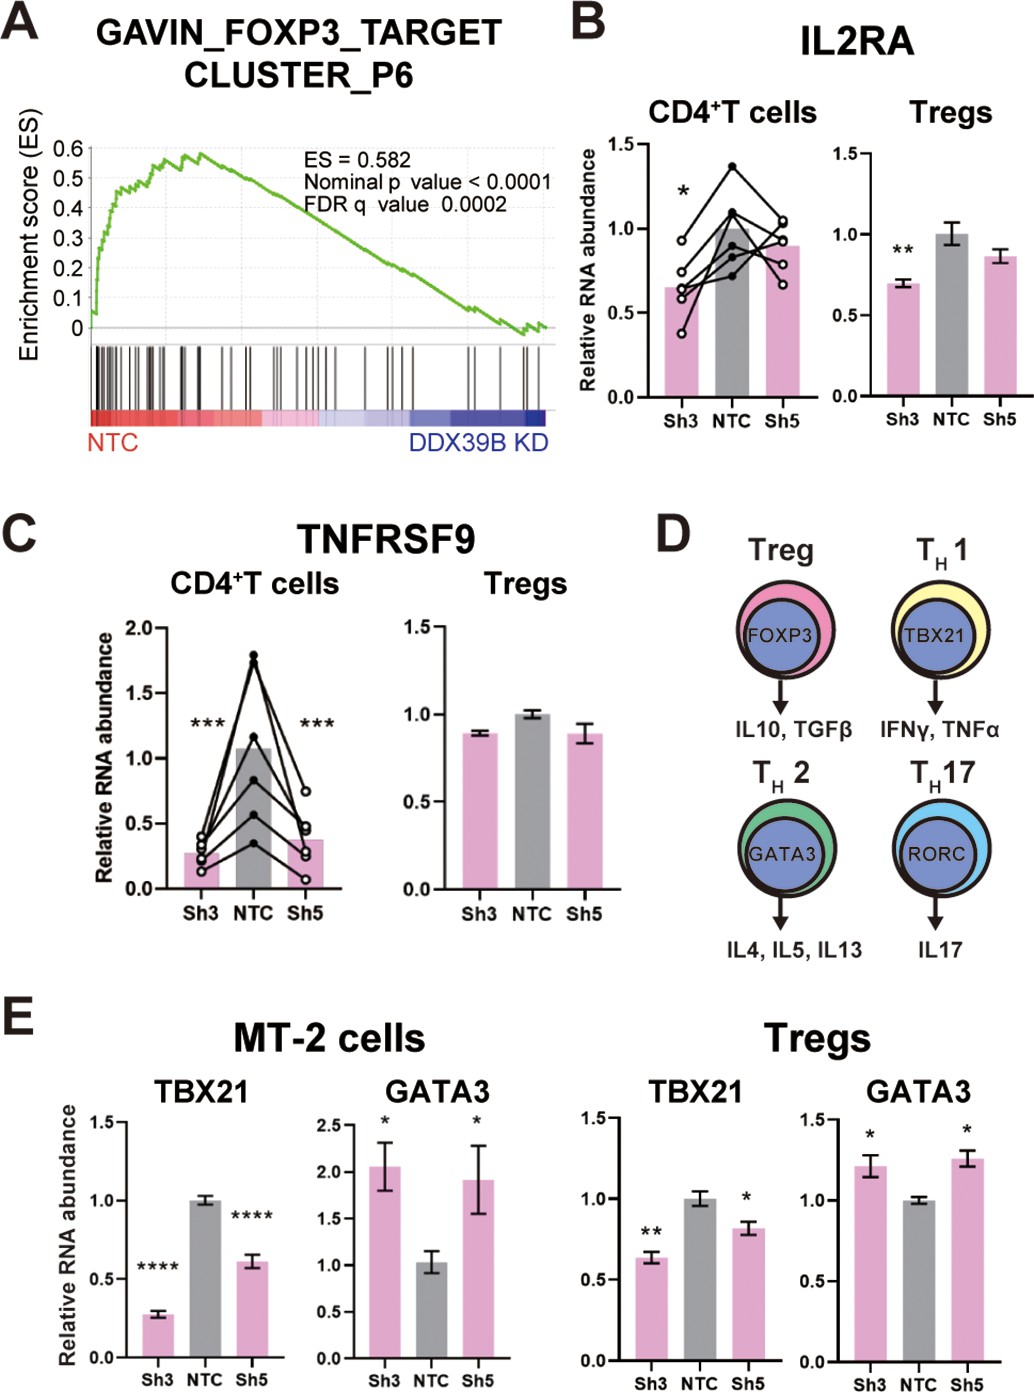
DDX39B depletion causes loss of Treg gene expression signature.
(A) GSEA results of GAVING_FOXP3_TARGET_CLUSTER_P6 gene set enriched in normal over DDX39B depleted CD4+ T cells (B) RNA abundance of IL2RA (CD25) relative to EEF1A1 in DDX39B-depleted CD4+ T cells (Left) and primary Tregs (Right). (C) RNA abundance of TNFRSF9 relative to EEF1A1 in DDX39B-depleted CD4+ T cells (Left) and primary Tregs (Right). (D) Schematic of genes expressed in different T cell lineages: Tregs, TH17, TH1, and TH2 effector cells. (E) RNA abundance of transcription factors regulating T cell differentiation: TBX21 (TH1), GATA3 (TH2) in MT-2 cells (Left) and primary Tregs (Right). *: p<0.05, **: p<0.01, ***: p<0.001 and ****: p<0.0001.
Figure 3—figure supplement 1
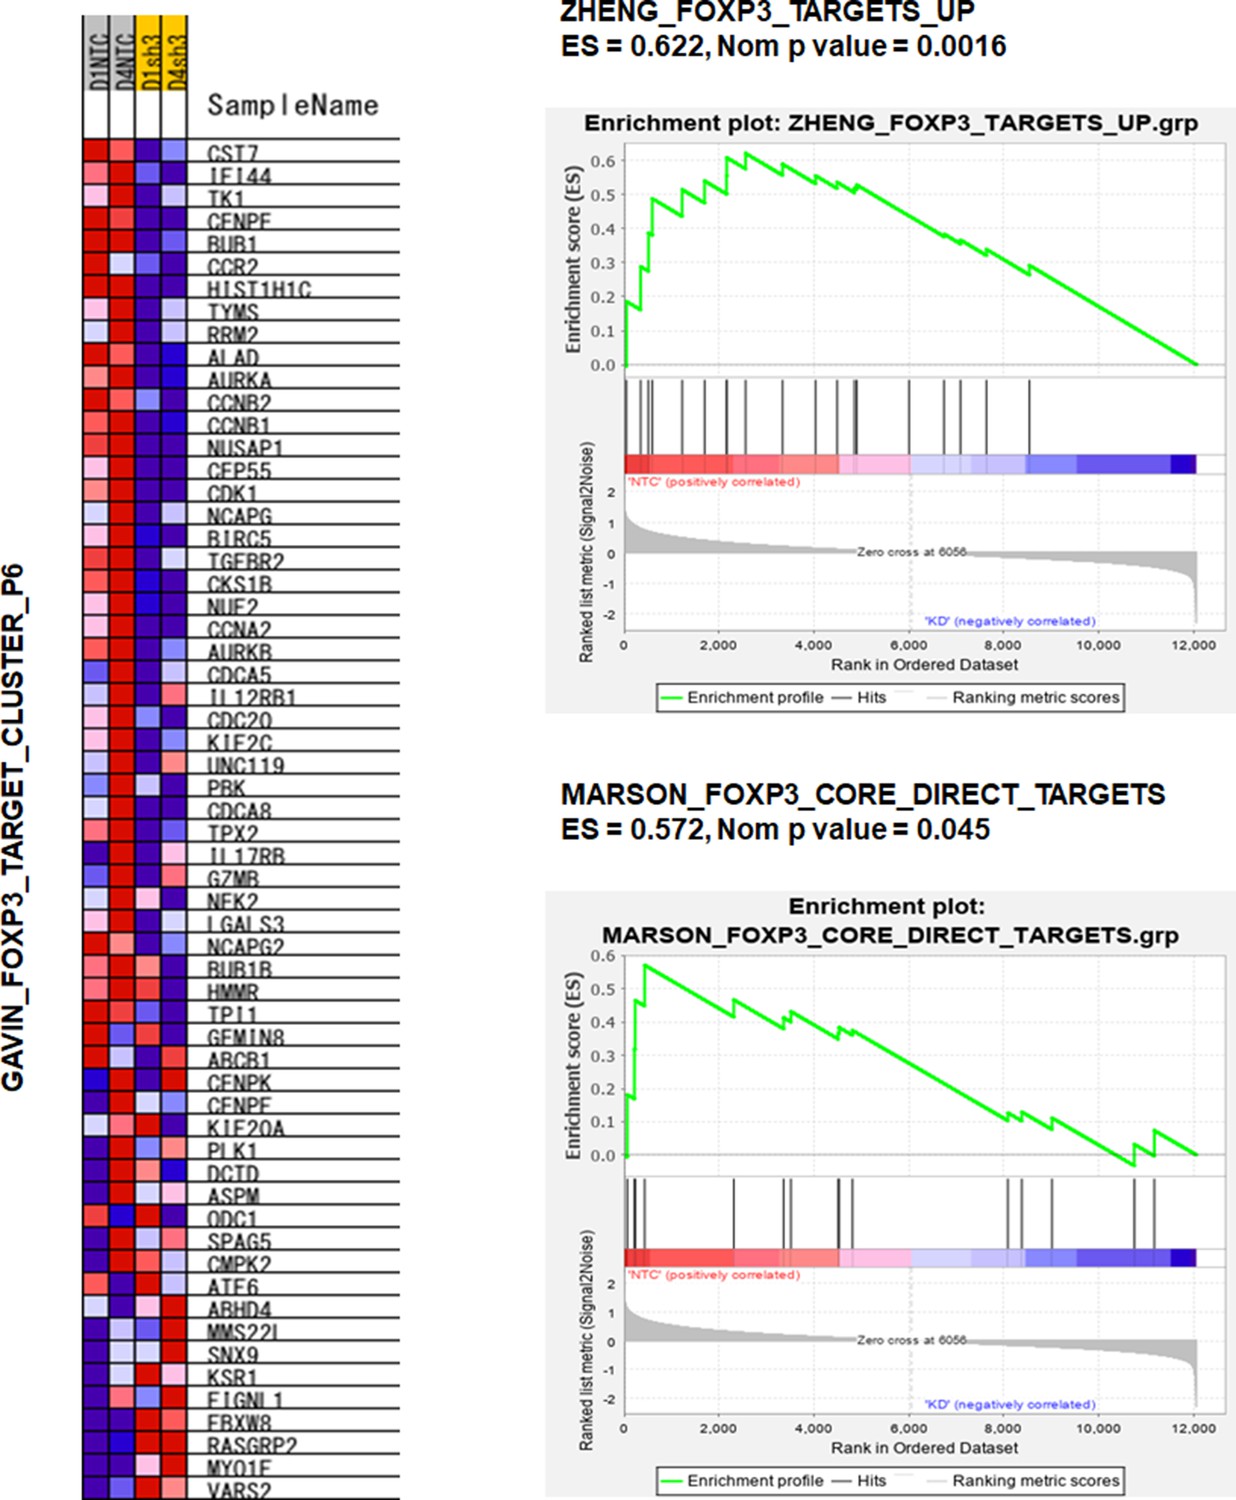
GSEA results of FOXP3-related gene sets enriched in normal over DDX39B-depleted cells.
GSEA was conducted comparing the transcriptome of control (NTC) and DDX39B-depleted (Sh3) CD4+ T cells. Additional data for the GAVIN_FOXP3_TARGET_CLUSTER_P6 gene set are shown in Figure 3A.
Figure 3—figure supplement 2
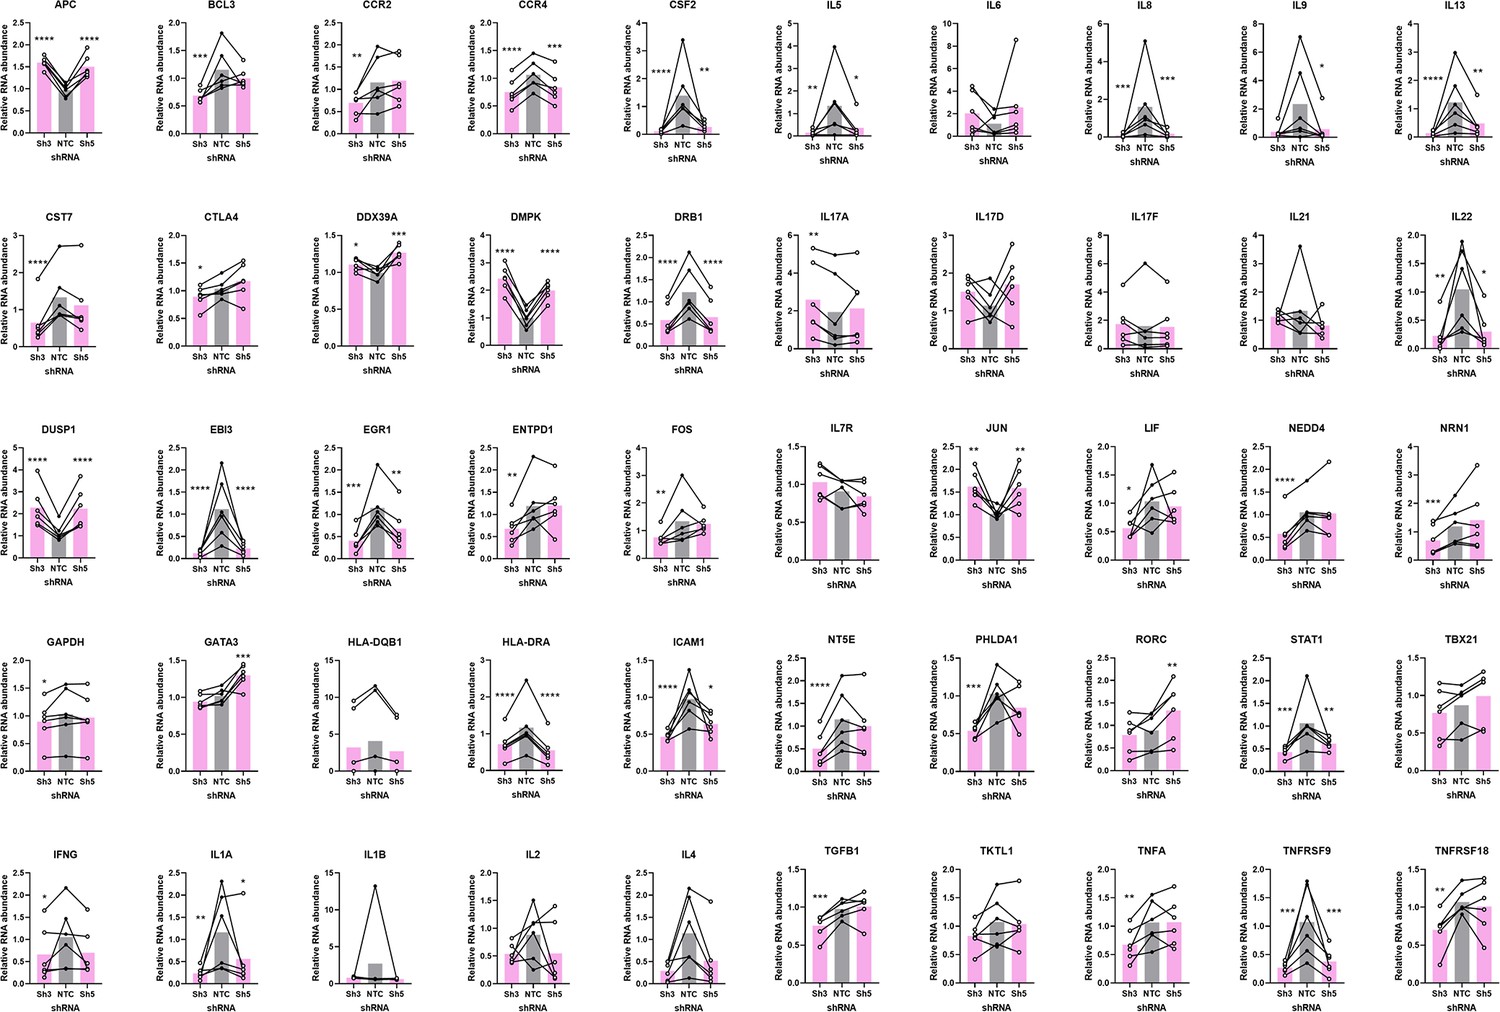
Effect of DDX39B depletion on expression of genes in CD4+ T cells.
Expression of genes with known immune function and GAPDH (as a control), normalized to EEF1A1 expression, was measured by RT-qPCR in control (NTC) or in primary CD4+ T cells depleted of DDX39B (Sh3 or Sh5) shRNAs. *: p<0.05, **: p<0.01, ***: p<0.001 and ****: p<0.0001.
Figure 3—figure supplement 3
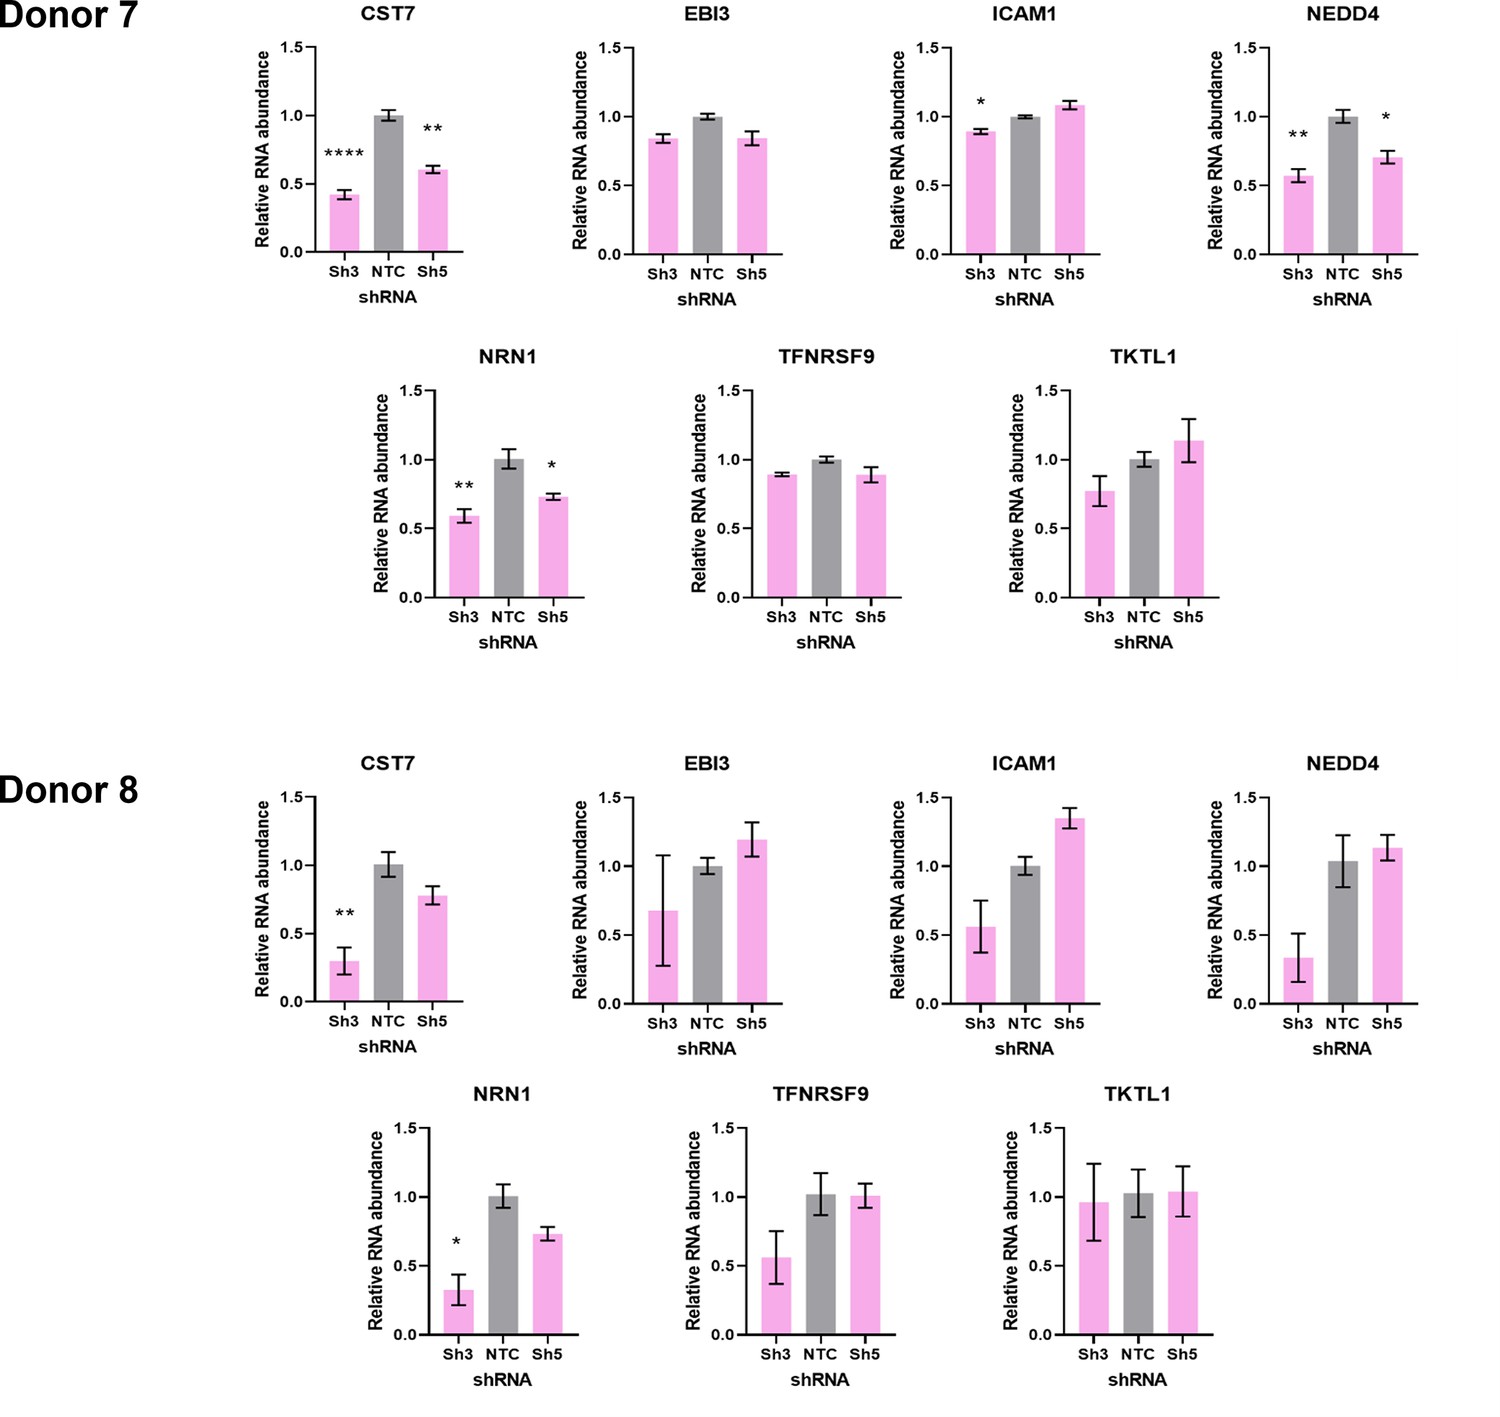
Effect of DDX39B depletion on expression of Treg genes.
DDX39B was depleted in T regs from Donors 7 and 8, and expression of seven Treg-related genes (from Gavin et al., 2007) were measured by RT-qPCR and normalized to EEF1A1 expression. *: p<0.05, **: p<0.01 and ****: p<0.0001.
Figure 4
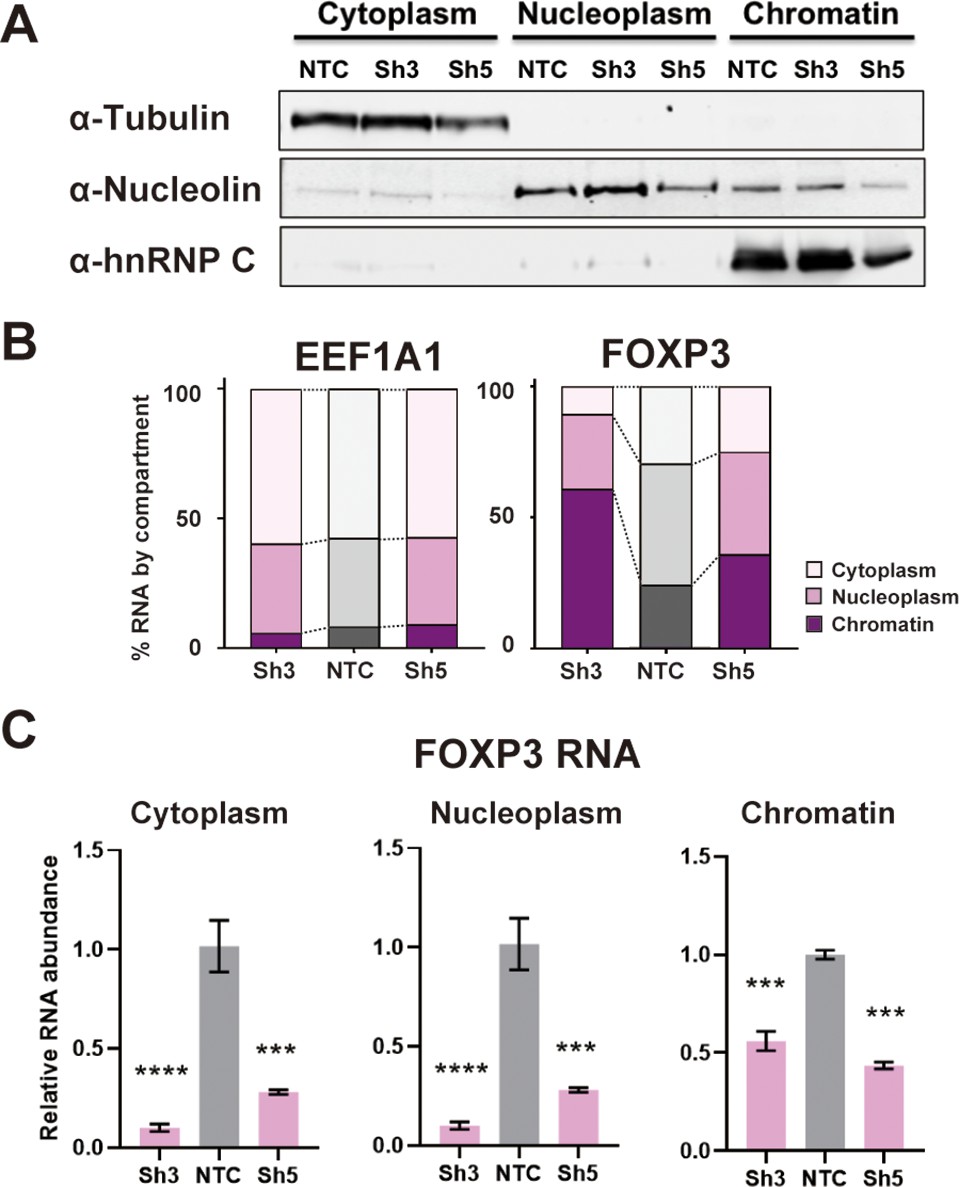
DDX39B depletion disturbs an early step in FOXP3 RNA biogenesis.
(A) Protein abundance of subcellular compartment markers in fractionated control (NTC) or DDX39B-depleted (Sh3 and Sh5) MT-2 cells. (B) Percent EEF1A1 or FOXP3 RNA in subcellular compartments. (C) FOXP3 RNA abundance relative to EEF1A1 in subcellular compartments upon DDX39B depletion.
-
Figure 4—source data 1
Two versions of source data files have been uploaded for all gels/blots shown in this figure: (1) the original files of the full raw unedited gels or blots and; (2) figures with the uncropped gels or blots with the relevant bands clearly labelled.
- https://cdn.elifesciences.org/articles/76927/elife-76927-fig4-data1-v1.zip
Figure 5 with 3 supplements
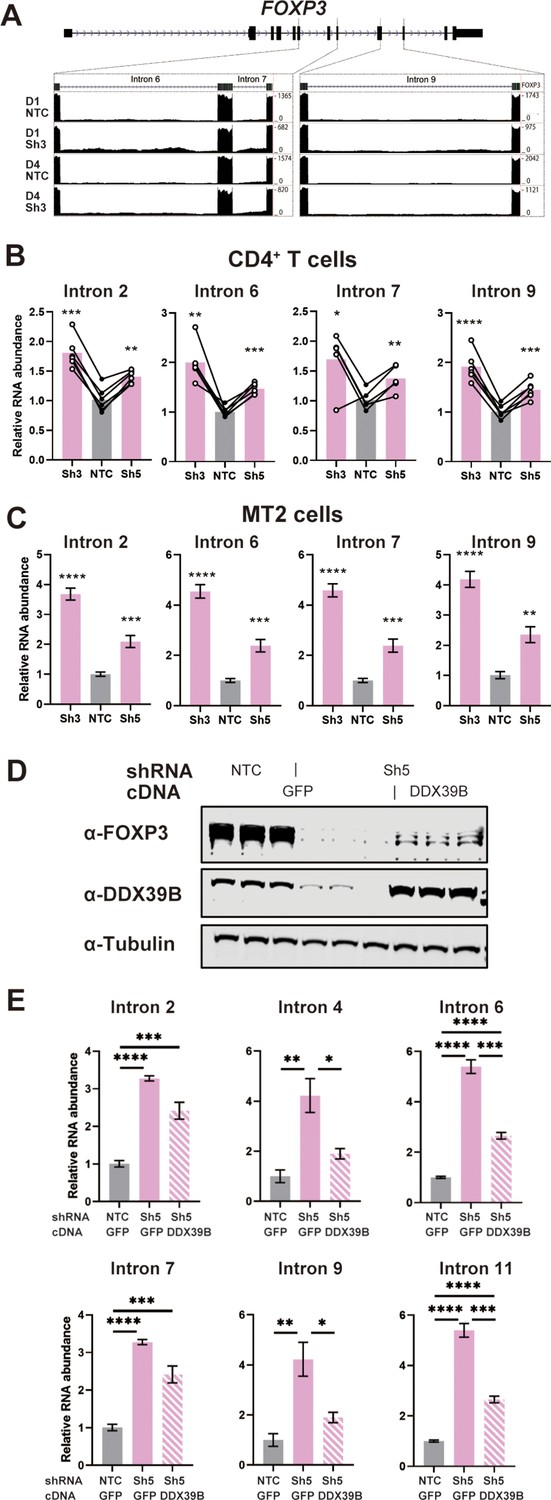
DDX39B depletion triggers the retention of FOXP3 introns.
(A) RNAseq reads mapping to the FOXP3 genomic region in control (NTC) or DDX39B depleted (Sh3) CD4+ T cells from Donors 1 and 4. Read counts for FOXP3 introns 6, 7, and 9 are shown on the Y-axis in the two insets. (B, C) Abundance of FOXP3 RNA introns relative to total FOXP3 RNA after DDX39B depletion in CD4+ T cells from six donors (B) or MT-2 cells (C). (D–E) Rescue of the DDX39B depletion (Sh3) by exogenous expression (GFP or DDX39B) in MT-2 cells. The abundance of FOXP3 and DDX39B relative to Tubulin (D) or FOXP3 RNA introns relative to total FOXP3 RNA (E) are shown.*: p<0.05, **: p<0.01, ***: p<0.001 and ****: p<0.0001.
-
Figure 5—source data 1
Two versions of source data files have been uploaded for all gels/blots shown in this figure: (1) the original files of the full raw unedited gels or blots and; (2) figures with the uncropped gels or blots with the relevant bands clearly labeled.
- https://cdn.elifesciences.org/articles/76927/elife-76927-fig5-data1-v1.zip
Figure 5—figure supplement 1

Quantification of FOXP3 retained introns in the chromatin fraction of MT-2 cells.
Control (NTC) or DDX39B-depleted (Sh3 or Sh5) MT-2 cells were fractionated into cytoplasm, nucleoplasm and chromatin fractions. Retained FOXP3 introns were quantified in the chromatin compartment by RT-qPCR using intron-specific primers and normalized to total FOXP3 RNA. **: p<0.01, ***: p<0.001.
Figure 5—figure supplement 2
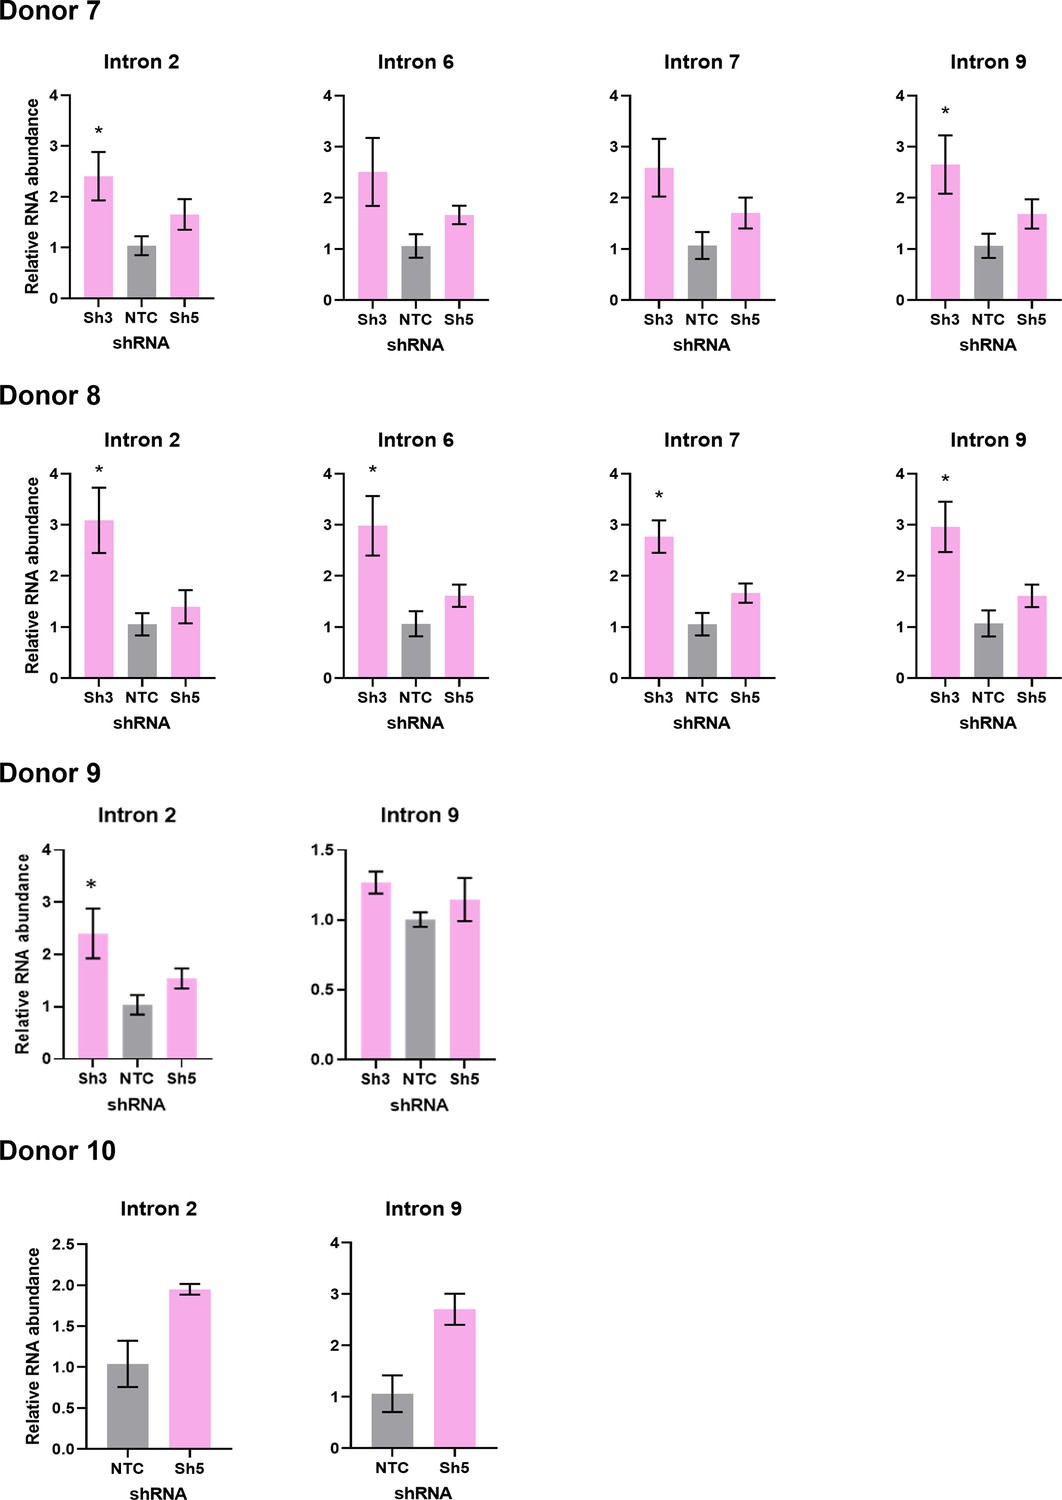
Quantification of FOXP3 retained introns in primary and induced Tregs.
DDX39B was depleted in Tregs from four independent donors (Donors 7–10) via lentivirus transduction with either control (NTC) or DDX39B targeting (Sh3 or Sh5) shRNAs. Retained FOXP3 introns were quantified from total RNA by RT-qPCR using intron-specific primers and normalized to total FOXP3 RNA. *: p<0.05.
Figure 5—figure supplement 3
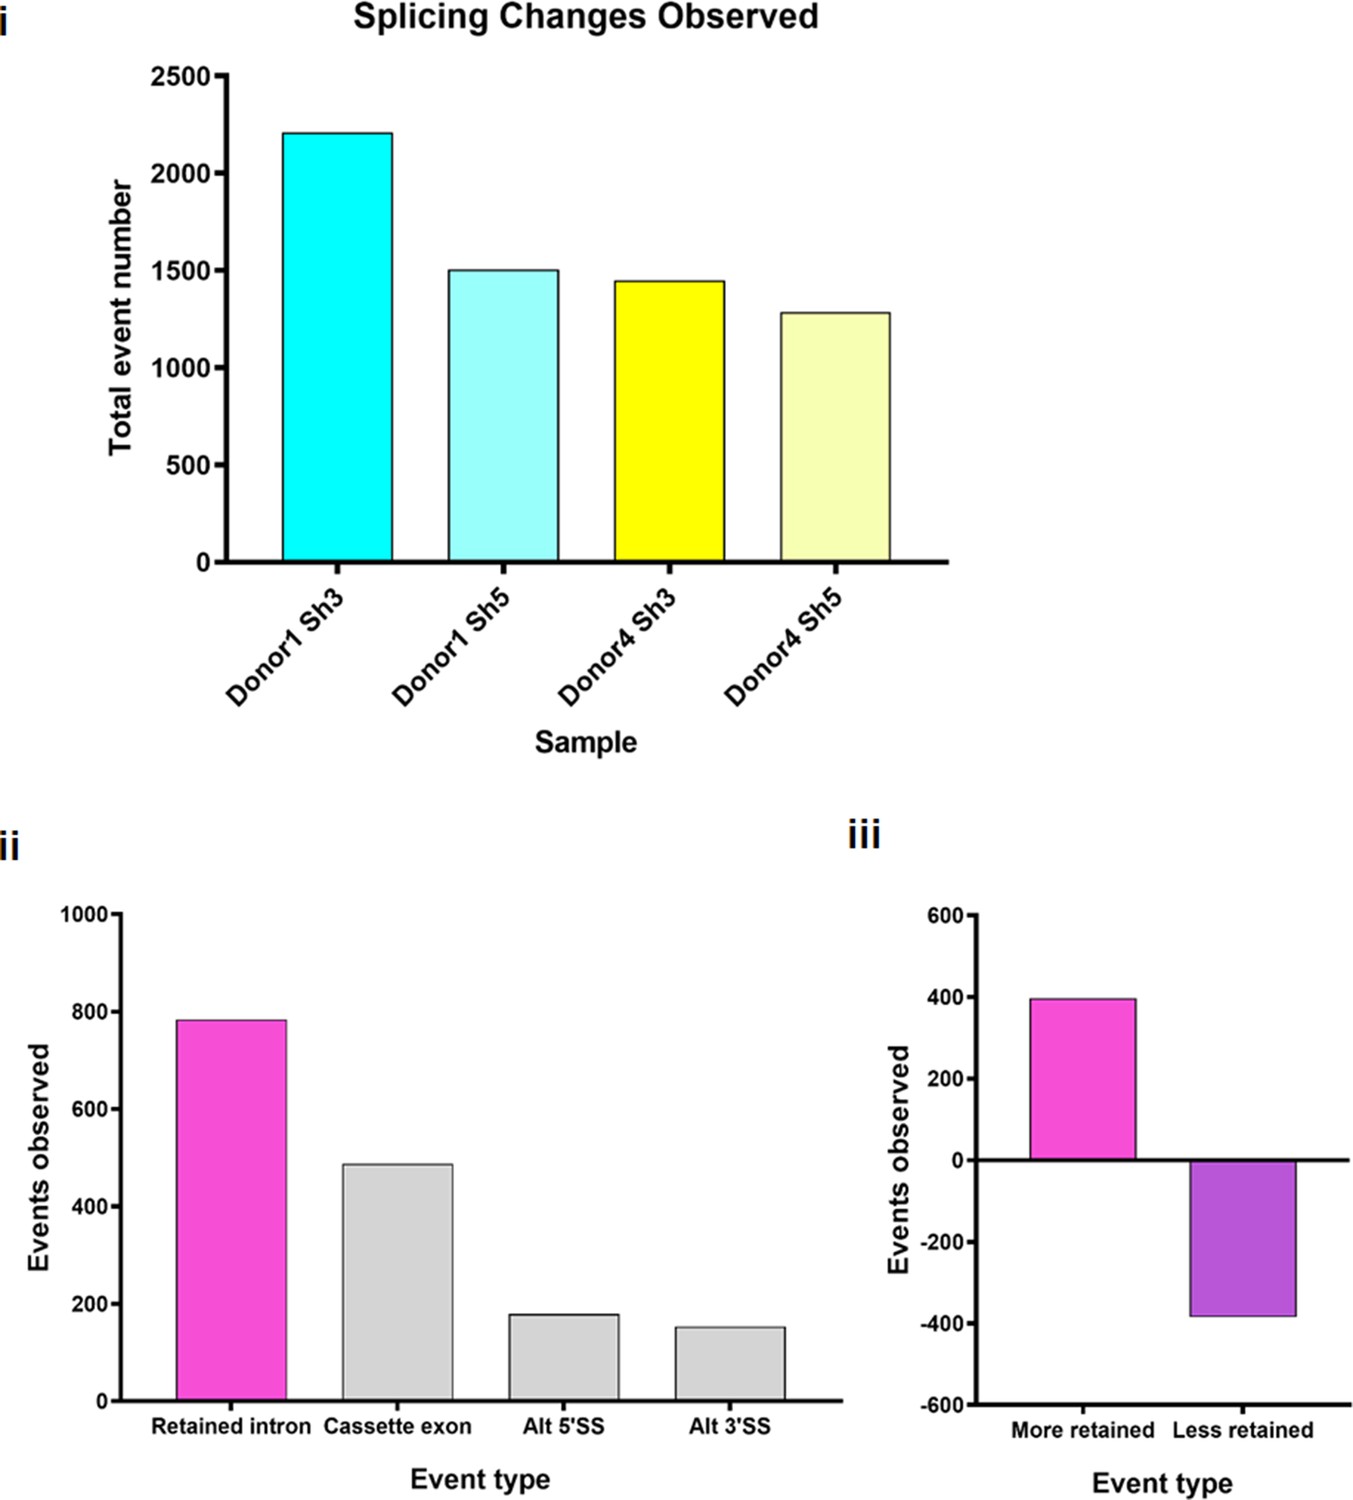
Alternative splicing events observed upon DDX39B depletion in CD4+ T cells.
Splicing analysis of RNAseq data was carried out using Vast-Tools. (i) Total events changed between control and either of two knockdown conditions (Sh3 and Sh5) in two donors (donors 1 and 4). (ii) Type of events of Sh3 knockdown in either donor are shown. Alt 5’SS, alternative 5’ splice site; Alt 3’SS, alternative 3’ splice site. (iii) Intron retention events in either donor are divided into those showing more retention or less retention with DDX39B knockdown.
Figure 6
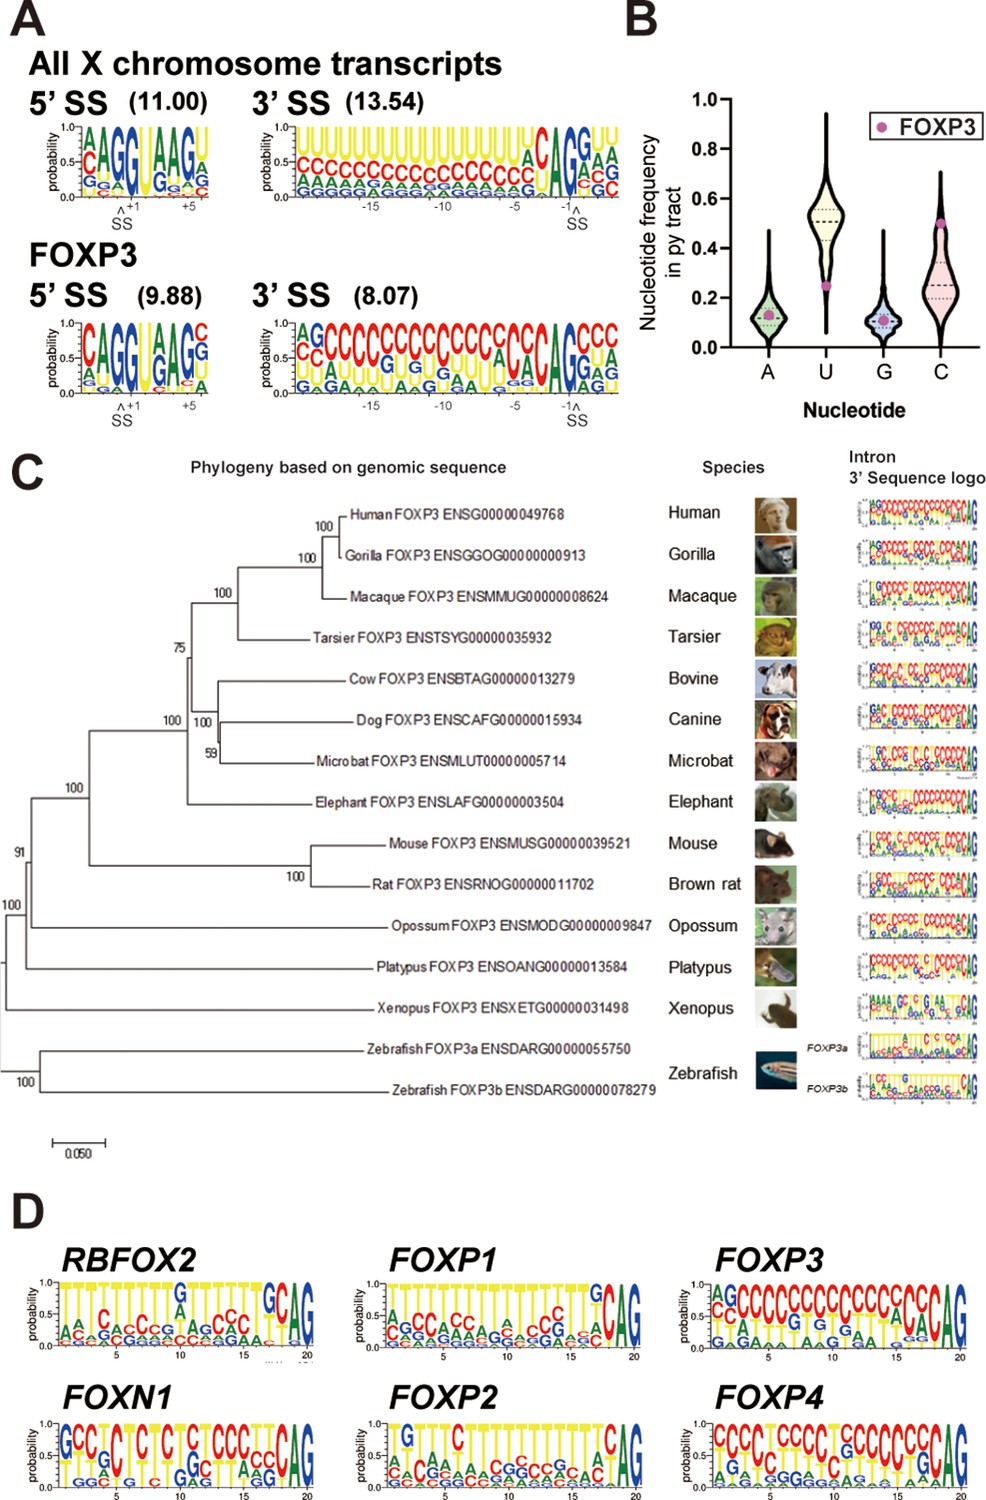
FOXP3 introns have conserved C-rich py tracts.
(A) Sequence logos of the 5’ and 3’ splice sites (SS) of FOXP3 versus all other chromosome X genes. 5’ or 3’ MaxEntScore based on the highest-probability sequence are shown. (B) Distribution of the py tract nucleotide frequency among chromosome X genes. Magenta dots indicate FOXP3. (C) Phylogenic tree and 3’ SS sequence logos of the FOXP3 among 14 species. Zebrafish has two FOXP3 genes (FOXP3a and FOXP3b). (D) 3’ SS sequence logos of FOX family genes. RBFOX2 is shown as an outgroup.
Figure 7 with 9 supplements

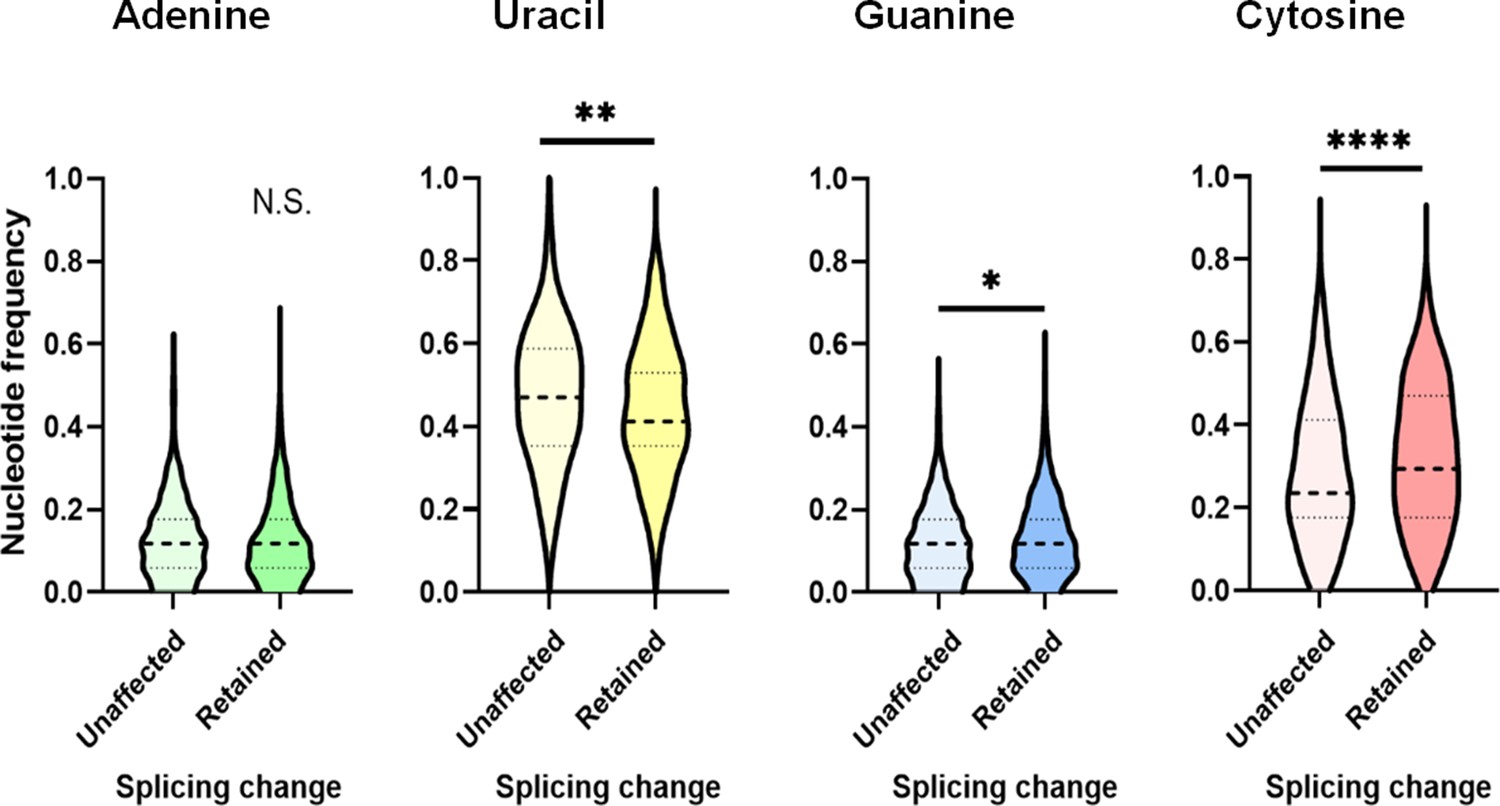
C-rich py tracts in FOXP3 introns determine DDX39B sensitivity.
(A) Schematic diagram of the splicing reporter. (B) Relative splicing efficiency of the wild-type (WT) or mutant (5’ SS mutant and Poly-U mutant) FOXP3 intron 11 splicing reporters after DDX39B depletion with D11 and D13 siRNAs. The sequence of 5’ splice sites (5’ SS) for these introns is shown indicating the three upstream exonic residues in capital letters and the six downstream intronic residues in minuscule letters. The sequence of the py tracts and 3’ splice sites (3’ SS) for these introns is shown indicating the intronic residues in minuscule letters and a single exonic residue in capital letters. (C) Nucleotide frequency in the py tract of introns that are insensitive (unaffected) or sensitive (retained) to DDX39B depletion. *: p<0.05, **: p<0.01, ***: p<0.001 and ****: p<0.0001.
Figure 7—figure supplement 1

Luciferase activity of the splicing reporters.
Control (NTC) or DDX39B-depleted (D11 or D13 siRNAs) HeLa cells were co-transfected with a Firefly luciferase reporter (transfection control, FLuc) and Renilla luciferase (RLuc) splicing reporters with no intron, human ßglobin (HGB1) intron 2, or FOXP3 introns 7, 9, or 11. Relative splicing efficiency of reporters was inferred by measuring luciferase activity (RLuc/FLuc) normalized to NTC. *: p<0.05, **: p<0.01, ***: p<0.001 and ****: p<0.0001.
Figure 7—figure supplement 2
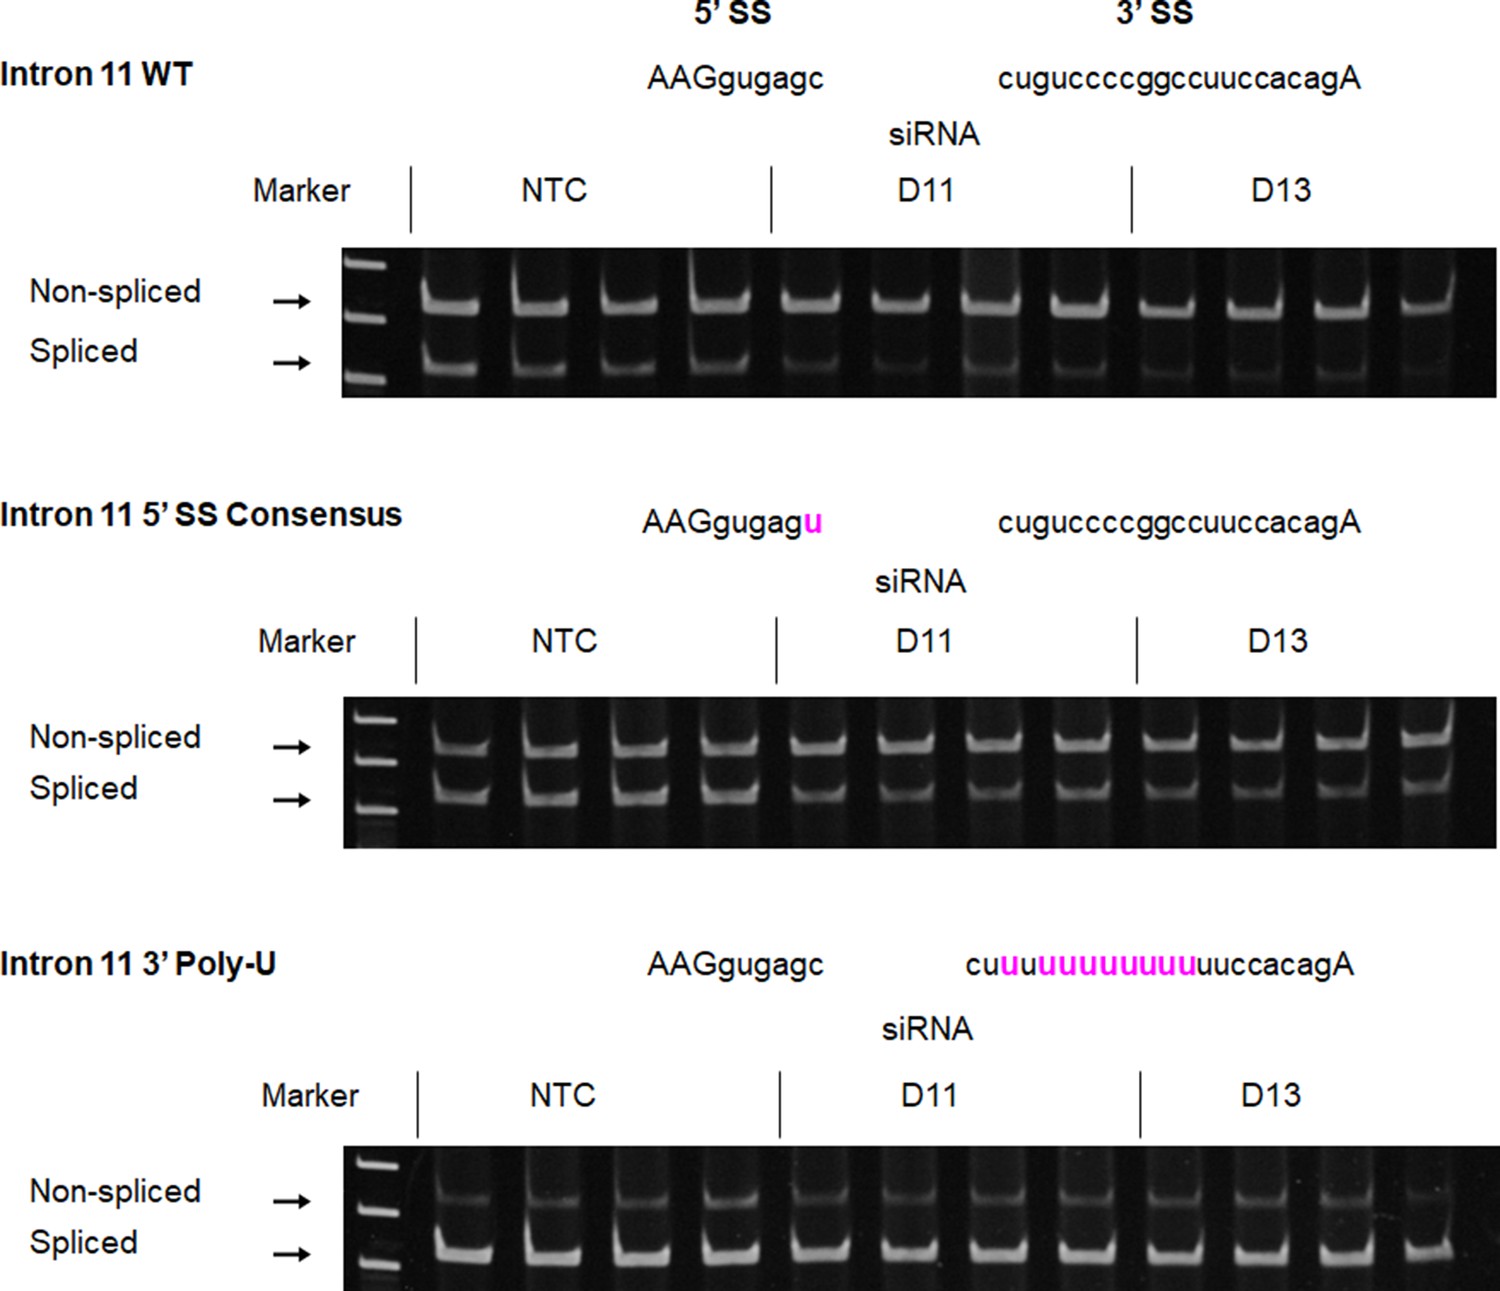
RT-PCR analysis of splicing efficiency of wild-type or mutant FOXP3 Intron 11 RLuc reporters.
Control (NTC) or DDX39B-depleted (D11 or D13) HeLa cells were transfected with FOXP3 intron 11 RLuc reporters (WT, 5’ SS consensus or 3’ Poly-U mutant), and splicing efficiency was directly measured by endpoint RT-PCR. Quantification of the gels is shown in Figure 7B.
-
Figure 7—figure supplement 2—source data 1
Two versions of source data files have been uploaded for all gels/blots shown in this figure: (1) the original files of the full raw unedited gels or blots and; (2) figures with the uncropped gels or blots with the relevant bands clearly labeled.
- https://cdn.elifesciences.org/articles/76927/elife-76927-fig7-figsupp2-data1-v1.zip
Figure 7—figure supplement 3
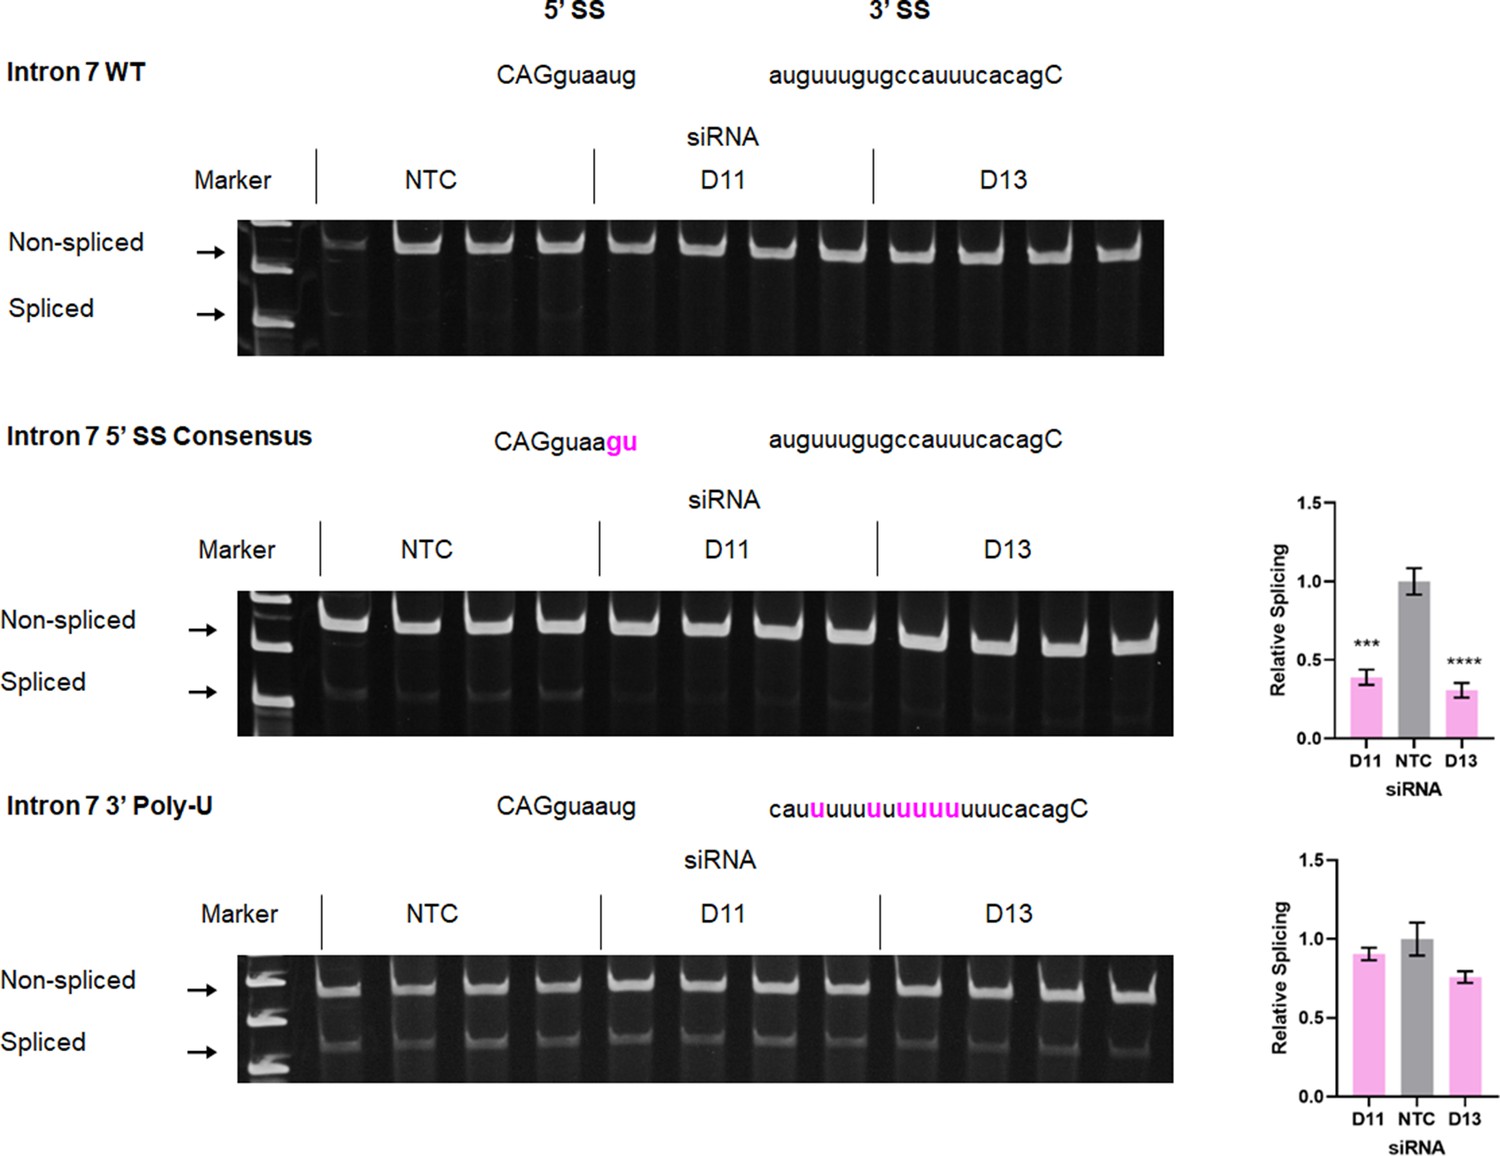
RT-PCR analysis of splicing efficiency of wild-type or mutant FOXP3 Intron 7 RLuc reporters.
Control (NTC) or DDX39B-depleted (D11 or D13) HeLa cells were transfected with FOXP3 intron 7 RLuc reporters (WT, 5’ SS consensus or 3’ Poly-U mutant), and splicing efficiency was directly measured by endpoint RT-PCR. Quantification is shown on the right for the lower two panels; given the very low level of splicing with intron 7 WT reporter it could not be accurately quantified. ***: p<0.001 and ****: p<0.0001.
-
Figure 7—figure supplement 3—source data 1
Two versions of source data files have been uploaded for all gels/blots shown in this figure: (1) the original files of the full raw unedited gels or blots and; (2) figures with the uncropped gels or blots with the relevant bands clearly labeled.
- https://cdn.elifesciences.org/articles/76927/elife-76927-fig7-figsupp3-data1-v1.zip
Figure 7—figure supplement 4
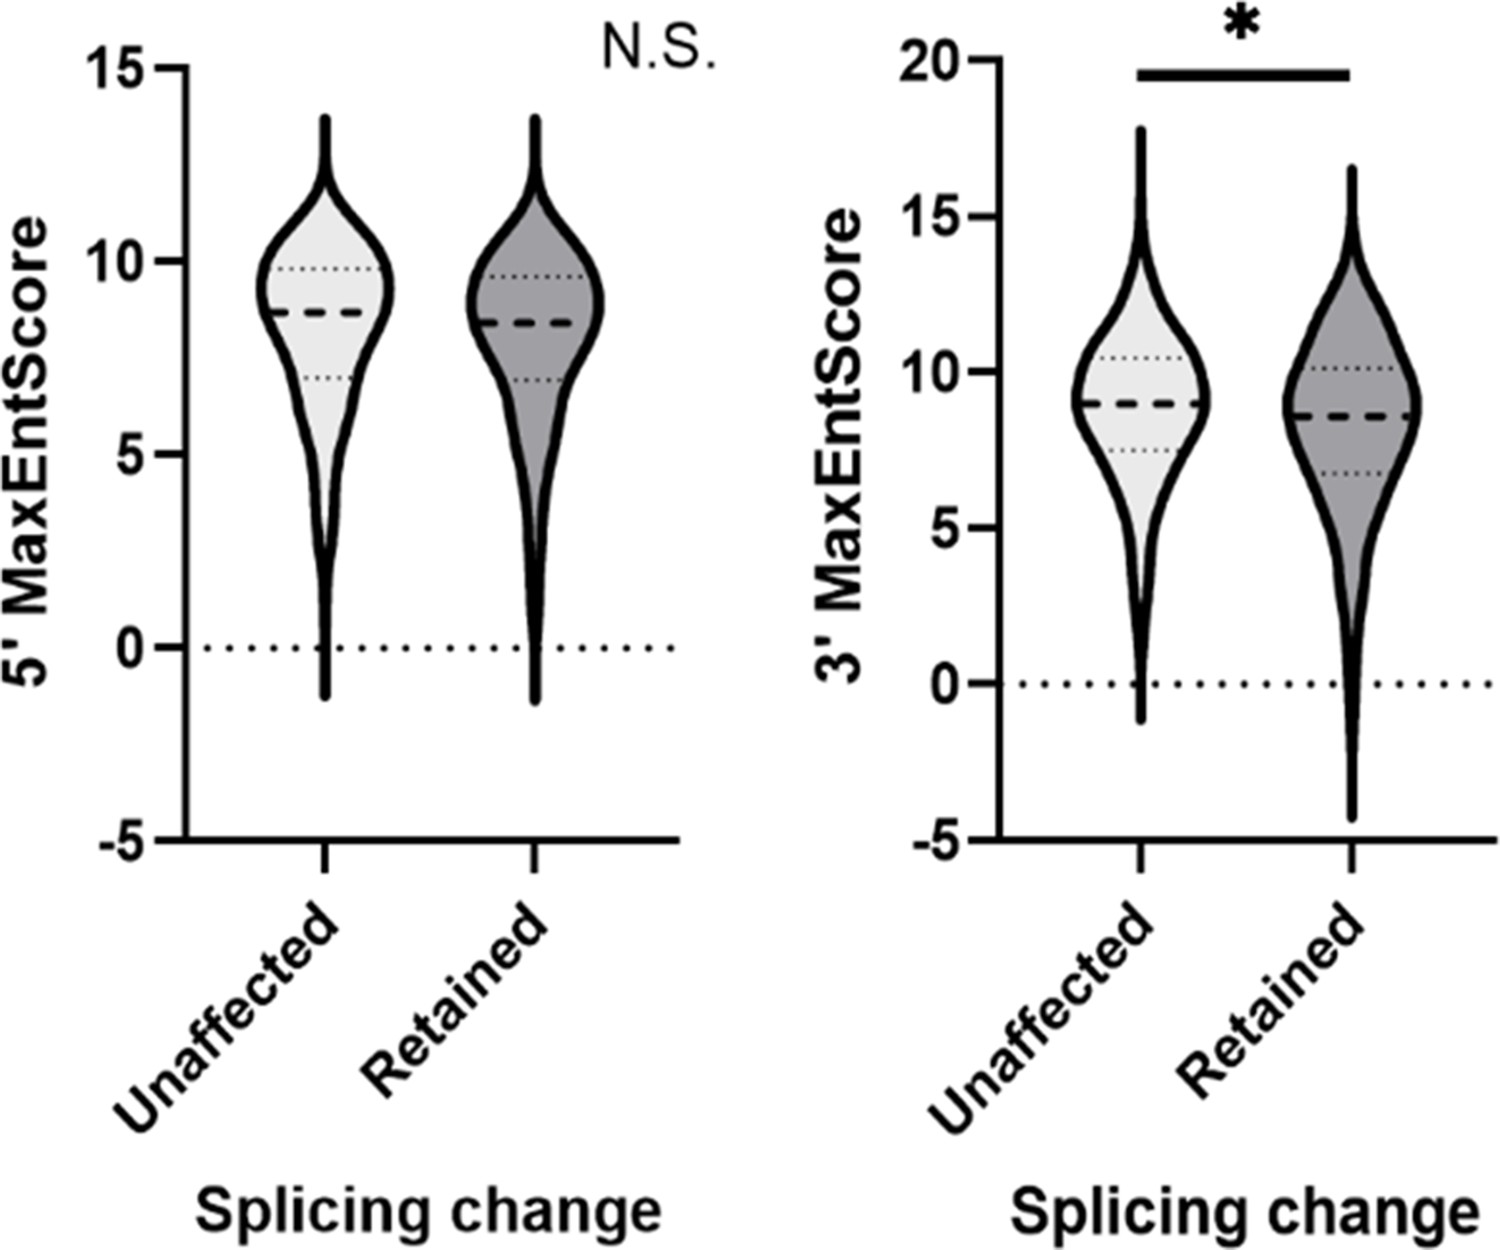
Comparison of Max entropy splice sites (SS) score between unaffected and DDX39B-sensitive introns.
Max entropy score of 5’ SS and 3’ SS of unaffected (500 randomly selected) and introns with increased retention upon DDX39B depletion (397 events) was determined using MaxEntScan (Yeo G and Burge CB, 2004). Dashed lines within the violin plots denote median values. *: p<0.05.
Figure 7—figure supplement 5

Comparison of Max entropy splice site (SS) scores (top panel) and nucleotide composition of py tracts (bottom panel) of unaffected introns or introns that were more retained in CD4+ T cells from either donor 1 or 4 depleted of DDX39B by treatment with Sh3 or Sh5.
*: p<0.05, **: p<0.01, ***: p<0.001 and ****: p<0.0001.
Figure 7—figure supplement 6
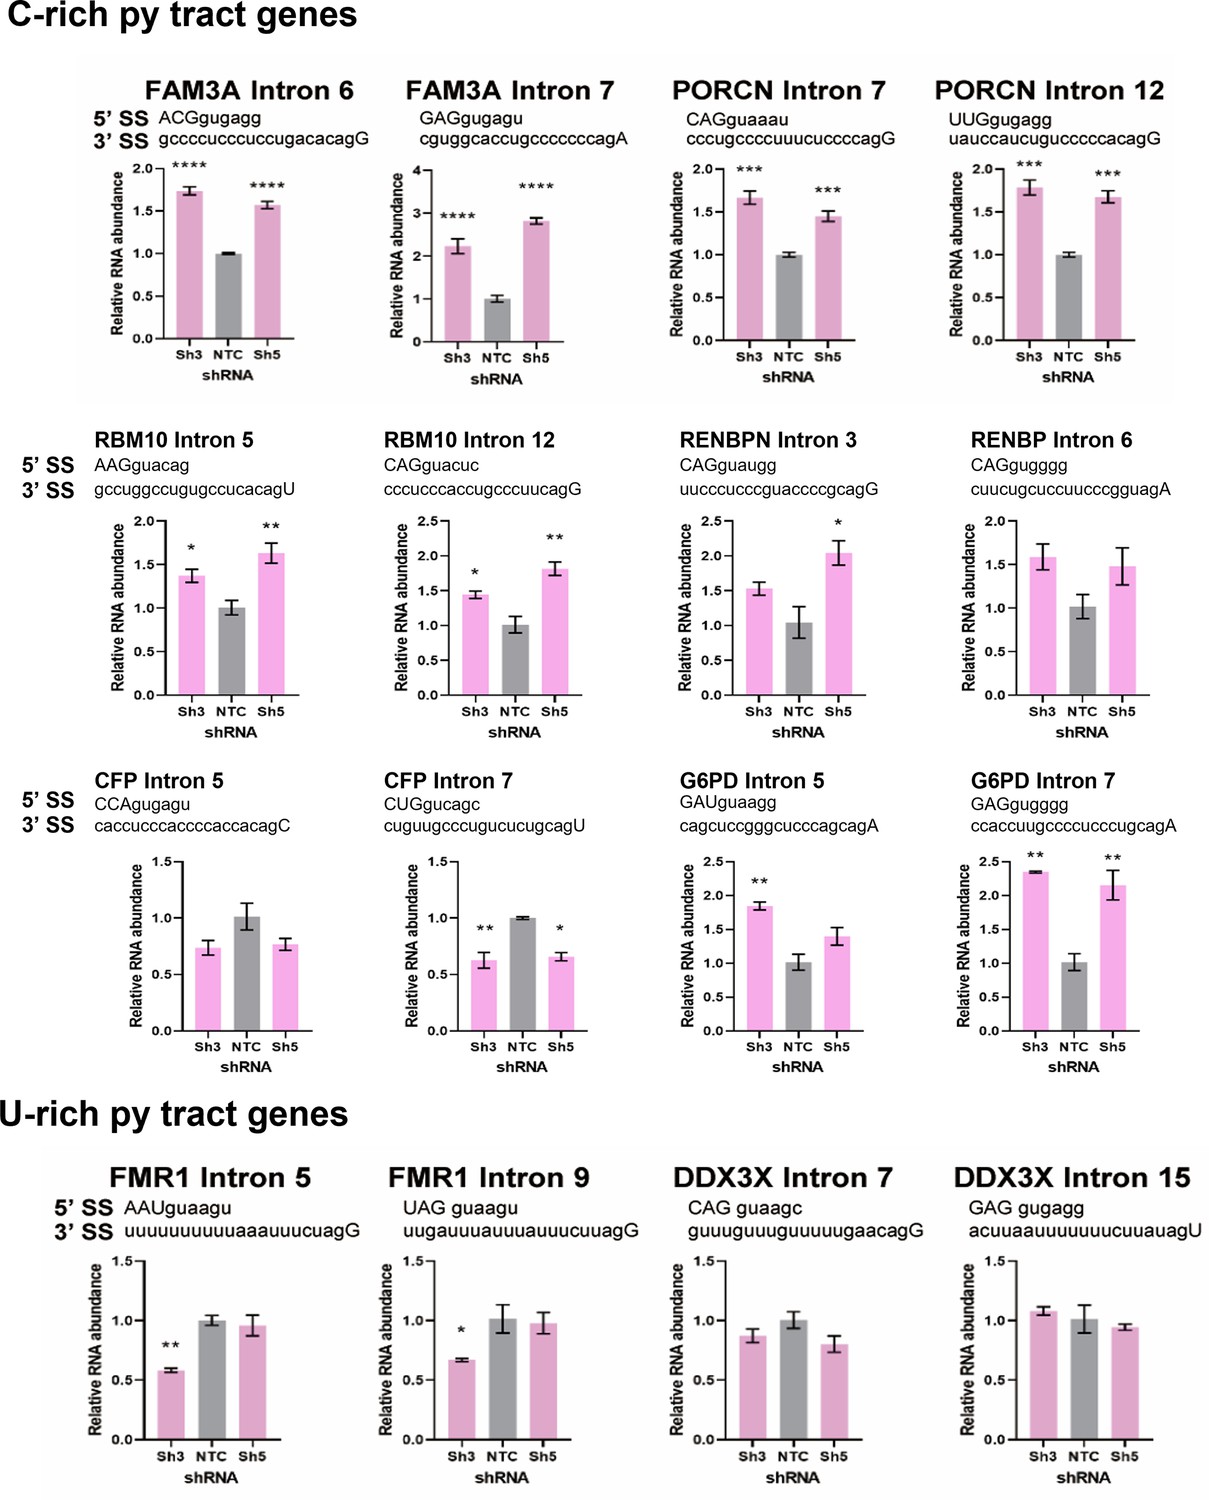
Detection of intron retention events in X chromosome genes with C-rich or U-rich py tracts.
Introns of the transcripts with C-rich (top) or U-rich (bottom) py tract were quantified by intron-specific RT-qPCR in control (NTC) and DDX39B-depleted (Sh3 or Sh5) MT-2 cells and normalized to their corresponding total transcripts. *: p<0.05, **: p<0.01, ***: p<0.001 and ****: p<0.0001.
Figure 7—figure supplement 7
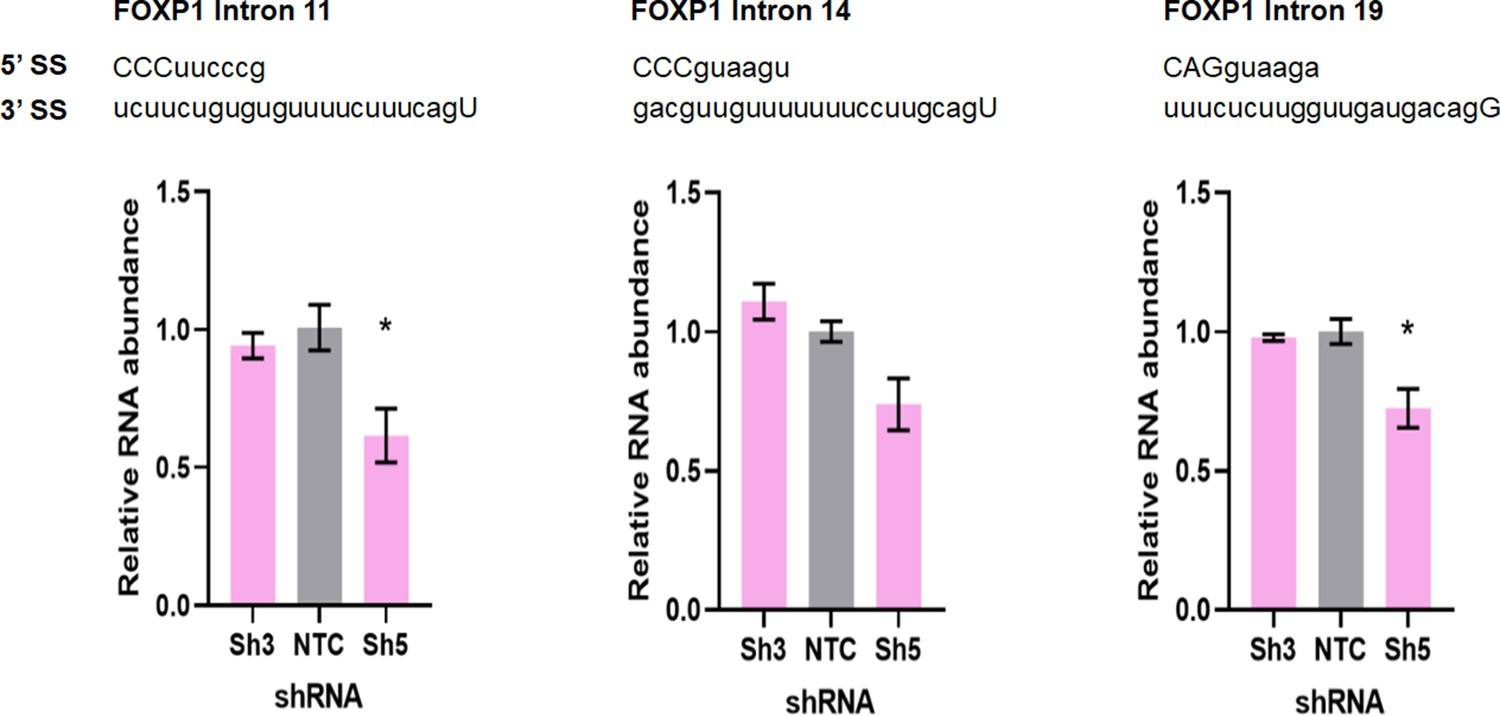
Retention of FOXP1 introns is not increased upon DDX39B depletion in MT-2 cells.
FOXP1 transcripts including introns 11, 14, or 19 were quantified by intron-specific RT-qPCR in control (NTC) and DDX39B-depleted (Sh3 or Sh5) MT-2 cells and normalized to total FOXP1 transcripts. *: p<0.05.
Figure 7—figure supplement 8
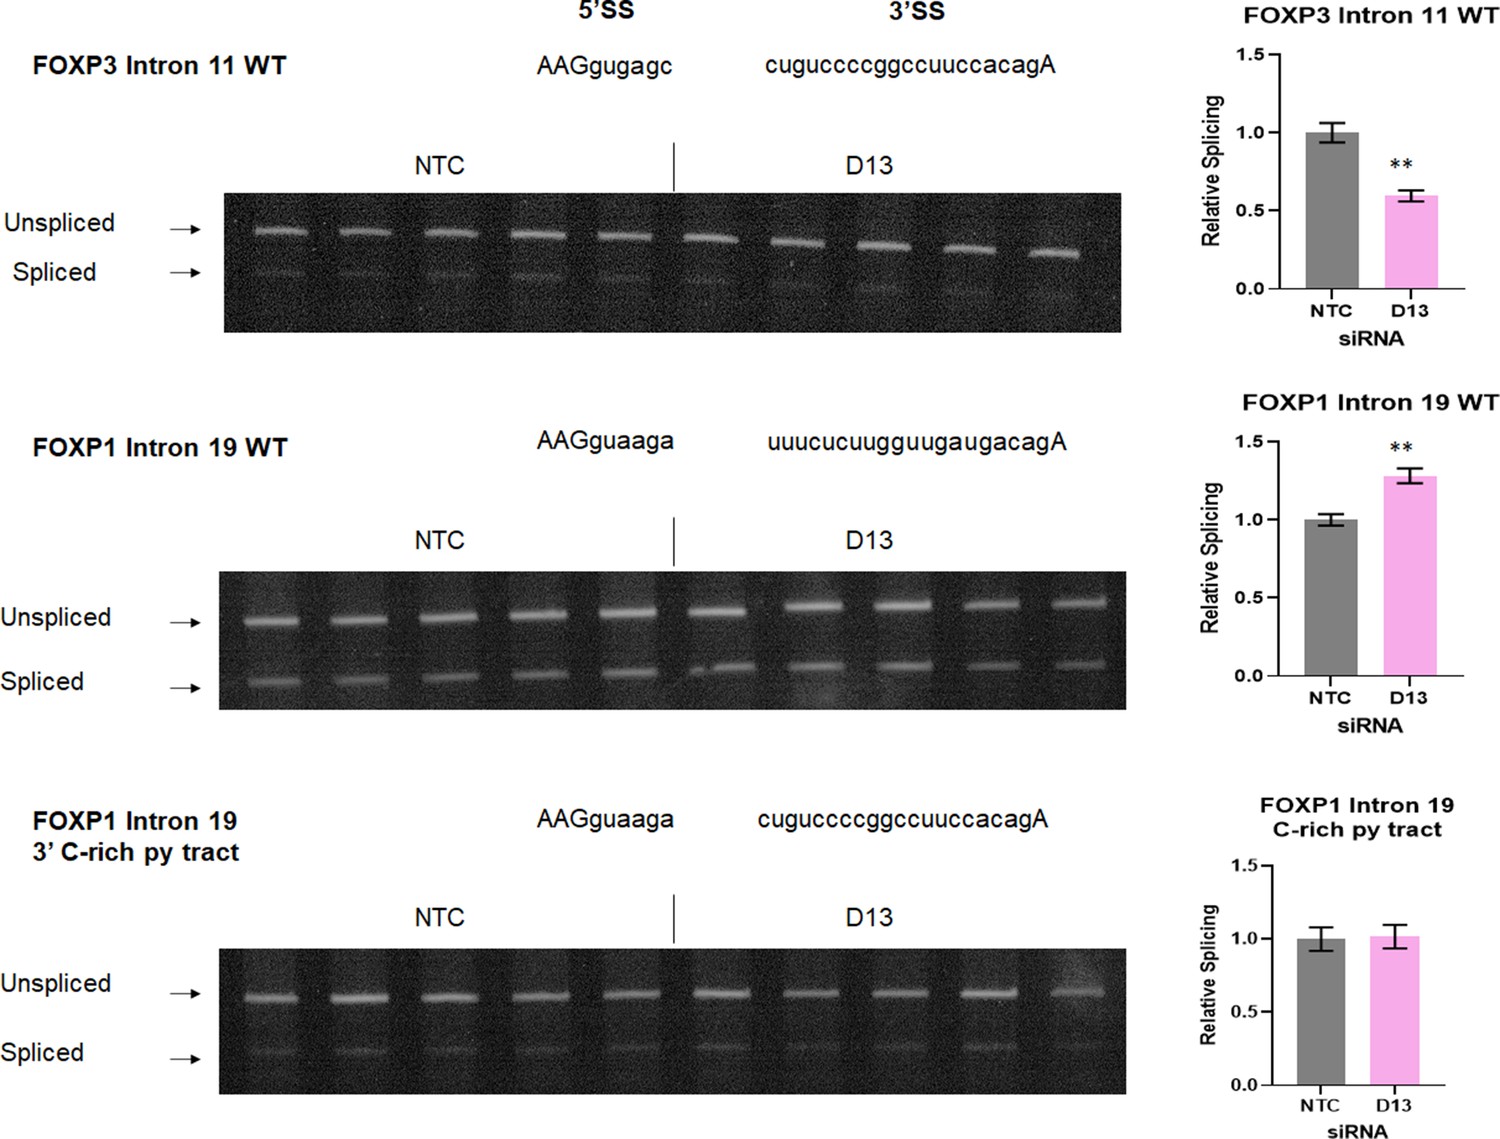
RT-PCR analysis of splicing efficiency of wild-type or mutant FOXP1 Intron 19 RLuc reporters.
Control (NTC) or DDX39B-depleted (D13) HeLa cells were transfected with FOXP3 or FOXP1 RLuc reporters. Splicing efficiency was directly measured by endpoint RT-PCR. Quantification is shown on the right. **: p<0.01.
-
Figure 7—figure supplement 8—source data 1
Two versions of source data files have been uploaded for all gels/blots shown in this figure: (1) the original files of the full raw unedited gels or blots and; (2) figures with the uncropped gels or blots with the relevant bands clearly labeled.
- https://cdn.elifesciences.org/articles/76927/elife-76927-fig7-figsupp8-data1-v1.zip
Figure 7—figure supplement 9
Comparison of py tract composition between unaffected and less-retained introns.
Nucleotide frequency of py tracts of unaffected (500 randomly selected) and those that are less-retained upon DDX39B knockdown (387) was calculated. Dashed lines denote median values. p<0.05, **: p<0.01, ***: p<0.001 and ****: p<0.0001.
Figure 8 with 1 supplement
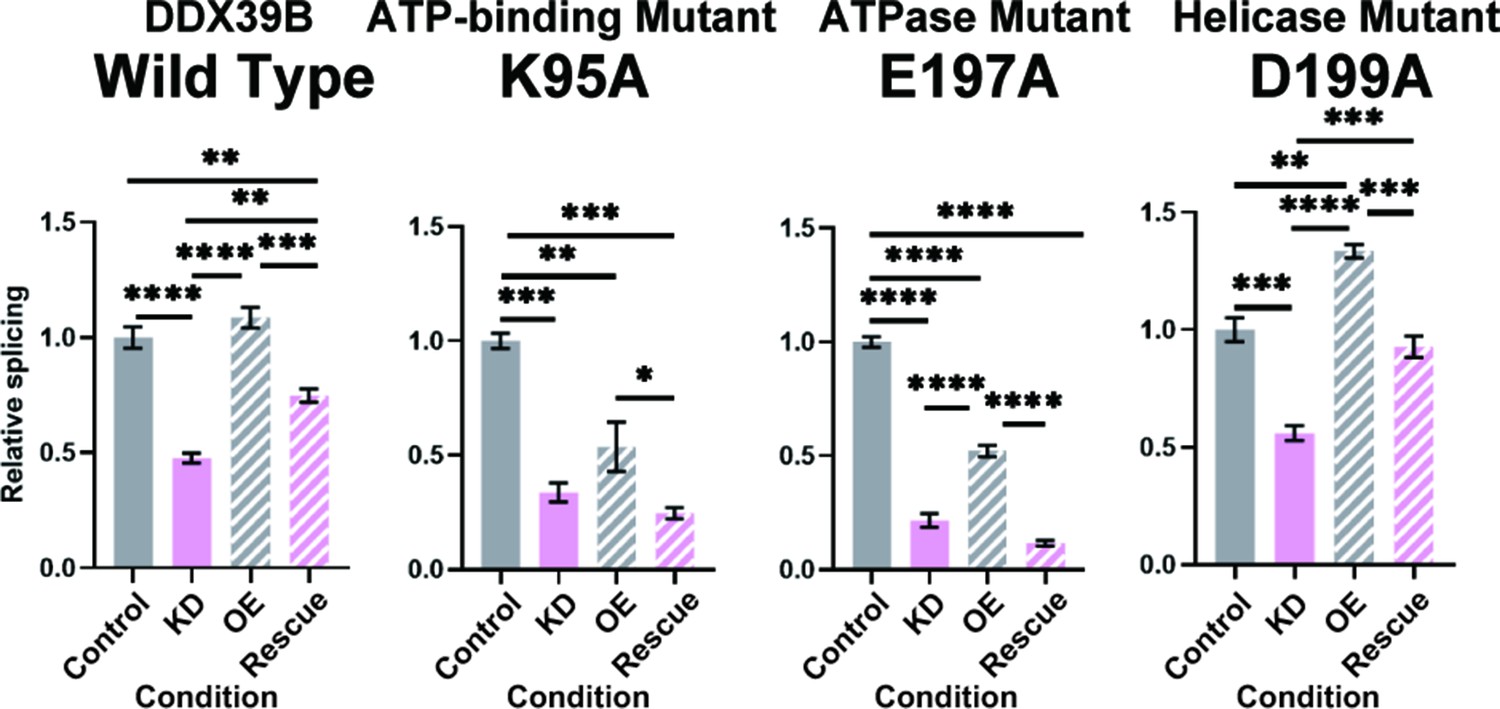
FOXP3 intron 11 splicing requires DDX39B ATPase activity but not its helicase activity.
Rescue of the splicing of FOXP3 intron 11 reporter by induced expression of wild type (WT) or mutant (K95A, E197A, and D199A) DDX39B. KD and OE indicate knockdown and over-expression, respectively. *: p<0.05, **: p<0.01, ***: p<0.001 and ****: p<0.0001.
Figure 8—figure supplement 1
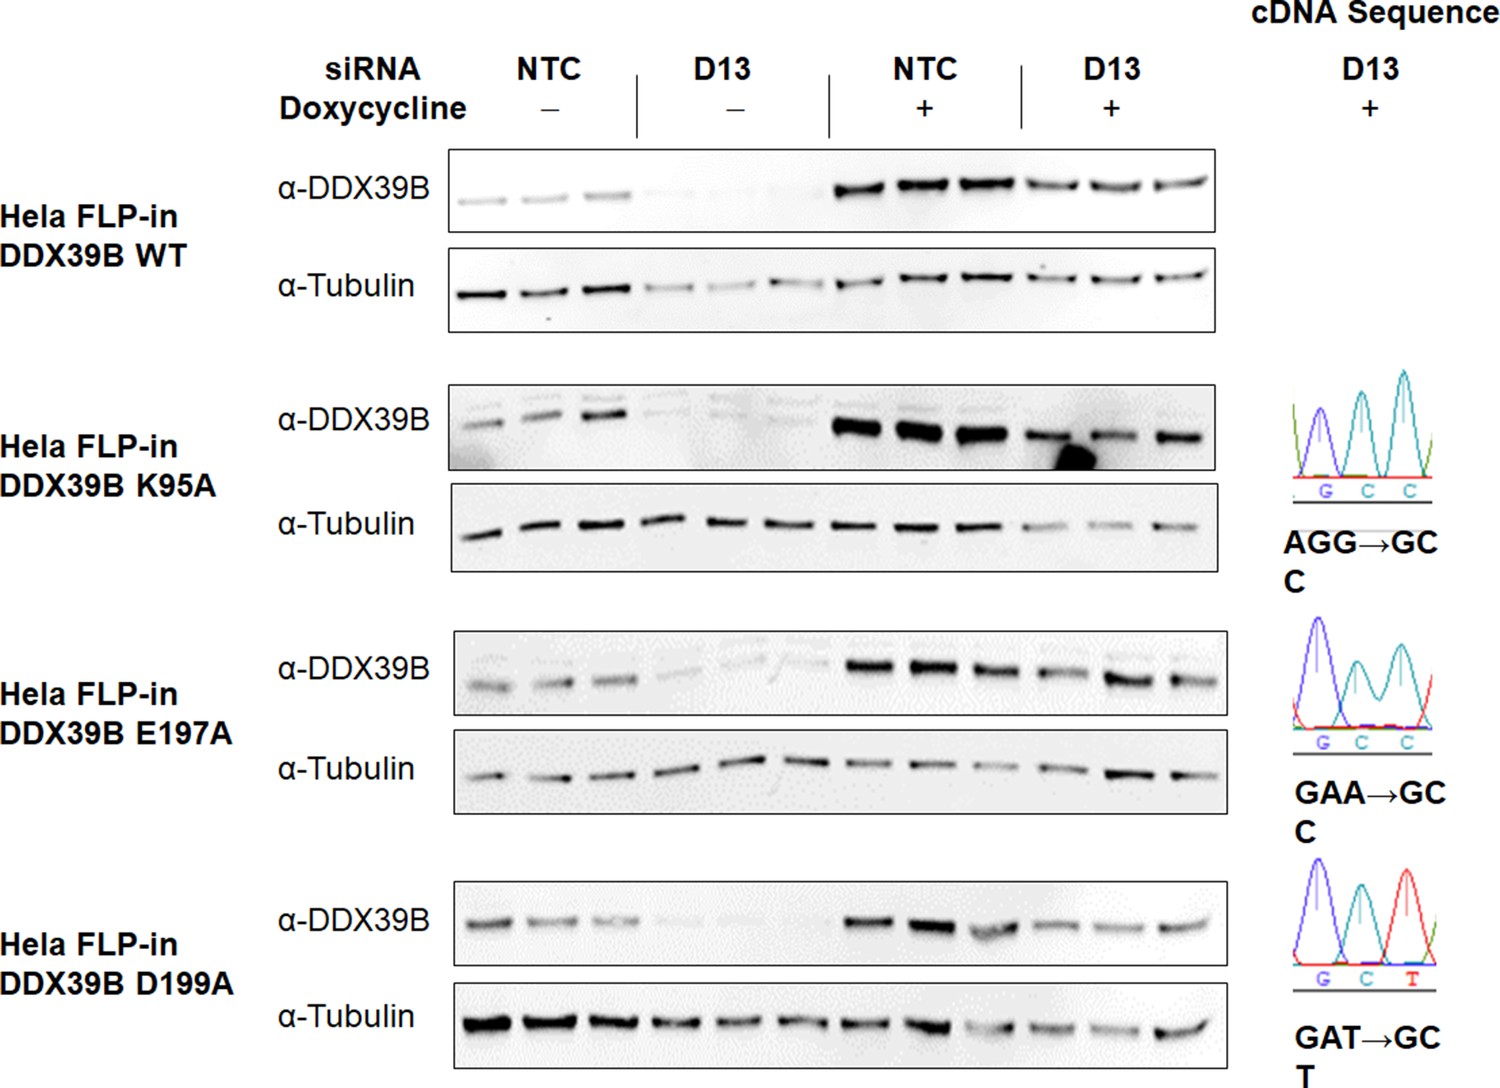
Expression of WT or mutant DDX39B in stable cell lines.
Stable HeLa cell lines with inducible expression of WT or mutant DDX39B trans-genes were transfected with control (NTC) or DDX39B (D13) siRNAs, and expression of a siRNA-resistant DDX39B transgene was induced with Doxycycline. DDX39B protein expression was quantified by western blot (left). Sanger sequencing of DDX39B RT-PCR amplicons from rescue with mutant DDX39B trans-genes (D13 +Doxycycline) shows preferential expression of DDX39B trans-genes under rescue conditions (right).
-
Figure 8—figure supplement 1—source data 1
Two versions of source data files have been uploaded for all gels/blots shown in this figure: (1) the original files of the full raw unedited gels or blots and; (2) figures with the uncropped gels or blots with the relevant bands clearly labeled.
- https://cdn.elifesciences.org/articles/76927/elife-76927-fig8-figsupp1-data1-v1.zip
Additional files
-
Supplementary file 1
Differentially expressed genes after DDX39B-depletion observed with both shRNAs in both donors.
Related to Figure 1 and Figure 1—figure supplement 1.
- https://cdn.elifesciences.org/articles/76927/elife-76927-supp1-v1.xlsx
-
Supplementary file 2
Differentially expressed genes after DDX39B-depletion (Sh3) observed in both donors.
Related to Figure 1 and Figure 1—figure supplement 1.
- https://cdn.elifesciences.org/articles/76927/elife-76927-supp2-v1.xlsx
-
Supplementary file 3
List of MS Susceptibility SNPs and genes analyzed.
Related to Figure 1 and Figure 1—figure supplements 2 and 3.
- https://cdn.elifesciences.org/articles/76927/elife-76927-supp3-v1.xlsx
-
Supplementary file 4
Gene sets enriched in cells with normal levels of DDX39B (NTC).
Related to Figure 3 and Figure 3—figure supplement 1.
- https://cdn.elifesciences.org/articles/76927/elife-76927-supp4-v1.xlsx
-
Supplementary file 5
Connectivity Map analysis of the DDX39B KD.
Related to Figure 3 and Figure 3—figure supplement 1.
- https://cdn.elifesciences.org/articles/76927/elife-76927-supp5-v1.xlsx
-
Supplementary file 6
VastTool analysis of in CD4+T cells with DDX39B-depletion.
Related to Figure 5 and Figure 5—figure supplement 3.
- https://cdn.elifesciences.org/articles/76927/elife-76927-supp6-v1.xlsx
-
Supplementary file 7
Human and Mouse FOXP3 introns.
Related to Figure 6.
- https://cdn.elifesciences.org/articles/76927/elife-76927-supp7-v1.docx
-
Supplementary file 8
Primer and Gblock sequences used in this study.
- https://cdn.elifesciences.org/articles/76927/elife-76927-supp8-v1.xlsx
-
Transparent reporting form
- https://cdn.elifesciences.org/articles/76927/elife-76927-transrepform1-v1.docx
Download links
A two-part list of links to download the article, or parts of the article, in various formats.
Downloads (link to download the article as PDF)
Open citations (links to open the citations from this article in various online reference manager services)
Cite this article (links to download the citations from this article in formats compatible with various reference manager tools)
The RNA helicase DDX39B activates FOXP3 RNA splicing to control T regulatory cell fate
eLife 12:e76927.
https://doi.org/10.7554/eLife.76927


