Exogenous capture accounts for fundamental differences between pro- and antisaccade performance
- Department of Neurobiology and Anatomy, Wake Forest School of Medicine, United States
Figures
Figure 1 with 1 supplement
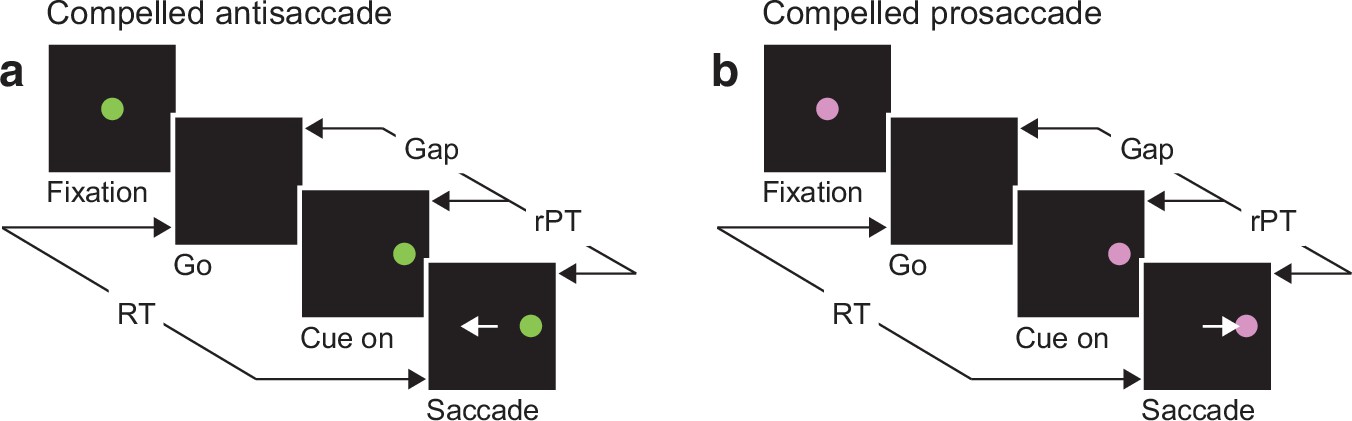
The urgent tasks.
(a) The compelled antisaccade (CAS) task. After a fixation period (500, 600, or 700 ms), the central fixation point disappears (Go), instructing the participant to look to the left or to the right within 425 ms. The cue is revealed later (Cue on, ±8°), after a time gap that varies unpredictably across trials (Gap, 0–350 ms). The correct response is an eye movement away from the cue, to the diametrically opposite location (Saccade, white arrow). (b) The compelled prosaccade (CPS) task. The sequence of events is the same as for the compelled antisaccade task, except that the correct response is an eye movement toward the cue. In all trials, the cue location and gap are selected randomly; the reaction time (RT) is measured between the onset of the go signal and the onset of the saccade; and the raw processing time (rPT) is measured between cue onset and saccade onset (calculated as RT − gap).
Figure 1—figure supplement 1
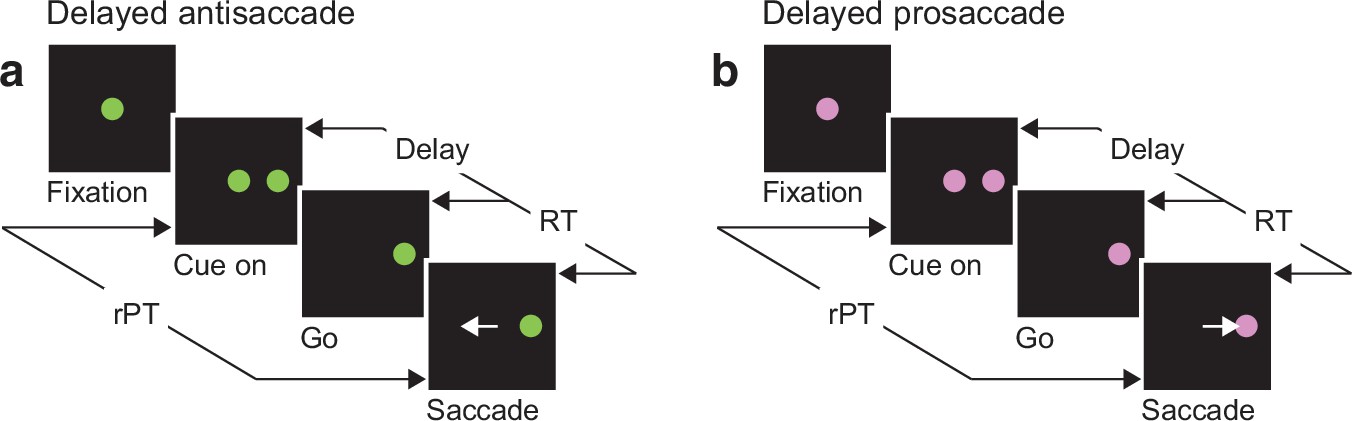
Nonurgent variants of the tasks.
(a) The delayed antisaccade task. After a fixation period (500, 600, or 700 ms), the cue is revealed (Cue on, ±8°). After a delay period (Delay, 100 or 200 ms), the central fixation point disappears (Go), instructing the participant to make an eye movement within 425 ms. The correct response is to look away from the cue, to the diametrically opposite location (Saccade, white arrow). (b) The delayed prosaccade task. The sequence of events is the same as for the delayed antisaccade task, except that the correct response is an eye movement toward the cue. In all trials, the cue location and delay are selected randomly; the reaction time (RT) is measured between the onset of the go signal and the onset of the saccade; and the raw processing time (rPT) is measured between cue onset and saccade onset (calculated as Delay + RT).
Figure 2
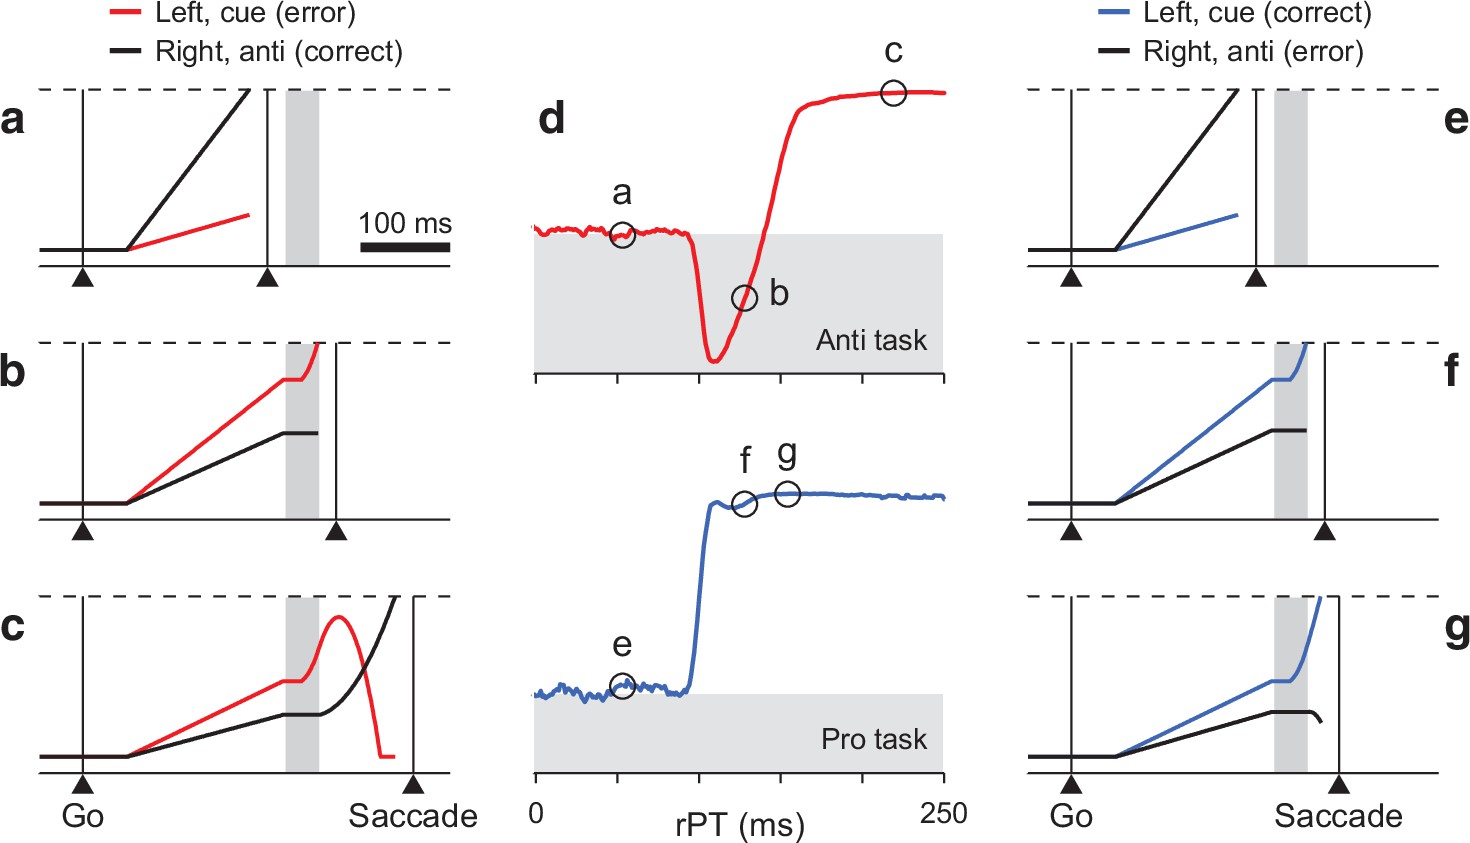
Turning a model of antisaccade performance into one of prosaccade performance.
(a–c) Three single antisaccade trials simulated with the CAS model. The cue is assumed to be on the left and the gap is 150 ms. Traces show motor plans toward the left (red, incorrect) and toward the right (black, correct) as functions of time. During the exogenous response interval (ERI, gray vertical shade), the plan toward the cue accelerates. After the ERI, the incorrect plan decelerates and the correct one accelerates. A saccade is triggered a short efferent delay after activity reaches threshold (dashed lines). Examples include a correct, short-rPT guess (a, rPT = 56 ms); an incorrect, captured saccade (b, rPT = 133 ms); and a correct, informed choice (c, rPT = 219 ms). (d) Simulated tachometric curves for the CAS (top, red) and CPS tasks (bottom, blue). The x and y axes correspond to raw processing time and fraction of correct choices, respectively. Gray shades indicate below-chance performance, where chance (white-gray border) is 50% correct. (e–g) Three single prosaccade trials with the same initial motor plans as in a–c but simulated with the CPS model. They include an incorrect, short-rPT guess (e, rPT = 56 ms); a correct, captured saccade (f, rPT = 133 ms); and a correct, informed choice (g, rPT = 149 ms). The pro- and antisaccade simulations differed only in the movement that was considered correct, which amounted to swapping the motor plans that were endogenously accelerated and decelerated.
Figure 3
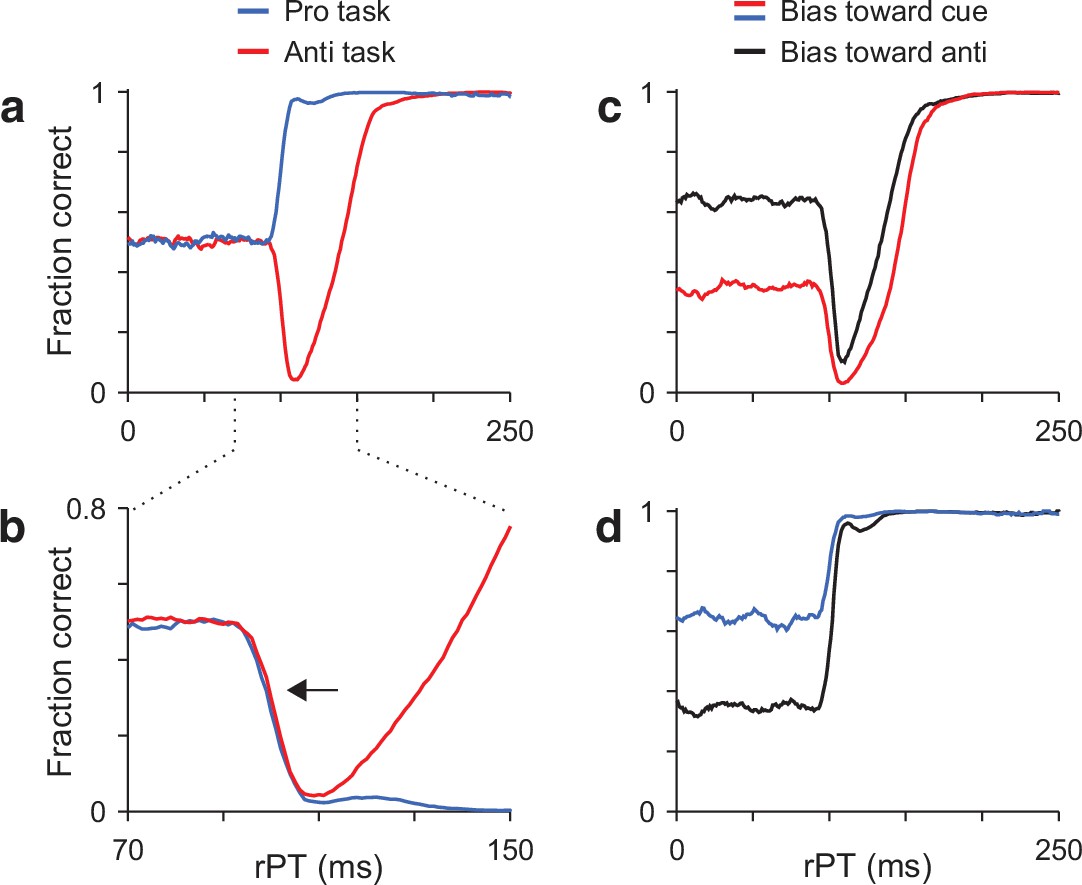
Model predictions.
(a) Simulated tachometric curves for the pro- (blue trace) and antisaccade tasks (red trace). Same curves as in Figure 2d, but superimposed. (b) Same data as in a, but shown over a smaller rPT range and with the prosaccade curve inverted (blue trace) relative to the chance level. Note that the initial departure from chance follows the same timecourse for the two tasks (arrow). (c) Antisaccade tachometric curves conditioned on cue location. Traces are expected results if the participant consistently guesses in one direction and trials are split into two groups: with the cue on the preferred side (red trace) or with the cue on the nonpreferred side (black trace). Note that the rise toward asymptotic performance occurs later when the initial motor bias is in the direction of the cue. (d) As in c, but for the prosaccade task. Note that, in this case, the rise in performance is similar regardless of the initial bias.
Figure 4 with 3 supplements
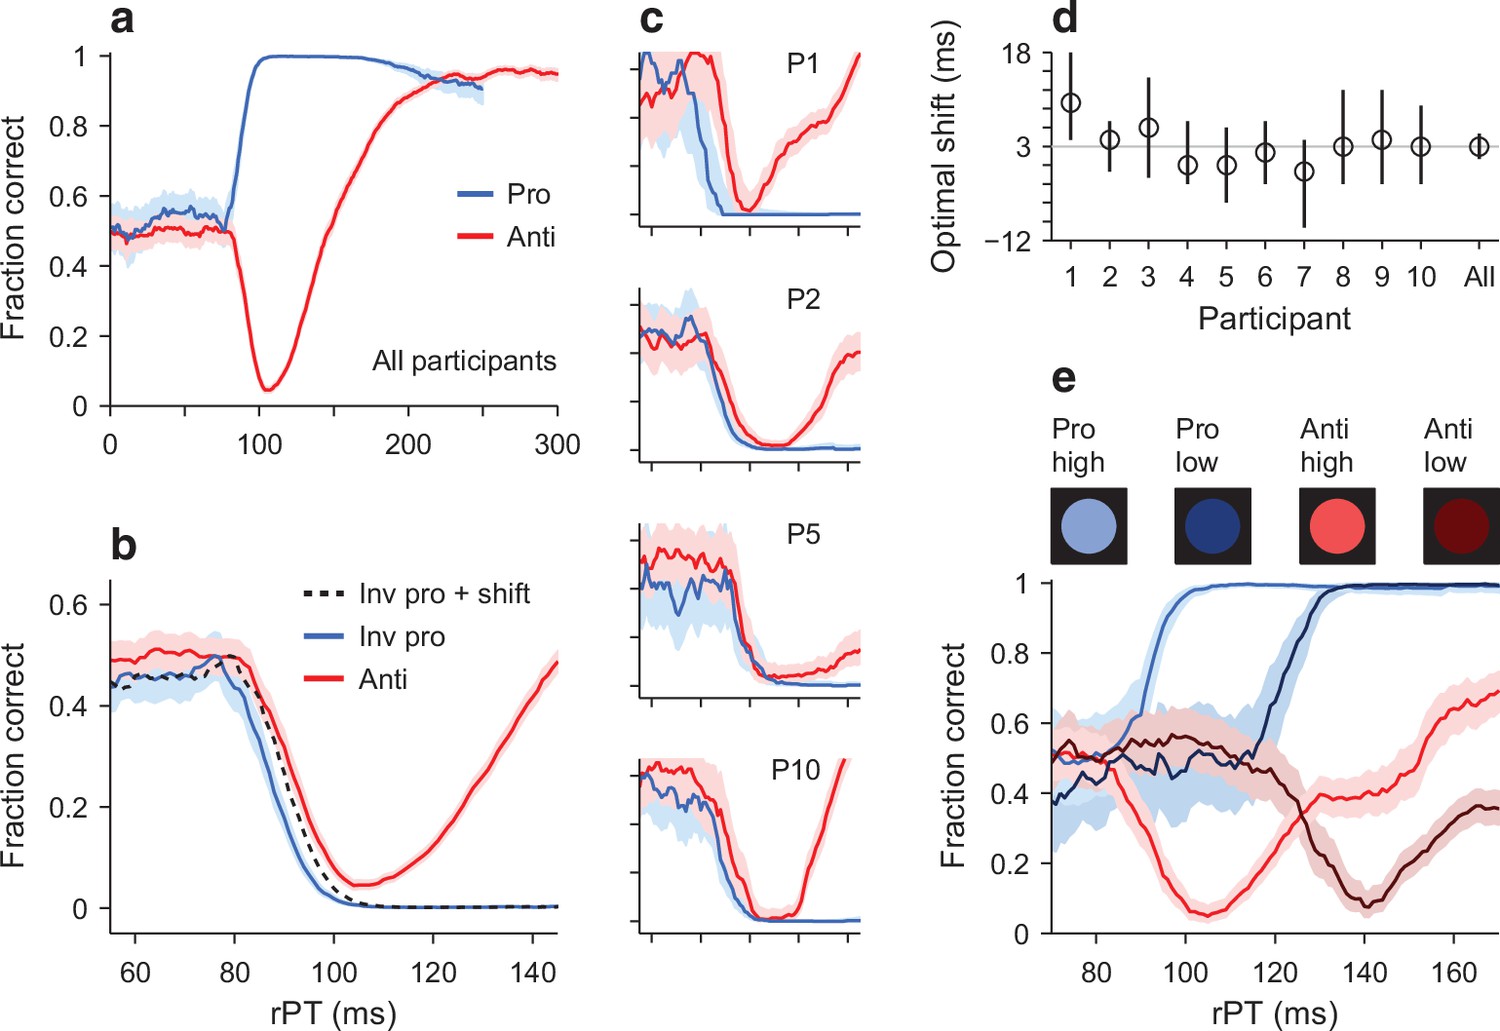
Early departure from chance during pro- and antisaccade performance.
(a) Tachometric curves for pro- (blue trace, 24,638 trials) and antisaccade trials (red trace, 22,608 trials) combined over 10 participants. Shades indicate 95% confidence intervals (CIs) across trials. (b) Same data as in a, but shown over a smaller rPT range and with the prosaccade curve inverted (blue trace) relative to the chance level. The dotted line is the inverted prosaccade curve shifted by 3 ms along the x-axis. (c) Pro- and antisaccade curves for four individual participants. Same x and y axes as in b, and same format. (d) Optimal shift for each participant. The optimal shift (along the rPT axis) minimized the difference between the inverted pro curve and the anti curve for rPTs in the [55, 105] ms interval. The gray line marks the optimal shift (3 ms) for the pooled data in b. Error bars are 95% CIs. (e) Tachometric curves pooled from three participants tested with both the standard high-luminance cues (bright colors) and low-luminance cues (dark colors). The rPT range is truncated to better appreciate the luminance-driven right shift, which is similar for the pro and anti curves (for full range, see Figure 4—figure supplement 3).
Figure 4—figure supplement 1

Performance in blocked versus interleaved trials.
In all panels, colors mark data collected in blocks of same-task trials (green) or in blocks in which pro and anti trials were randomly interleaved (orange). (a) Tachometric curves for prosaccade trials pooled across participants. Data points show the fraction of correct choices for each rPT bin (bin width = 21 ms). Continuous lines are sigmoidal fits. The inset zooms into the rPT range over which performance departs sharply from chance. (b) Curve rise point, which is the rPT at which prosaccade performance is halfway between chance and asymptotic. Bars show values for the pooled tachometric curves in a, with 95% CIs (error bars, from bootstrap). Circles are individual participant data (p = 0.006 for difference between conditions, signed rank test). (c) Fraction correct at the tail of the rPT range (rPT ≥125 ms). Same format as in b. For the individual participant data, p = 0.002 (signed rank test). (d) As in a, but for antisaccade trials. (e) As in b, but for the drop point, which is the rPT at which antisaccade performance is halfway between chance and its minimum value. For the individual participant data, p = 0.2 (signed rank test). (f) As in c, but for antisaccade trials (rPT ≥190 ms). For the individual participant data, p = 0.6 (signed rank test).
Figure 4—figure supplement 2

Perceptual performance is largely invariant with respect to gap value.
Each panel shows several tachometric curves superimposed. Each curve was constructed by selecting, from the complete dataset pooled across participants, only the pro or anti trials with a given gap. Then, for each gap-specific dataset, the fraction of correct responses was calculated for each rPT bin (bin width = 21 ms, with bins shifting every 1 ms), as in other figures. (a) Tachometric curves from antisaccade trials. Colors correspond to gap values (in ms), as indicated by the legend. The continuous gray line is the curve obtained by combining all the data across gaps (same as in Figure 4a, red trace). (b) As in a, but for prosaccade trials. The continuous gray curve is the same as the blue trace in Figure 4a. In general, shorter gaps tend to sample longer rPTs, leading to fewer guesses and noisier results for rPT ≲90 ms. However, although the range of gap values spans nearly 350 ms, the dependence of success on rPT is remarkably consistent; the only noticeable systematic deviation is for gap = 10 ms, for which the conditions are barely within the urgent regime.
Figure 4—figure supplement 3
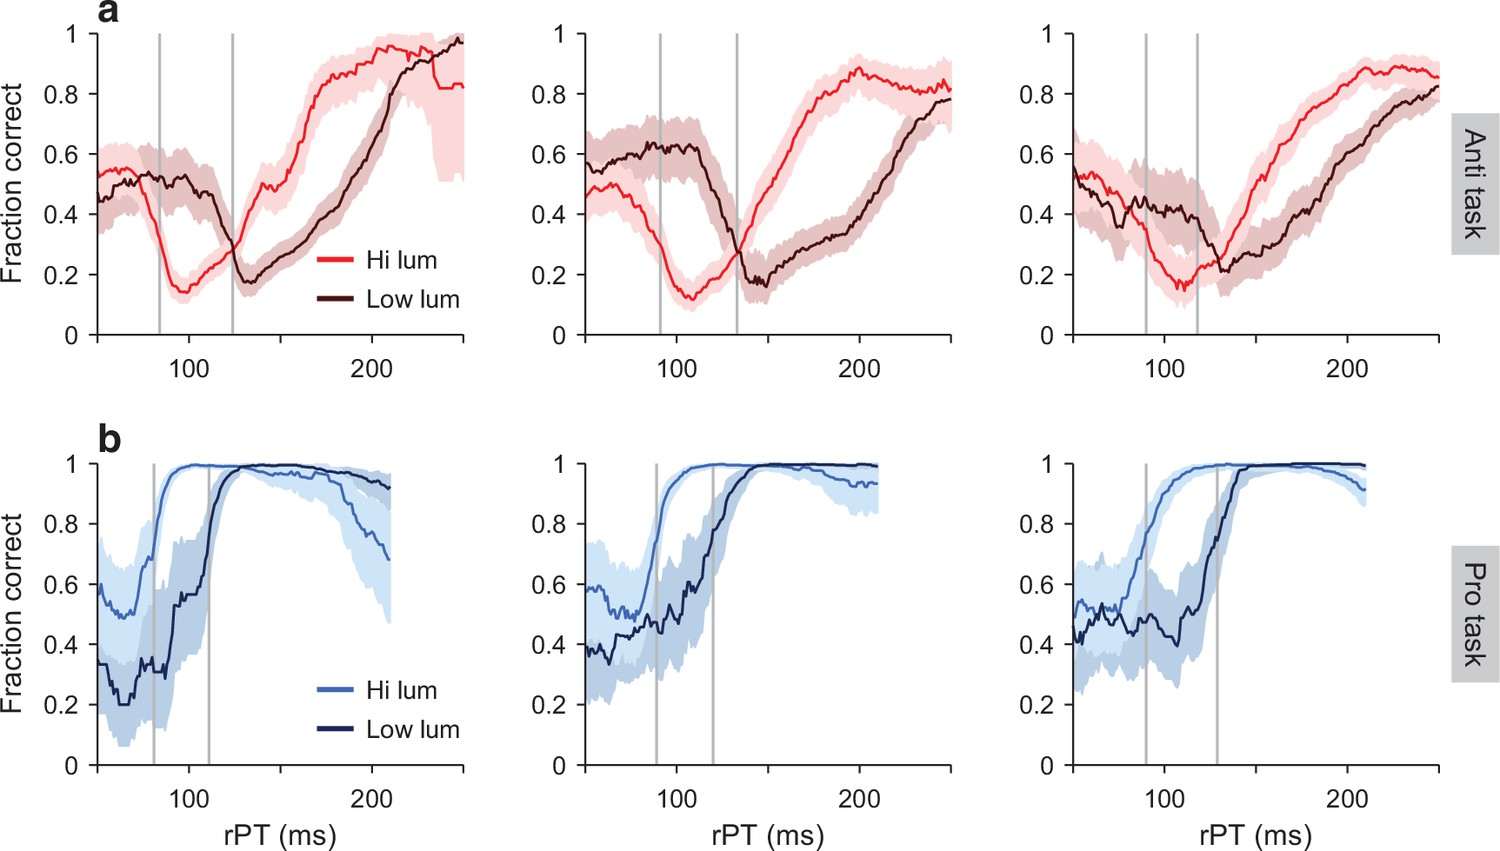
Individual results for the three participants who performed the luminance experiment.
Each column corresponds to one participant. (a) Tachometric curves for antisaccade trials with a high- (bright trace) or a low-luminance cue (dark trace). Shaded error bands indicate 95% CIs from binomial statistics. Vertical gray lines mark the drop points for the two curves. (b) As in a, but for prosaccade trials. Vertical gray lines mark the rise points for the two curves. For this figure, rPT bins of 41 ms were used.
Figure 5 with 1 supplement

Tachometric curves conditioned on target-location history.
Each panel shows choice accuracy as a function of processing time when the target location in a given trial was the same as in previous trials (green curves) or when it was different (magenta curves). Note that the participants’ guesses (rPT ≲80 ms) tended to be toward the previous target location. (a–c) Performance in the compelled antisaccade task conditioned on the history of prior target locations going back 1, 2, or 3 trials (panels a, b, c, respectively). A and B labels stand for left or right target locations, and indicate patterns of repeats (AA, AAA, AAAA) or switches in location (AB, AAB, AAAB) preceding each choice. Shaded error bands indicate 95% CIs across trials. Continuous black curves are fits to the empirical data. Gray vertical shades indicate 95% CIs for the curve rise points. (d–f) As in a–c, but for the compelled prosaccade task. Results are for data pooled across participants.
Figure 5—figure supplement 1
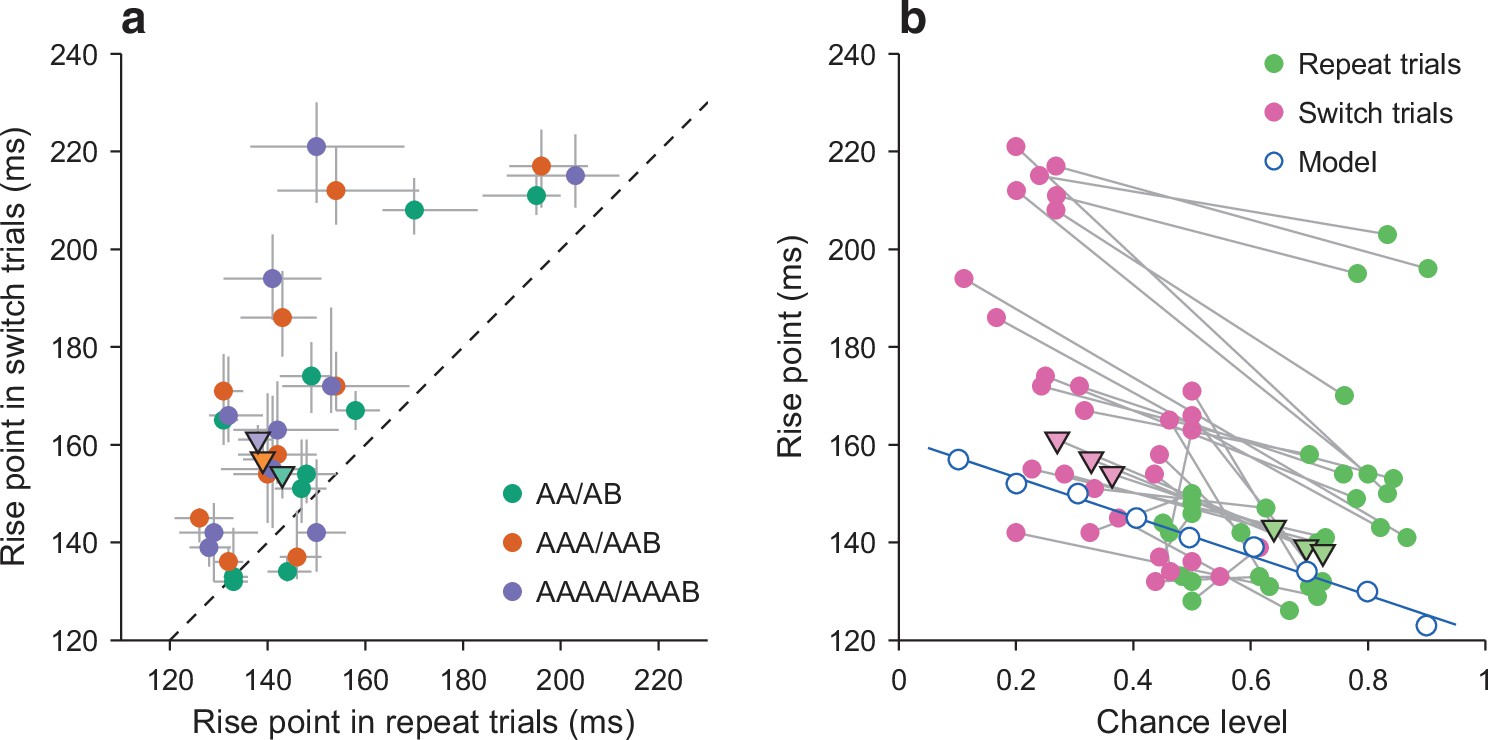
Effect of motor bias on antisaccade performance in individual participants.
(a) Rise point of the tachometric curve for trials in which the target switched locations (y-axis) versus trials in which the target location was repeated (x-axis). Colors indicate results for trial histories going back 1 (green), 2 (orange), or 3 trials (purple). Data points are for individual participants (circles) and for trials pooled across participants (triangles; from the curves in Figure 5a–c). Gray lines indicate 95% CIs from bootstrap. (b) Rise point of the tachometric curve as a function of the chance level of the same curve, which corresponds to the probability correct for guesses (rPT ≲80 ms). Data points are for individual participants (filled circles), for trials pooled across participants (triangles; from the curves in Figure 5a–c), and from simulations of the CAS model (open blue circles; blue line is linear fit to the simulated data points). Each participant contributed three points from repeat trials (magenta) and three points from switch trials (green). Gray lines join data from the same participant in a given history condition (going back 1, 2, or 3 trials). Note that, in spite of the visible individual variability, there is a clear trend across participants for a negative correlation between rise point and chance level that is highly consistent with that predicted by the model.
Figure 6
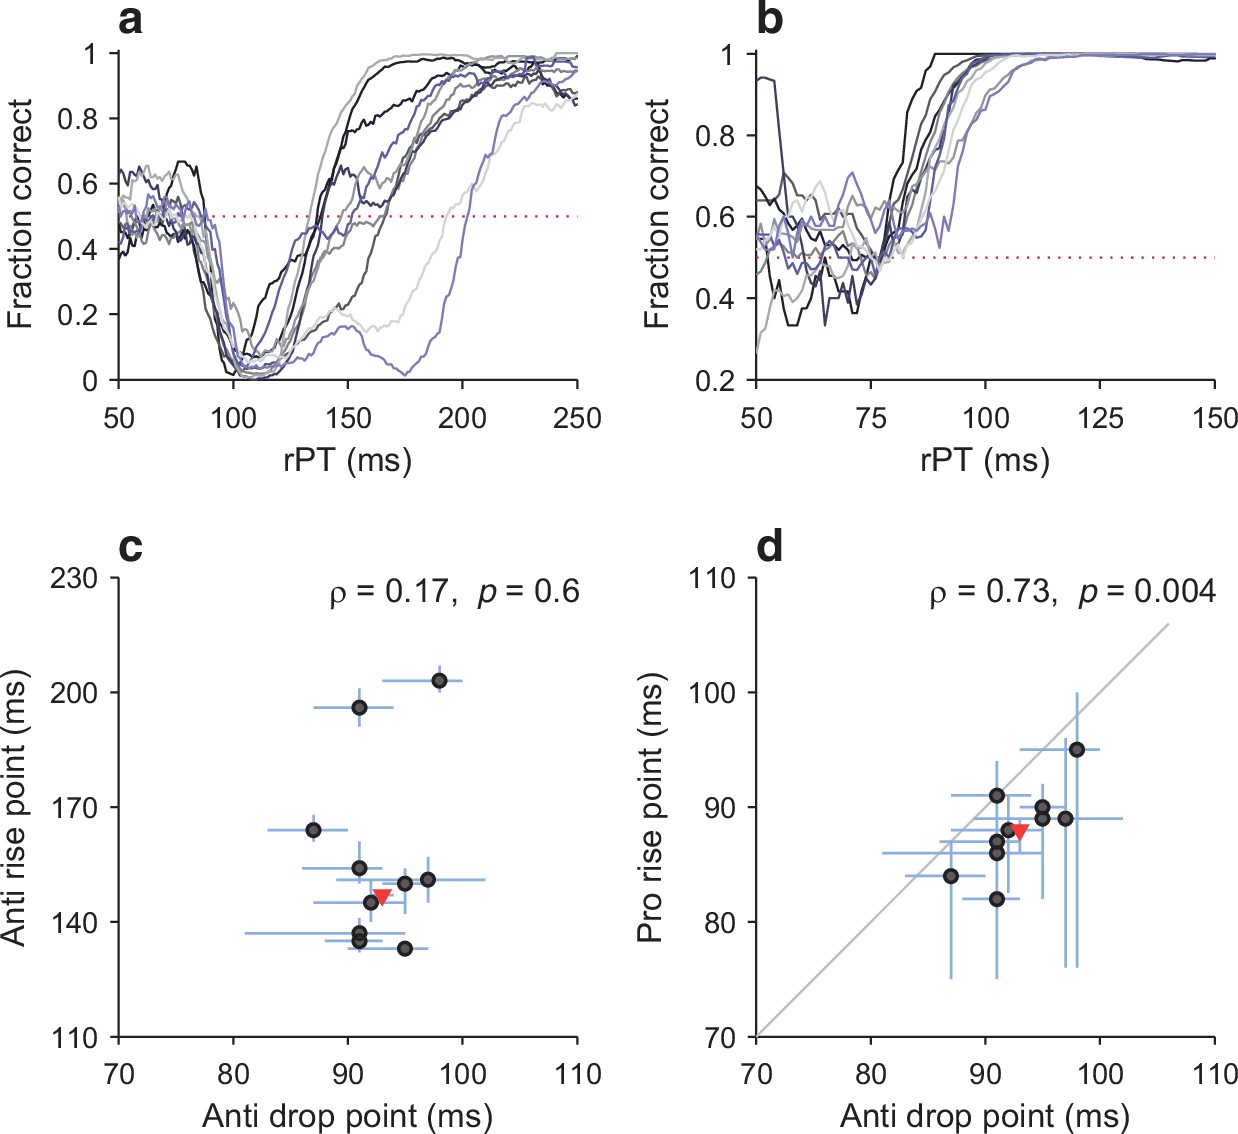
Variations in the timing of exogenous and endogenous modulation across participants.
(a) Tachometric curves in the compelled antisaccade task for all 10 participants. Dotted line indicates chance performance (0.5). (b) As in a, but for the compelled prosaccade task. (c) Comparison between drop point (x-axis; time of early, exogenously driven drop in performance) and rise point (y-axis; time of later, endogenously driven rise in performance) in antisaccade trials. Each circle represents one participant. Lines indicate 95% CIs (from bootstrap). The Pearson correlation of the data (ρ) and its significance (from permutation test) are indicated. The red triangle marks data from the pooled tachometric curve. (d) Comparison between drop point in antisaccade trials (x-axis; time of early, exogenously driven drop in performance) and rise point in prosaccade trials (y-axis; time of early rise in performance). Same format as in c. Note the positive correlation between the early responses in the two tasks.
Additional files
Download links
A two-part list of links to download the article, or parts of the article, in various formats.
Downloads (link to download the article as PDF)
Open citations (links to open the citations from this article in various online reference manager services)
Cite this article (links to download the citations from this article in formats compatible with various reference manager tools)
Exogenous capture accounts for fundamental differences between pro- and antisaccade performance
eLife 11:e76964.
https://doi.org/10.7554/eLife.76964


