Rvb1/Rvb2 proteins couple transcription and translation during glucose starvation
- Division of Biological Sciences, University of California, San Diego, United States
- Department of Chemistry and Biochemistry, University of California San Diego, United States
- Department of Chemical Physiology, The Scripps Research Institute, United States
Figures
Figure 1 with 2 supplements
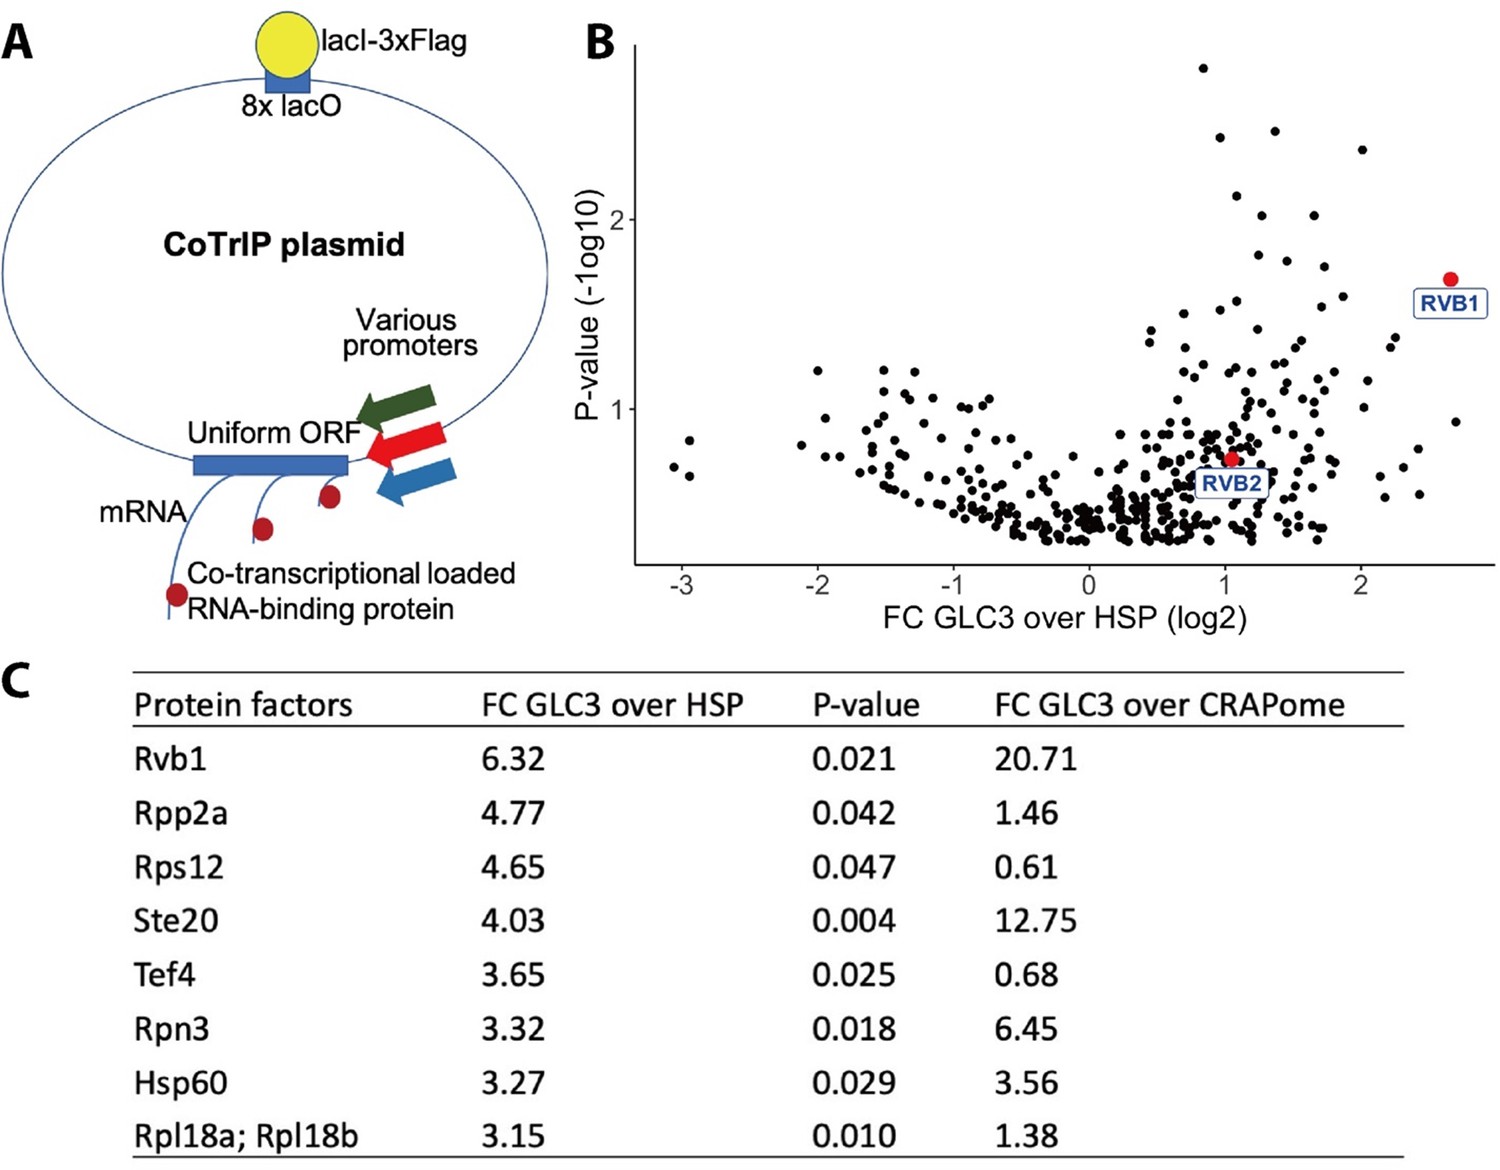
Rvb1/Rvb2 are identified as potential co-transcriptional-loaded protein factors on alternative glucose metabolism genes.
(A) A schematic view of Co-Transcriptional ImmunoPrecipitation (CoTrIP). CoTrIP plasmid has an 8X lacO, a uniform open-reading frame (ORF), and various promoters of interest. CoTrIP plasmid was purified by immunoprecipitation of lacI-3XFlag protein. Enriched protein factors were identified by mass spectrometry. (B) Quantitative volcano plot of co-transcriptional-loaded protein candidates. X-axis: log2 scale of fold change of protein enrichment on two replicates of GLC3 promoter-containing CoTrIP plasmid over on two replicates of HSP30 promoter-containing and one replicate of HSP26 promoter-containing plasmid. Y-axis: minus log10 scale of the p-values from two-sample t-test. Null hypothesis: enrichment on GLC3 promoter equals the enrichment on HSP promoters. Rvb1 and Rvb2 are highlighted in red dots and labeled. (C) Table of protein factors enriched on GLC3 promoters. FC of GLC3 vs. HSP: fold change of protein enrichment on two replicates of GLC3 promoter-containing CoTrIP plasmid over on two replicates of HSP30 promoter-containing and one replicate of HSP26 promoter-containing plasmid. GFPFC of GLC3 vs. CRAPome: fold change of protein enrichment on two replicates of GLC3 promoter-containing CoTrIP plasmid over the CRAPome repository. CRAPome: a contaminant repository for affinity purification–mass spectrometry data. CRAPome was used as a negative control. p-Values were from two-sample t-test of GLC3 vs. HSP. Null hypothesis: enrichment on GLC3 promoter equals the enrichment on HSP promoters. Protein factors were ranked from highest to lowest by ‘FC GLC3 over HSP.’.
-
Figure 1—source data 1
Data of fold change of enrichment on GLC3 over HSP promoters and P-values for enriched proteins.
Rvb1/Rvb2 are identified as potential co-transcriptional-loaded protein factors on alternative glucose metabolism genes. (B) Fold change and p-values for each data point in Figure 1B. (C) Fold change and p-values for each data point with p-value<0.05 in GLC3 vs. HSP comparison.
- https://cdn.elifesciences.org/articles/76965/elife-76965-fig1-data1-v2.zip
Figure 1—figure supplement 1
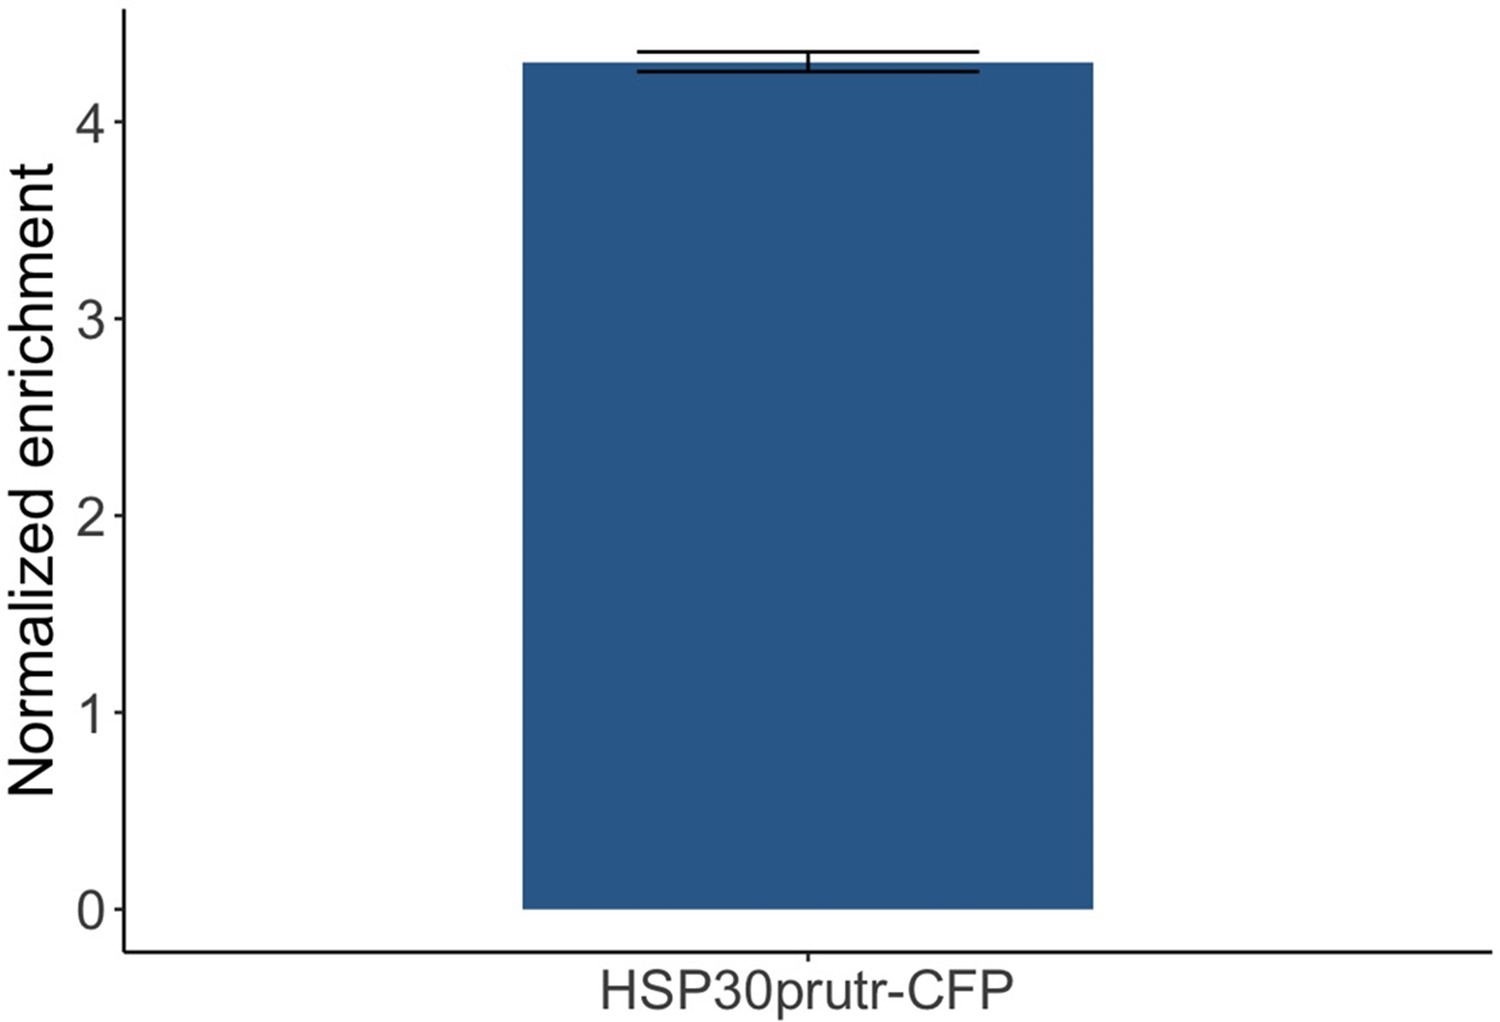
Reporter RNA was enriched upon Co-Transcriptional ImmunoPrecipitation (CoTrIP) plasmid immunoprecipitation.
HSP30 promoter-driven reporter mRNA was tested via RT-qPCR. Y-axis: Ct value of the reporter mRNA was first normalized by the housekeeping gene PDC1 and further normalized by the promoter-less CoTrIP plasmid negative control (n = 3).
-
Figure 1—figure supplement 1—source data 1
Data points of normalized enrichment of reporter mRNA upon Co-Transcriptional ImmunoPrecipitation (CoTrIP).
- https://cdn.elifesciences.org/articles/76965/elife-76965-fig1-figsupp1-data1-v2.zip
Figure 1—figure supplement 2
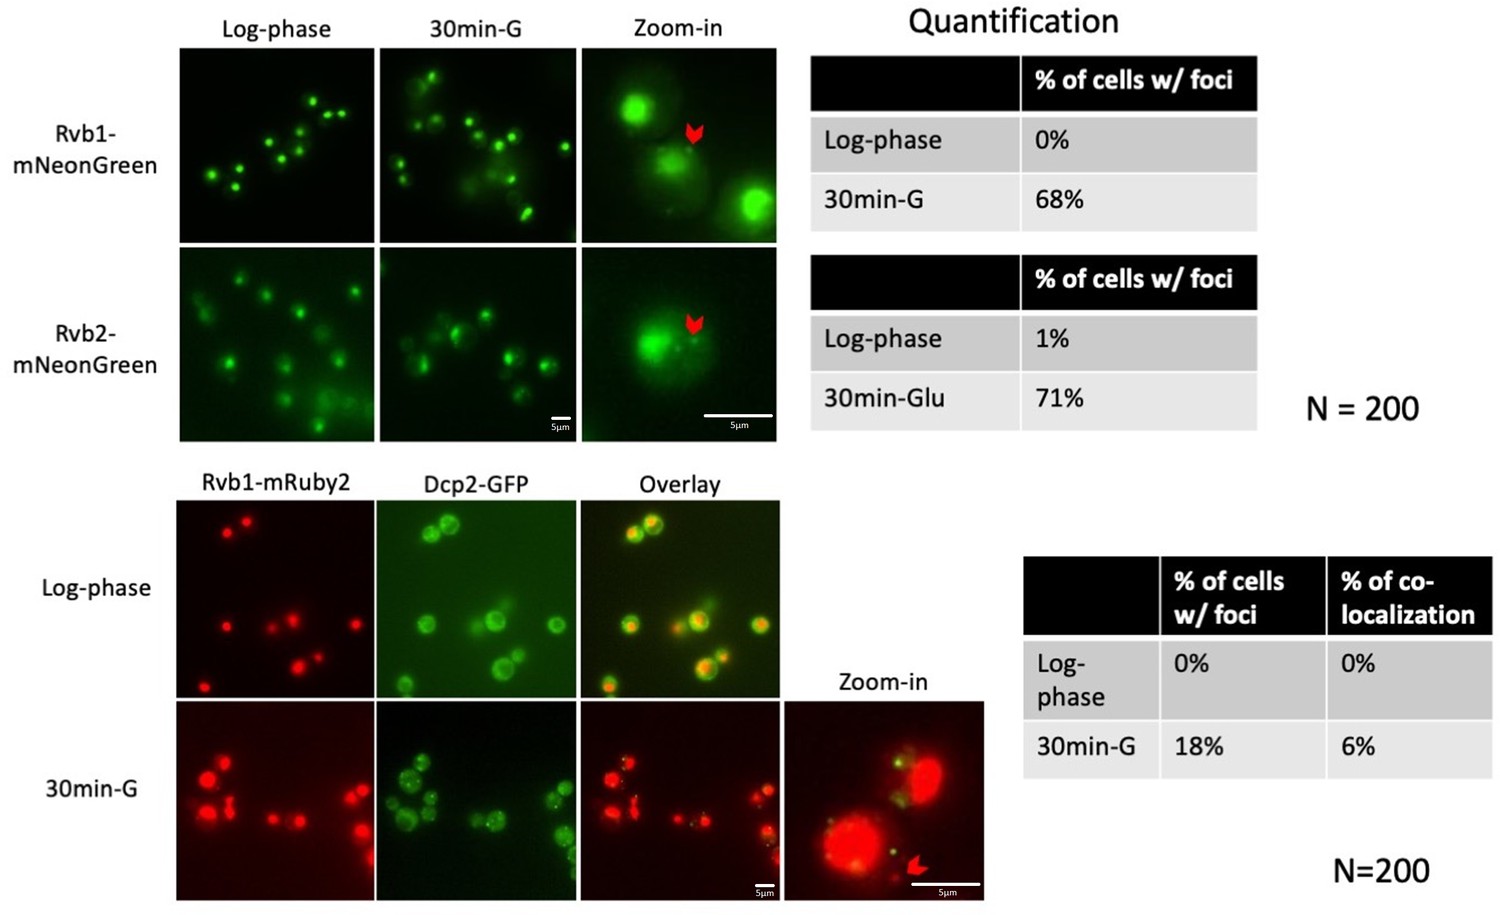
Rvb1/Rvb2 form cytoplasmic granules that are not co-localized with P-body during glucose starvation.
In the upper panel, Rvb1/Rvb2 is C-terminally fused with green fluorescent protein mNeonGreen. In the lower panel, Rvb1/Rvb2 is C-terminally fused with red fluorescent protein mRuby2 and P-body marker Dcp2 is C-terminally fused with GFP. Cells are imaged in both log-phase and 30 min glucose starvation conditions. Quantification was performed on 200 cells in each imaging experiment. % of cells w/ foci: among the cells analyzed, the percentage of cells that have a Rvb-containing foci. % of co-localization: among the cells with the Rvb-containing foci, the percentage of cells that have a co-localized foci with Dcp2-containing foci.
Figure 2 with 1 supplement
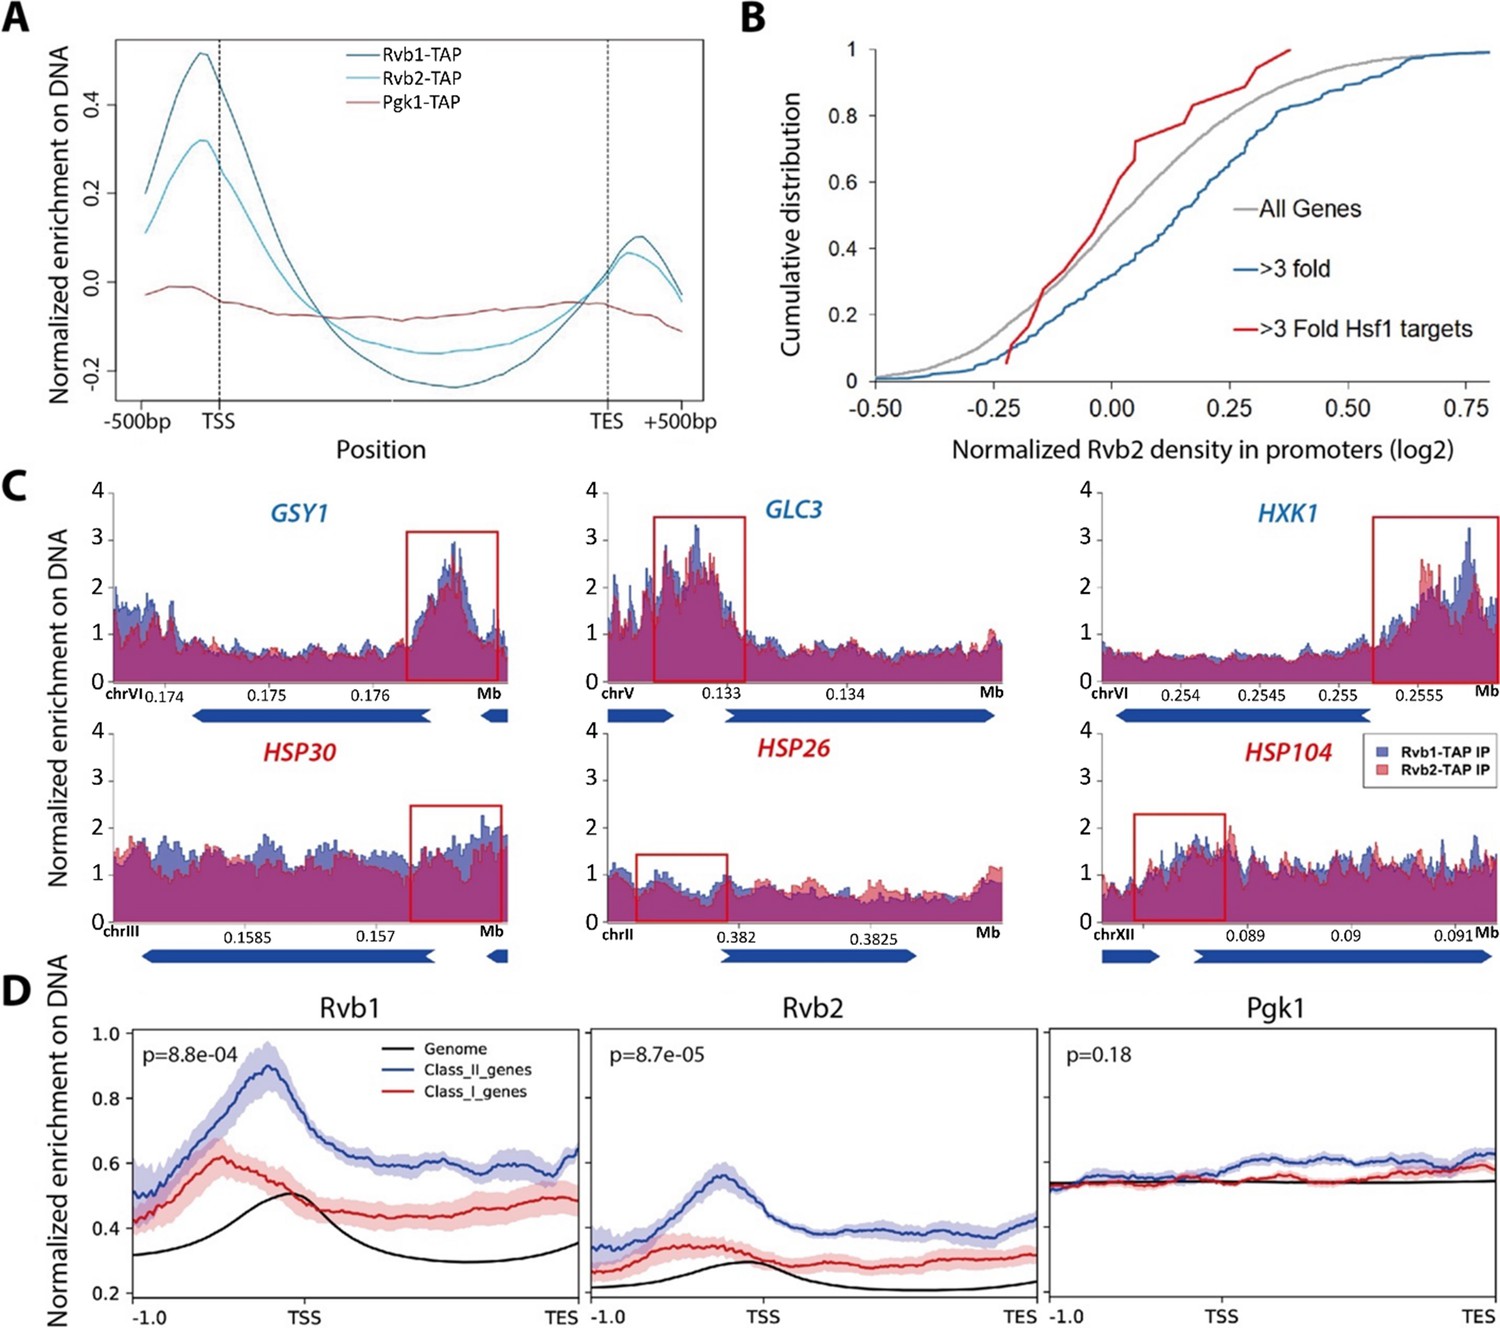
Rvb1/Rvb2 are enriched at the promoters of endogenous alternative glucose metabolism genes.
(A) Rvb1/Rvb2 are enriched on promoters and nascent gene bodies. Chromatin ImmunoPrecipitation sequencing (ChIP-seq) of cells in 10 min glucose starvation. X-axis: normalized scale of all genes containing –500 bp to transcription start site (TSS), TSS to transcription end site (TES) and TES to +500 bp. Y-axis: normalized density of target protein on the loci. Normalized density: RPKM of ChIP over RPKM of input. Input: 1% of the cell lysate. Rvb1/Rvb2/Pgk1 are C-terminally fused with tandem affinity purification (TAP) tag and immunoprecipitated by IgG-conjugating breads. Pgk1: a negative control that considered as noninteractor on the genome. (B) Cumulative distribution of Rvb2’s enrichment on genes. X-axis: log2 scale of Rvb2 ChIP read counts over Pgk1 ChIP read counts from –500 bp to TSS. Y-axis: cumulative distribution. >3-fold: genes that have more than threefold transcriptional induction during 10 min glucose starvation. >3-fold Hsf1 targets: genes that have more than threefold transcriptional induction and are Hsf1-regulated. List of genes is given in the supplementary file. (C) Representative gene tracks showing Rvb1/Rvb2’s enrichment. X-axis: gene track with annotation (in Mb). Arrow’s orientation shows gene’s orientation. Y-axis: normalized density of Rvb1/Rvb2 over Pgk1. Normalized density: RPKM of ChIP over RPKM of input. Class I genes are labeled in red and class II genes are labeled in blue. Promoters are highlighted by red rectangles. (D) Enrichment profile of Rvb1/Rvb2 on class I, II genes and genome. X-axis: normalized scale of genome containing –500 bp to TSS, TSS to TES. Y-axis: RPKM of ChIP over RPKM of input. p-Values are from two-sample t-test. Null hypothesis: normalized density from –500 bp to TSS on class II promoters equals on class I promoters.
-
Figure 2—source data 1
List of class I upregulated and high-ribo genes and class II upregulated and low-ribo genes.
Data from Zid and O’Shea, 2014. Fold change in mRNA levels and in ribosome occupancy after 15 min of glucose starvation from one measurement of BY4741 and one measurement of EY0690. mRNA: log2 mRNA fold change for glucose starvation vs. log-phase glucose-rich. Ribo: log2 ribosome occupancy fold change for glucose starvation vs. log-phase glucose-rich.
- https://cdn.elifesciences.org/articles/76965/elife-76965-fig2-data1-v2.zip
-
Figure 2—source data 2
List of Rvb1/Rvb2 peak calls on the genome.
MACS algorithm was applied from the Chromatin ImmunoPrecipitation sequencing (ChIP-seq) results of Rvb1/Rvb2 in 10 min glucose starvation. Genes are shown under systematic names. FC: fold change of Rvb’s peak versus Pgk1’s peak; FDR: false discovery rate.
- https://cdn.elifesciences.org/articles/76965/elife-76965-fig2-data2-v2.zip
Figure 2—figure supplement 1

Western blot validation of Chromatin ImmunoPrecipitation sequencing (ChIP-seq), and Rvb1 and Rvb2’s enrichment regions are highly overlapped.
(A) Western blot validating the efficiency of the immunoprecipitation (IP). Rvb1/Rvb2 are C-terminally fused with the tandem affinity purification (TAP) tag, labeled as Rvb1-TAP and Rvb2-TAP. The proteins of interest were pulled down by rabbit IgG. Cells are harvested at 10 min glucose starvation. Input is 1% of the total lysate. (B) Full Western blot from (A). (C) Comparison analysis of Rvb1/Rvb2/Pgk1’s enrichment on the genome. X-axis: the enriched regions aligned by the center. Y-axis: regions arranged high to low by the level of overlapping. Color code: red indicates that the two IPs are highly overlapped and blue means not overlapped. Left panel: use Pgk1’s enriched regions as reference, score Rvb1’s enrichment. Middle panel: use Pgk1’s enriched regions as reference, score Rvb2’s enrichment. Right panel: use Rvb2’s enriched regions as reference, score Rvb1’s enrichment.
-
Figure 2—figure supplement 1—source data 1
Rvb1 source data.
MAX algorithm of identified peaks for Rvb1 Chromatin ImmunoPrecipitation (ChIP) enrichment. Rvb2 source data. MAX algorithm of identified peaks for Rvb2 ChIP enrichment.
- https://cdn.elifesciences.org/articles/76965/elife-76965-fig2-figsupp1-data1-v2.zip
Figure 3 with 1 supplement
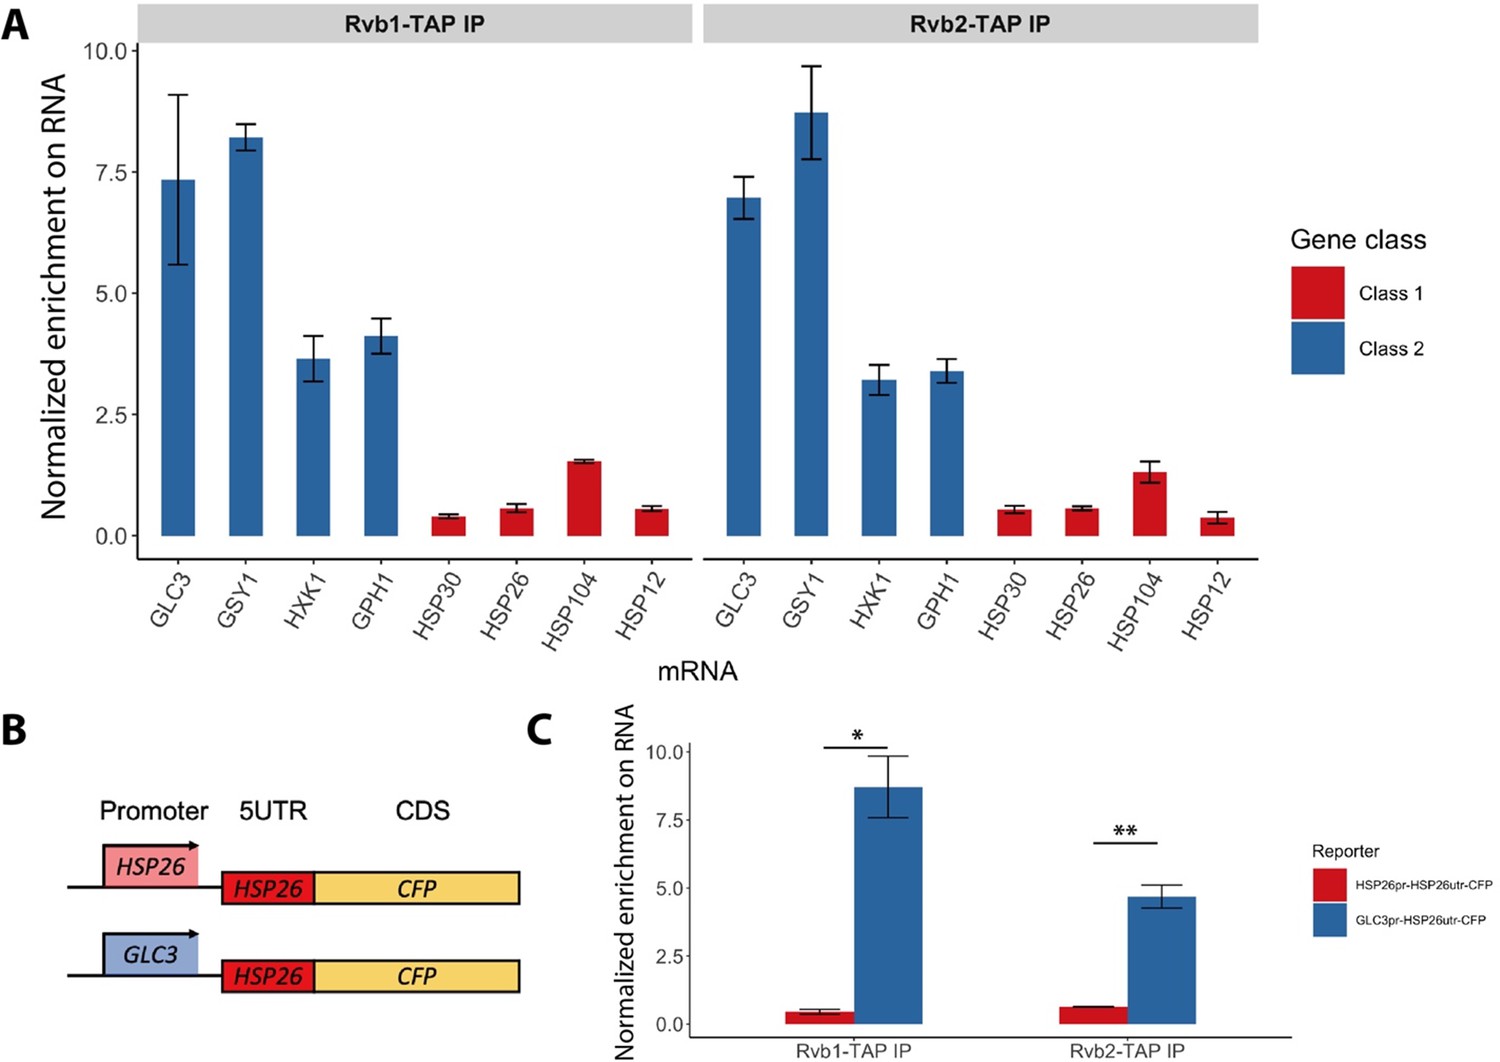
Rvb1/Rvb2 are co-transcriptionally loaded on the alternative glucose metabolism mRNAs.
(A) Rvb1/Rvb2’s enrichment on endogenous mRNAs in 15 min glucose starvation. RNA immunoprecipitation qPCR of cells in 15 min glucose starvation. Error bars are from two biological replicates. X-axis: four class I mRNAs labeled in red and four class II mRNAs in blue. Y-axis: Ct values were firstly normalized by internal control ACT1, then normalized by input control, finally normalized by the wild-type immunoprecipitation control group. Input: 1% of the cell lysate (n = 3). (B) A schematic view of the reporter mRNA only swapping the promoter. 5UTR: 5′ untranslated region; CDS: coding sequence; CFP: cyan fluorescent protein. (C) Rvb1/Rvb2’s enrichment on the reporter CFP mRNAs in 15 min glucose starvation. RNA immunoprecipitation qPCR of cells in 15 min glucose starvation. X-axis: HSP26 promoter-driven reporter mRNA labeled in red and GLC3 promoter-driven mRNA in blue. Y-axis: Ct values were firstly normalized by internal control ACT1, then normalized by input control. Input: 1% of the cell lysate. Standard deviations are from two biological replicates. Statistical significance was assessed by two-sample t-test (*p<0.05, **p<0.01). Null hypothesis: the enrichment on the two reporter mRNAs is equal.
-
Figure 3—source data 1
Data of endogenous mRNA enrichment from Rvb1/Rvb2 pulldown in glucose starvation.
Rvb1/Rvb2 are co-transcriptionally loaded on the alternative glucose metabolism mRNAs. (A) Three replicates of Rvb1/Rvb2 normalized enrichment on each mRNA. (C) Data of mRNA enrichment from Rvb1/Rvb2 pulldown of specified reporter mRNAs.
- https://cdn.elifesciences.org/articles/76965/elife-76965-fig3-data1-v2.zip
Figure 3—figure supplement 1
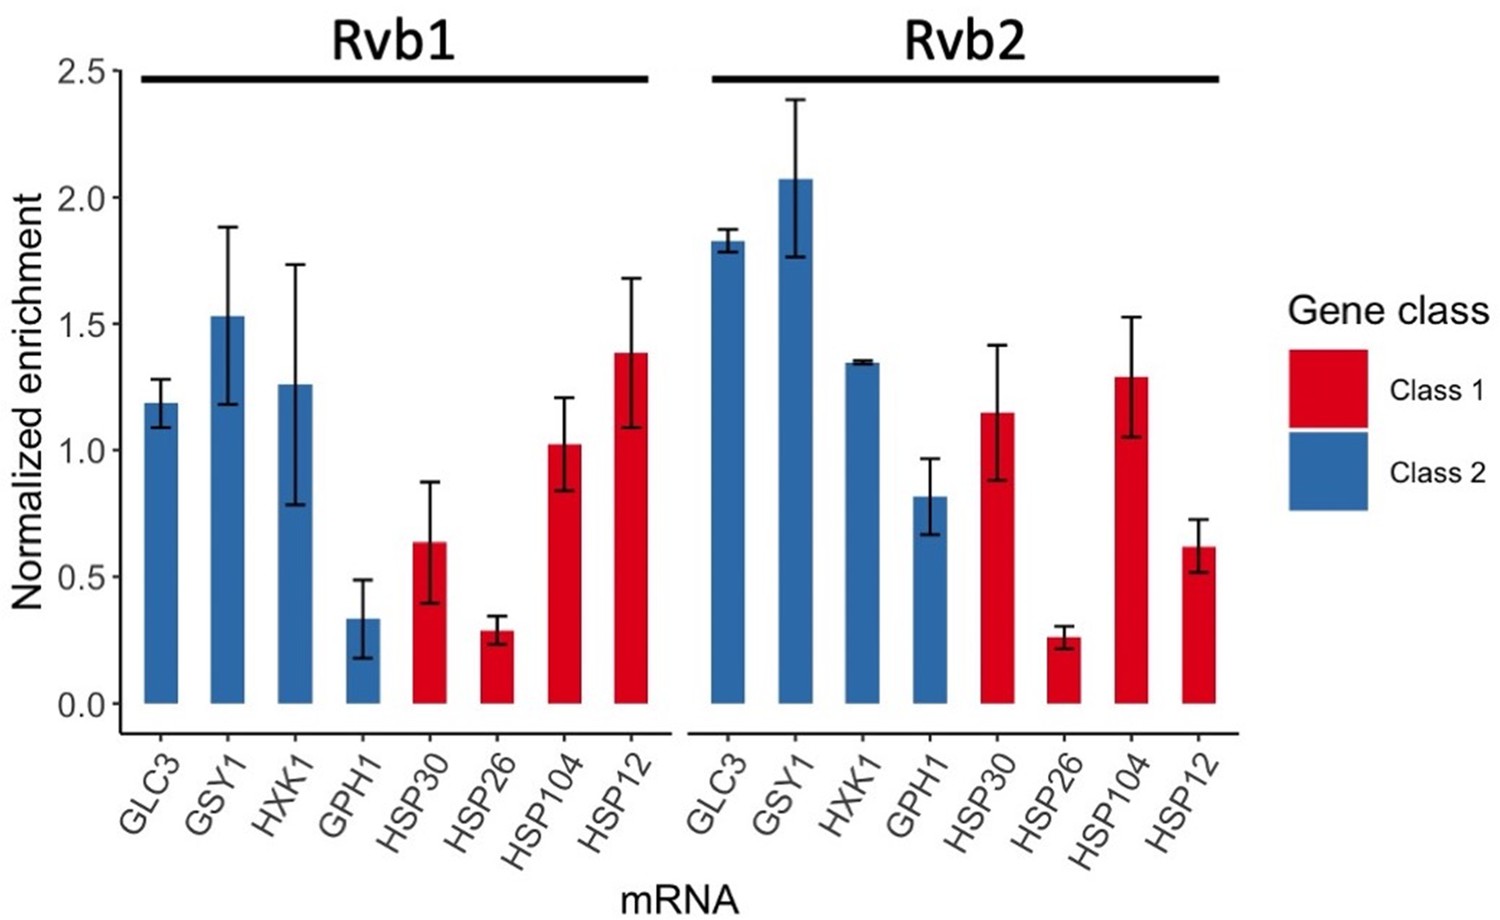
Rvb1/Rvb2 did not show differential enrichment between class I and II mRNAs in glucose-rich log-phase cells.
RNA immunoprecipitation qPCR of cells in log phase. Error bars are from two technical replicates. X-axis: four class I mRNAs labeled in red and four class II mRNAs in blue. Y-axis: Ct values were firstly normalized by internal control ACT1, then normalized by input control, finally normalized by the wild-type immunoprecipitation control group. Input: 1% of the cell lysate.
-
Figure 3—figure supplement 1—source data 1
Data of mRNA enrichment from Rvb1/Rvb2 pulldown on endogenous class I and II mRNAs in glucose-rich log-phase cells.
- https://cdn.elifesciences.org/articles/76965/elife-76965-fig3-figsupp1-data1-v2.zip
Figure 4 with 4 supplements
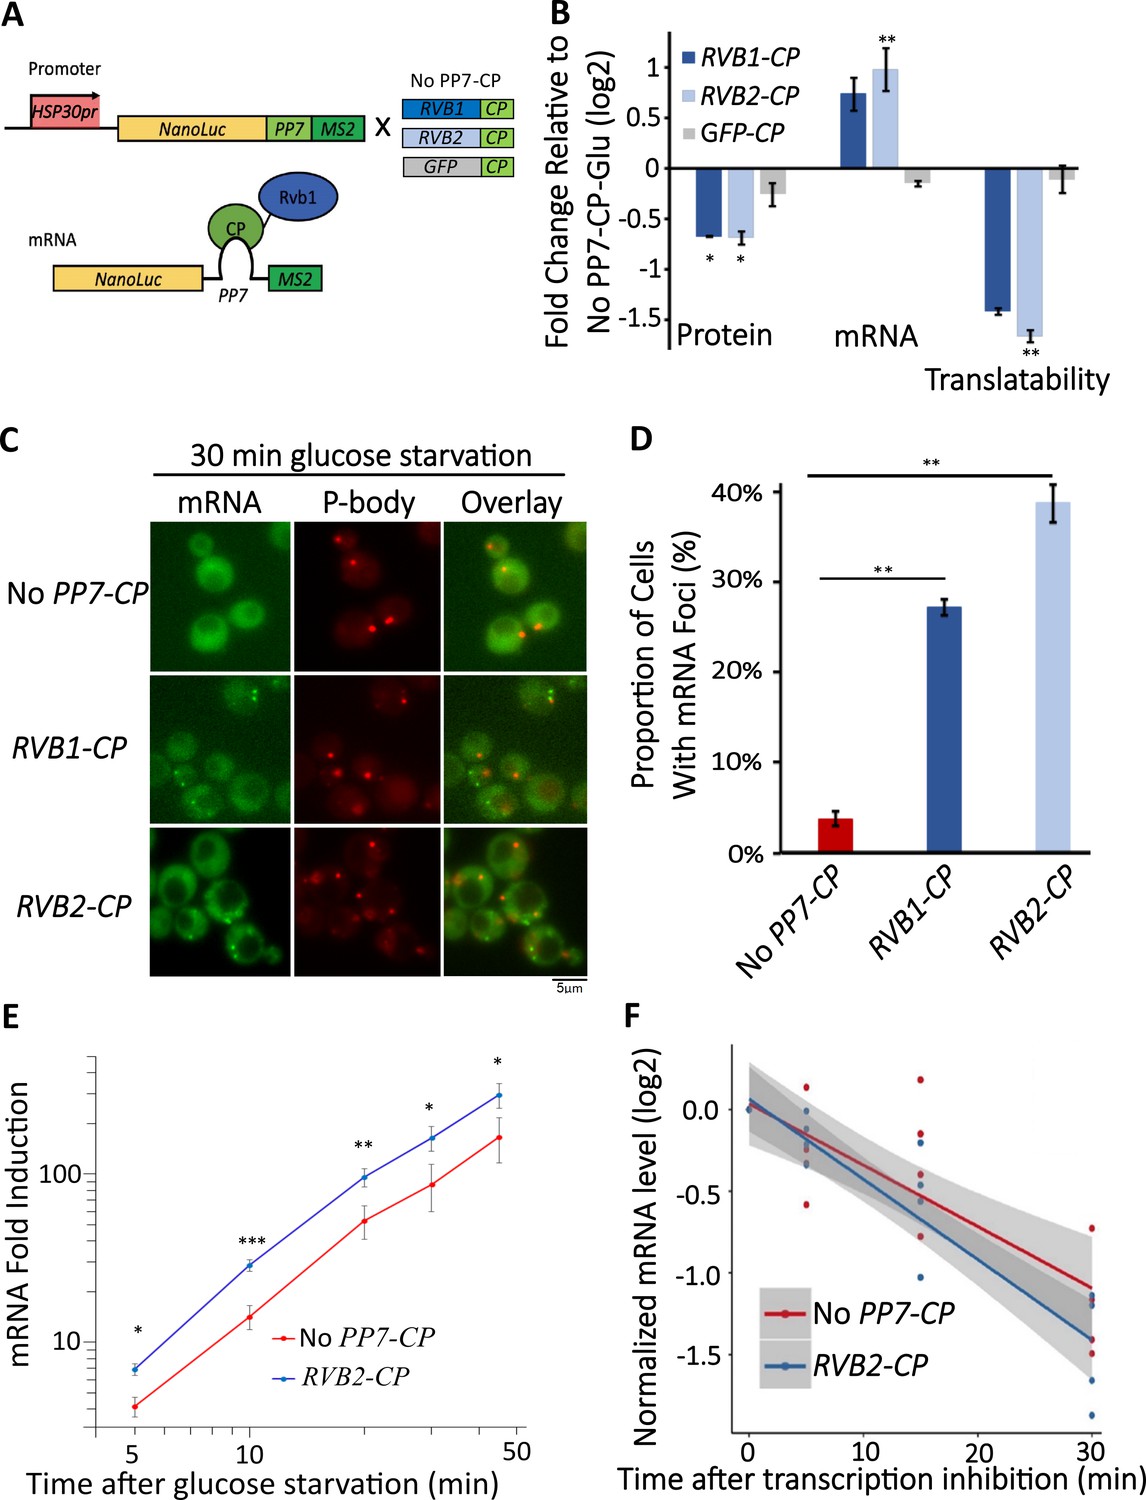
Engineered Rvb1/Rvb2 tethering to mRNAs directs cytoplasmic granular localization and repressed translation.
(A) A schematic view of Rvb-tethering methodology. The reporter mRNA contains an HSP30 promoter, nLuc CDS, PP7 loop sequence, and 12XMS2 sequence. Rvb1, Rvb2, or GFP are C-terminally fused with PP7-coat protein (CP). Upper panel shows cloning strategy and lower panel shows mRNA’s situation upon engineering. (B) Protein, mRNA, and translatability levels of HSP30 promoter-driven reporter mRNA in glucose starvation. Y-axis: nLuc synthesized within 5 min time frame after 25 min glucose starvation. NLuc reading was subtracted by the nLuc reading of cycloheximide added 5 min earlier. mRNA levels of HSP30 promoter-driven reporter mRNA in 15 min glucose starvation relative to No PP7-CP. Initial samples were normalized by the internal control ACT1. Translatability was calculated by subtracting the log2 protein values from mRNA relative to No PP7-CP. No PP7-CP (n = 5), RVB1-CP (n = 2), RVB2-CP (n = 5), and GFP-CP (n = 3). Error bars are SEM from these biological replicates. Statistical significance was assessed by a one-sample t-test to test whether the mean differs from 0 (no change from No PP7-CP) (*p<0.05, **p<0.01). (C) Live imaging showing the subcellular localization of the HSP30 promoter-driven reporter mRNA in 30 min glucose starvation. Reporter mRNA is labeled by the MS2 imaging system. P-body is labeled by marker protein Dcp2. PP7 ctrl: negative control, cells only have the reporter mRNA with PP7 loop. PP7+Rvb1-PCP: Rvb1 is tethered to mRNA. PP7+Rvb2-CP: Rvb2 is tethered to mRNA. (D) quantification of the subcellular localization of the reporter mRNA.Y-axis: percentage of cells that have the reporter mRNA-containing granule foci (n = 200). Error bars are from two biological replicates. Statistical significance was achieved by two-sample t-test. Null hypothesis: the proportion of cells with mRNA foci mRNA of experimental and control groups is equivalent. (E) mRNA fold induction of Rvb2-tethered mRNAs and nontethered mRNAs over time. Reporter mRNA is HSP30 promoter driven. X-axis: time (minute) after glucose is removed. Y-axis: mRNA fold induction compared to pre-stress condition (log scale). n = 4, error bars are the SEM of these four replicates. (F) mRNA decay curve of HSP30 promoter-driven reporter mRNAs. X-axis: after cells were starved for 15 min, time (minute) after stopping the transcription using 1,10-phenanthroline. Y-axis: log2 scale of normalized mRNA levels. Ct values of reporter mRNAs were normalized by the internal control ACT1. Statistical significance was achieved by linear regression modeling. Null hypothesis: the mRNA levels of experimental and control groups are equivalent (*p<0.05, **p<0.01, **p<0.001).
-
Figure 4—source data 1
Data of protein synthesis of Rvb1/Rvb2 tethering to HSP26 promoter-driven reporter mRNA and control mRNAs (non-tethered or GFP-tethered reporter mRNAs).
Engineered Rvb1/Rvb2 tethering to mRNAs directs cytoplasmic granular localization and repressed translation. (B) Protein and mRNA data points from Rvb and GFP tethering to HSP30-nLuc reporter mRNA. (D) Quantification of foci formation in control and Rvb-tethered mRNAs. (E) Data points of mRNA fold induction upon glucose starvation of control and tethered mRNAs. (F) Time course data of mRNA decay for control and tethered mRNAs.
- https://cdn.elifesciences.org/articles/76965/elife-76965-fig4-data1-v2.zip
Figure 4—figure supplement 1
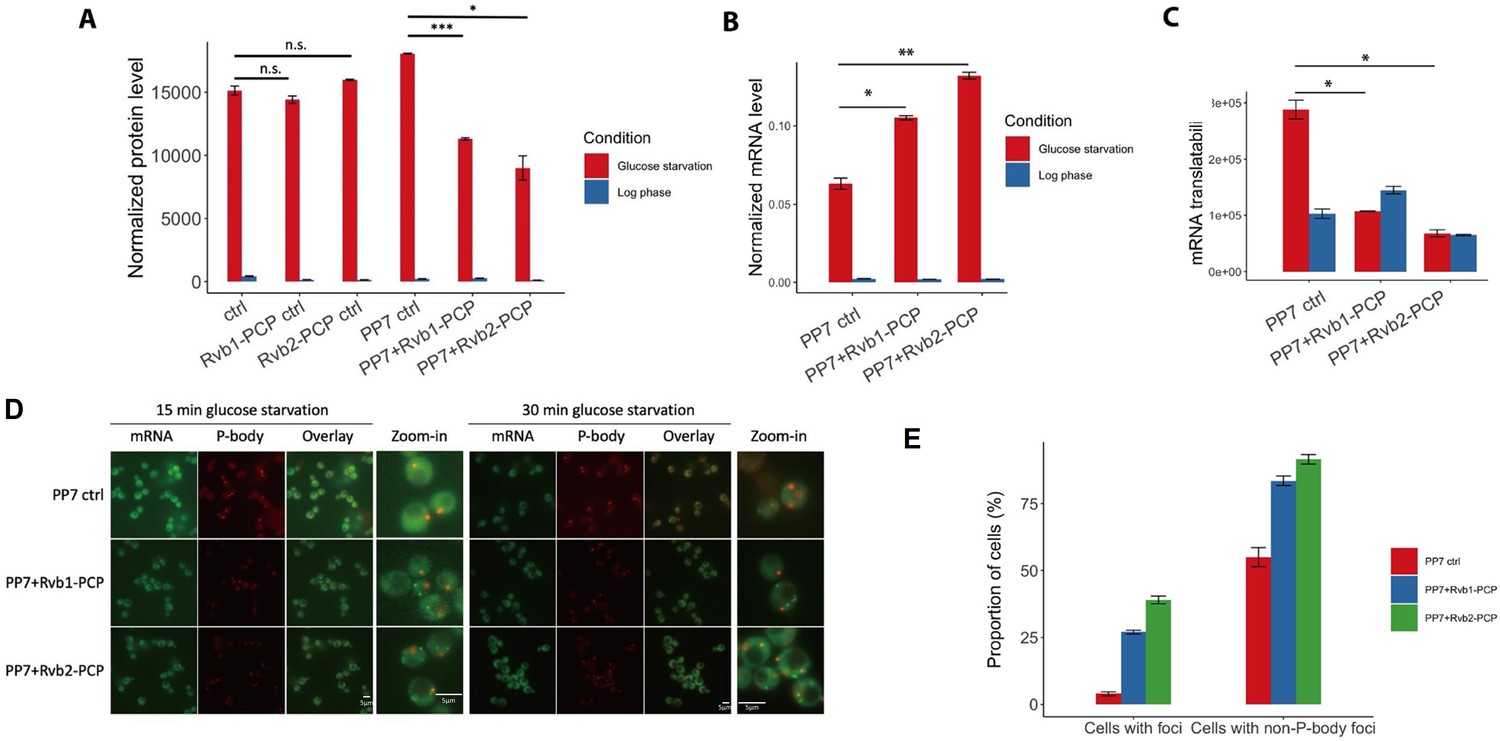
Engineered Rvb1/Rvb2 tethering to HSP30 promoter-driven reporter mRNA directs cytoplasmic granular localization and repressed translation.
(A) protein synthesis of HSP30 promoter-driven reporter mRNA in log phase and 25 min glucose starvation. Y-axis: nLuc synthesized within 5 min time frame. NLuc reading was subtracted by the nLuc reading of cycloheximide added 5 min earlier. X-axis: different Rvb-tethering conditions. Ctrl: negative control, no PP7 and PP7-coat protein. Rvb1-PCP ctrl: negative control, Rvb1 is fused with PP7-coat protein but no reporter mRNA with PP7 loop. Rvb2-PCP ctrl: negative control, Rvb2 is fused with PP7-coat protein but no reporter mRNA with PP7 loop. PP7 ctrl: negative control, cells only have the reporter mRNA with PP7 loop. PP7+Rvb1-PCP: Rvb1 is tethered to mRNA. PP7+Rvb2-PCP: Rvb2 is tethered to mRNA. Log phase is labeled in blue and glucose starvation in red. Error bars are from two biological replicates. Statistical significance was assessed by two-sample t-test. Null hypothesis: experimental groups and control groups have equivalent results (*p<0.05, **p<0.01, ***p<0.001). (B) Protein synthesis of HSP30 promoter-driven reporter mRNA in log phase and 25 min glucose starvation. Y-axis: nanoluciferase synthesized within 5 min time frame. Nanoluciferase reading was subtracted by the nanoluciferase reading of cycloheximide added 5 min earlier. (C) mRNA levels of HSP30 promoter-driven reporter mRNA in log phase and 15 min glucose starvation. Y-axis: Ct values of reporter mRNAs were normalized by the internal control ACT1. (D) Live imaging showing the subcellular localization of the HSP30 promoter-driven reporter mRNA in 15 min and 30 min glucose starvation. Reporter mRNA is labeled by the MS2 imaging system. P-body is labeled by marker protein Dcp2. PP7 ctrl: negative control, cells only have the reporter mRNA with PP7 loop. PP7+Rvb1-PCP: Rvb1 is tethered to mRNA. PP7+Rvb2-CP: Rvb2 is tethered to mRNA. (E) Quantification of the subcellular localization of the reporter mRNA in 30 min glucose starvation. Cells with foci: percentage of cells that have the reporter mRNA-containing granule foci. Cells with non-P-body foci: among the cells that have the reporter mRNA-containing granule foci, the percentage of cells that have reporter mRNA-containing granule foci that are not co-localized with P-body. N = 200. Error bars are from two biological replicates.
-
Figure 4—figure supplement 1—source data 1
Data of protein synthesis of Rvb1/Rvb2 tethering to HSP30 promoter-driven reporter mRNA and control mRNAs.
Engineered Rvb1/Rvb2 tethering to HSP30 promoter-driven reporter mRNA directs cytoplasmic granular localization and repressed translation. (A) Protein quantification of control and Rvb1 and Rvb2 tethered mRNAs to HSP30-nLuc reporter.
- https://cdn.elifesciences.org/articles/76965/elife-76965-fig4-figsupp1-data1-v2.zip
Figure 4—figure supplement 2

Engineered Rvb1/Rvb2 tethering to HSP26 promoter-driven reporter mRNA directs cytoplasmic granular localization and repressed translation.
(A) Protein synthesis of HSP26 promoter-driven reporter mRNA in log phase and 25 min glucose starvation. Y-axis: nLuc synthesized within 5 min time frame. NLuc reading was subtracted by the nLuc reading of cycloheximide added 5 min earlier. (B) mRNA levels of HSP26 promoter-driven reporter mRNA in log phase and 15 min glucose starvation. Y-axis: Ct values of reporter mRNAs were normalized by the internal control ACT1. (C) Translatability of HSP26 promoter-driven reporter mRNA in log phase and 15 min glucose starvation. mRNA translatability: normalized protein level over normalized mRNA level. (A–C) Log phase is labeled in blue and glucose starvation in red. Error bars are from two biological replicates. Ctrl: negative control, no PP7 and PP7-coat protein. Rvb1-PCP ctrl: negative control, Rvb1 is fused with PP7-coat protein but no reporter mRNA with PP7 loop. Rvb2-PCP ctrl: negative control, Rvb2 is fused with PP7-coat protein but no reporter mRNA with PP7 loop. PP7 ctrl: negative control, cells only have the reporter mRNA with PP7 loop. PP7+Rvb1-PCP: Rvb1 is tethered to mRNA. PP7+Rvb2-PCP: Rvb2 is tethered to mRNA. (D) Live imaging showing the subcellular localization of the HSP26 promoter-driven reporter mRNA in 15 min and 30 min glucose starvation. Reporter mRNA is labeled by the MS2 imaging system. P-body is labeled by marker protein Dcp2. PP7 ctrl: negative control, cells only have the reporter mRNA with PP7 loop. PP7+Rvb1-PCP: Rvb1 is tethered to mRNA. PP7+Rvb2-CP: Rvb2 is tethered to mRNA. (E) Quantification of the subcellular localization of the reporter mRNA in 30 min glucose starvation. Cells with foci: percentage of cells that have the reporter mRNA-containing granule foci. Cells with non-P-body foci: among the cells that have the reporter mRNA-containing granule foci, the percentage of cells that have reporter mRNA-containing granule foci that are not co-localized with P-body. N = 200. Error bars are from two biological replicates.
-
Figure 4—figure supplement 2—source data 1
Data of protein synthesis of Rvb1/Rvb2 tethering to HSP26 promoter-driven reporter mRNA and control mRNAs.
Engineered Rvb1/Rvb2 tethering to HSP26 promoter-driven reporter mRNA directs cytoplasmic granular localization and repressed translation. (A) Protein quantification of control and Rvb1 and Rvb2 tethered mRNAs to HSP26-nLuc reporter. (B) mRNA quantification of control and Rvb1 and Rvb2 tethered mRNAs to HSP26-nLuc reporter. (C) Translatability of control and Rvb1 and Rvb2 tethered mRNAs to HSP26-nLuc reporter. (E) Quantification of foci formation of control and Rvb1 and Rvb2 tethered mRNAs to HSP26-nLuc reporter.
- https://cdn.elifesciences.org/articles/76965/elife-76965-fig4-figsupp2-data1-v2.zip
Figure 4—figure supplement 3
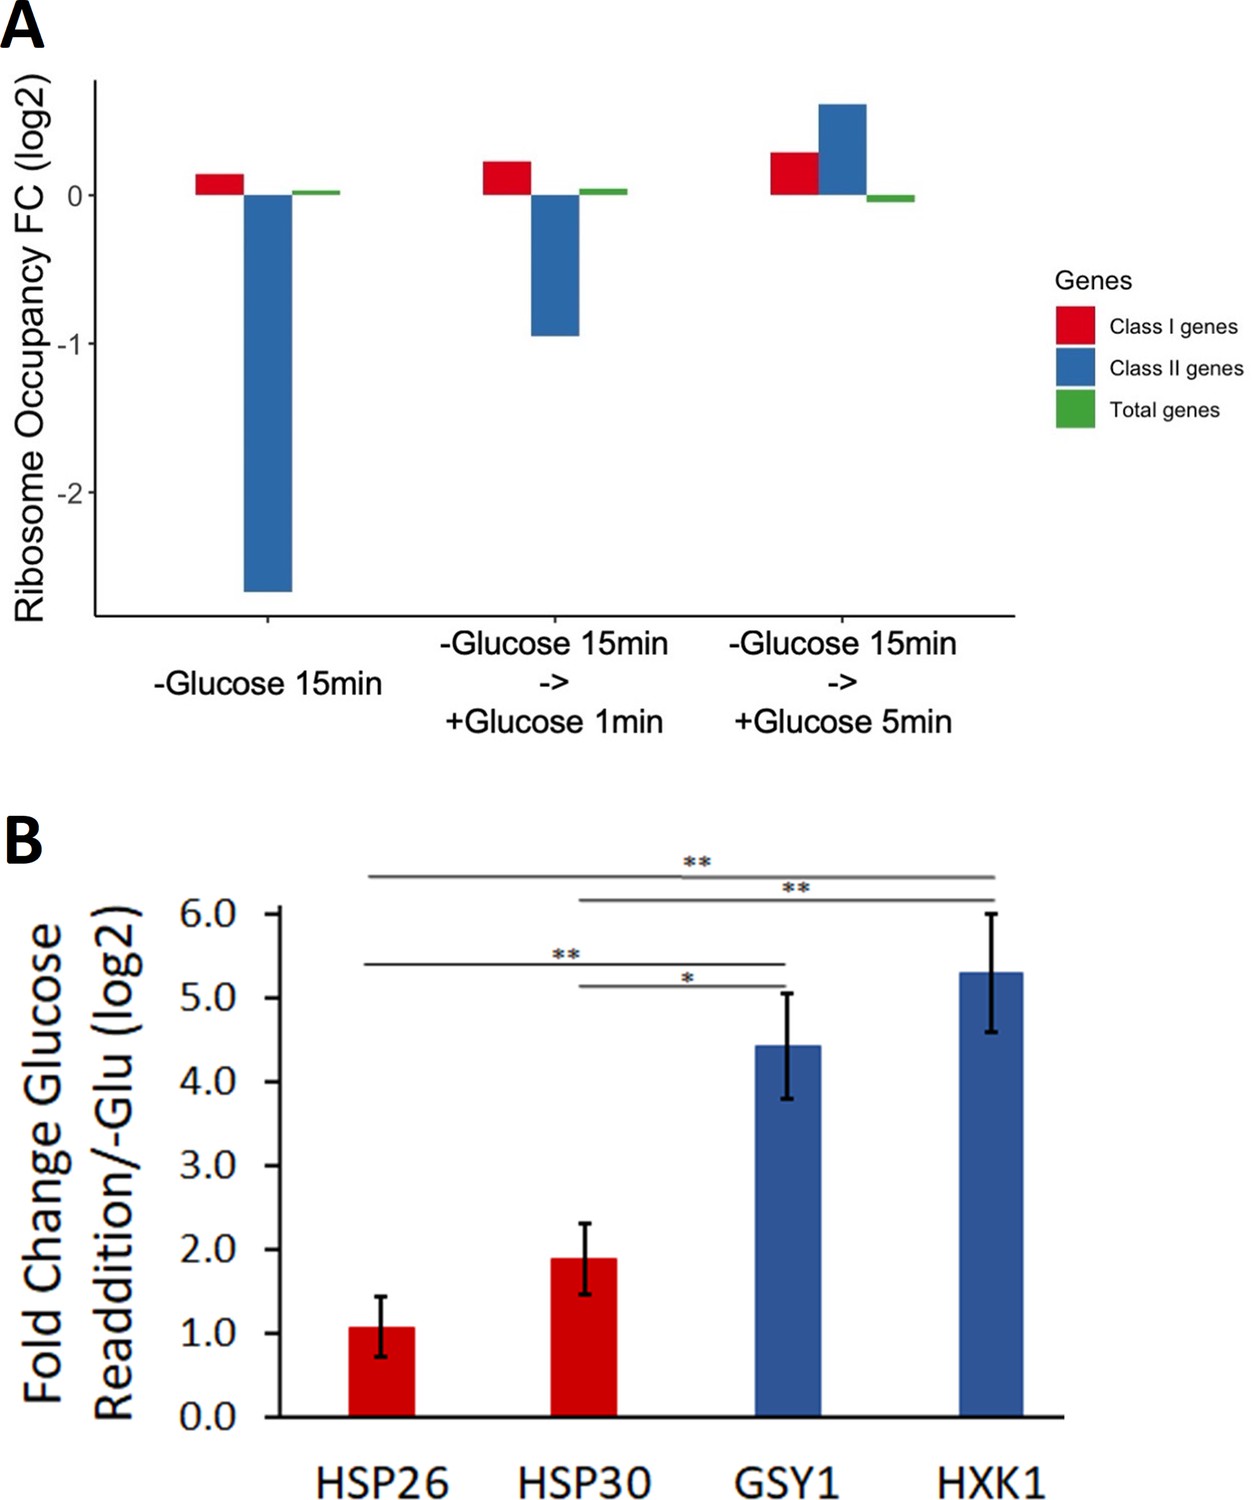
Ribosome occupancy and protein synthesis of endogenous glucose metabolism mRNAs were quickly induced after glucose replenishment.
(A) Ribosome profiling was performed on cells in 15 min glucose starvation and followed by 1 min and 5 min glucose addback. Y-axis: log2 scale of ribosome occupancy fold changes on mRNAs compared to log-phase condition. X-axis: each bar represents a gene group. Bars are grouped by conditions. Class I genes and class II genes refer to Figure 2—source data 1. (B) Endogenous class I and II genes were tagged with nLuc. Luciferase expression was measured after 30 min glucose starvation and 10 min after 2% glucose was readded to cultures starved of glucose for 30 min. Statistical significance was tested by two-sample t-test (n = 3) (*p<0.05, **p<0.01).
-
Figure 4—figure supplement 3—source data 1
Data of ribosome occupancy of mRNAs in glucose starvation and in glucose replenishment.
Ribosome occupancy and protein synthesis of endogenous glucose metabolism mRNAs were quickly induced after glucose replenishment. (A) Data points of ribosome occupancy of total genes, class I, and class II mRNAs during glucose starvation and upon glucose readdition. (B) Luciferase quantification during glucose starvation and 10 min after glucose readdition for class I and II mRNAs.
- https://cdn.elifesciences.org/articles/76965/elife-76965-fig4-figsupp3-data1-v2.zip
Figure 4—figure supplement 4
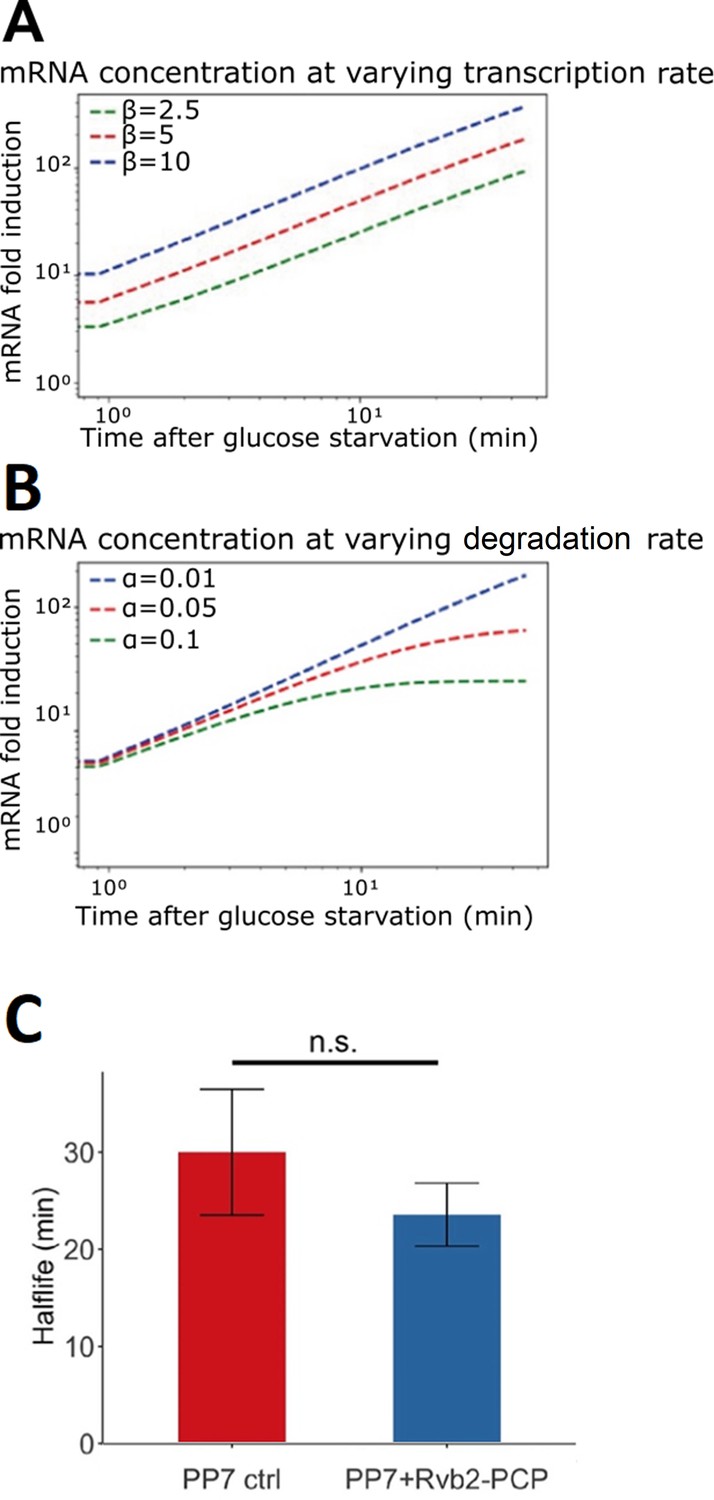
Engineered Rvb1/Rvb2 binding to mRNAs increases the transcription of corresponding genes.
(A, B) Mathematical modeling on mRNA abundance upon varied transcription rates and varied mRNA degradation rates. X-axis: time (minute) after glucose is removed. Y-axis: mRNA fold induction compared to pre-stress condition. Modeling function: ∆X(t) = (β/α −X0)(1−e−αt), dX/dt = β −αX. α/a denotes the degradation rate constant. mRNA is produced at a constant rate (β/b). mRNA concentration is (X). (A) Varying β – transcription rate. (B) Varying α – mRNA degradation rates. (C) Half-lives of HSP30 promoter-driven reporter mRNAs. Error bars are from four biological replicates. Statistical significance was achieved by two-sample t-test. Null hypothesis: the mRNA half-lives of experimental and control groups are equivalent.
-
Figure 4—figure supplement 4—source data 1
Data of halflife measurements of Rvb2 tethering to HSP30 promoter-driven reporter mRNA and control mRNA.
Engineered Rvb1/Rvb2 binding to mRNAs increases the transcription of corresponding genes. (C) mRNA half-lives for PP7 ctrl and Rvb2 tethered HSP30-nLuc reporter mRNAs.
- https://cdn.elifesciences.org/articles/76965/elife-76965-fig4-figsupp4-data1-v2.zip
Figure 5 with 1 supplement
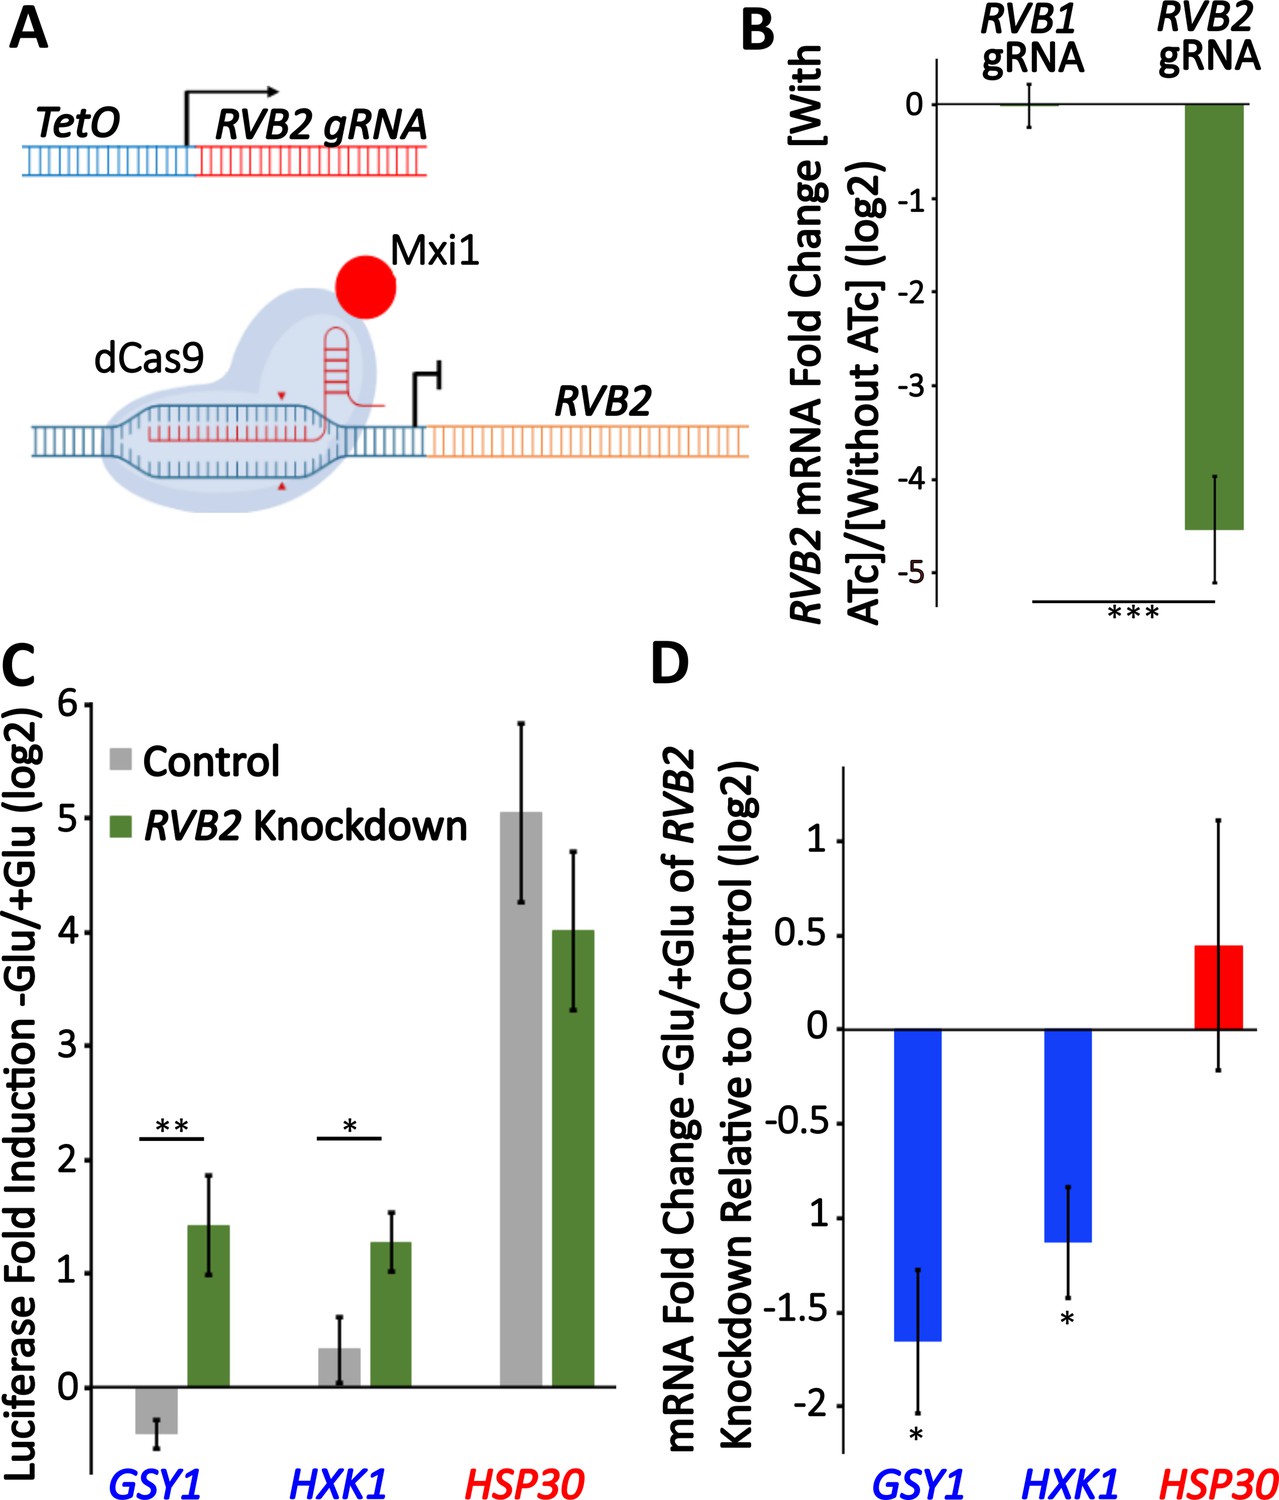
Knockdown of RVB2 drives enhances protein production of Rvb target genes during glucose starvation.
(A) A schematic view of CRISPRi repression of RVB2 transcription. The RVB2 gRNA was placed under the control of a TetOn promoter. Upon anhydrotetracycline (ATc) treatment, this induces RVB2 gRNA expression, targeting dCas9-MXi to the upstream region of RVB2 and repressing transcription. (B–D) RVB2 knockdown was accomplished by inoculating log-phase cultures with 250 ng/L ATc for 8 hr. Control cells have no ATc. (B) mRNA levels of RVB2 and ACT1 were determined in log-phase cultures expressing either an RVB1 or RVB2 gRNA. RVB2 mRNA levels were normalized to ACT1. Statistical significance was achieved by two-sample t-test. RVB1 gRNA (n = 2); RVB2 gRNA (n = 5). (C) Endogenous genes were tagged with nLuc and luciferase was quantified during log-phase growth and 30 min after glucose starvation in ±ATc cultures. Statistical significance was achieved by two-sample t-test (GSY1, HXK1 n = 4, HSP30 n = 3). (D) mRNA levels of the genes of interest were tested in log phase and 30 min of glucose starvation ±ATc. The log2 fold change -Glu/+Glu in the RVB2 knockdown was subtracted from the control mRNA fold change. Statistical significance was assessed by a one-sample t-test to test whether the mean fold change differs from 0 (no change from -ATc control) (GSY1, HXK1 n = 4, HSP30 n = 3) (*p<0.05, **p<0.01, **p<0.001).
-
Figure 5—source data 1
Data of induction of RVB2 mRNA level with RVB1 and RVB2 gRNA, respectively.
Knockdown of RVB2 drives enhances protein production of Rvb target genes during glucose starvation. (B) Fold change data points of RVB2 mRNA level with RVB1 and RVB2 gRNAs. (C) Luciferase measurements upon RVB2 depletion in glucose and glucose starvation conditions. (D) mRNA measurements upon RVB2 depletion in glucose and glucose starvation conditions.
- https://cdn.elifesciences.org/articles/76965/elife-76965-fig5-data1-v2.zip
Figure 5—figure supplement 1
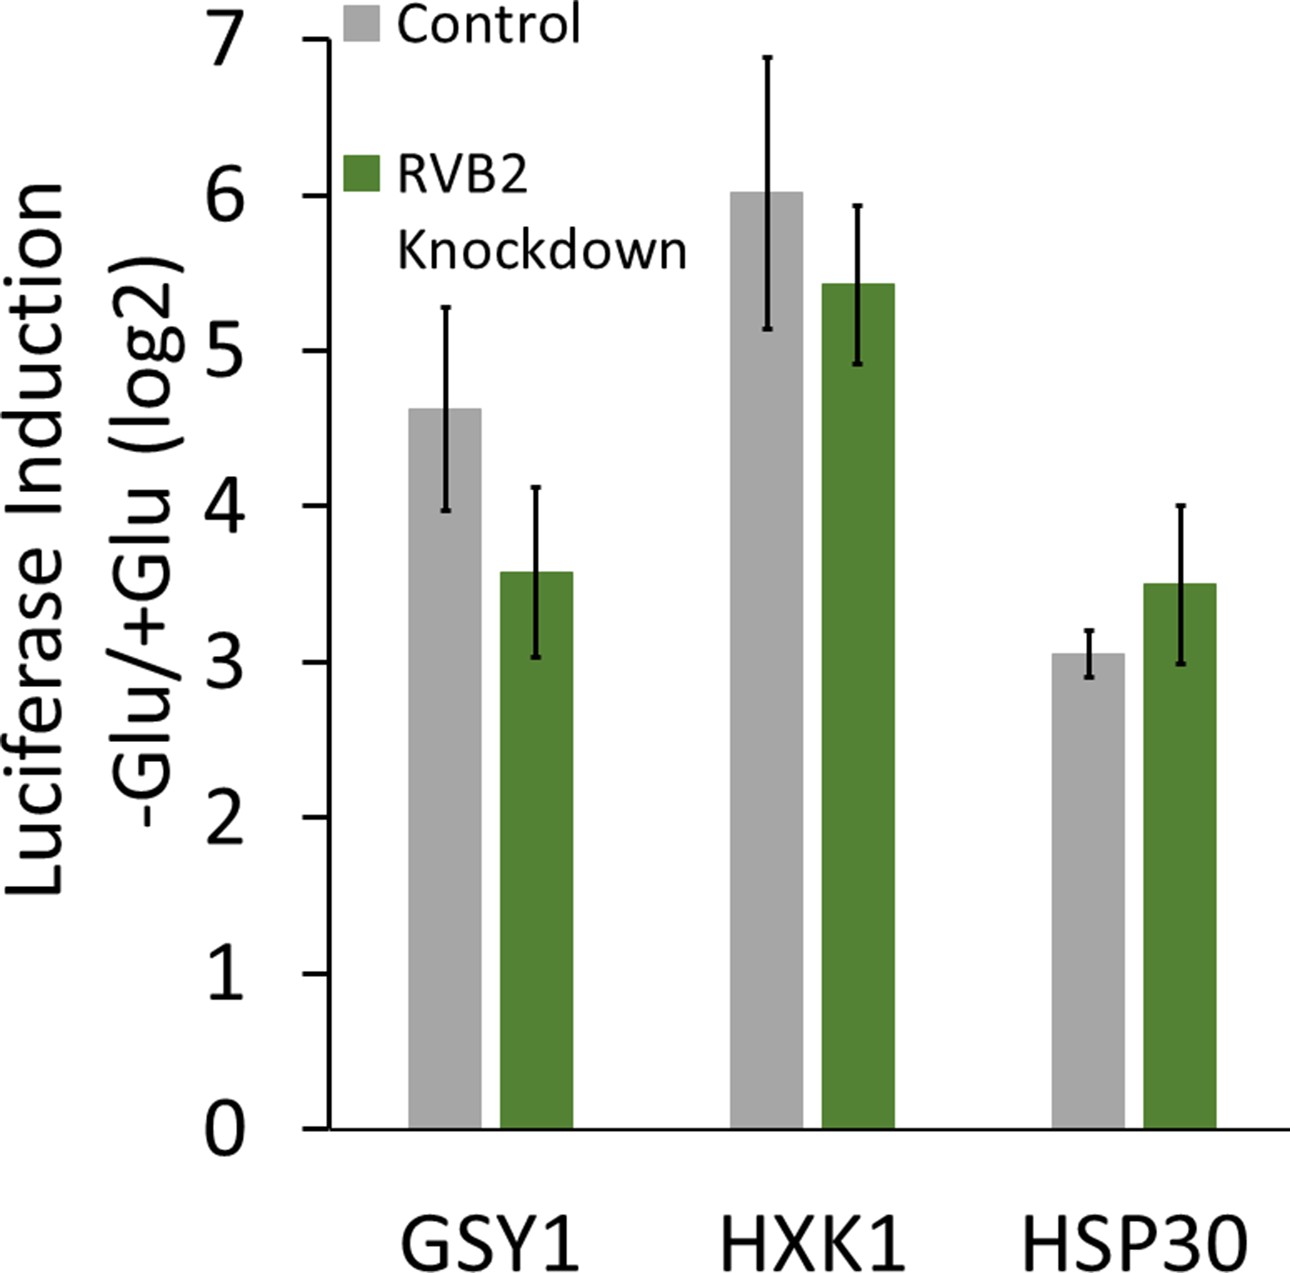
mRNA induction upon glucose starvation in RVB2 knockdown strains.
mRNA levels for endogenously tagged genes were measured upon 30 min of glucose starvation in control and RVB2 knockdown strains that have been treated for 8 hr with ATC (GSY1, HXK1 n = 4, HSP30 n = 3).
Figure 6

A working illustration of Rvb1/Rvb2’s mechanism in coupling the transcription and translation of interacting genes.
First, Rvb1/Rvb2 are recruited by specific promoters and loaded onto the nascent mRNAs during glucose starvation. Then Rvb1/Rvb2 escort the interacting mRNAs to the cytoplasm and cause repressed translation and localization to cytoplasmic granules. Also, forced Rvb binding on an mRNA drives an increase in the transcription of the corresponding genes, further showing the coupling of transcription and translation.
Tables
Key resources table
| Reagent type (species) or resource | Designation | Source or reference | Identifiers | Additional information |
|---|---|---|---|---|
| Strain, strain background (Saccharomyces cerevisiae) | EY0690/w303 | Lab stock | MATa trp1 leu2 ura3 his3 can1 GAL+psi + | |
| Genetic reagent (S. cerevisiae) | ZY1 | This study | EY0690; pRS406-CMV lacIA-FLAG | Available in the Zid lab |
| Genetic reagent (S. cerevisiae) | ZY2 | This study | EY0690; HSP30-CFP-CoTrIP | |
| Genetic reagent (S. cerevisiae) | ZY3 | This study | ZY1; HSP30prUTR-CFP-CoTrIP | |
| Genetic reagent (S. cerevisiae) | ZY4 | This study | ZY1; HXK1prUTR-CFP-CoTrIP | |
| Genetic reagent (S. cerevisiae) | ZY5 | This study | ZY1; HSP26prUTR-CFP-CoTrIP | |
| Genetic reagent (S. cerevisiae) | ZY6 | This study | ZY1; GLC3prUTR-CFP-CoTrIP | (include dilution) |
| Genetic reagent (S. cerevisiae) | ZY7 | This study | ZY1; Blank-CoTrIP | |
| Genetic reagent (S. cerevisiae) | ZY18 | Zid and O’Shea, 2014 | EY0690; MYO2pr-MS2-CP-GFP2x; Dcp2-RFP | |
| Genetic reagent (S. cerevisiae) | ZY147 | This study | EY0690; Rvb1-TAP | |
| Genetic reagent (S. cerevisiae) | ZY148 | This study | EY0690; Rvb2-TAP | |
| Genetic reagent (S. cerevisiae) | ZY282 | This study | EY0690; Dcp2-GFP; Rvb1-mRuby2 | |
| Genetic reagent (S. cerevisiae) | ZY284 | This study | EY0690; Dcp2-GFP; Rvb2-mRuby2 | |
| Genetic reagent (S. cerevisiae) | ZY266 | This study | ZY18; HSP30prUTR-nLuc-pest-1XPP7-12XMS2-tADH1 | |
| Genetic reagent (S. cerevisiae) | ZY269 | This study | ZY18, PDhh1-GFP-6xHis-PP7CP;HSP30prUTR-nLuc-pest-1XPP7-12XMS2-tADH1 | |
| Genetic reagent (S. cerevisiae) | ZY314 | This study | ZY18; Rvb1-PP7CP-6Xhis; HSP30prUTR-nLuc-pest-1XPP7-12XMS2-tADH1 | |
| Genetic reagent (S. cerevisiae) | ZY315 | This study | ZY18; Rvb2-PP7CP-6Xhis; HSP30prUTR-nLuc-pest-1XPP7-12XMS2-tADH1 | |
| Genetic reagent (S. cerevisiae) | ZY193 | This study | ZY18; HSP30prUTR-nLuc-pest-12XMS2-tADH1 | |
| Genetic reagent (S. cerevisiae) | ZY446 | This study | ZY18; Rvb1-PP7CP-6Xhis; HSP30prUTR-nLuc-pest-12XMS2-tADH1 | |
| Genetic reagent (S. cerevisiae) | ZY449 | This study | ZY18; Rvb2-PP7CP-6Xhis; HSP30prUTR-nLuc-pest-12XMS2-tADH1 | |
| Genetic reagent (S. cerevisiae) | ZY316 | This study | ZY18; Rvb1-PP7CP-6Xhis | |
| Genetic reagent (S. cerevisiae) | ZY317 | This study | ZY18; Rvb2-PP7CP-6Xhis | |
| Genetic reagent (S. cerevisiae) | ZY318 | This study | EY0690; Rvb1-mNeogreen | |
| Genetic reagent (S. cerevisiae) | ZY319 | This study | EY0690; Rvb2-mNeogreen | |
| Genetic reagent (S. cerevisiae) | ZY488 | This study | ZY18; HSP26prUTR-nLuc-pest-12XMS2-tADH1 | |
| Genetic reagent (S. cerevisiae) | ZY489 | This study | ZY18; HSP12prUTR-nLuc-pest-12XMS2-tADH1 | |
| Genetic reagent (S. cerevisiae) | ZY490 | This study | ZY18; HSP26prUTR-nLuc-pest-1XPP7-12XMS2-tADH1 | |
| Genetic reagent (S. cerevisiae) | ZY491 | This study | ZY18; HSP12prUTR-nLuc-pest-1XPP7-12XMS2-tADH1 | |
| Genetic reagent (S. cerevisiae) | ZY492 | This study | ZY18; HSP26prUTR-nLuc-pest-12XMS2-tADH1; Rvb1-PP7CP-6Xhis | |
| Genetic reagent (S. cerevisiae) | ZY493 | This study | ZY18; HSP12prUTR-nLuc-pest-12XMS2-tADH1; Rvb1-PP7CP-6Xhis | |
| Genetic reagent (S. cerevisiae) | ZY494 | This study | ZY18; HSP26prUTR-nLuc-pest-1XPP7-12XMS2-tADH1; Rvb1-PP7CP-6Xhis | |
| Genetic reagent (S. cerevisiae) | ZY495 | This study | ZY18; HSP12prUTR-nLuc-pest-1XPP7-12XMS2-tADH1; Rvb1-PP7CP-6Xhis | |
| Genetic reagent (S. cerevisiae) | ZY496 | This study | ZY18; HSP26prUTR-nLuc-pest-12XMS2-tADH1; Rvb2-PP7CP-6Xhis | |
| Genetic reagent (S. cerevisiae) | ZY497 | This study | ZY18; HSP12prUTR-nLuc-pest-12XMS2-tADH1; Rvb2-PP7CP-6Xhis | |
| Genetic reagent (S. cerevisiae) | ZY498 | This study | ZY18; HSP26prUTR-nLuc-pest-1XPP7-12XMS2-tADH1; Rvb2-PP7CP-6Xhis | |
| Genetic reagent (S. cerevisiae) | ZY499 | This study | ZY18; HSP12prUTR-nLuc-pest-1XPP7-12XMS2-tADH1; Rvb2-PP7CP-6Xhis | |
| Genetic reagent (S. cerevisiae) | ZY642 | This study | EY0690; HSP26prUTR-CFP-12XMS2-tADH1; Rvb1-TAP | |
| Genetic reagent (S. cerevisiae) | ZY643 | This study | EY0690; GLC3prHSP26UTR-CFP-12XMS2-tADH1; Rvb1-TAP | |
| Genetic reagent (S. cerevisiae) | ZY644 | This study | EY0690; HSP26prUTR-CFP-12XMS2-tADH1; Rvb2-TAP | |
| Genetic reagent (S. cerevisiae) | ZY645 | This study | EY0690; GLC3prHSP26UTR-CFP-12XMS2-tADH1; Rvb2-TAP | |
| Genetic reagent (S. cerevisiae) | ZY831 | This study | EY0690,GSY1p-GSY1ORF-pKT-ERVB-nLucPEST; RVB2-gRNA; dCas9-Mxi | |
| Genetic reagent (S. cerevisiae) | ZY833 | This study | EY0690,HXK1p-HXK1ORF-pKT-ERVB-nLucPEST; RVB2-gRNA; dCas9-Mxi | |
| Genetic reagent (S. cerevisiae) | ZY834 | This study | EY0690,HSP30p-HSP30ORF-pKT-ERVB-nLucPEST; RVB2-gRNA; dCas9-Mxi | |
| Genetic reagent (S. cerevisiae) | ZY362 | This study | EY0690, HSP30-pKT-ERBV1-nLucPEST | |
| Genetic reagent (S. cerevisiae) | ZY407 | This study | EY0690, HSP26-pKT-ERBV1-nLucPEST | |
| Genetic reagent (S. cerevisiae) | ZY408 | This study | EY0690, HXK1-pKT-ERBV1-nLucPEST | |
| Genetic reagent (S. cerevisiae) | ZY409 | This study | EY0690, GSY1-pKT-ERBV1-nLucPEST | |
| Recombinant DNA reagent | ZP66 | This study | pUC-TalO8 (Blank-CoTrIP) | Addgene:178303 |
| Recombinant DNA reagent | ZP67 | This study | TalO8-HSP30-CFP | Addgene:178304 |
| Recombinant DNA reagent | ZP68 | This study | TalO8-HXK1-CFP | |
| Recombinant DNA reagent | ZP69 | This study | TalO8-HSP26-CFP | Addgene:178306 |
| Recombinant DNA reagent | ZP70 | This study | TalO8-GLC3-CFP | Addgene:178307 |
| Recombinant DNA reagent | ZP64 | Unnikrishnan et al., 2010 | pRS406-CMV-LacI-3xFLAG | Addgene:83410 |
| Recombinant DNA reagent | ZP60 | Lab stock | pFA6-TAP(CBP-TEV-ZZ)-Kan | |
| Recombinant DNA reagent | ZP61 | Lab stock | pFA6-TAP(CBP-TEV-ZZ)-His | |
| Recombinant DNA reagent | ZP47 | Lab stock | pKT-mNeongreen-Ura | |
| Recombinant DNA reagent | ZP224 | Lab stock | pFA6a-link-yoEGFP-SpHis5 | Addgene:44836 |
| Recombinant DNA reagent | ZP109 | Lab stock | pKT-mRuby2-HPH | |
| Recombinant DNA reagent | ZP93 | Carroll et al JCB 2011 | pRS316 PDhh1-GFP-6×His-PP7CP | |
| Recombinant DNA reagent | ZP296 | This study | pRS305-HSP30prUTR-nLuc-pest-1XPP7-12XMS2-tADH1 | |
| Recombinant DNA reagent | ZY311 | Lab stock | pKT-PP7CP-6xHis-tADH1 | |
| Recombinant DNA reagent | ZP207 | This study | pRS305-HSP30prUTR-nLuc-PEST-12XMS2-tADH1 | |
| Recombinant DNA reagent | ZP214 | This study | pRS305-GLC3prUTR-nLuc-PEST-12XMS2-tADH1 | |
| Recombinant DNA reagent | ZP315 | This study | pRS305-GSY1prUTR-nLuc-PEST-12XMS2-tADH1 | |
| Recombinant DNA reagent | ZP441 | This study | pRS305-HSP26prUTR-nLuc-pest-12XMS2-tADH1 | |
| Recombinant DNA reagent | ZP442 | This study | pRS305-HSP12prUTR-nLuc-pest-12XMS2-tADH1 | |
| Recombinant DNA reagent | ZP443 | This study | pRS305-HSP26prUTR-nLuc-pest-1XPP7-12XMS2-tADH1 | |
| Recombinant DNA reagent | ZP444 | This study | pRS305-HSP12prUTR-nLuc-pest-1XPP7-12XMS2-tADH1 | |
| Recombinant DNA reagent | ZP440 | Lab stock | pRS305-1XPP7-12XMS2-tADH1 | |
| Recombinant DNA reagent | ZP29 | Zid and O’Shea, 2014 | pRS305-HSP26prUTR-CFP-12XMS2-tADH1 | |
| Recombinant DNA reagent | ZP32 | Zid and O’Shea, 2014 | pRS305-GLC3prHSP26UTR-CFP-12XMS2-tADH1 | |
| Recombinant DNA reagent | ZP15 | Zid and O’Shea, 2014 | pRS305-12xMS2-tADH1 | |
| Recombinant DNA reagent | ZP480 | McGlincy et al., 2021 | pNTI647 dCas9-Mxi1 TetR KanMX | Addgene:139474 |
| Recombinant DNA reagent | ZP479 | McGlincy et al., 2021 | pNTI661 pRPR1(TetO)-sgRNA | Addgene:139475 |
| Recombinant DNA reagent | ZP577 | This study | pNTI661 pRPR1(TetO)-sgRNA (Rvb2gRNA_i04) | |
| Recombinant DNA reagent | ZP345 | Guzikowski et al., 2022 | pKT ERBV-1 nLucPEST | |
| Sequence-based reagent | NLuc+PestR | This paper | Amplify nLuc-pest to assemble into reporter vector | ATCCACTAGTTCTAGAGC TTAAACATTAATACGAGCAGAAG |
| Sequence-based reagent | yNLucF | This paper | Amplify nLuc-pest to assemble into reporter vector | ATGGTTTTTACTTTAGAAGATTTTG |
| Sequence-based reagent | HSP30pr-F | This paper | Amplify HSP30 promoter and UTR to assemble into reporter vector | TCACTATAGGGCGAATTGGAGCTCCACCGC CCTTTCTTCAAAAGTAGAAAACTTG |
| Sequence-based reagent | HSP30utr-R | This paper | Amplify HSP30 promoter and UTR to assemble into reporter vector | TCTAAAGTAAAAACCAT TTGAAATTTGTTGTTTTTAGTAATCAA |
| Sequence-based reagent | cRvb2-R | This paper | Checking the C-terminal fusion of Rvb2 | CACCAACCAAGGCTTTTTGT |
| Sequence-based reagent | cRvb2-F | This paper | Checking the C-terminal fusion of Rvb2 | TGACCAAAACAGGTGTGGAA |
| Sequence-based reagent | cRvb1-R | This paper | Checking the C-terminal fusion of Rvb1 | CACAGCCATTACCACACCAG |
| Sequence-based reagent | cRvb1-F | This paper | Checking the C-terminal fusion of Rvb1 | CCTGAAGACGCAGAGAATCC |
| Sequence-based reagent | RVB1TAPtag_F | This paper | C-terminal TAP-tag | AAGGTCAACAAAGATTTTAGAAACTTCCGCAAATTATTTG cggatccccgggttaattaa |
| Sequence-based reagent | RVB1Taptag_R | This paper | C-terminal TAP-tag | TATTTTTATTTATGAAATGTGCTTTAGGCTTTCTTCACTG gaattcgagctcgtttaaac |
| Sequence-based reagent | RVB2TAPtag_F | This paper | C-terminal TAP-tag | TGCTAAATCAGCAGACCCTGATGCCATGGATACTACGGAAcggatccccgggttaattaa |
| Sequence-based reagent | RVB2TAPtag_R | This paper | C-terminal TAP-tag | TATATATTTGATGCAATTTCTGCCTTAAAGTACAAAATGCgaattcgagctcgtttaaac |
| Sequence-based reagent | pKT_Rvb2_R | This paper | C-terminal tagging of pKT vector | TATATATTTGATGCAATTTCTGCCTTAAAGTACAAAATGC tcgatgaattcgagctcg |
| Sequence-based reagent | pKT_Rvb2_F | This paper | C-terminal tagging of pKT vector | TGCTAAATCAGCAGACCCTGATGCCATGGATACTACGGAA ggtgacggtgctggttta |
| Sequence-based reagent | pKT_Rvb1_R | This paper | C-terminal tagging of pKT vector | TATTTTTATTTATGAAATGTGCTTTAGGCTTTCTTCACTG tcgatgaattcgagctcg |
| Sequence-based reagent | pKT_Rvb1_F | This paper | C-terminal tagging of pKT vector | AAGGTCAACAAAGATTTTAGAAACTTCCGCAAATTATTTG ggtgacggtgctggttta |
| Sequence-based reagent | PP7_RE2 | This paper | PP7 stem loop with NotI/BamHI overhangs | GATCC TAAGGGTTTCCATATAAACTCCTTAA GC |
| Sequence-based reagent | PP7_RE1 | This paper | PP7 stem loop with NotI/BamHI overhangs | GGCCGC TTAAGGAGTTTATATGGAAACCCTTA G |
| Sequence-based reagent | Rvb2gRNA_i04rc | This paper | Reverse complement gRNA cloning oligo | gctatttctagctctaaaacGTGTGAATGTACAGTCTTCAtgccaatcgcagctcccaga |
| Sequence-based reagent | Rvb2gRNA_i04 | This paper | RVB2 gRNA cloning oligo | tctgggagctgcgattggcaTGAAGACTGTACATTCACACgttttagagctagaaatagc |
| Sequence-based reagent | Rvb1gRNA_i05rc | This paper | Reverse complement gRNA cloning oligo | gctatttctagctctaaaacTCTCTTCTTCATCACCACGAtgccaatcgcagctcccaga |
| Sequence-based reagent | Rvb1gRNA_i05 | This paper | RVB1 gRNA cloning oligo | tctgggagctgcgattggcaTCGTGGTGATGAAGAAGAGAgttttagagctagaaatagc |
| Sequence-based reagent | NM637 | This paper | Primers to extend gRNA oligos for Gibson Assembly ZP479 | gccttattttaacttgctatttctagctctaaaac |
| Sequence-based reagent | NM636 | This paper | Primers to extend gRNA oligos for Gibson Assembly ZP479 | ggctgggaacgaaac tctgggagctgcgattggca |
| Sequence-based reagent | Gsy1_pKTR | This paper | C-terminal tagging of pKT vector | GCTAAAAGAGTAAGATATGTTAGCAGAAGTTAAGATGGTT tcgatgaattcgagctcg |
| Sequence-based reagent | Gsy1_pKTF | This paper | C-terminal tagging of pKT vector | CGATGATGACAACGATACGTCTGCATACTACGAGGATAATggtgacggtgctggttta |
| Sequence-based reagent | HXK1_pKTR | This paper | C-terminal tagging of pKT vector | CATTACATTTTTTTCATTAAGCGCCAATGATACCAAGAGAC tcgatgaattcgagctcg |
| Sequence-based reagent | HXK1_pKTF | This paper | C-terminal tagging of pKT vector | CTGTTATTGCTGCATTGTCCGAAAAAAGAATTGCCGAAGG ggtgacggtgctggttta |
| Sequence-based reagent | HSP26_pKTR | This paper | C-terminal tagging of pKT vector | GGTCCTCGCGAGAGGGACAACACTATAGAGCCAGGTCACTtcgatgaattcgagctcg |
| Sequence-based reagent | HSP26_pKTF | This paper | C-terminal tagging of pKT vector | CAAGAAGATTGAGGTTTCTTCTCAAGAATCGTGGGGTAAC ggtgacggtgctggttta |
| Sequence-based reagent | HSP30_pKTR | This paper | C-terminal tagging of pKT vector | TGTGTTAAGCAAAGAATGATTAAGACAATCTCAAGCTGCTtcgatgaattcgagctcg |
| Sequence-based reagent | HSP30_pKTF | This paper | C-terminal tagging of pKT vector | ACCCGAACCTGAAGCAGAGCAAGCTGTCGAAGATACTGCTggtgacggtgctggttta |
| Sequence-based reagent | qMS2-CP-R | This study | qPCR primers | GTCGGAATTCGTAGCGAAAA |
| Sequence-based reagent | qMS2-CP-F | This study | qPCR primers | GCAGAATCGCAAATACACCA |
| Sequence-based reagent | qnLuc_R | This study | qPCR primers | CCTTCATAAGGACGACCAAA |
| Sequence-based reagent | qnLuc_F | This study | qPCR primers | TGGTGATCAAATGGGTCAAA |
| Sequence-based reagent | qHsp12prR | This study | qPCR primers | GAGCGGGTAACAGATGGAAG |
| Sequence-based reagent | qHsp12prF | This study | qPCR primers | GCGCTGCAAGTTCCTTACTT |
| Sequence-based reagent | qHsp104prR | This study | qPCR primers | ATGAAACTCTCGCCACAACC |
| Sequence-based reagent | qHsp104prF | This study | qPCR primers | AAATGGACTGGATCGACGAC |
| Sequence-based reagent | qHsp26R | This study | qPCR primers | ATCATAAAGAGCGCCAGCAT |
| Sequence-based reagent | qHsp26F | This study | qPCR primers | AACAGATTGCTGGGTGAAGG |
| Sequence-based reagent | qGsy1prR | This study | qPCR primers | GCGGGAAGAAAAGAAGGAGT |
| Sequence-based reagent | qGsy1prF | This study | qPCR primers | AGGGCAGACAAGAGGCTGTA |
| Sequence-based reagent | qActR | Zid and O’Shea, 2014 | qPCR primers | CGGTGATTTCCTTTTGCATT |
| Sequence-based reagent | qActF | Zid and O’Shea, 2014 | qPCR primers | CTGCCGGTATTGACCAAACT |
| Sequence-based reagent | qTub1prR | This study | qPCR primers | CGCTAGATGCATTAAACATGAAG |
| Sequence-based reagent | qTub1prF | This study | qPCR primers | GTGCTCACACCAAGCATCAT |
| Sequence-based reagent | qAct1prR | This study | qPCR primers | GAGAGGCGAGTTTGGTTTCA |
| Sequence-based reagent | qAct1prF | This study | qPCR primers | TCACCCGGCCTCTATTTTC |
| Sequence-based reagent | qGPH1prR | This study | qPCR primers | TCGTCGGTGTTCCTTCCTTA |
| Sequence-based reagent | qGPH1prF | This study | qPCR primers | GAACGCCTTCCCCAATTAC |
| Sequence-based reagent | qHxk1prR | This study | qPCR primers | CCTGGTTGCTCCAGTAAGG |
| Sequence-based reagent | qHxk1prF | This study | qPCR primers | TTCAGGAAGAATGGCAGTCC |
| Sequence-based reagent | qGlc3prR | This study | qPCR primers | TTGCAACAGCCCCTTGGAC |
| Sequence-based reagent | qGlc3prF | This study | qPCR primers | GGGCACTCATCAACAATGTG |
| Sequence-based reagent | qHsp26prF | This study | qPCR primers | CTGTCAAGGTGCATTGTTGG |
| Sequence-based reagent | qHsp30prR | This study | qPCR primers | CGGGATATGGCTTTGCTTAC |
| Sequence-based reagent | qHsp30prF | This study | qPCR primers | CGATTTTGTTGGCCATTTTCCA |
| Sequence-based reagent | qGsy1R | Zid and O’Shea, 2014 | qPCR primers | GCAGTGATTTGCGACACAGT |
| Sequence-based reagent | qGsy1F | Zid and O’Shea, 2014 | qPCR primers | GCCGCTGGTGATGTAGATTT |
| Sequence-based reagent | qHsp12R | Zid and O’Shea, 2014 | qPCR primers | TTGGTTGGGTCTTCTTCACC |
| Sequence-based reagent | qHsp12F | Zid and O’Shea, 2014 | qPCR primers | CGAAAAAGGCAAGGATAACG |
| Sequence-based reagent | qHsp104R | Zid and O’Shea, 2014 | qPCR primers | CACTTGGTTCAGCGACTTCA |
| Sequence-based reagent | qHsp104F | Zid and O’Shea, 2014 | qPCR primers | CGACGCTGCTAACATCTTGA |
| Sequence-based reagent | qGph1R | Zid and O’Shea, 2014 | qPCR primers | TCATAAGCAGCCATGTCATCA |
| Sequence-based reagent | qGph1F | Zid and O’Shea, 2014 | qPCR primers | TTCCCCAAGAAATCAAGTCAA |
| Sequence-based reagent | qTub1R | Zid and O’Shea, 2014 | qPCR primers | GGTGTAATGGCCTCTTGCAT |
| Sequence-based reagent | qTub1F | Zid and O’Shea, 2014 | qPCR primers | CCACGTTTTTCCATGAAACC |
| Sequence-based reagent | qHsp30R | Zid and O’Shea, 2014 | qPCR primers | TCAGCTTGAACACCAGTCCA |
| Sequence-based reagent | qHsp30F | Zid and O’Shea, 2014 | qPCR primers | GGGCAGTGTTTGCAGTCTTT |
| Sequence-based reagent | qGlc3R | Zid and O’Shea, 2014 | qPCR primers | CGAAATCGCCGTTAGGTAAA |
| Sequence-based reagent | qGlc3F | Zid and O’Shea, 2014 | qPCR primers | CAATCCGGAAACCAAAGAAA |
| Sequence-based reagent | qHsp26prF | Zid and O’Shea, 2014 | qPCR primers | CATAAGGGGGAGGGAATAAC |
| Sequence-based reagent | qCITCFPf | Zid and O’Shea, 2014 | qPCR primers | CTGGTGAAGGTGAAGGTGAC |
| Sequence-based reagent | qCITCFPr | Zid and O’Shea, 2014 | qPCR primers | TGTGGTCTGGGTATCTAGCG |
| Sequence-based reagent | qHXK1F | Zid and O’Shea, 2014 | qPCR primers | TTTGTAGCAATGGGACGACA |
| Sequence-based reagent | qHXK1R | Zid and O’Shea, 2014 | qPCR primers | GTACCCAGCTTCCCAAAACA |
Additional files
Download links
A two-part list of links to download the article, or parts of the article, in various formats.
Downloads (link to download the article as PDF)
Open citations (links to open the citations from this article in various online reference manager services)
Cite this article (links to download the citations from this article in formats compatible with various reference manager tools)
Rvb1/Rvb2 proteins couple transcription and translation during glucose starvation
eLife 11:e76965.
https://doi.org/10.7554/eLife.76965


