Mettl3-mediated m6A modification of Fgf16 restricts cardiomyocyte proliferation during heart regeneration
- Key Laboratory of Regenerative Medicine of Ministry of Education, Department of Developmental & Regenerative Biology, Jinan University, China
- College of Basic Medical Sciences, Shandong First Medical University & Shandong Academy of Medical Science, China
- Department of Cardiovascular Surgery, Guangdong Cardiovascular Institute, Guangdong Provincial People's Hospital & Guangdong Academy of Medical Sciences, China
- Department of Neuroanatomy, Institute of Anatomy, University of Bonn, Germany
- Stem Cell and Regeneration TRP, School of Biomedical Sciences, Chinese University of Hong Kong, China
- Department of Physiology, Wonju College of Medicine, Yonsei University, Republic of Korea
- Key Laboratory of Regenerative Medicine of Ministry of Education, Institute of Aging and Regenerative Medicine, China
Figures
Figure 1 with 2 supplements
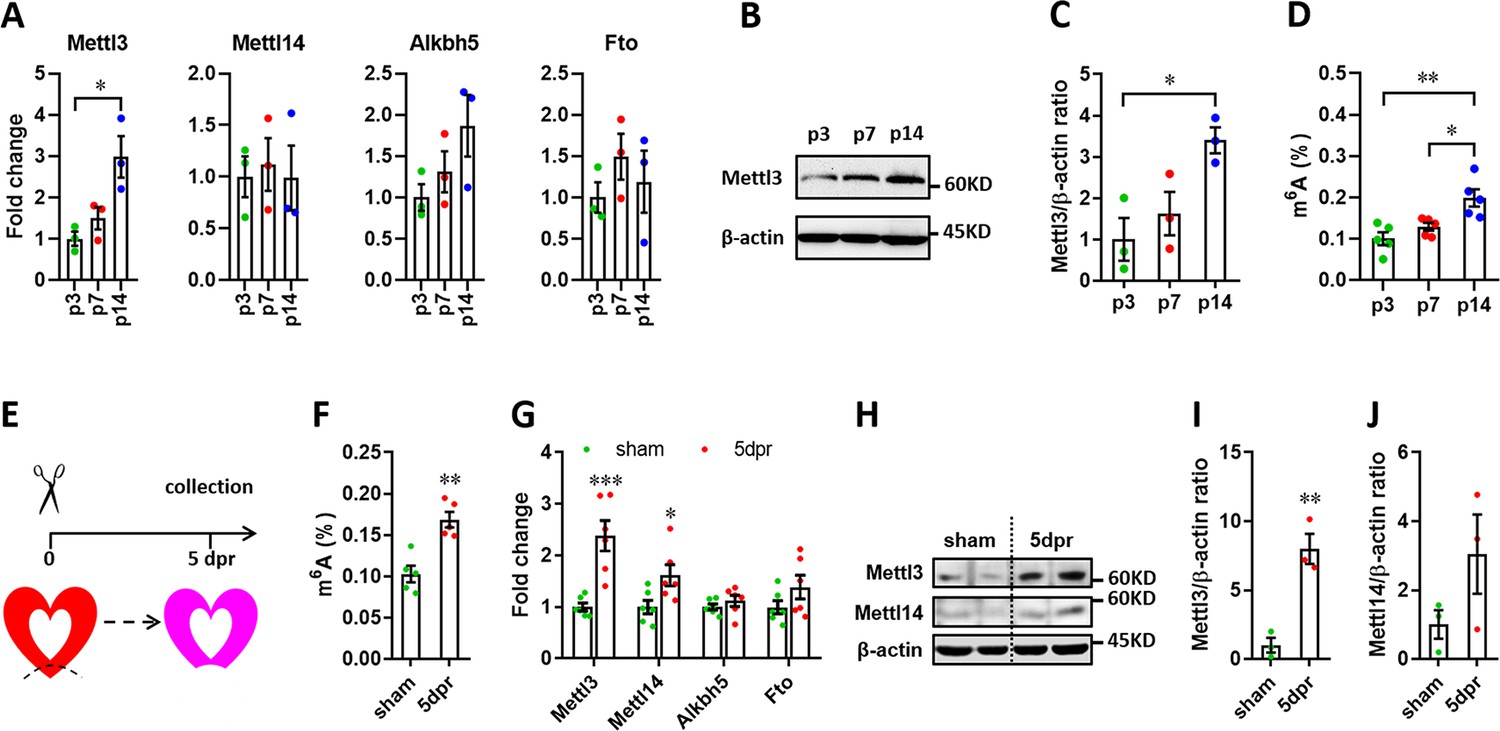
Expression patterns of m6A methylases and demethylases during heart regeneration in neonatal mice.
(A) Quantification of m6A methylases (Mettl3 and Mettl14) and demethylases (Alkbh5 and Fto) expression in neonatal hearts at the indicated time points after birth (n=3 hearts). (B and C) Representative images (B) and quantification (C) of protein expression of Mettl3 in neonatal hearts (n=3 hearts). (D) Cardiac mRNA m6A levels in neonatal heart were measured by ELISA-based quantification assay (n=5 hearts per group). (E) Schematic of heart injury and sample collection in neonatal mice. (F) mRNA m6A levels in the injured hearts at 5 dpr were measured (n=5 hearts). (G) qPCR validation of m6A methylases and demethylases in neonatal hearts at 5 dpr (n=6 hearts). (H–J) Protein levels of Mettl3 and Mettl14 were measured by western blotting at 5 dpr. Representative images (F) and quantification (G and H) of protein expression of Mettl3 and Mettl14 are shown (n=3 hearts). All data are presented as the mean ± SEM. *p<0.05, **p<0.01, ***p<0.001 compared with p3 (A and C) or sham (F, G, and I). p values were determined by 1-way (A, C, and D) or 2-way (G) ANOVA with Dunnett’s multiple-comparison test, or by 2-tailed Student’s t-test (F, I, and J).
-
Figure 1—source data 1
Western blot for Figure 1B showing Mettl3 expression.
- https://cdn.elifesciences.org/articles/77014/elife-77014-fig1-data1-v1.zip
-
Figure 1—source data 2
Western blot for Figure 1B showing β-actin expression.
- https://cdn.elifesciences.org/articles/77014/elife-77014-fig1-data2-v1.zip
-
Figure 1—source data 3
Western blot for Figure 1H showing Mettl3 expression.
- https://cdn.elifesciences.org/articles/77014/elife-77014-fig1-data3-v1.zip
-
Figure 1—source data 4
Western blot for Figure 1H showing Mettl14 expression.
- https://cdn.elifesciences.org/articles/77014/elife-77014-fig1-data4-v1.zip
-
Figure 1—source data 5
Western blot for Figure 1H showing β-actin expression.
- https://cdn.elifesciences.org/articles/77014/elife-77014-fig1-data5-v1.zip
Figure 1—figure supplement 1
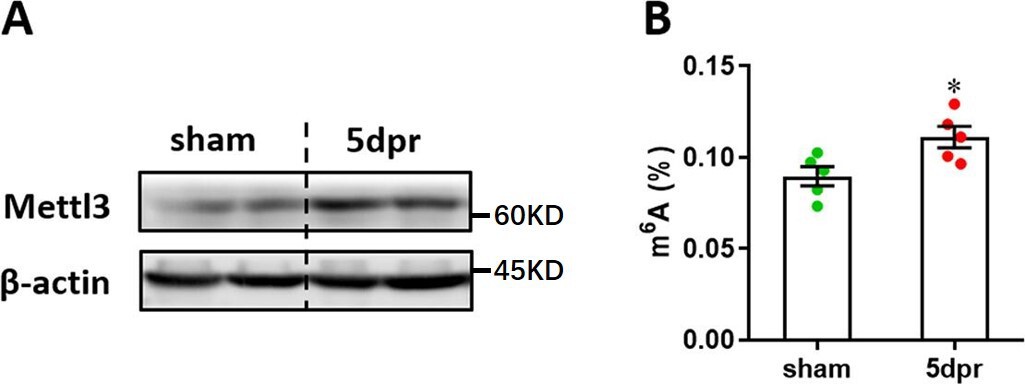
Mettl3 expression and m6A modification levels in the remote areas of injured neonatal heart at 5 dpr.
Apical resection was performed in neonatal mice at p3, followed by cardiac tissues isolation from remote areas at 5 dpr for Western blotting assay and m6A level examination. (A) Western blotting validation of Mettl3 protein in the remote areas in neonatal hearts at 5 dpr. (B) Determination of m6A levels in the remote areas in neonatal hearts at 5 dpr (n=5 hearts). Data are presented as the mean ± SEM of three separate experiments, *p<0.05 versus sham. p values were determined by 2-tailed Student’s t-test.
-
Figure 1—figure supplement 1—source data 1
Western blot for Figure 1—figure supplement 1A showing Mettl3 expression.
- https://cdn.elifesciences.org/articles/77014/elife-77014-fig1-figsupp1-data1-v1.zip
-
Figure 1—figure supplement 1—source data 2
Western blot for Figure 1—figure supplement 1A showing β-actin expression.
- https://cdn.elifesciences.org/articles/77014/elife-77014-fig1-figsupp1-data2-v1.zip
Figure 1—figure supplement 2
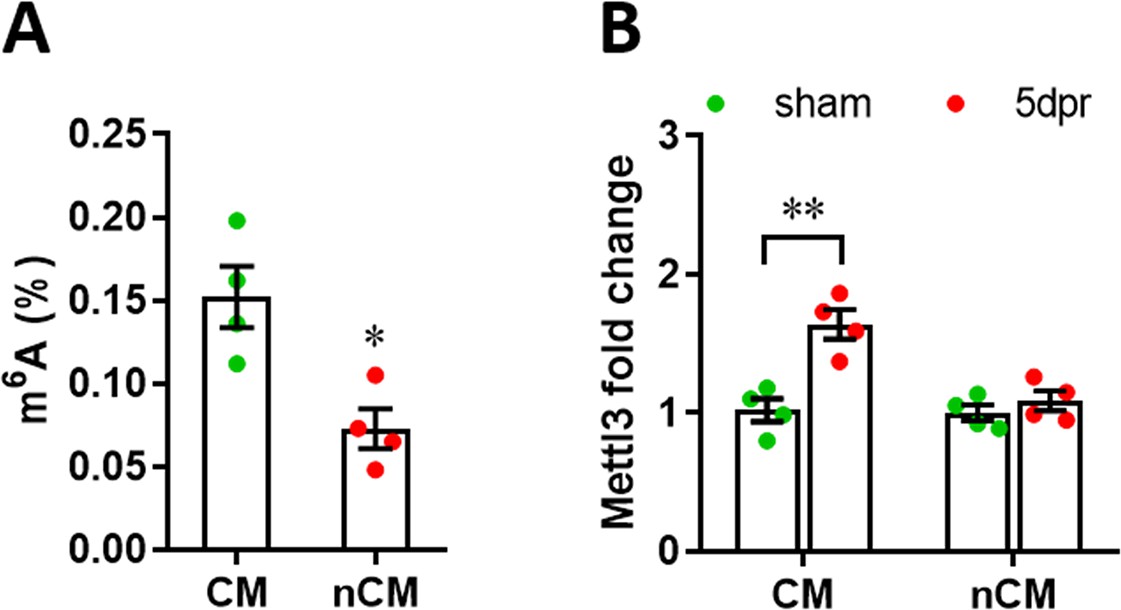
M6A modification and Mettl3 expression levels in CMs and nCMs.
(A) M6A levels in CMs and nCMs isolated from neonatal heart at p1 (n=4). (B) qPCR validation of Mettl3 expression in CMs and nCMs isolated from neonatal hearts at 5 dpr following apical resection at p1 (n=4). All data are presented as the mean ± SEM of three separate experiments, *p<0.05, **p<0.01 versus control. p values were determined by 2-tailed Student’s t-test.
Figure 2 with 1 supplement

Mettl3 suppresses the proliferation of primary cardiomyocytes in vitro.
(A and B) Primary cardiomyocytes were transfected with siMettl3 and siNC for 48 hr, followed by qPCR (A, n=3) and western blotting (B) validation. (C and D) Primary cardiomyocytes were transfected with AAV9-NC and AAV9-Mettl3 for 72 hr, followed by qPCR (C, n=3) and western blotting (D) validation. (E–H) Mettl3 silencing and overexpressing cardiomyocytes were subjected to Ki67 (red) and cTnT (green) double staining. Representative images (E, G) and quantification (F, H) of Ki67+ cardiomyocytes are shown (n=8). Magnified Z-stack confocal images of Ki67+ cardiomyocytes are shown in right panel (E, G). (I–L) Mettl3 silencing and overexpressing cardiomyocytes were subjected to EdU (red) and cTnT (green) double staining. Representative images (I, K) and quantification (J, L) of EdU+ cardiomyocytes are shown (n=8). Magnified Z-stack confocal images of EdU+ cardiomyocytes are shown in right panel (I, K). All data are presented as the mean ± SEM of three separate experiments, *p<0.05, **p<0.01 versus control. p values were determined by 2-tailed Student’s t-test.
-
Figure 2—source data 1
Western blot for Figure 2B showing Mettl3 expression.
- https://cdn.elifesciences.org/articles/77014/elife-77014-fig2-data1-v1.zip
-
Figure 2—source data 2
Western blot for Figure 2B showing β-actin expression.
- https://cdn.elifesciences.org/articles/77014/elife-77014-fig2-data2-v1.zip
-
Figure 2—source data 3
Western blot for Figure 2D showing Mettl3 expression.
- https://cdn.elifesciences.org/articles/77014/elife-77014-fig2-data3-v1.zip
-
Figure 2—source data 4
Western blot for Figure 2D showing β-actin expression.
- https://cdn.elifesciences.org/articles/77014/elife-77014-fig2-data4-v1.zip
Figure 2—figure supplement 1
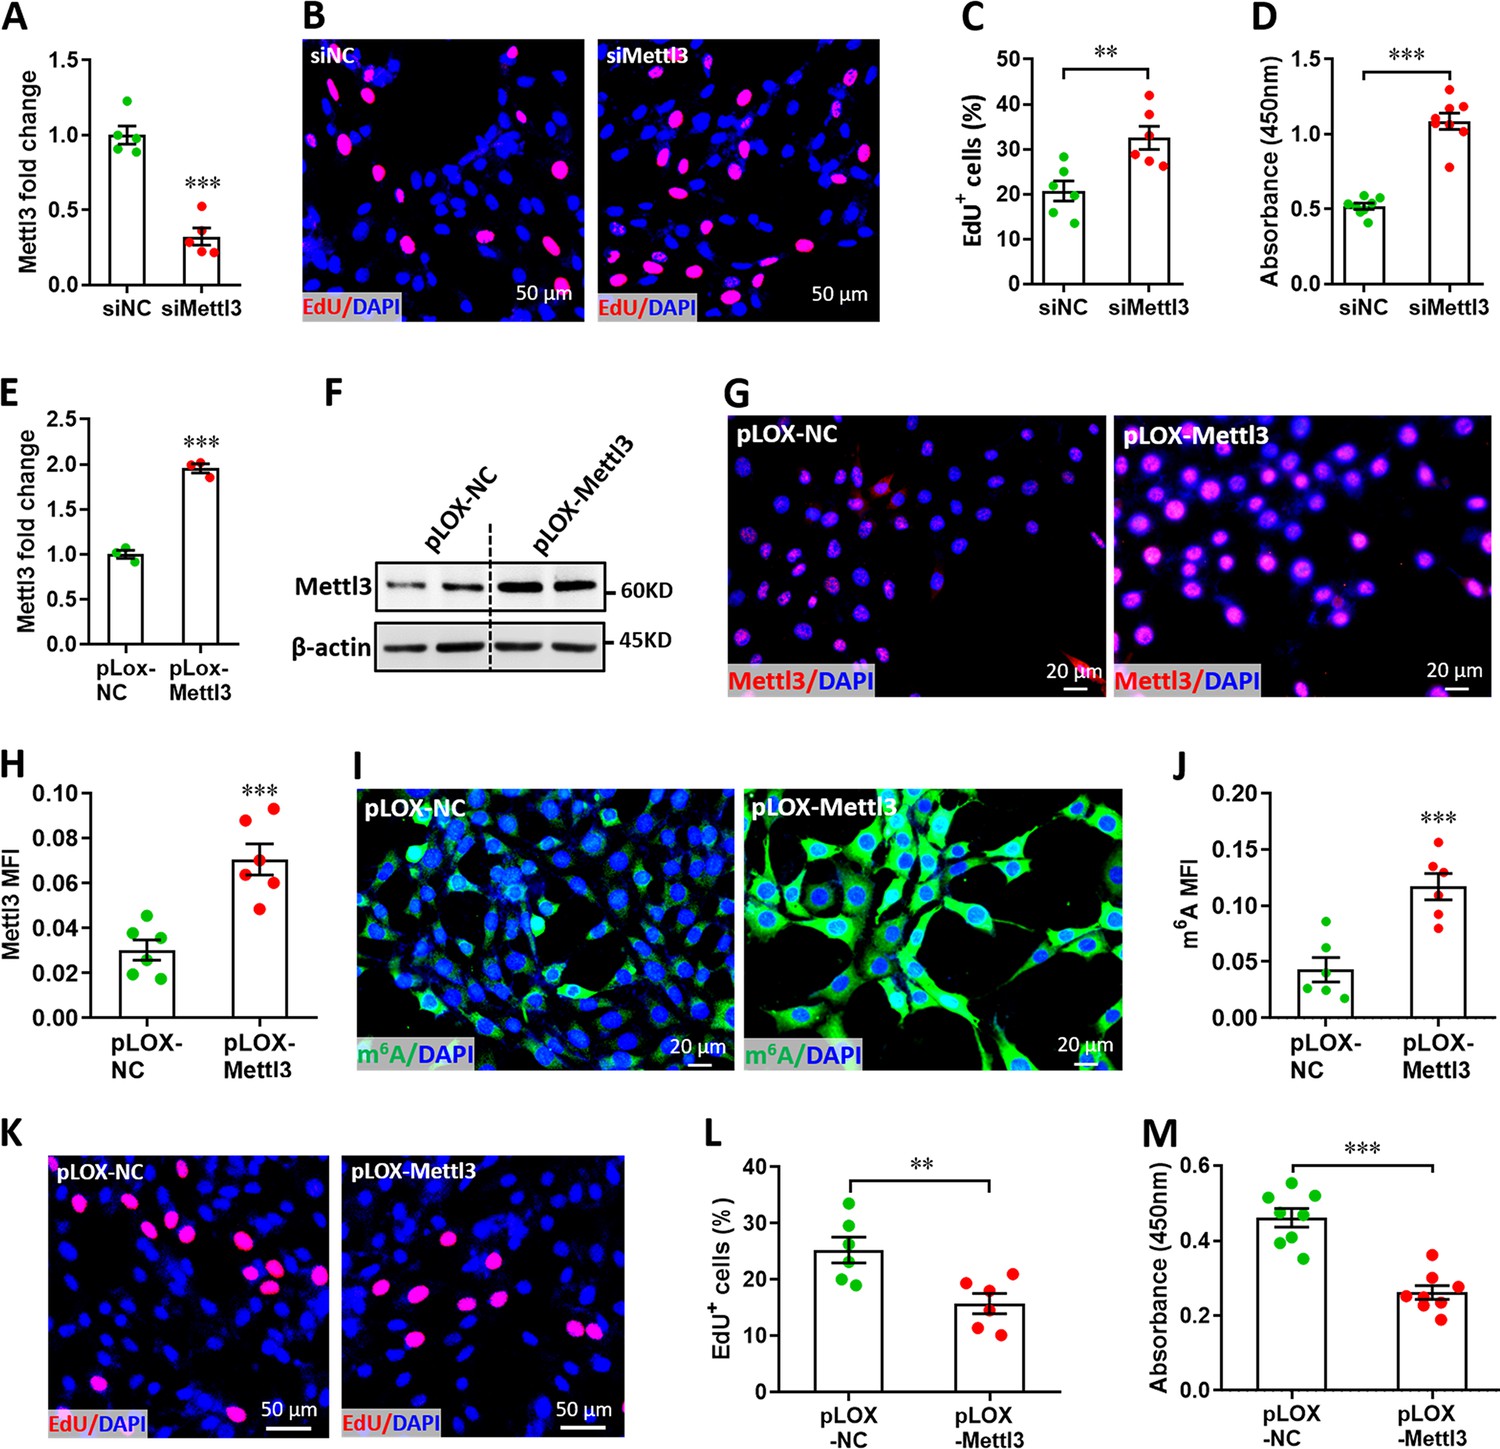
Effects of Mettl3 on the proliferation of H9c2 cells.
(A) siMettl3-induced silence of Mettl3 mRNA in H9c2 cells was confirmed by qPCR (n=5). (B–D) H9c2 cells were transfected with siMettl3 or siNC for 48 hr, followed by EdU labeling or cell counting examination. Representative images of EdU labeling (B) and quantification of EdU+ cells (C) are shown (n=6). Cell counting (D) was examined using CCK8 Cell Counting Kit (n=8). (E and F) Stable Mettl3 overexpression H9c2 cell line was established using lentivirus system. Mettl3 overexpression in mRNA and protein levels were evidenced by qPCR (E) and western blotting (F) respectively (n=3). (G and H) Representative images of immunofluorescence staining (G) and quantification of FoxO3 expression (H) are shown (n=6). (I and J) Immunofluorescence staining confirmed the increased m6A levels in the stable Mettl3 overexpression H9c2 cells. Representative images (I) and quantification (J) of m6A staining are shown (n=6). (K–M) Stable H9c2 cell lines screened by pLOX-Mettl3 and pLOX-NC were subjected to EdU labeling or cell counting examination. Representative images of EdU labeling (K) and quantification of EdU+ cells (L) are shown (n=6). Cell counting (M) was examined using CCK8 Cell Counting Kit (n=8). All data are presented as the mean ± SEM of three separate experiments, **p<0.01, ***p<0.001 versus control. p values were determined by 2-tailed Student’s t-test.
-
Figure 2—figure supplement 1—source data 1
Western blot for Figure 2—figure supplement 1F showing Mettl3 expression.
- https://cdn.elifesciences.org/articles/77014/elife-77014-fig2-figsupp1-data1-v1.zip
-
Figure 2—figure supplement 1—source data 2
Western blot for Figure 2—figure supplement 1F showing β-actin expression.
- https://cdn.elifesciences.org/articles/77014/elife-77014-fig2-figsupp1-data2-v1.zip
Figure 3 with 3 supplements
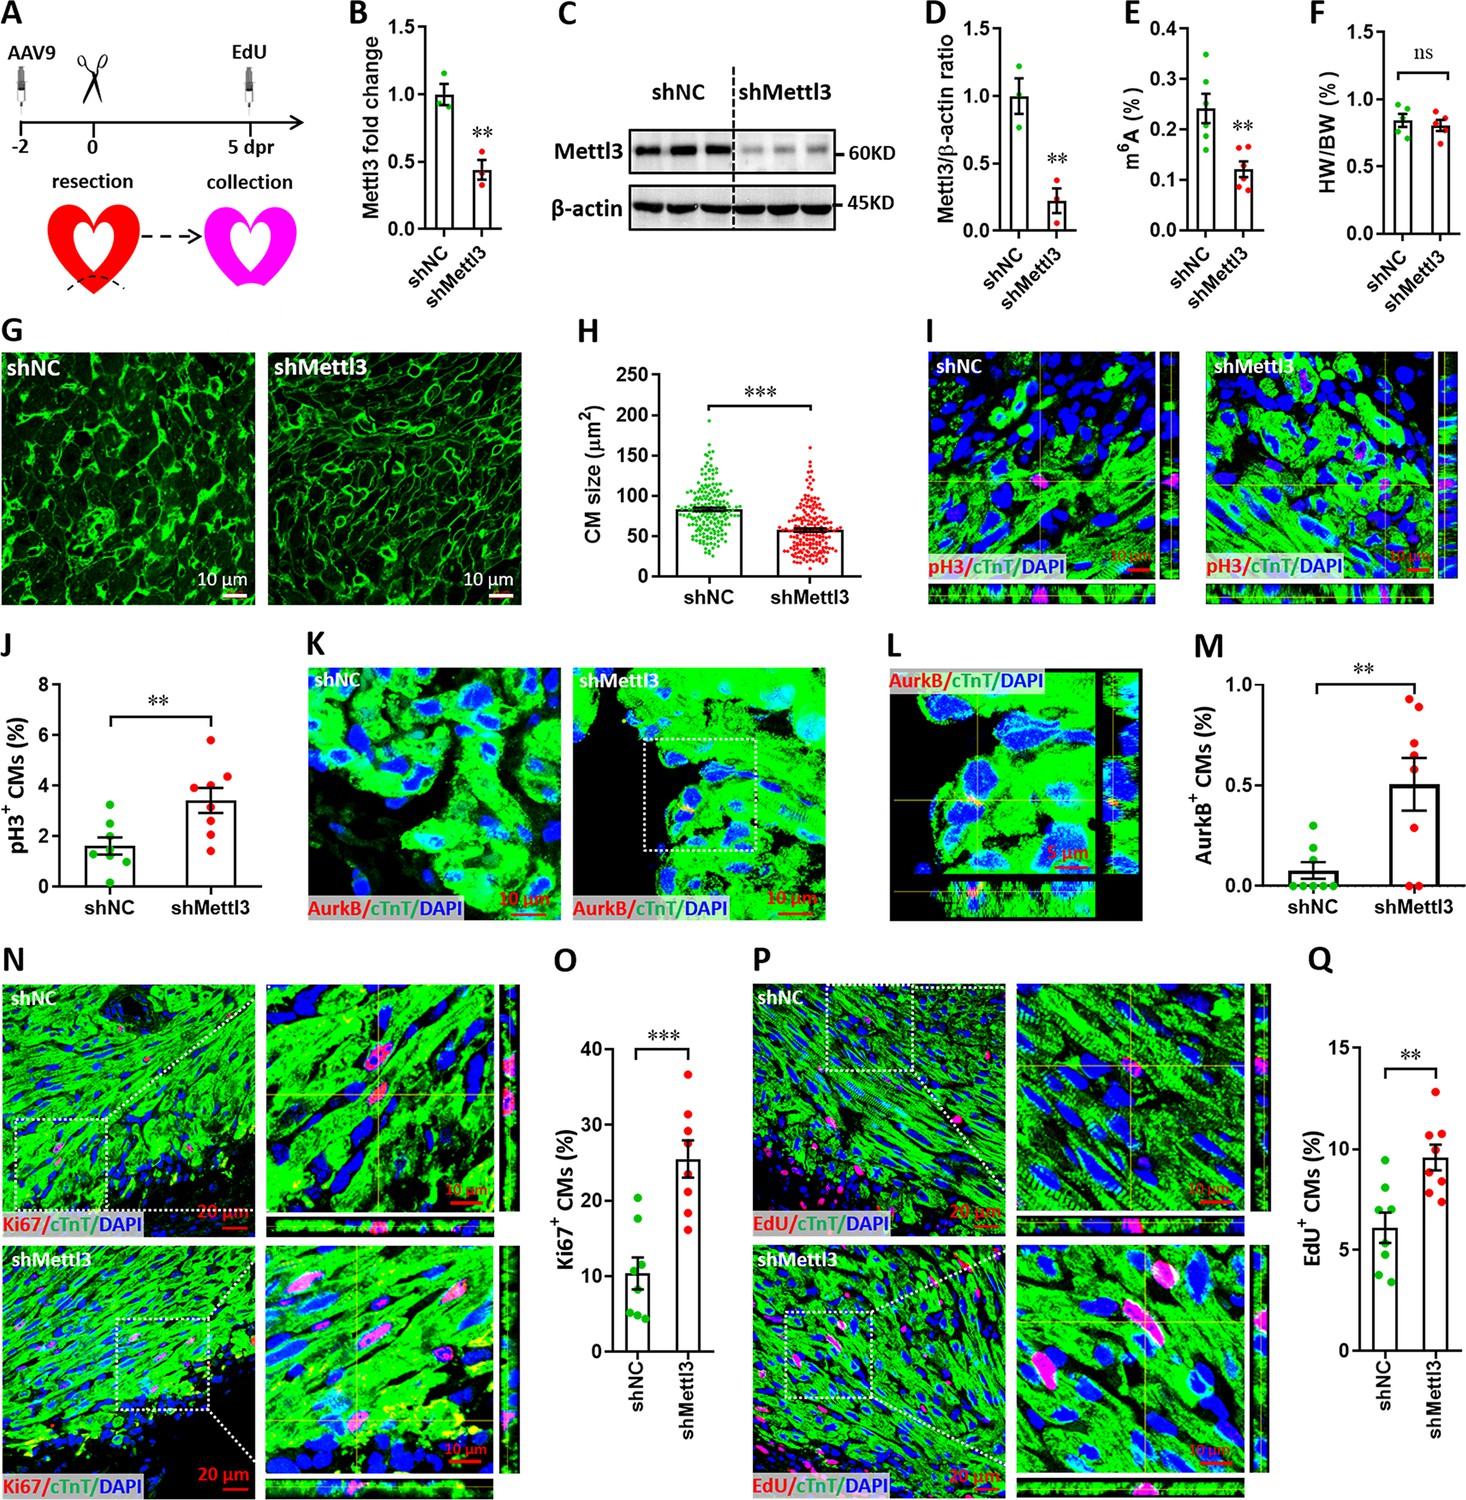
Mettl3 knockdown promotes cardiomyocyte proliferation in neonatal hearts at 5 dpr.
(A) Schematic of AAV9-shMettl3 virus injection designed to knock down Mettl3 in neonatal hearts. (B) qPCR validation of Mettl3 in the AAV9-injected hearts at 0 dpr (n=3 hearts). (C–E) Primary cardiomyocytes were isolated from neonatal hearts with AAV9 virus injection at 0 dpr, followed by western blotting and m6A quantification. Representative images (C) and quantification (D, n=3) of Mettl3 protein expression, as well as the quantification of m6A modification levels (E, n=6) are shown. (F) Quantification of heart weight (HW) to body weight (BW) ratio (n=5 hearts). (G and H) Representative WGA staining images (G) and quantification (H) of the size of cardiomyocytes located in border zone at 5 dpr (n=~200 cells from 5 hearts per group). (I and J) Representative Z-stack confocal images (I) and quantification (J) of pH3+ cardiomyocytes in apical ventricle at 5 dpr (n=8 hearts). (K–M) Representative images (K and L) and quantification (M) of AurkB+ cardiomyocytes in apical zone at 5 dpr (n=8 hearts). L, magnified Z-stack confocal image in K (right panel). (N and O) Representative images (N) and quantification (O) of Ki67+ cardiomyocytes in apical ventricle at 5 dpr (n=8 hearts). Right panel (N), magnified Z-stack confocal images. (P and Q) Representative images (P) and quantification (Q) of EdU+ cardiomyocytes in apical ventricle at 5 dpr (n=8 hearts). Right panel (P), magnified Z-stack confocal images. All data are presented as the mean ± SEM, *p<0.05, **p<0.01, ***p<0.001 versus control. p values were determined by 2-tailed Student’s t-test.
-
Figure 3—source data 1
Western blot for Figure 3C showing Mettl3 expression.
- https://cdn.elifesciences.org/articles/77014/elife-77014-fig3-data1-v1.zip
-
Figure 3—source data 2
Western blot for Figure 3C showing β-actin expression.
- https://cdn.elifesciences.org/articles/77014/elife-77014-fig3-data2-v1.zip
Figure 3—figure supplement 1
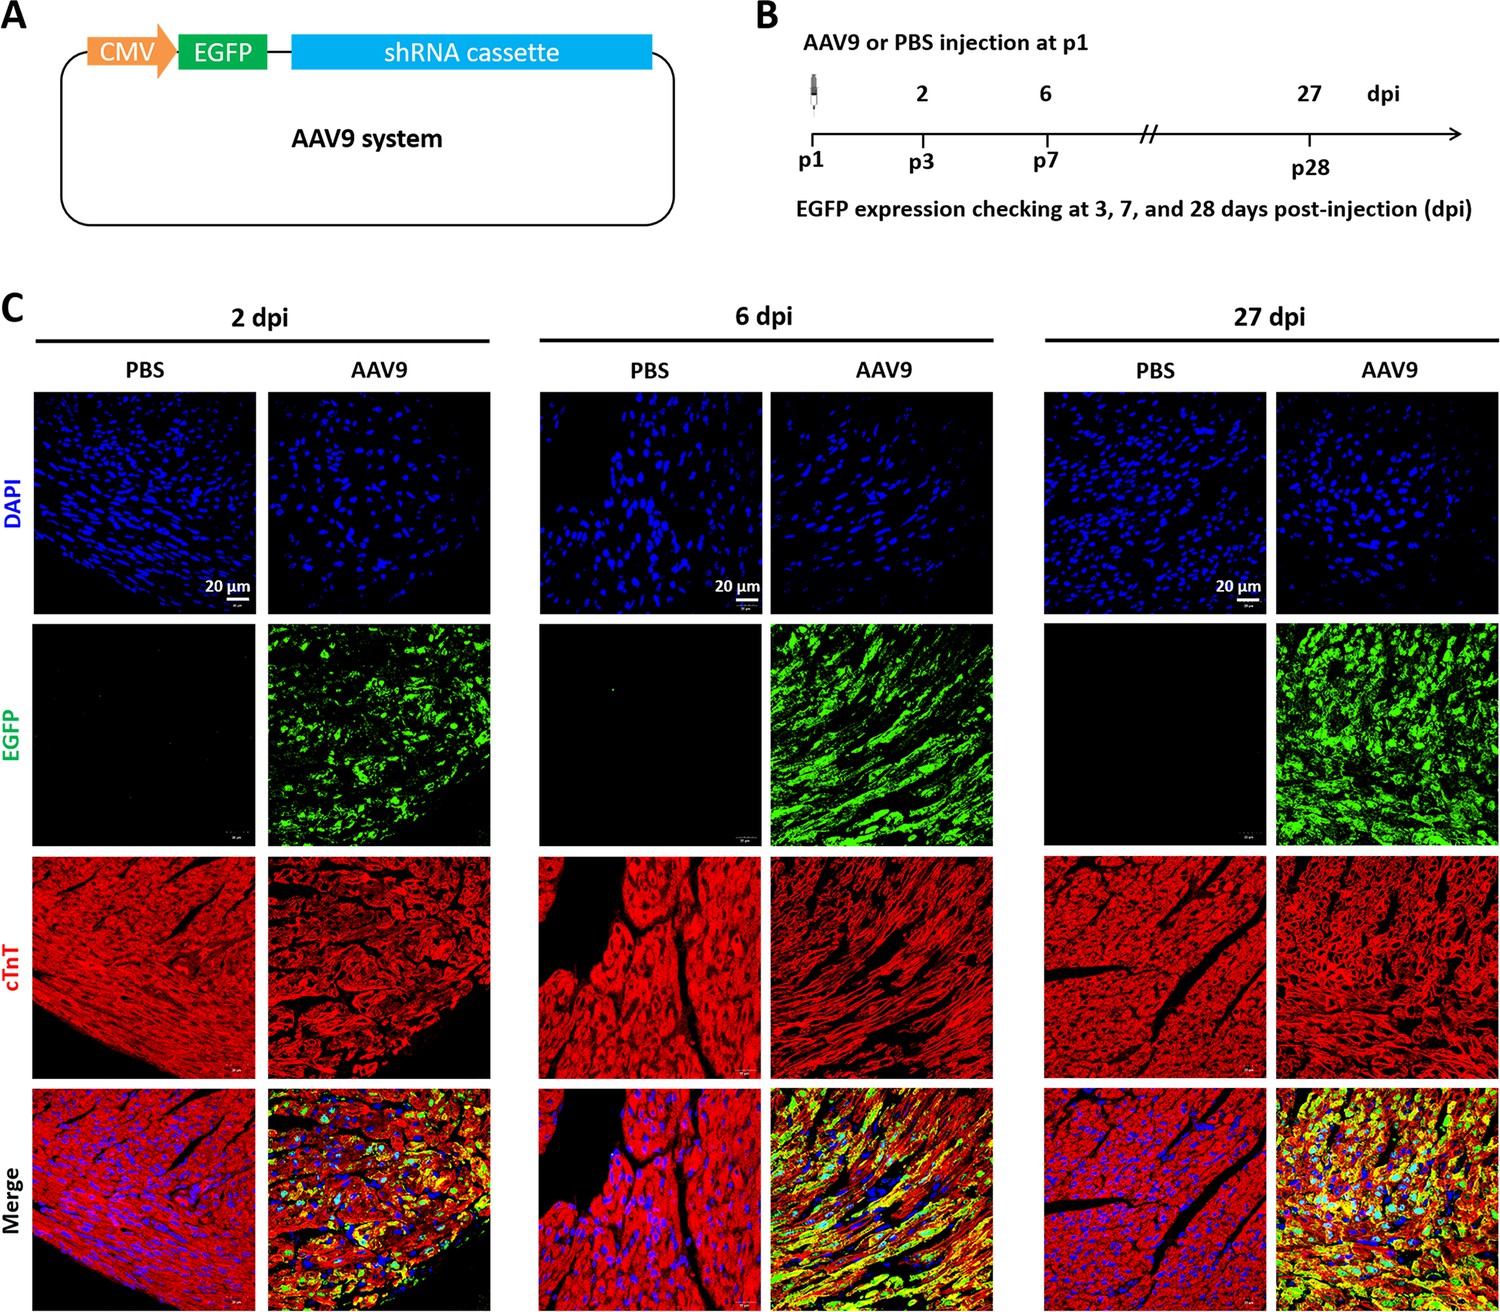
Time course of AAV9 system infection in neonatal mice heart.
(A) A diagram of the AAV9 system harboring a reporter gene (EGFP) expression cassette. (B) Schematic of AAV9 virus injection experiment designed to verify the infective efficiency in neonatal hearts. AAV9 virus was injected at p1, followed by detection of reporter gene at 2–27 days post-injection (dpi) using immunofluorescent staining. (C) Representative images of EGFP expression (green) in heart at 2, 6, and 27 dpi. Red color (cTnT) and blue color (DAPI) denote cardiomyocytes and nucleus, respectively.
Figure 3—figure supplement 2
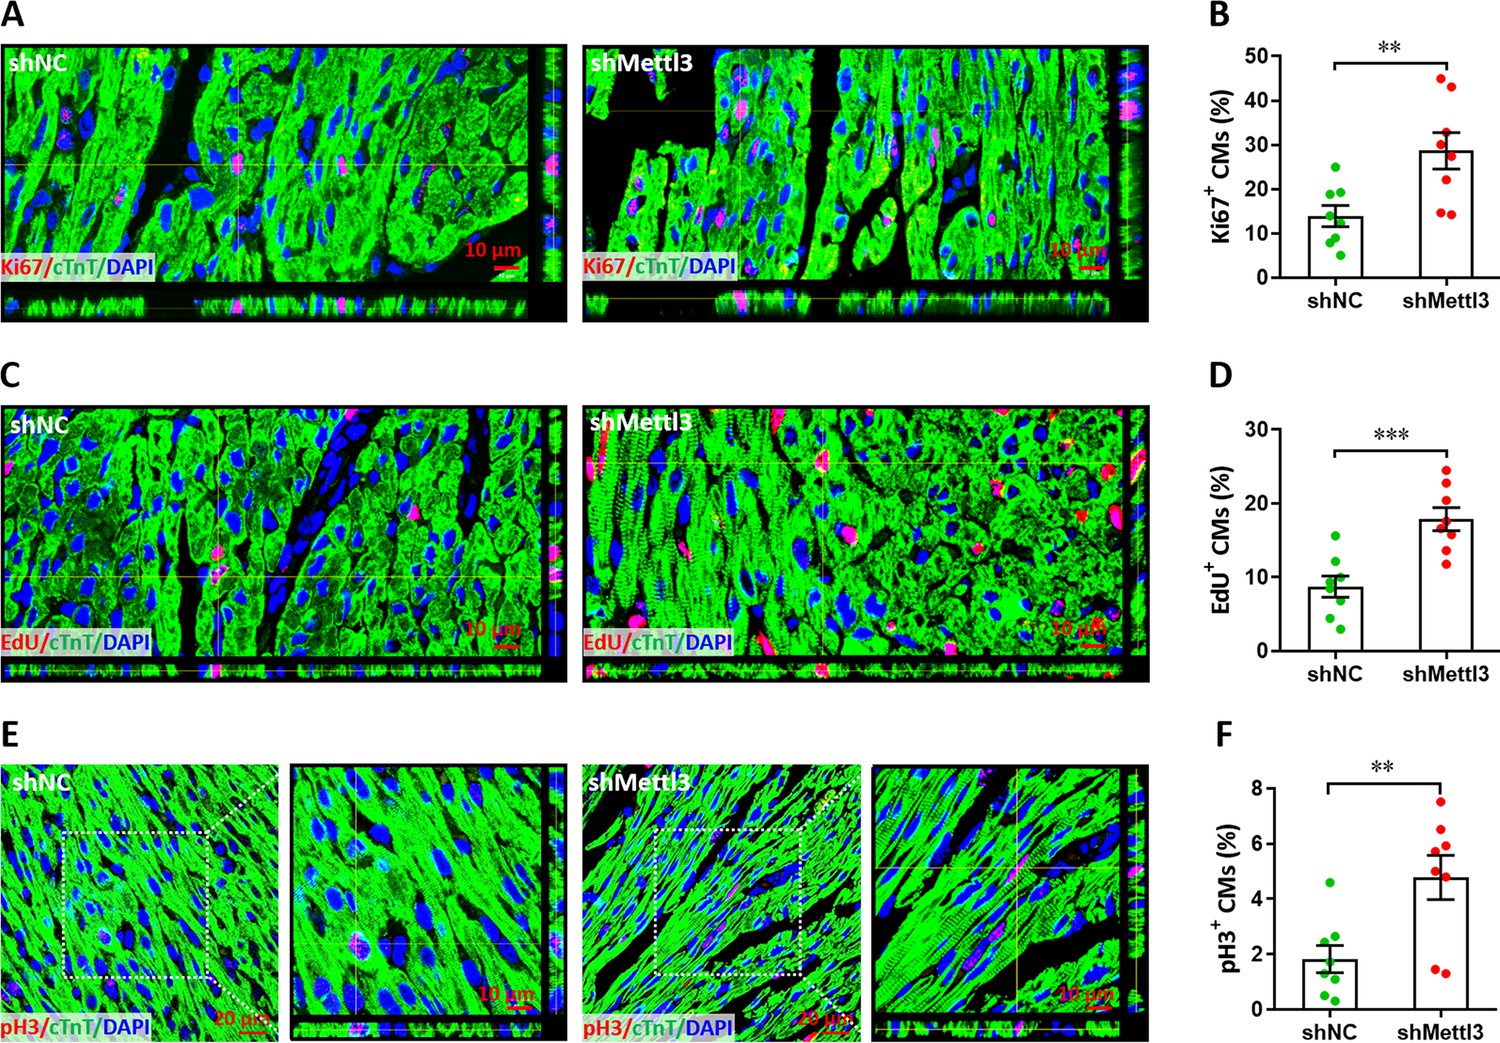
Mettl3 knockdown promotes cardiomyocyte proliferation in the remote area in injured heart at 5 dpr.
(A and B) Representative images (A) and quantification (B) of Ki67+ cardiomyocytes in the remote zone are shown. (C and D) Representative Z-stack confocal images (C) and quantification (D) of EdU+ cardiomyocytes in remote zone are shown. (E and F) Representative confocal images (E) and quantification (F) of pH3+ cardiomyocytes in remote zone are shown. Right panel denotes the magnified Z-stack confocal images. All data are presented as the mean ± SEM (n=8 hearts per group), **p<0.01, ***p<0.001 versus control. p values were determined by 2-tailed Student’s t-test.
Figure 3—figure supplement 3
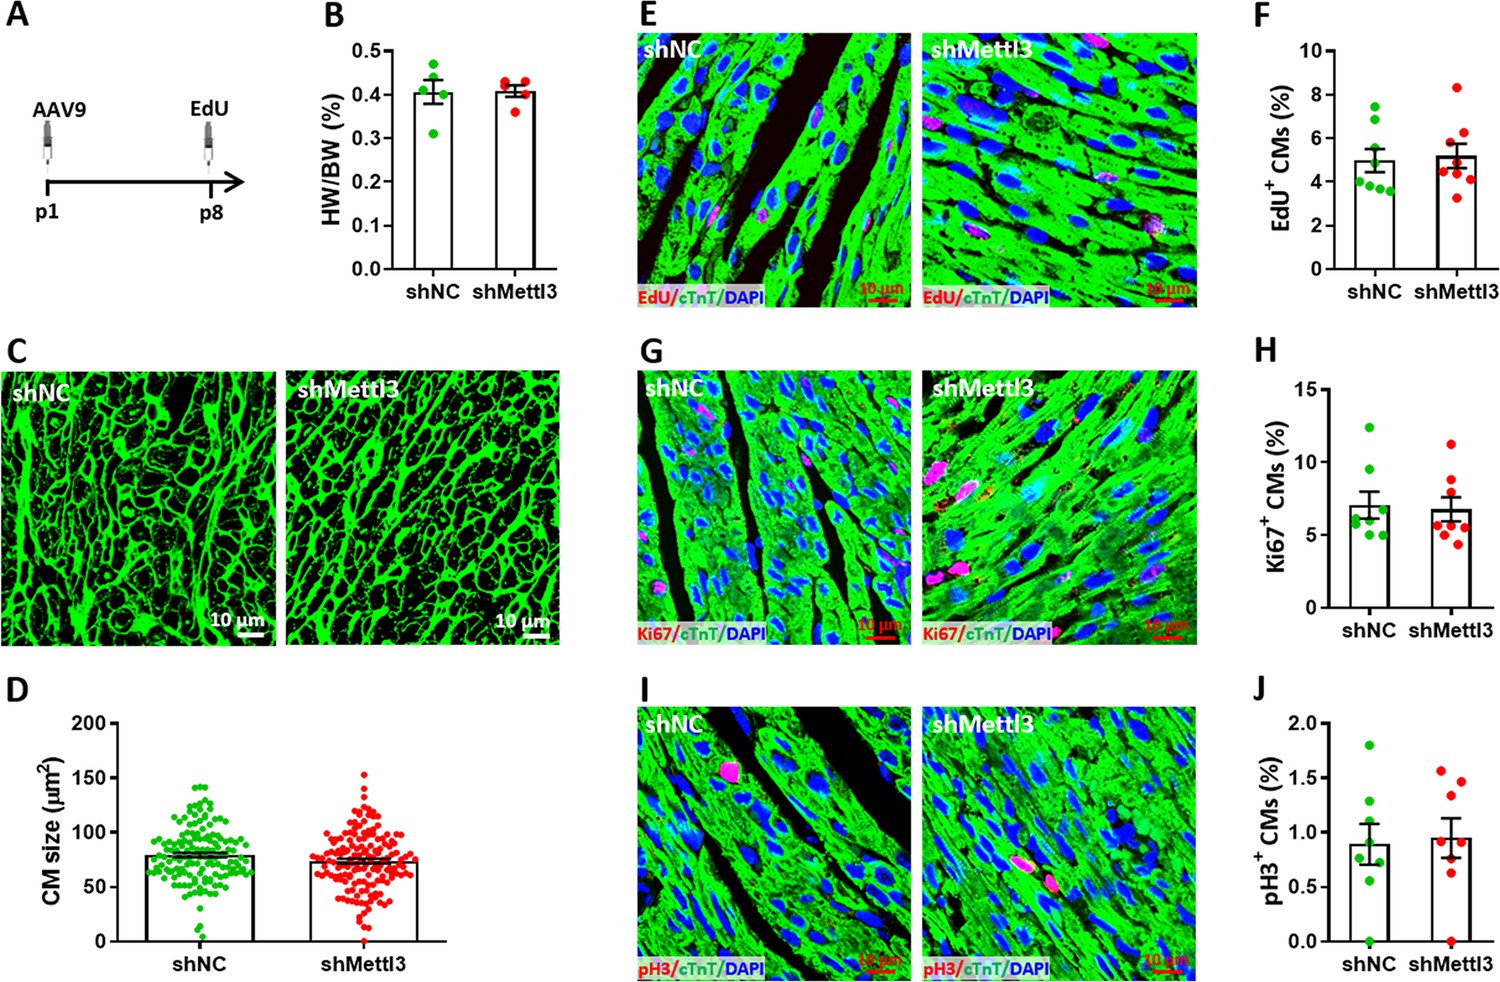
Effects of Mettl3 deficiency on cardiomyocyte proliferation in neonatal mice without injury at p8.
(A) Schematic of AAV9-shMettl3 virus injection designed to knock down Mettl3 in homeostatic neonatal hearts without injury. (B) Quantification of heart weight (HW) to body weight (BW) ratio (n=5 hearts per group). (C) Representative WGA staining images of myocardium in control and Mettl3-deficient hearts. (D) Quantification of cardiomyocyte size in control and Mettl3-deficient hearts are shown (n=~150 cells from five hearts per group). (E and F) Representative images (E) and quantification (F) of EdU+ cardiomyocytes in ventricles at p8 (n=8 hearts per group). (G and H) Representative images (G) and quantification (H) of Ki67+ cardiomyocytes in ventricles at p8 (n=8 hearts per group). (I and J) Representative images (I) and quantification (J) of pH3+ cardiomyocytes in ventricles at p8 (n=8 hearts per group). All data are presented as the mean ± SEM.p values were determined by 2-tailed Student’s t-test.
Figure 4 with 2 supplements
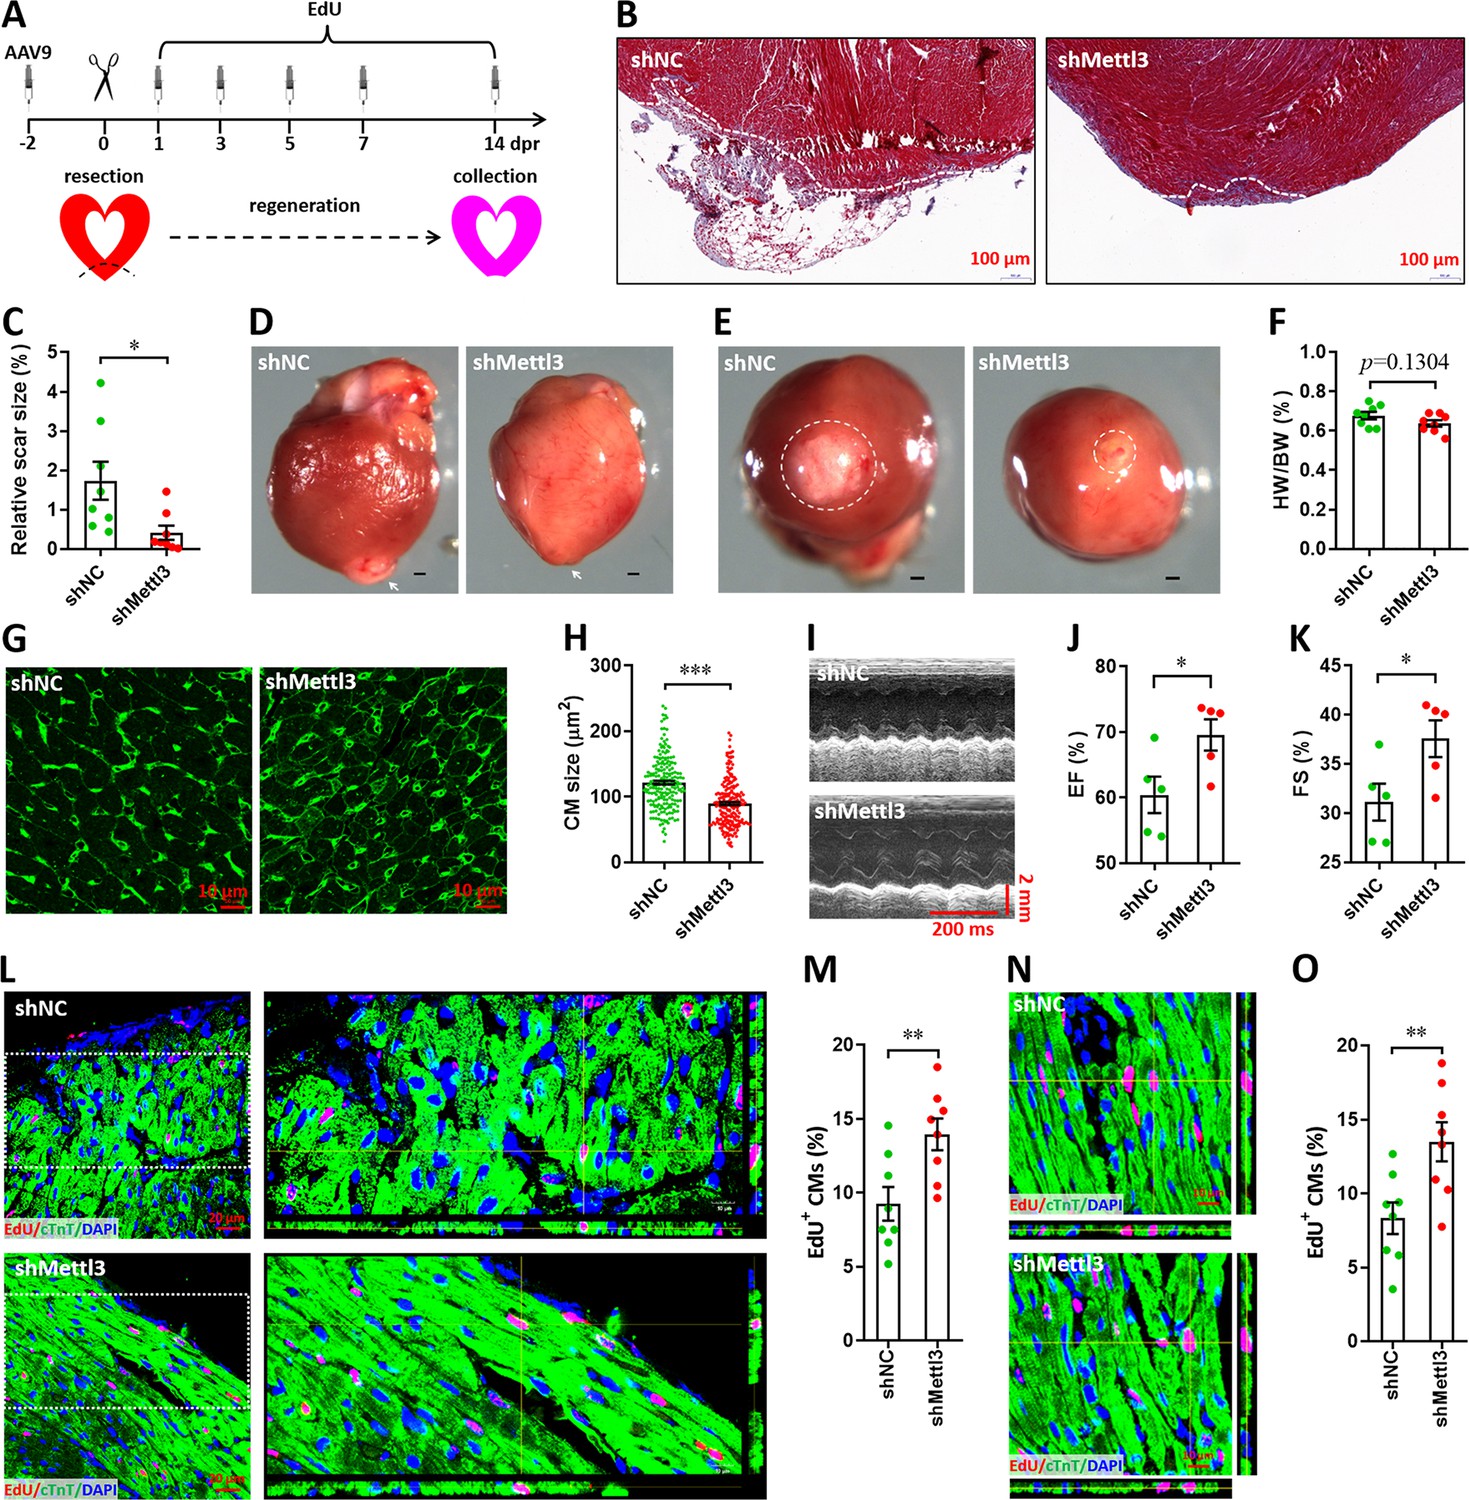
Knockdown of Mettl3 accelerates heart regeneration in neonatal mice at 14 dpr.
(A) Schematic of AAV9 virus injection, apex resection, and EdU-pulse injection, followed by sample collection at 14 dpr. (B and C) Representative masson’s trichrome staining images of cardiac apex (B) and quantification of scar size (C) in control and Mettl3-deficient hearts (n=8 hearts). (D and E) Representative whole (D) and apical (E) images of neonatal hearts at 14 dpr. Arrowhead (D) and circle (E) denote scars in cardiac apex. (F) Quantification of heart weight (HW) to body weight (BW) ratio (n=8 hearts). (G) Representative WGA staining images of myocardium located in border zone in control and Mettl3-deficient hearts. (H) Quantification of cardiomyocyte size in control and Mettl3 knockdown hearts are shown (n=~200 cells from 5 hearts). (I–K) Representative images of M-model echocardiography (I) and quantification of LVEF (J) and LVFS (K) are shown (n=5 hearts). (L) Representative images of EdU+ cardiomyocytes (double positive for EdU and cTnT) in the injured cardiac apex. Right panel, representative Z-stack confocal images. (M) Quantification of EdU+ cardiomyocytes in apical zone of control and Mettl3-deficient hearts (n=8 hearts). (N and O) Representative Z-stack confocal images (N) and quantification (O) of EdU+ cardiomyocytes in the uninjured ventricle (remote zone) are shown (n=8 hearts). All data are presented as the mean ± SEM, *p<0.05, **p<0.01, ***p<0.001 versus control. p values were determined by 2-tailed Student’s t-test.
Figure 4—figure supplement 1
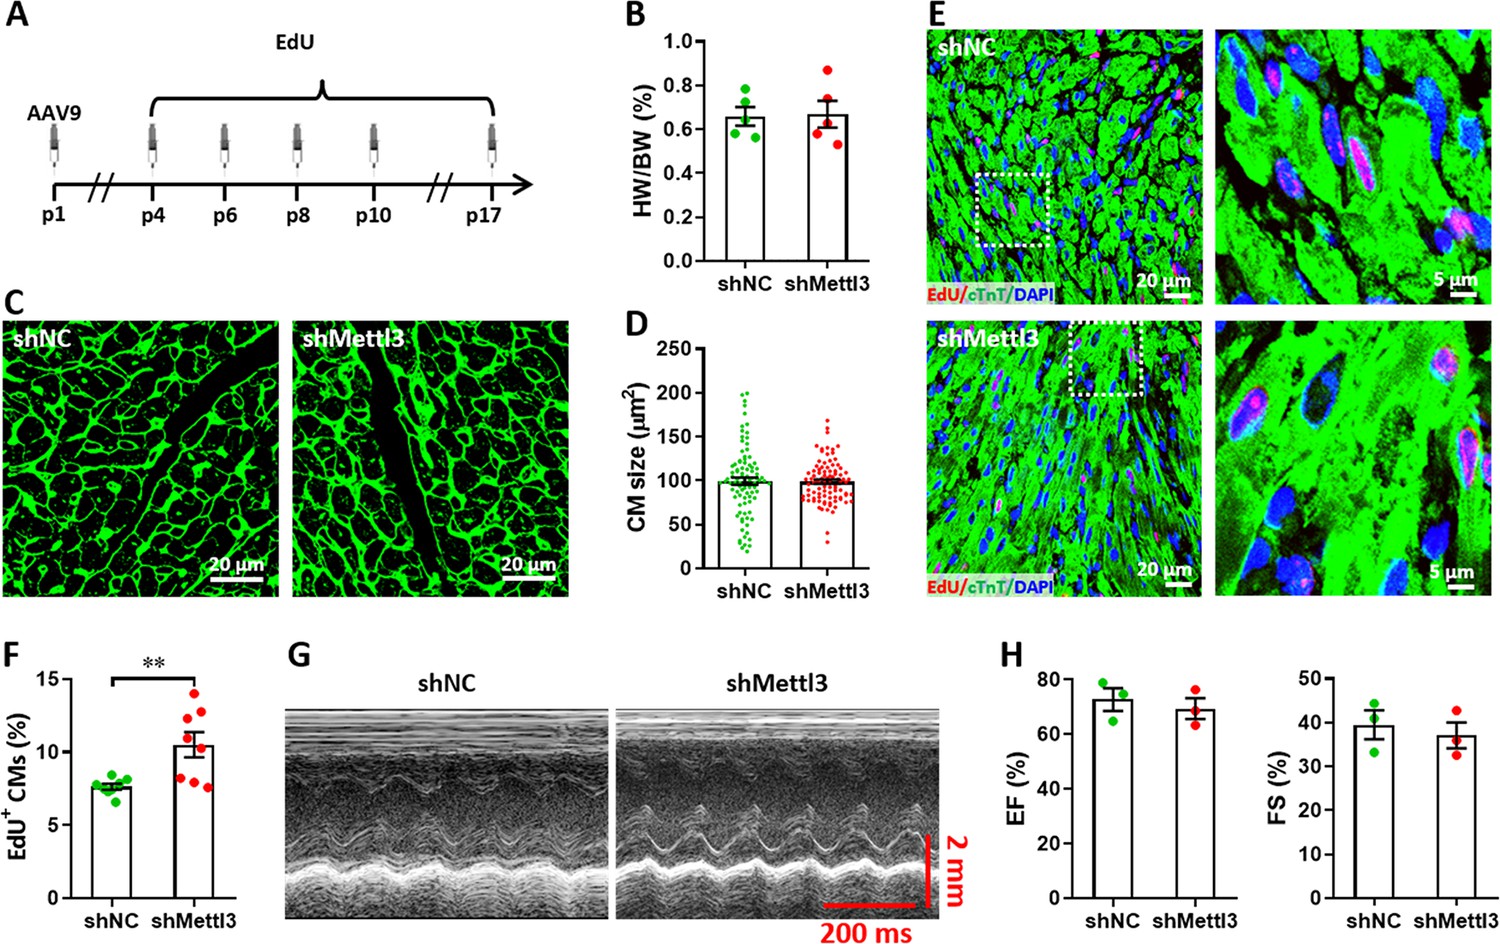
Effects of Mettl3 deficiency on heart regeneration in postnatal mice without injury at p17.
(A) Schematic of AAV9-shMettl3 virus injection and EdU-pulse injection in homeostatic postnatal hearts without injury. (B) Quantification of heart weight (HW) to body weight (BW) ratio (n=5 hearts per group). (C) Representative WGA staining images of myocardium in control and Mettl3-deficient hearts. (D) Quantification of cardiomyocyte size in control and Mettl3-deficient hearts are shown (n=~150 cells from 5 hearts per group). (E and F) Representative images (E) and quantification (F) of EdU+ cardiomyocytes in ventricles at p17 (n=8 hearts per group). (G and H) Representative images of M-model echocardiography (G) and quantification of LVEF (H, left) and LVFS (H, right) are shown (n=3 hearts per group). All data are presented as the mean ± SEM, **p<0.01 versus control. p values were determined by 2-tailed Student’s t-test.
Figure 4—figure supplement 2

Mettl3 knockdown promotes heart regeneration upon apex resection at p7.
(A) Schematic of AAV9-shMettl3 virus injection, apex resection, and sample collection. (B and C) Representative images (B) and quantification (C) of western blotting assay using heart tissues at p7 (n=3 hearts). (D) m6A levels in the injured heart at p7 were measured by ELISA-based quantification assay (n=6 hearts per group). (E–G) Representative images (E, F) and quantification (G) of Ki67+ cardiomyocytes in the border zone of apex are shown at 3 dpr (n=5 hearts). Representative Z-stack confocal image (F) denotes the area marked by dotted line in E panel. (H–J) Representative images (H, I) and quantification (J) of pH3+ cardiomyocytes in the border zone of apex are shown at 3 dpr (n=5 hearts). Representative Z-stack confocal image (I) denotes the area marked by dotted line in I panel. (K) Representative whole (upper panel) and apical (lower panel) images of neonatal hearts at 21 dpr. Dotted lines denote scars in cardiac apex. (L–N) Representative images of M-model echocardiography (L) and quantification of LVEF (M) and LVFS (N) at 21 dpr are shown (n=5 hearts). All data are presented as the mean ± SEM, *p<0.05, **p<0.01, ***p<0.001. p values were determined by 2-tailed Student’s t-test (C, D, G, and J), or by 1-way ANOVA with Dunnett’s multiple-comparison test (M and N).
-
Figure 4—figure supplement 2—source data 1
Western blot for Figure 4—figure supplement 2B showing Mettl3 expression.
- https://cdn.elifesciences.org/articles/77014/elife-77014-fig4-figsupp2-data1-v1.zip
-
Figure 4—figure supplement 2—source data 2
Western blot for Figure 4—figure supplement 2B showing β-actin expression.
- https://cdn.elifesciences.org/articles/77014/elife-77014-fig4-figsupp2-data2-v1.zip
Figure 5 with 3 supplements
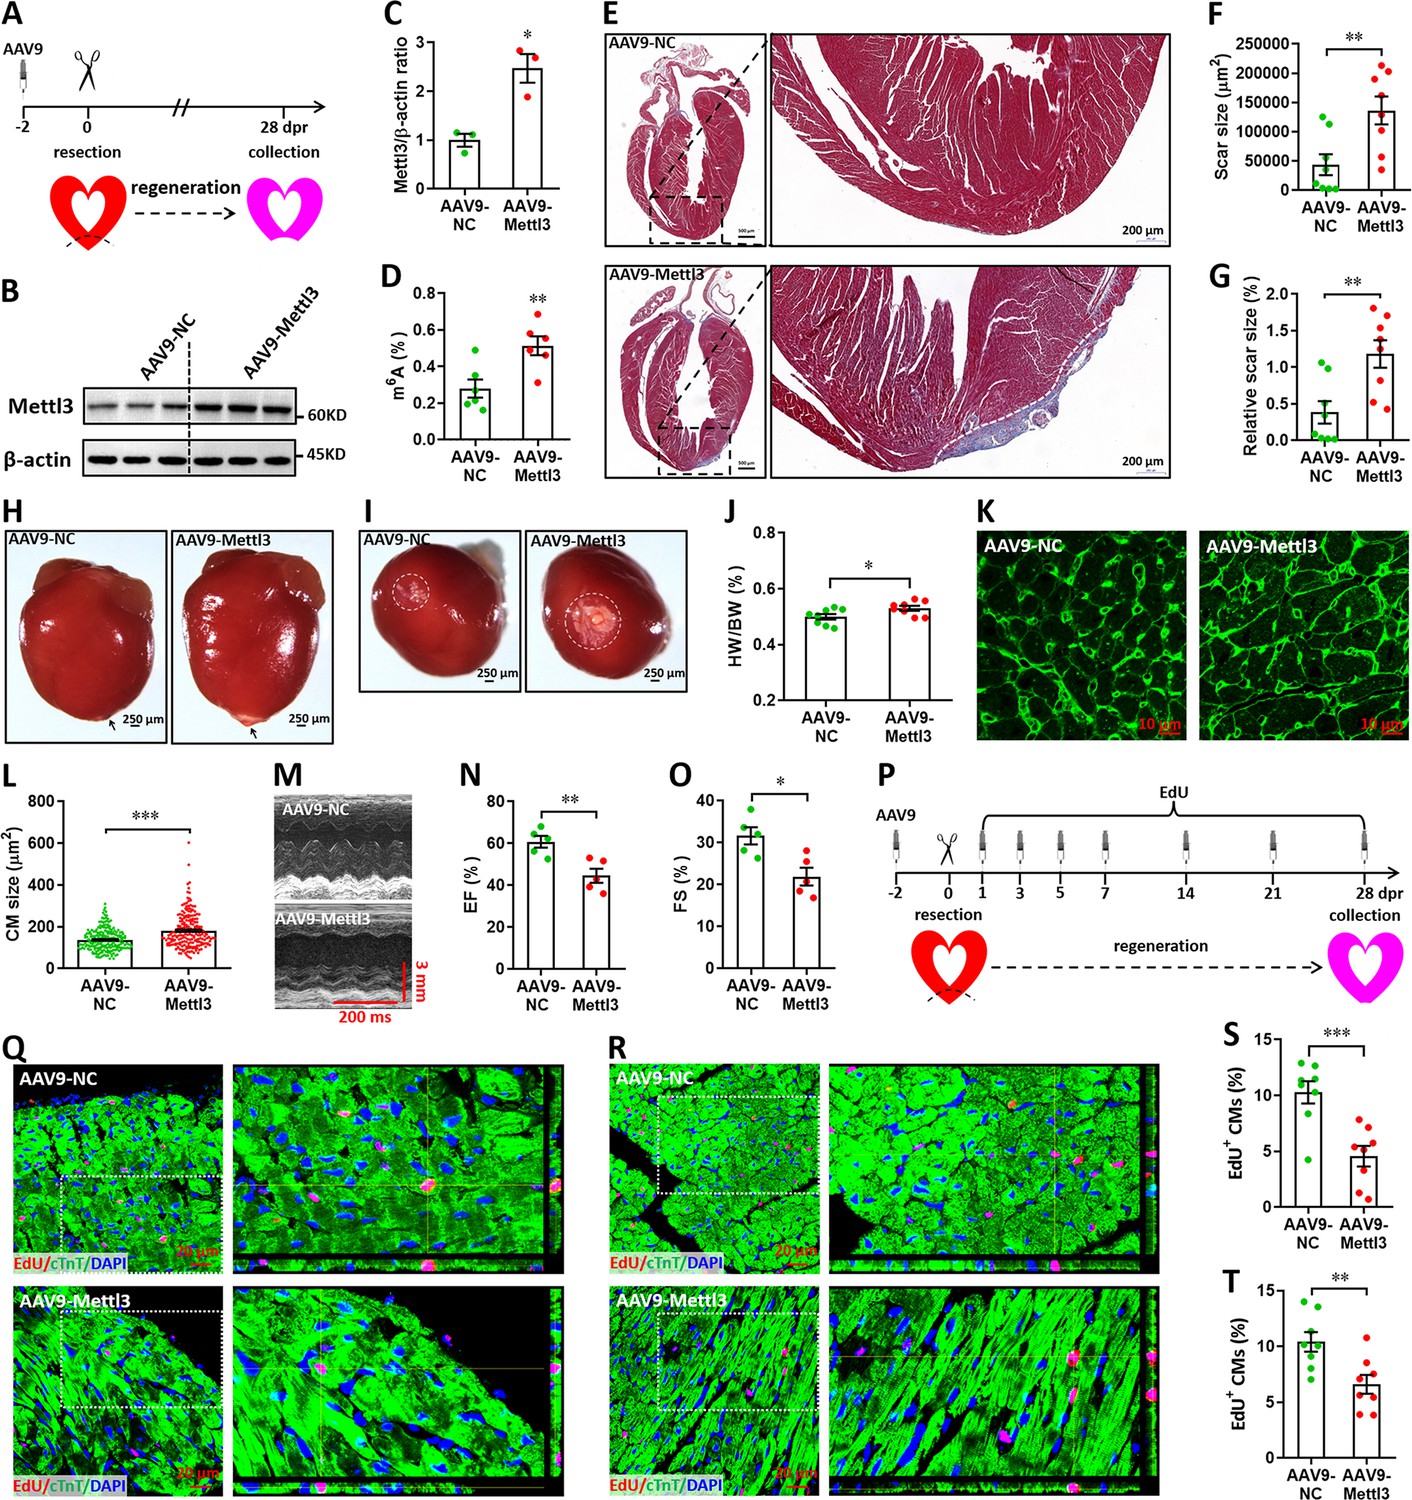
Overexpression of Mettl3 suppresses heart regeneration in neonatal mice upon injury.
(A) Schematic of AAV9-Mettl3 virus injection, apex resection, and sample collection in neonatal mice. (B and C) Representative images (B) and quantification (C) of western blotting for Mettl3 expression in neonatal heart at 0 dpr (n=3 hearts). (D) m6A levels in the heart at 0 dpr were measured by ELISA-based quantification assay (n=6 hearts). (E) Representative masson’s trichrome staining images of heart in control and Mettl3-overexpressing mice at 28 dpr. (F and G) Direct (F) and relative (G) quantification of scar size in control and Mettl3-overexpressing hearts (n=8 hearts). Relative scar size is presented as percentages of whole ventricle size. (H and I) Representative whole (H) and apical (I) images of neonatal hearts at 28 dpr. Arrowhead (H) and circle (I) denote scars in cardiac apex. (J) Quantification of heart weight (HW) to body weight (BW) ratio (n=8 hearts). (K and L) Representative WGA staining images (K) and quantification of cardiomyocyte size (L) in border zone of control and Mettl3-overexpressing hearts at 28 dpr (n=~200 cells from 5 hearts). (M–O) Representative images of M-model echocardiography (M) and quantification of LVEF (N) and LVFS (O) are shown at 28 dpr (n=5 hearts). (P) Schematic of EdU pulse injection and sample collection at 28 dpr. (Q and R) Representative images of EdU+ cardiomyocytes in apical (Q) and remote (R) zone at 28 dpr. Right panel, magnified Z-stack confocal images. (S and T) Quantification of EdU+ cardiomyocytes in apical (S) and remote (T) zone in control and Mettl3-overexpressing hearts (n=8 hearts). All data are presented as the mean ± SEM, *p<0.05, **p<0.01, ***p<0.001 versus control. p values were determined by 2-tailed Student’s t-test.
-
Figure 5—source data 1
Western blot for Figure 5B showing Mettl3 expression.
- https://cdn.elifesciences.org/articles/77014/elife-77014-fig5-data1-v1.zip
-
Figure 5—source data 2
Western blot for Figure 5B showing β-actin expression.
- https://cdn.elifesciences.org/articles/77014/elife-77014-fig5-data2-v1.zip
Figure 5—figure supplement 1

Overexpression of Mettl3 in postnatal hearts with AAV9 injection at p27.
(A) qPCR validation of Mettl3 mRNA expression in postnatal hearts at 27 dpr. Data are presented as the mean ± SEM (n=5 hearts per group), ***p<0.001 versus control. p values were determined by 2-tailed Student’s t-test. (B) Expression of Mettl3 protein was examined using immunofluorescence staining in postnatal hearts at 27 dpr. (C) Representative images of reporter gene (EGFP) expression mediated by AAV9-Mettl3 virus in heart at 27 dpr.
Figure 5—figure supplement 2
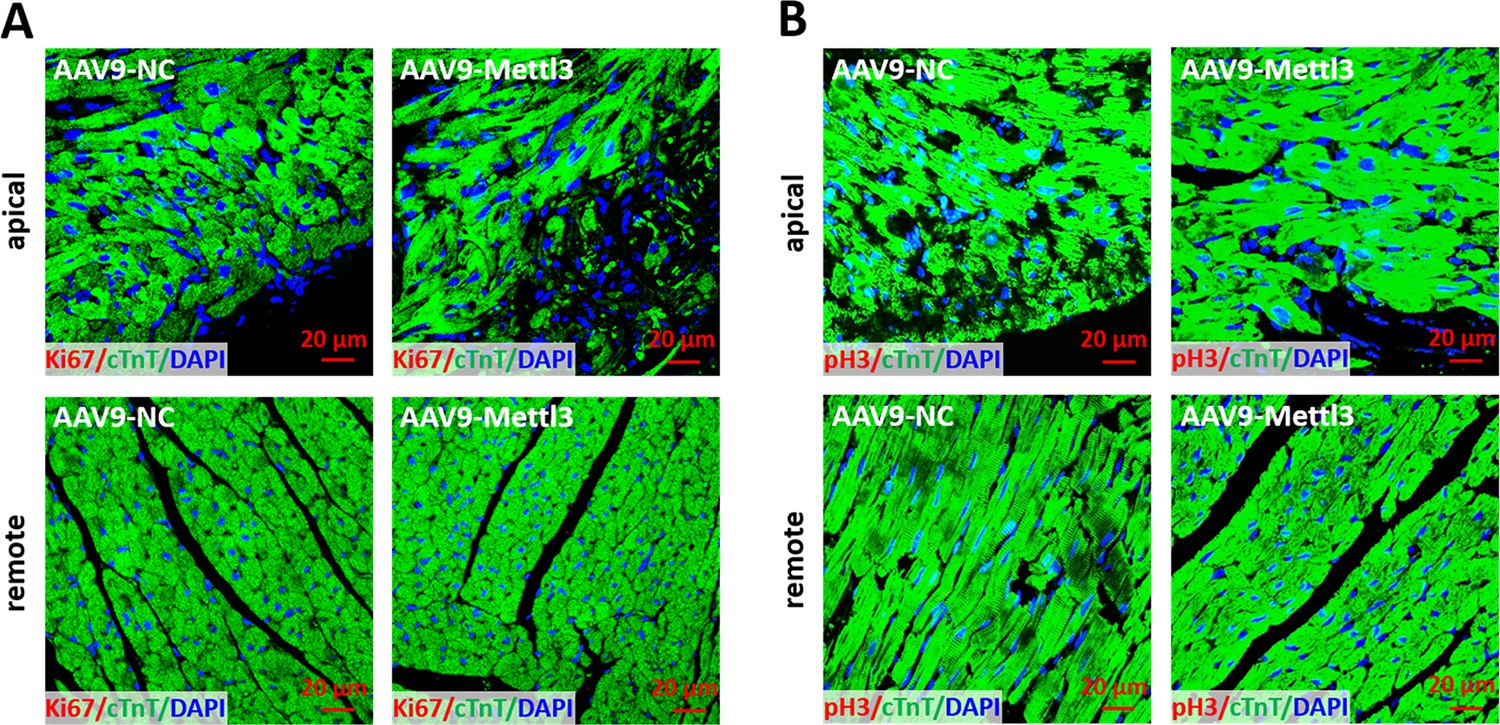
No proliferating cardiomyocytes was detected in heart at 27 dpr.
(A) Sections from apical (upper panels) and remote (lower panels) ventricles were subjected to Ki67 and cTnT double staining. Representative images of cardiomyocytes in apical (upper panels) and remote (lower panels) zone showing that there was no Ki67+ cardiomyocytes in both groups at 27 dpr. (B) Sections from apical (upper panels) and remote (lower panels) ventricles were subjected to pH3 and cTnT double staining. Representative images of cardiomyocytes in apical (upper panels) and remote (lower panels) zone showing that there was no pH3+ cardiomyocytes in both groups at 27 dpr.
Figure 5—figure supplement 3
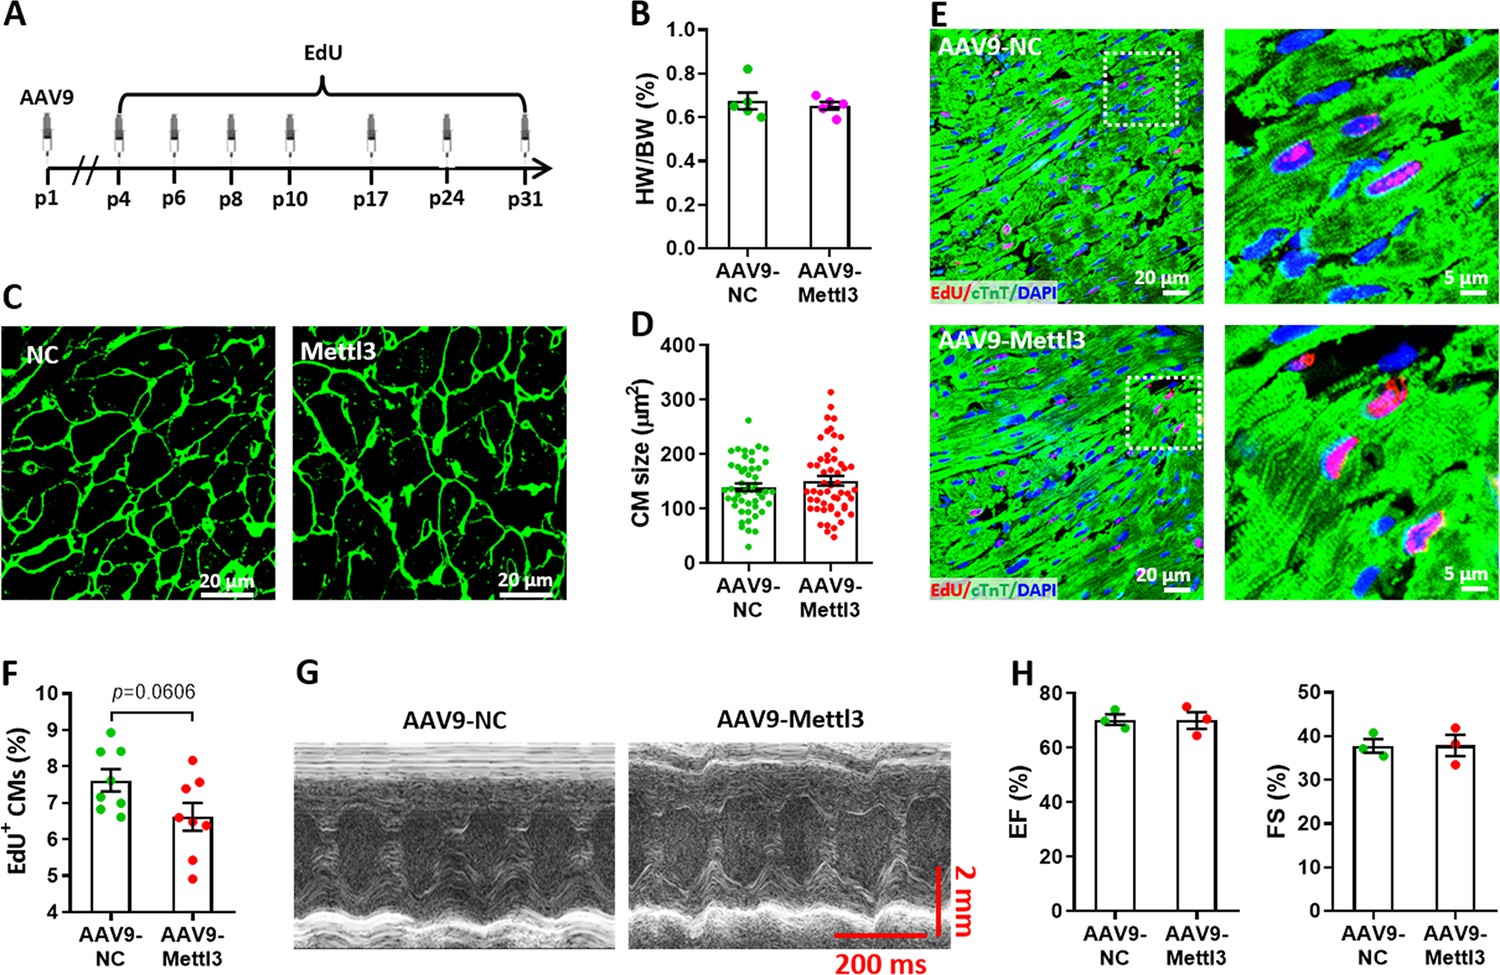
Effects of Mettl3 overexpression on heart regeneration in postnatal mice without injury at p31.
(A) Schematic of AAV9-Mettl3 virus injection and EdU-pulse injection in homeostatic postnatal hearts without injury. (B) Quantification of heart weight (HW) to body weight (BW) ratio (n=5 hearts per group). (C) Representative WGA staining images of myocardium in control and Mettl3-deficient hearts. (D) Quantification of cardiomyocyte size in control and Mettl3-overexpressing hearts are shown (n=~150 cells from 5 hearts per group). (E and F) Representative images (E) and quantification (F) of EdU+ cardiomyocytes in ventricles at p31 (n=8 hearts per group). (G and H) Representative images of M-model echocardiography (G) and quantification of LVEF (H, left) and LVFS (H, right) are shown (n=3 hearts per group). All data are presented as the mean ± SEM. p values were determined by 2-tailed Student’s t-test.
Figure 6 with 1 supplement
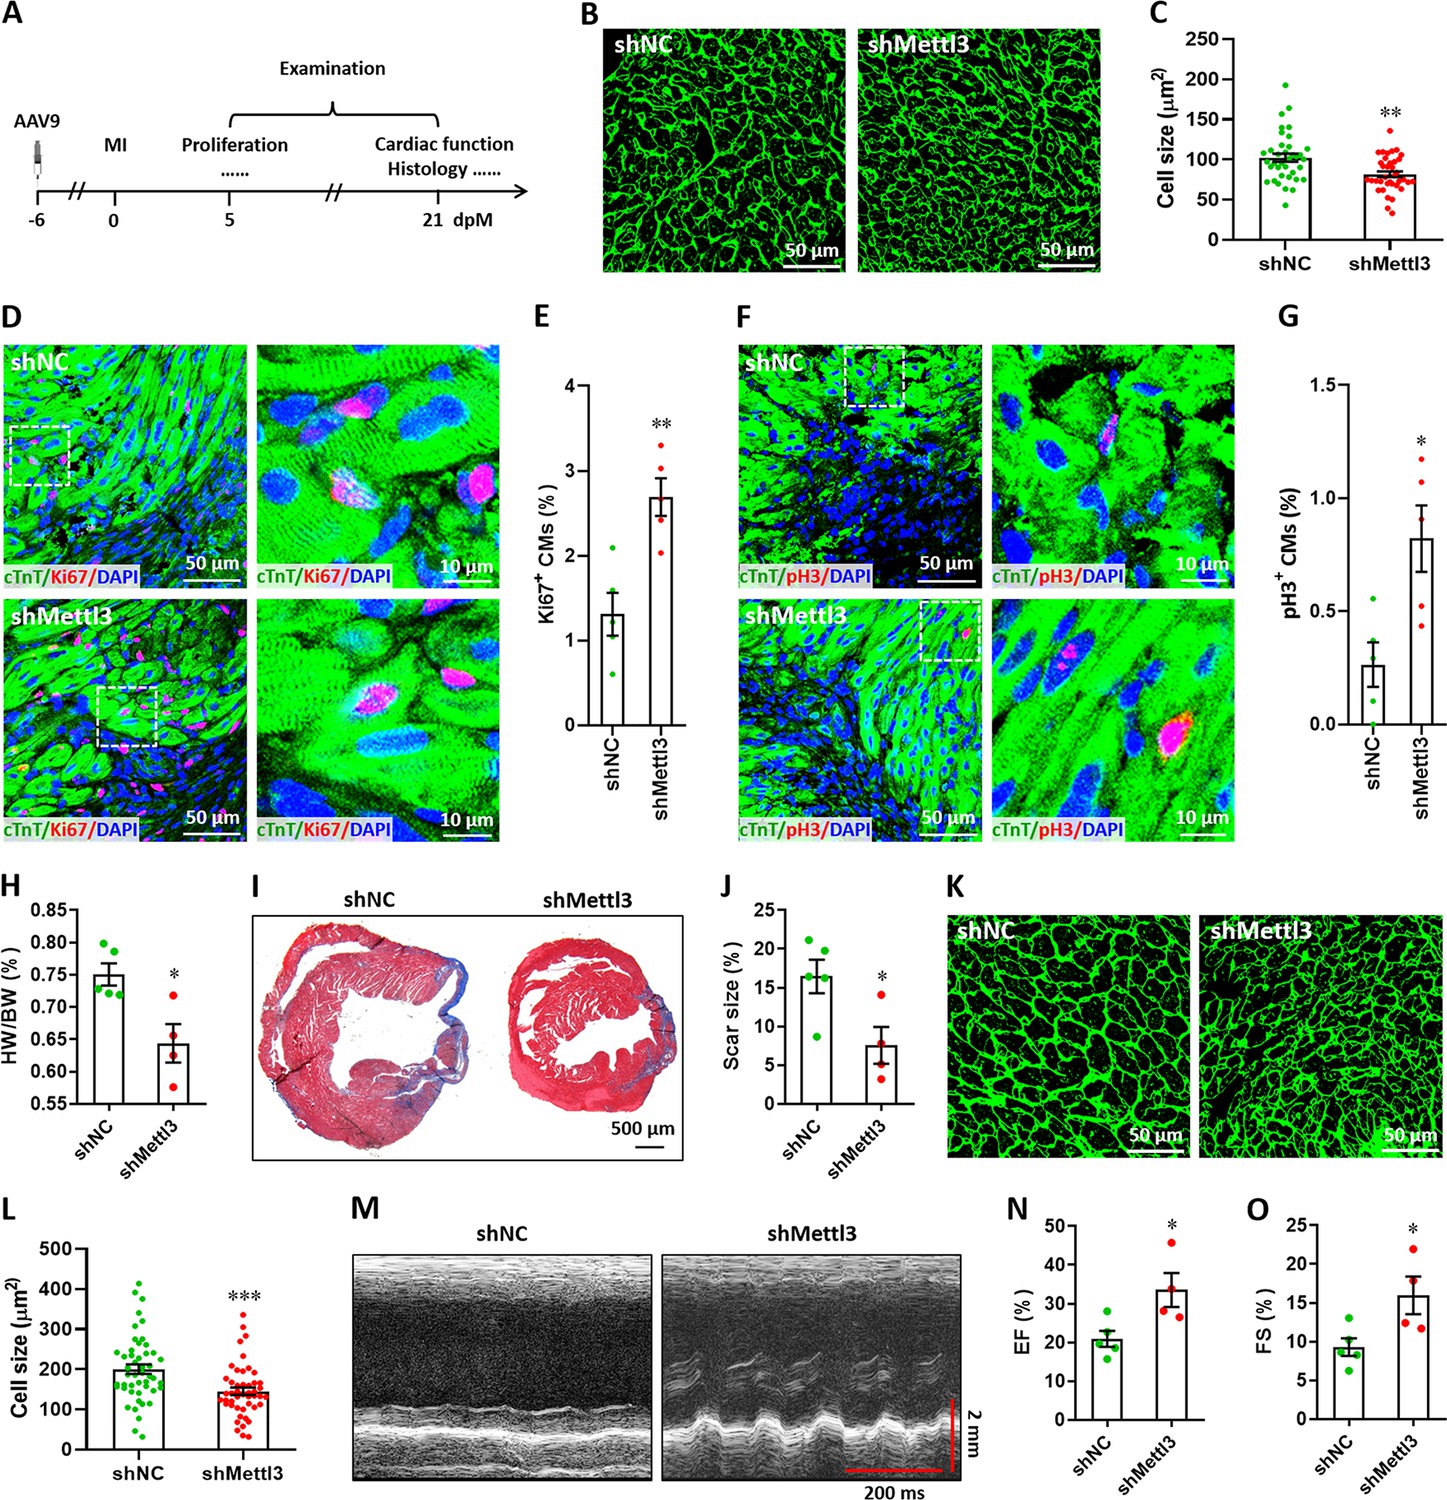
Mettl3 deficiency promotes heart regeneration in postnatal mice injured at p7.
(A) Schematic of AAV9 virus injection at p1, myocardium infarction (MI) induction at p7, and histological analysis at 5 and 21 dpM. (B and C) Representative WGA staining images (B) and quantification of cardiomyocyte size (C) in control and Mettl3-deficient hearts at 5 dpM (n=~100 cells from 5 hearts). (D and E) Representative images (D) and quantification (E) of Ki67+ cardiomyocytes in the border zone of injured hearts at 5 dpM (n=5 hearts). (F and G) Representative images (F) and quantification (G) of pH3+ cardiomyocytes in the border zone of injured hearts at 5 dpM (n=5 hearts). (H) Quantification of heart weight (HW) to body weight (BW) ratio at 21 dpM (n=5 hearts). (I and J) Representative masson’s trichrome staining images (I) and quantification of scar size (J) in control and Mettl3-deficient hearts at 21 dpM (n=5 hearts). (K and L) Representative WGA staining images (K) and quantification of cardiomyocyte size (L) in control and Mettl3-deficient hearts at 21 dpM (n=~100 cells from 5 hearts). (M–O) Representative images of M-model echocardiography (M) and quantification of LVEF (N) and LVFS (O) are shown at 21 dpM (n=5 hearts). All data are presented as the mean ± SEM, *p<0.05, **p<0.01, ***p<0.001 versus control. p values were determined by 2-tailed Student’s t-test.
Figure 6—figure supplement 1
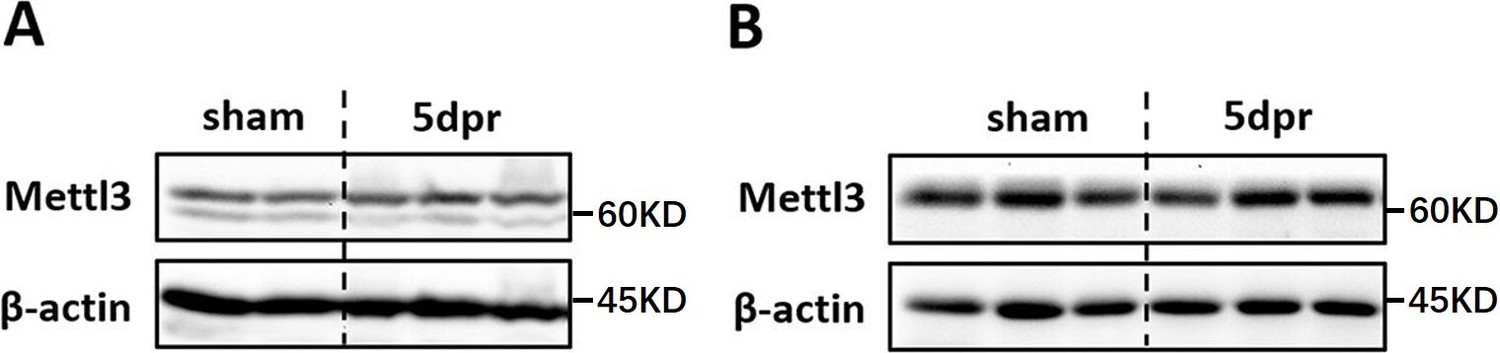
Mettl3 expression in postnatal and adult hearts upon myocardium infarction injury.
(A) Western blotting validation of Mettl3 expression in the injured heart at 5 dpM following MI injury performed in postnatal mice at p7. (B) Western blotting validation of Mettl3 expression in the injured heart at 5 dpM following MI injury performed in adult mice.
-
Figure 6—figure supplement 1—source data 1
Western blot for Figure 6—figure supplement 1A showing Mettl3 expression.
- https://cdn.elifesciences.org/articles/77014/elife-77014-fig6-figsupp1-data1-v1.zip
-
Figure 6—figure supplement 1—source data 2
Western blot for Figure 6—figure supplement 1A showing β-actin expression.
- https://cdn.elifesciences.org/articles/77014/elife-77014-fig6-figsupp1-data2-v1.zip
-
Figure 6—figure supplement 1—source data 3
Western blot for Figure 6—figure supplement 1B showing Mettl3 expression.
- https://cdn.elifesciences.org/articles/77014/elife-77014-fig6-figsupp1-data3-v1.zip
-
Figure 6—figure supplement 1—source data 4
Western blot for Figure 6—figure supplement 1B showing β-actin expression.
- https://cdn.elifesciences.org/articles/77014/elife-77014-fig6-figsupp1-data4-v1.zip
Figure 7

Mettl3 deficiency promotes heart regeneration in adult mice upon myocardium infarction injury.
(A) Schematic of AAV9 virus injection 4 weeks prior to myocardium infarction (MI), followed by histological analysis at 14 and 28 dpM. (B) Representative images of reporter gene (EGFP) expression mediated by AAV9-shMettl3 virus in heart at 0 dpM. (C) Quantification of heart weight (HW) to body weight (BW) ratio at 14 dpM (n=6 hearts). (D and E) Representative masson’s trichrome staining images (D) and quantification of scar size (E) in control and Mettl3-deficient hearts at 14 dpM (n=8 hearts). (F) Quantification of HW to BW ratio at 28 dpM (n=6 hearts). (G and H) Representative masson’s trichrome staining images (G) and quantification of scar size (H) in control and Mettl3-deficient hearts at 28 dpM (n=8 hearts). (I–K) Representative images of M-model echocardiography (I) and quantification of LVEF (J) and LVFS (K) are shown at 0 and 28 dpM (n=6 hearts). (L and M) Representative images (L) and quantification (M) of Ki67+ cardiomyocytes in the border zone of injured hearts at 14 dpM (n=7 hearts). (N and O) Representative images (N) and quantification (O) of Ki67+ cardiomyocytes in the remote zone of injured hearts at 14 dpM (n=7 hearts). All data are presented as the mean ± SEM, *p<0.05, ***p<0.001. P values were determined by 2-tailed Student’s t-test (C, E, F, H, M, and O), or by 2-way ANOVA with Dunnett’s multiple-comparison test (J and K).
Figure 8 with 8 supplements
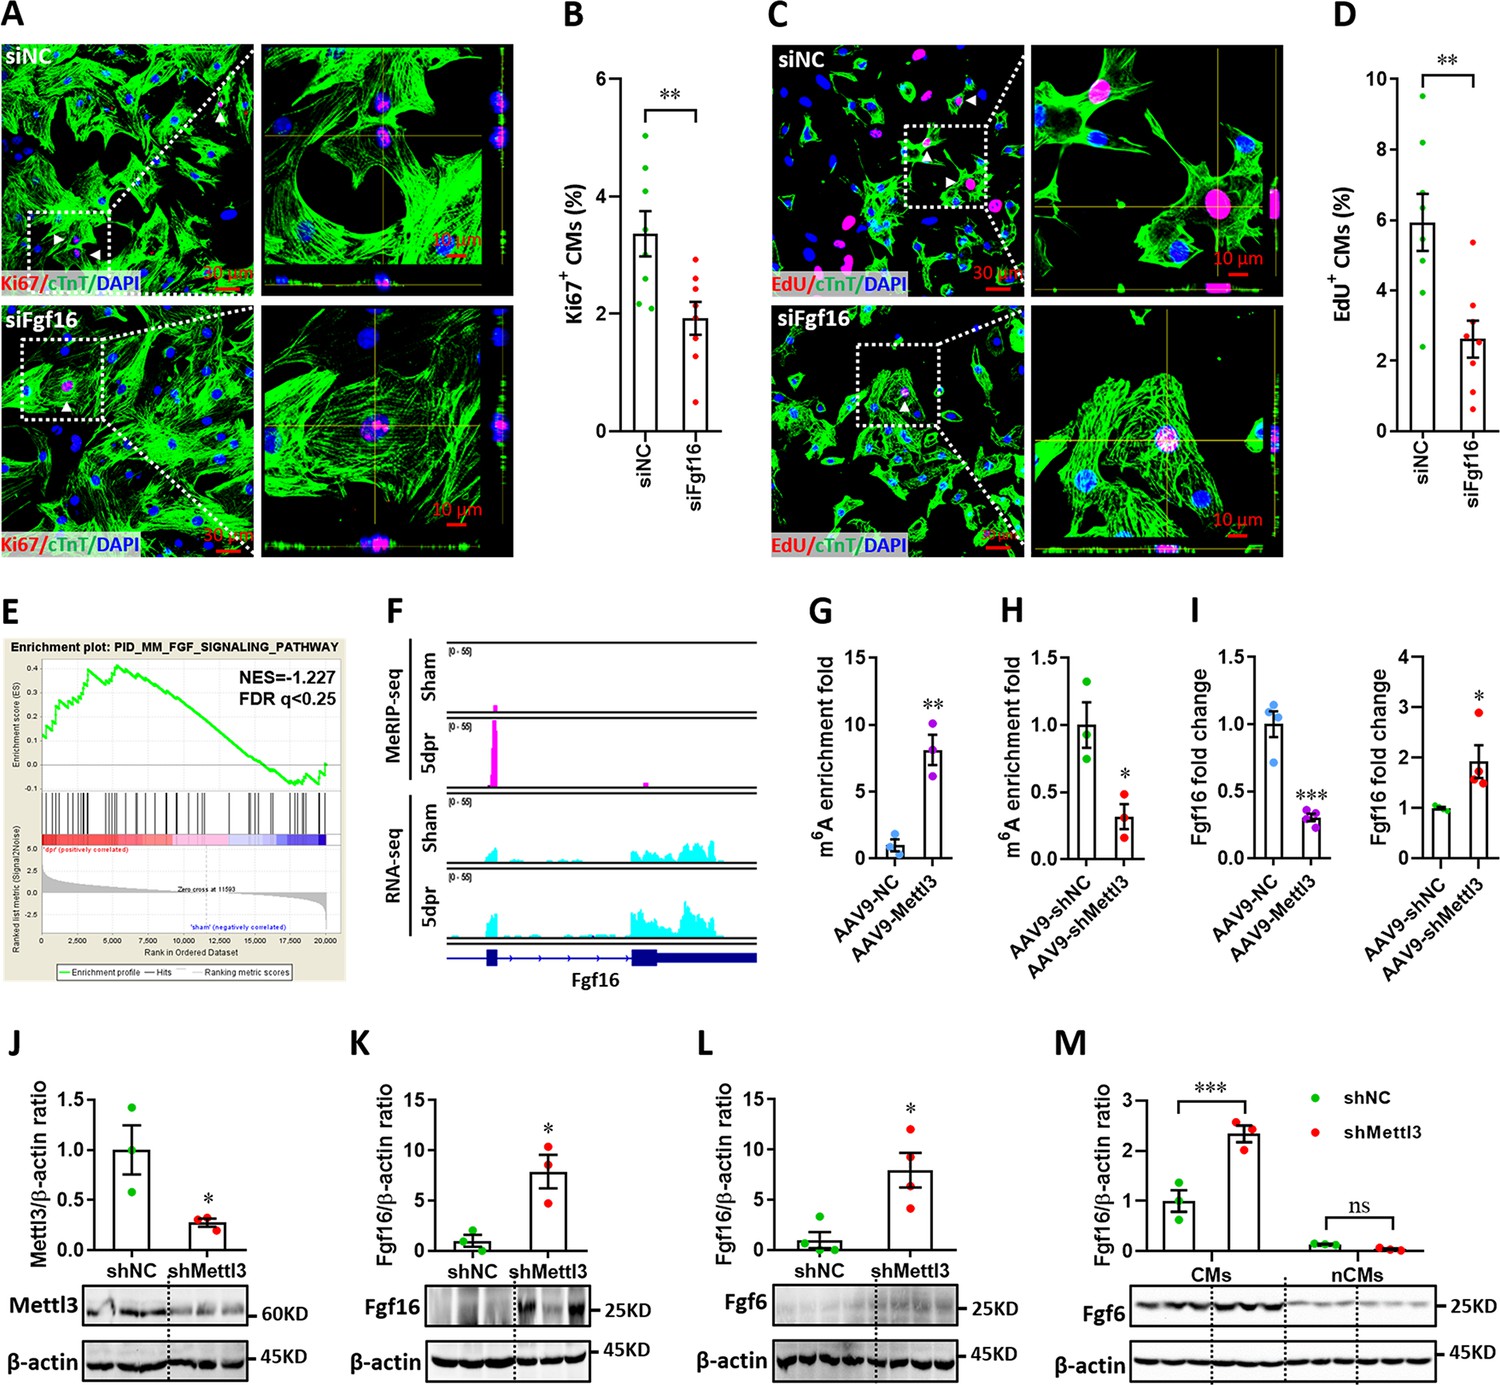
Mettl3-mediated m6A post-transcriptionally regulates Fgf16 during neonatal heart regeneration.
(A and B) Primary cardiomyocytes were transfected with siFgf16 and siNC for 48 hr, followed by Ki67 (red) and cTnT (green) double staining. Representative images (A) and quantification (B) of Ki67+ cardiomyocytes are shown (n=8). Right panel (A), magnified Z-stack confocal images. (C and D) Primary cardiomyocytes were transfected with siFgf16 and siNC for 48 hr, followed by EdU incorporation assay. Representative images (C) and quantification (D) of EdU+ cardiomyocytes are shown (n=8). Right panel (C), magnified Z-stack confocal images. (E) GSEA analysis indicated the involvement of Fgf pathway in neonatal heart regeneration. (F) Representative IGV plots of mouse MeRIP-seq (upper panel) and RNA-seq (lower panel) reads for Fgf16. (G and H) MeRIP-qPCR quantification of m6A enrichment in Fgf16 mRNA in Mettl3-overexpressing (G) and Mettl3-silencing (H) hearts at 5 dpr (n=3 hearts). (I) qPCR validation of Fgf16 in the injured hearts with AAV9 virus injection at 5 dpr (n=4 hearts). (J and K) AAV9-shMettl3 viruses were injected into neonatal mice at p1, followed by apex resection at p3 and samples collection at 5dpr. Mettl3 knockdown (J, n=3 hearts) and Fgf16 expression (K, n=3 hearts) in neonatal hearts at 5 dpr were then validated by western blotting. (L) Validation of Fgf16 protein expression in homeostatic neonatal hearts at p8 after AAV9-shMettl3 injection at p1 (n=4 hearts). (M) Neonatal mice were injected with AAV9-shMettl3 virus at p1 and resected at p3. Fgf16 expression in primary cardiomyocytes (CMs) and non-cardiomyocytes (nCMs) isolated at 5 dpr were then validated by western blotting (n=3). All data are presented as the mean ± SEM, *p<0.05, **p<0.01, ***p<0.001 versus control. p values were determined by 2-tailed Student’s t-test (A–L), or by 2-way ANOVA with Dunnett’s multiple-comparison test (M).
-
Figure 8—source data 1
Western blot for Figure 8J showing Mettl3 expression.
- https://cdn.elifesciences.org/articles/77014/elife-77014-fig8-data1-v1.zip
-
Figure 8—source data 2
Western blot for Figure 8J showing β-actin expression.
- https://cdn.elifesciences.org/articles/77014/elife-77014-fig8-data2-v1.zip
-
Figure 8—source data 3
Western blot for Figure 8K showing Fgf16 expression.
- https://cdn.elifesciences.org/articles/77014/elife-77014-fig8-data3-v1.zip
-
Figure 8—source data 4
Western blot for Figure 8K showing β-actin expression.
- https://cdn.elifesciences.org/articles/77014/elife-77014-fig8-data4-v1.zip
-
Figure 8—source data 5
Western blot for Figure 8L showing Fgf16 expression.
- https://cdn.elifesciences.org/articles/77014/elife-77014-fig8-data5-v1.zip
-
Figure 8—source data 6
Western blot for Figure 8L showing β-actin expression.
- https://cdn.elifesciences.org/articles/77014/elife-77014-fig8-data6-v1.zip
-
Figure 8—source data 7
Western blot for Figure 8M showing Fgf16 expression.
- https://cdn.elifesciences.org/articles/77014/elife-77014-fig8-data7-v1.zip
-
Figure 8—source data 8
Western blot for Figure 8M showing β-actin expression.
- https://cdn.elifesciences.org/articles/77014/elife-77014-fig8-data8-v1.zip
Figure 8—figure supplement 1

Variations of m6A-tagged transcripts in neonatal heart in response to injury.
(A) Predominant consensus motif GGACU was detected basing on m6A-seq in both the sham and injured hearts at 5 dpr. (B) Distribution of m6A peaks along the 5’ untranslated region (5’UTR), coding region (CDS), and 3’ untranslated region (3’UTR) of total mRNAs from sham and apex-resected hearts. (C) Proportion of m6A peaks distribution in the 5’UTR, CDS, 3’UTR, and noncoding regions across the entire set of mRNA transcripts. Up panel denotes total peak distribution, down panel denotes unique peak distribution. (D) Venn diagrams showing the total m6A peaks (up panel) and m6A-tagged transcripts (low panel) between sham-operated and apex-resected hearts. (E) Numbers of the differently methylated genes with 2-fold or above change of m6A-tagging in the apex-resected hearts compared with sham. (F) A cluster profiler identified the enriched gene ontology processes of these 635 genes with upregulation of m6A modification.
Figure 8—figure supplement 2

Apex resection upregulates levels of m6A-tagged transcripts in neonatal hearts.
(A) Venn diagrams showing the overlap of m6A-tagged transcripts between two replicates in sham and 5dpr. (B) Total MeRIP bound reads from MeRIP-seq. (C) Venn diagrams of m6A-tagged transcripts identified by MeRIP-seq in neonatal hearts under sham and 5dpr conditions. (D) GO enrichment analyses of overlapped 1,053 genes between sham and 5dpr (related to C). (E) GO enrichment analyses of 1,458 genes specifically tagged in 5dpr (related to C).
Figure 8—figure supplement 3

PCA, volcano plot, and GSEA analysis from RNA-seq data.
(A) Principle component analysis (PCA) plot based on the RNA-seq data from control (sham) and injured hearts at 5 dpr. (B) Volcano plot for differentially expressed genes in the tests of neonatal hearts at 5 dpr versus uninjured controls. The red point in the plot represents the differentially expressed genes with statistical significance (FC >1.5, Probability >0.8). 3213 upregulated and 809 downregulated genes passed the volcano plot filtering. (C and D) GSEA analysis based on RNA-seq reveals that cardiac muscle cell development (C) and proliferation (D) gene sets are related to neonatal heart regeneration.
Figure 8—figure supplement 4

Identification of cell cycle and proliferation-related target genes from the overlapped gene sets between m6A-tagged and RNA-upregulated genes.
(A) Venn diagrams showing the overlapped 333 genes between m6A-tagged and upregulated transcripts in neonatal hearts at 5dpr. (B) GO enrichment analyses of the overlapped 333 genes. (C) Heat map of mRNA expression of the cell cycle and proliferation-related genes from GO enrichment terms (n=3 hearts). (D and E) Quantification of mRNA expression of cell cycle- (D) and proliferation-related (E) genes from RNA-seq data. Dotted line indicates 2-fold upregulation. (F) Upregulated genes with more than 2-fold exchanges in RNA-seq (D and E) were further validated by qPCR in the injured hearts (n=5 hearts). (G) qPCR validation of siRNAs targeting for Mis12, Fgf16, and Six5 genes in H9c2 cells (n=3). (H–J) H9c2 cells transfected with siRNAs for 48 hr were subjected to flow cytometry. Representative images (H) and quantification (I, J) of cell cycle distribution are shown (n=3). Data are presented as the mean ± SEM, *p<0.05, **p<0.01 versus sham (F) or controls (J, I, and J). p values were determined by 1-way (G and J) or 2-way (F and I) ANOVA with Dunnett’s multiple-comparison test.
Figure 8—figure supplement 5

Luciferase reporter assay for Mettl3-mediated Fgf16 expression.
(A) Map of reporter plasmid for subcloning wild-type or m6A consensus sequence mutant Fgf16 cDNA to fuse with Gaussia luciferase reporter gene. (B and C) Quantification of relative luciferase activity (B, n=5) and mRNA level (C, n=4) in H9c2 cells with or without Mettl3 overexpression. All data are presented as the mean ± SEM, *p<0.05, **p<0.01 versus control. p values were determined by 1-way ANOVA with Dunnett’s multiple-comparison test.
Figure 8—figure supplement 6

Effects of Fgf16 knockdown on Mettl3-mediated regulation of CM proliferation and heart regeneration.
(A and B) Primary cardiomyocytes were transfected with siMettl3 with or without siFgf16 for 48 hr, followed by Ki67 (red) and cTnT (green) double staining. Representative images (A) and quantification (B) of Ki67+ cTnT+ cells are shown (n=5). (C) Schematic of AAV9-shMettl3 and AAV9-shFgf16 virus injection in neonatal hearts at p1. (D and E) Representative images (D) and quantification (E) of Ki67-positive CMs at 5 dpr (n=5 hearts). (F and G) Representative masson’s trichrome staining images (F) and quantification of scar size (G) at 14 dpr (n=5 hearts). (H–J) Representative images of M-model echocardiography (H) and quantification of LVEF (I) and LVFS (J) are shown at 14 dpr (n=5 hearts). All data are presented as the mean ± SEM, *p<0.05, **p<0.01 versus control. p values were determined by 1-way ANOVA with Dunnett’s multiple-comparison test.
Figure 8—figure supplement 7
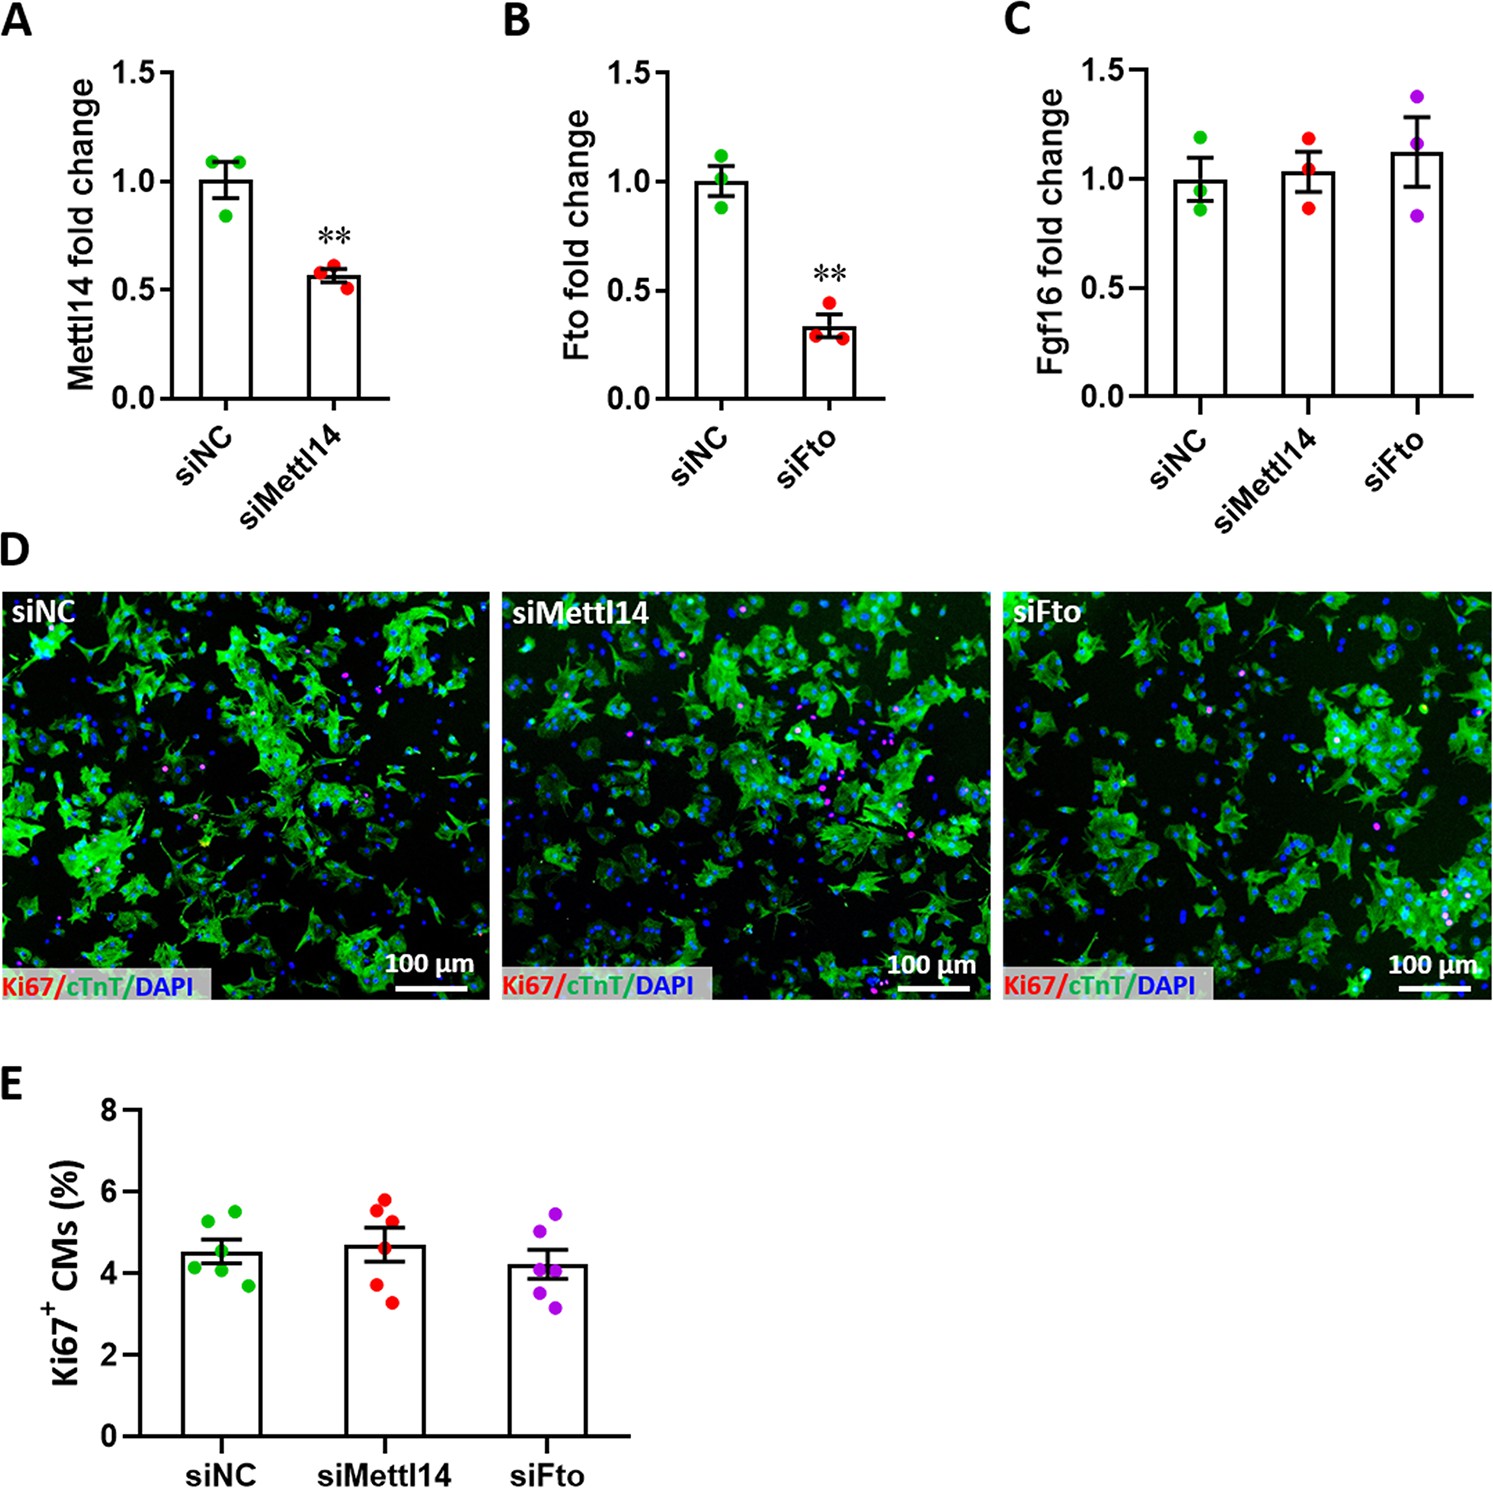
Effects of Mettl14 and Fto on Fgf16 expression and cell proliferation in CMs.
(A–C) qPCR validation of Mettl14 (A), Fto (B), and Fgf16 (C) in primary cardiomyocytes treated with siMettl14 and/or siFto for 48 hr (n=3). (D and E) Representative images (D) and quantification (E) of Ki67-positive cardiomyocytes upon treated with siMettl14 and siFto for 48 hr (n=3). All data are presented as the mean ± SEM, **p<0.01 versus control. p values were determined by 2-tailed Student’s t-test (A and B), or by 1-way (C and E) ANOVA with Dunnett’s multiple-comparison test.
Figure 8—figure supplement 8
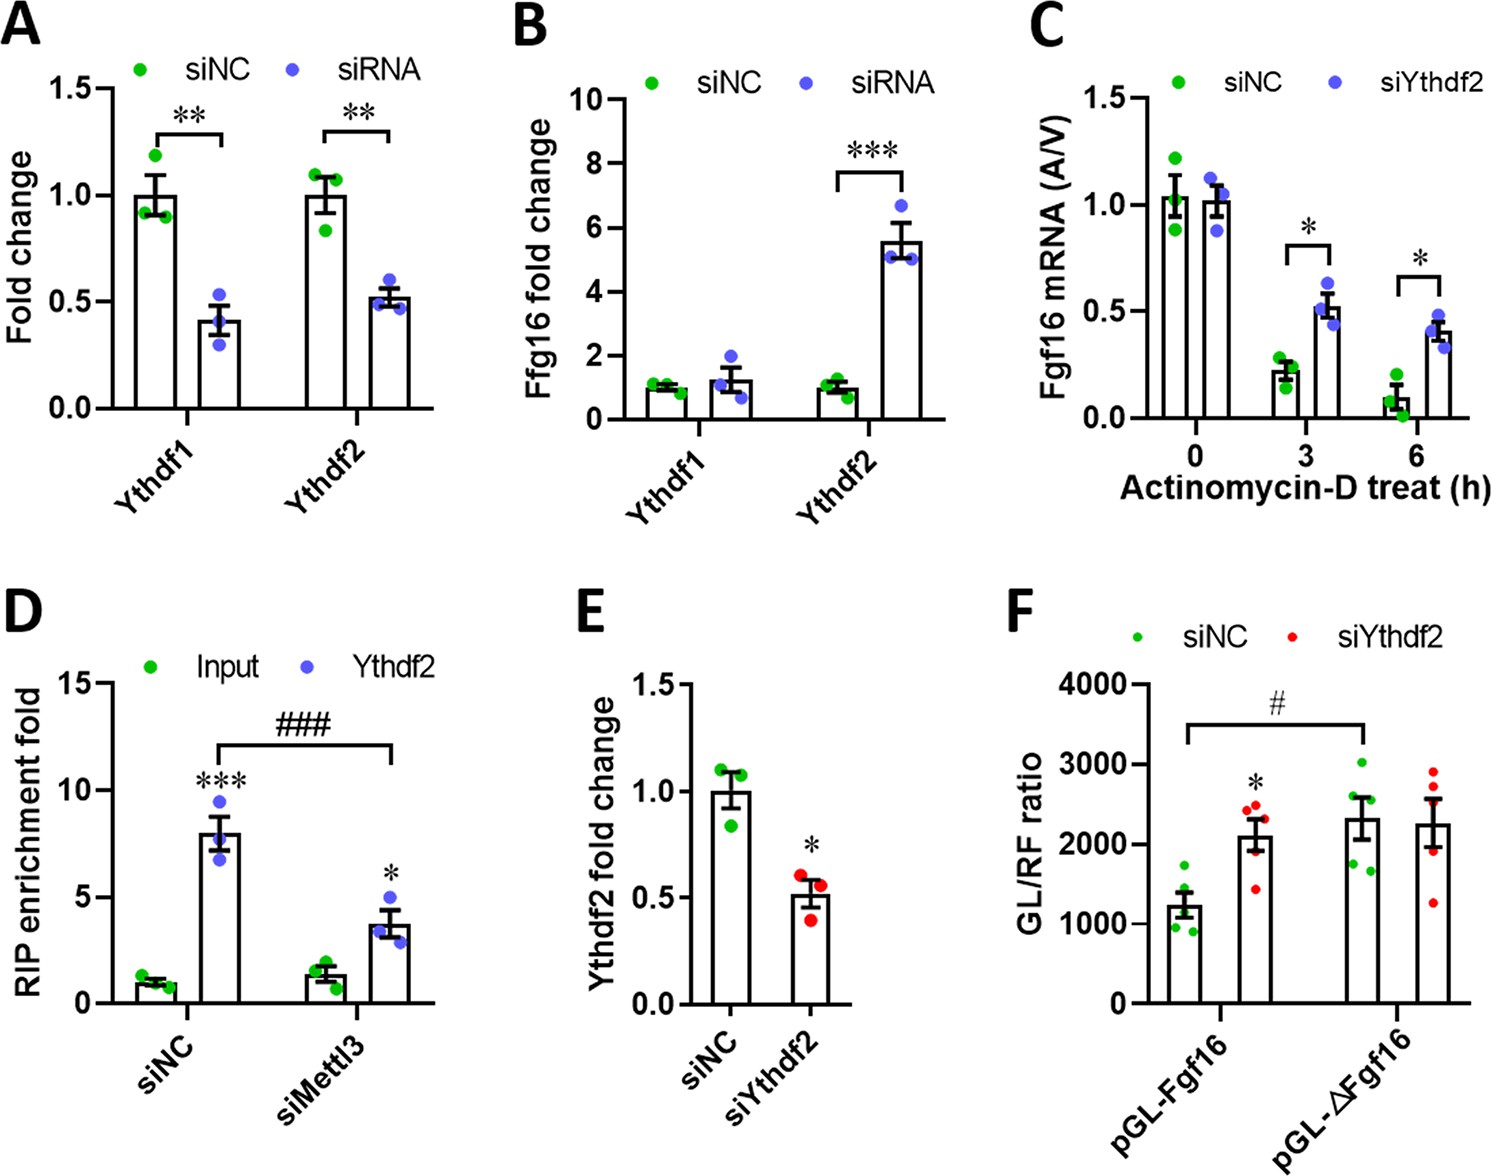
Mettl3 regulates Fgf16 expression in an Ythdf2-dependent manner.
(A) qPCR validation of Ythdf1 and Ythdf2 silencing in primary cardiomyocytes (n=3). (B) qPCR validation of Fgf16 in primary cardiomyocytes transfected with siYthdf1 or siYthdf2, respectively (n=3). (C) Primary cardiomyocytes were transfected with siRNAs for 48 hr and treated with vehicle or Actinomycin-D for 0–6 hr, followed by qPCR validation to determine the A/V ratio of Fgf16 mRNA (n=3). (D) Ythdf2-RIP-qPCR analysis of Fgf16 mRNA in primary cardiomyocytes transfected with siNC and siMettl3, respectively (n=3). (E) qPCR validation of Ythdf2 silencing in H9c2 cells (n=3). (F) Wild-type and mutant reporter plasmids were respectively transfected into H9c2 cells treated with or without siYthdf2 for 48 hr. Relative luciferase activity was then quantified (n=5). All data are presented as the mean ± SEM, *p<0.05, **p<0.01, ***p<0.001, #p<0.05, ###p<0.001 versus control. p values were determined by 2-tailed Student’s t-test (E), or by 2-way (A-D, and F) ANOVA with Dunnett’s multiple-comparison test.
Figure 9
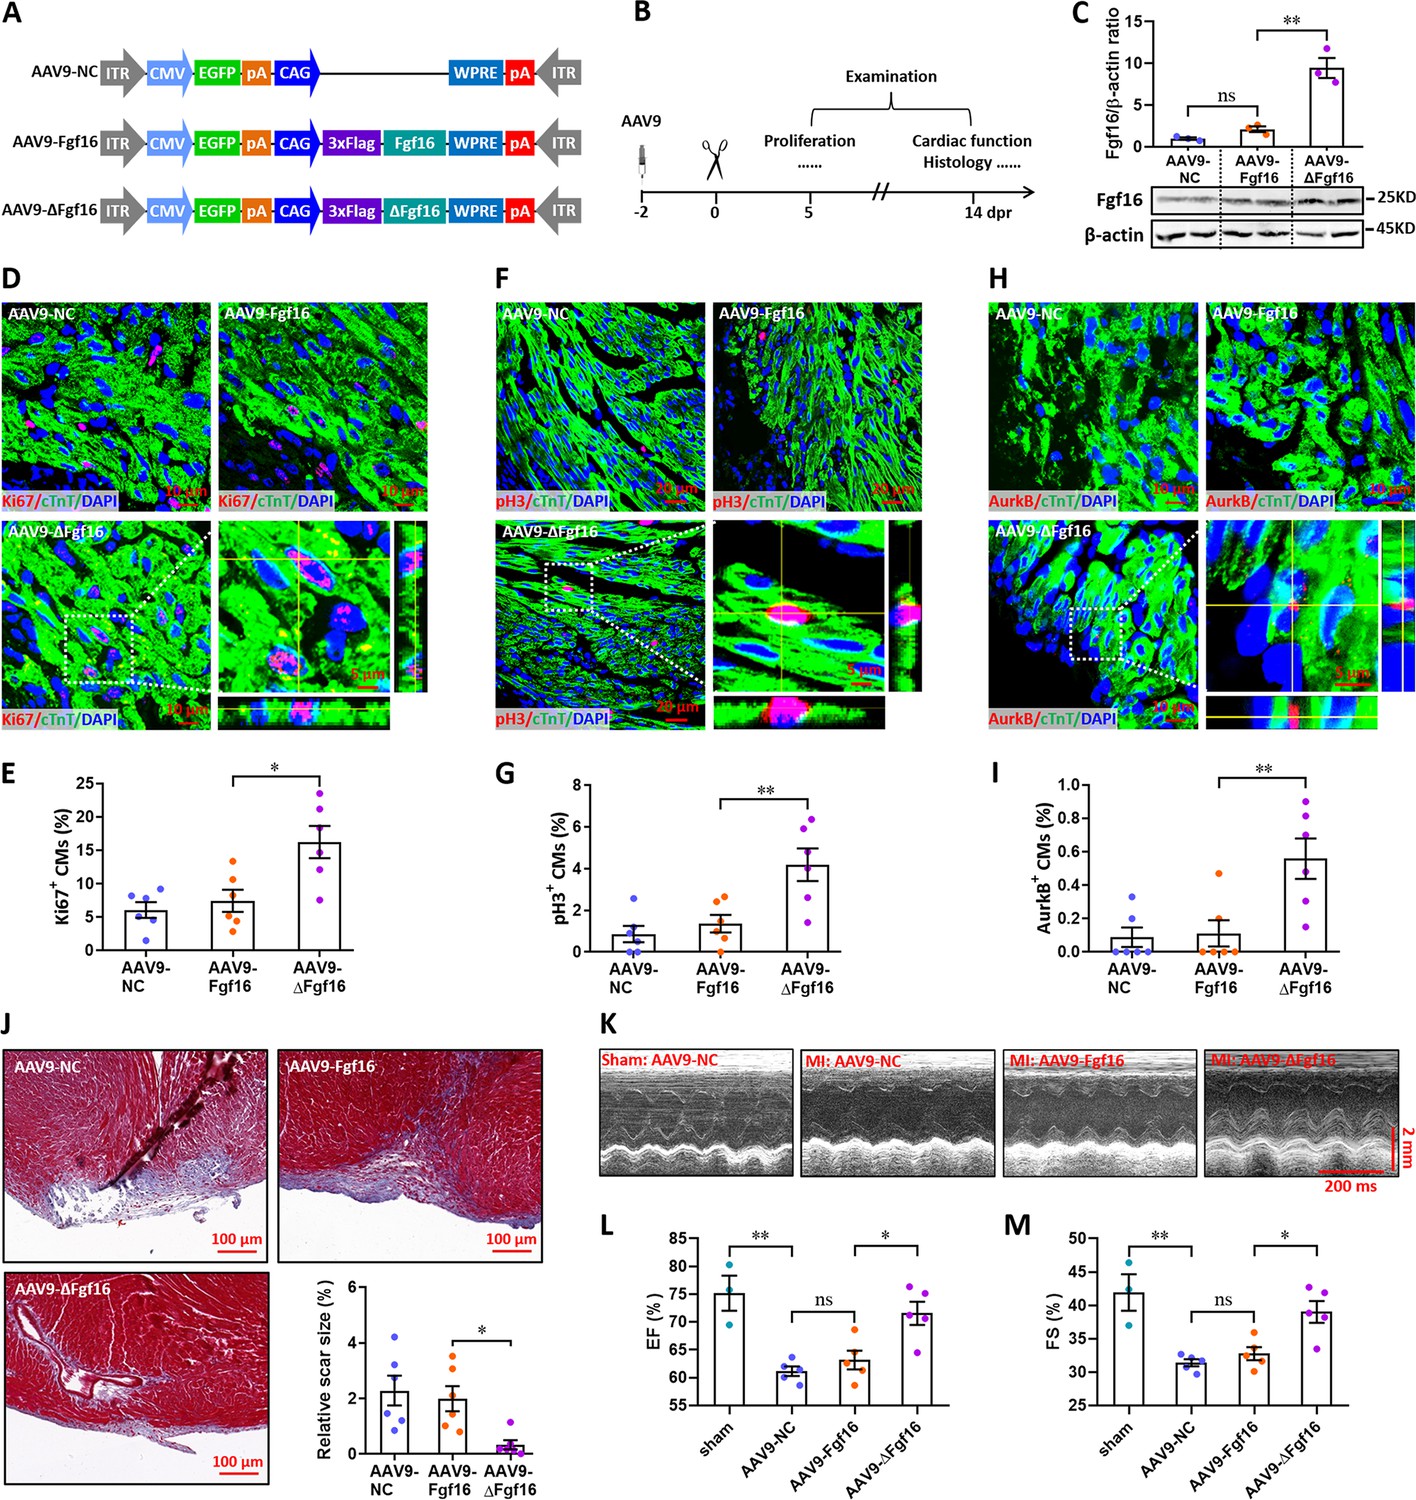
Mutation of the consensus sequence of m6A modification in Fgf16 mRNA promotes heart regeneration.
(A) Schematic of AAV9 vectors for the expression of negative control (AAV9-NC), wild-type Fgf16 (AAV9-Fgf16), and mutant Fgf16 (AAV9-ΔFgf16). (B) Schematic of AAV9 virus injection, apex resection, and sample collection in neonatal mice. (C) Representative images (lower panel) and quantification (upper panel) of Western blotting validation of Fgf16 protein expression in neonatal hearts at 5 dpr (n=3 hearts). (D and E) Representative images (D) and quantification (E) of Ki67+ cardiomyocytes in apical ventricle at 5 dpr (n=6 hearts). Right lower panel (D), magnified Z-stack confocal image of Ki67+ cardiomyocyte. (F and G) Representative images (F) and quantification (G) of pH3+ cardiomyocytes in apical ventricle at 5 dpr (n=6 hearts). Right lower panel (F), magnified Z-stack confocal image of pH3+ cardiomyocyte. (H and I) Representative images (H) and quantification (I) of AurkB+ cardiomyocytes in apical ventricle at 5 dpr (n=6 hearts). Right lower panel (H), magnified Z-stack confocal image of AurkB+ cardiomyocyte. (J) Representative masson’s trichrome staining images of cardiac apex and quantification of scar size in hearts at 14 dpr (n=6 hearts). (K–M) Representative images of M-model echocardiography (K) and quantification of LVEF (L) and LVFS (M) are shown at 14 dpr (n=3 mice for sham, and 5 mice for each injured group). All data are presented as the mean ± SEM, *p<0.05, **p<0.01 versus control, ns means no significant difference. p values were determined by 1-way ANOVA with Dunnett’s multiple-comparison test.
-
Figure 9—source data 1
Western blot for Figure 9C showing Fgf16 expression.
- https://cdn.elifesciences.org/articles/77014/elife-77014-fig9-data1-v1.zip
-
Figure 9—source data 2
Western blot for Figure 9C showing β-actin expression.
- https://cdn.elifesciences.org/articles/77014/elife-77014-fig9-data2-v1.zip
Additional files
-
Transparent reporting form
- https://cdn.elifesciences.org/articles/77014/elife-77014-transrepform1-v1.docx
-
Supplementary file 1
Sequences of siRNAs used in this study.
- https://cdn.elifesciences.org/articles/77014/elife-77014-supp1-v1.docx
-
Supplementary file 2
Primer sequences for real-time PCR analysis in mouse.
- https://cdn.elifesciences.org/articles/77014/elife-77014-supp2-v1.docx
-
Supplementary file 3
Primer sequences for real-time PCR analysis in H9c2 cells.
- https://cdn.elifesciences.org/articles/77014/elife-77014-supp3-v1.docx
-
Supplementary file 4
Full plasmid sequence of the pGL-RF vector.
- https://cdn.elifesciences.org/articles/77014/elife-77014-supp4-v1.docx
Download links
A two-part list of links to download the article, or parts of the article, in various formats.
Downloads (link to download the article as PDF)
Open citations (links to open the citations from this article in various online reference manager services)
Cite this article (links to download the citations from this article in formats compatible with various reference manager tools)
Mettl3-mediated m6A modification of Fgf16 restricts cardiomyocyte proliferation during heart regeneration
eLife 11:e77014.
https://doi.org/10.7554/eLife.77014


