Conservation and divergence of myelin proteome and oligodendrocyte transcriptome profiles between humans and mice
- Department of Neurogenetics, Max Planck Institute for Multidisciplinary Sciences, Germany
- Neuroproteomics Group, Department of Molecular Neurobiology, Max Planck Institute for Multidisciplinary Sciences, Germany
- Translational Neuroproteomics Group, Department of Psychiatry and Psychotherapy, University Medical Center Göttingen, Georg-August-University, Germany
- University of Amsterdam, Swammerdam Institute for Life Sciences, Brain Plasticity Group, Netherlands
- Neuroimmunology Group, Netherlands Institute for Neuroscience, Netherlands
- Electron Microscopy Unit, Max Planck Institute for Multidisciplinary Sciences, Germany
Figures
Figure 1 with 3 supplements
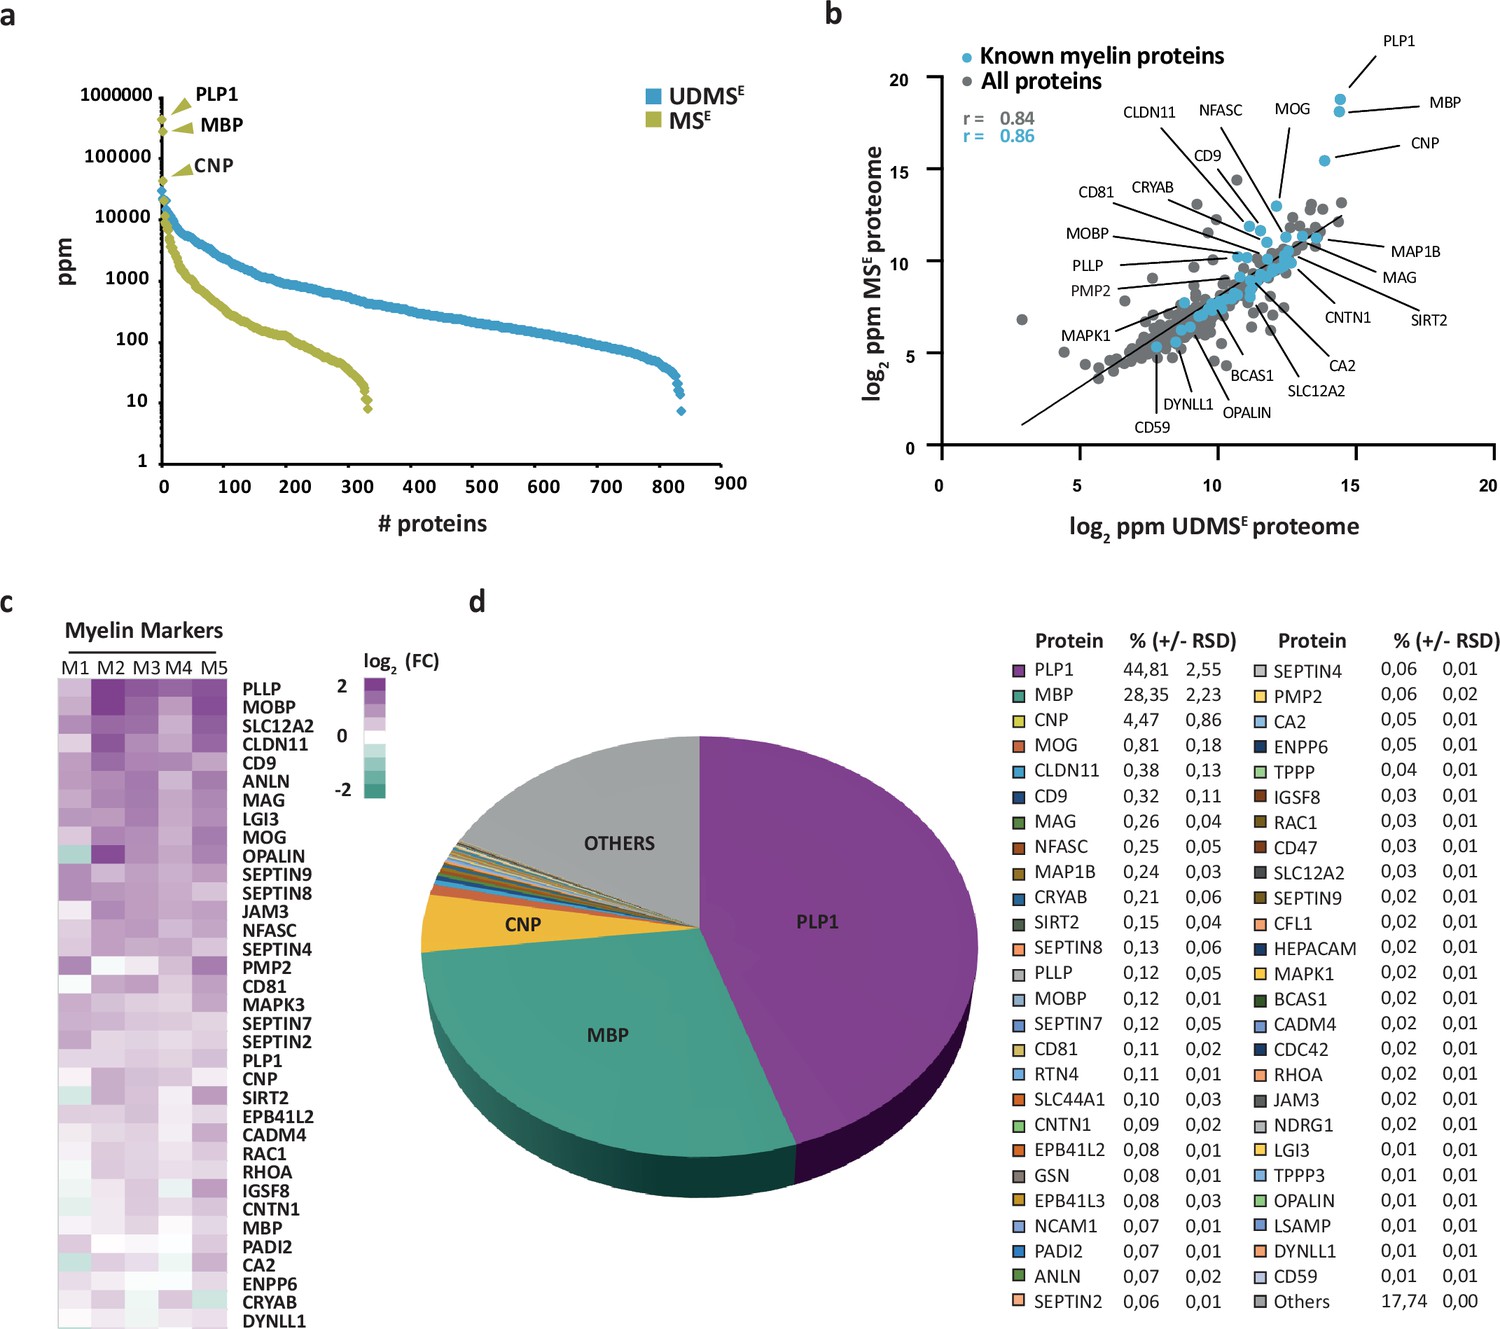
Proteome analysis of human central nervous system (CNS) myelin.
(a) Number and relative abundance of proteins identified in myelin purified from human normal-appearing white matter according to two data-independent acquisition (DIA) mass spectrometric modes (MSE, UDMSE). Note that UDMSE (blue) identifies a larger number of proteins in myelin but provides a lower dynamic range of quantification. MSE (lime green) identifies fewer proteins, but the comparatively higher dynamic range of quantification provides information about the relative abundance of the exceptionally abundant myelin proteins proteolipid protein 1 (PLP1), myelin basic protein (MBP), and cyclic nucleotide phosphodiesterase (CNP). See Figure 1—source data 1 for datasets. ppm, parts per million. (b) Scatter plot comparing the log2-transformed relative abundance of proteins identified in myelin by MSE against their abundance as identified by UDMSE. Data points highlighted in blue represent known myelin proteins, some of which are indicated. The correlation coefficient (r) was calculated for all proteins identified by MSE (gray) and known myelin proteins (blue). The regression line serves as navigational mean. Note that PLP, MBP, and CNP deviate the most from the regression line due to the limitations of UDMSE in the correct quantification of such exceptionally abundant myelin proteins. (c) Heatmap comparing the relative abundance of known myelin proteins in purified myelin compared to white matter homogenate. Mass spectrometric quantification based on five biological replicates (M1, M2, M3, M4, M5) as the average of two technical replicates each. Each horizontal line displays the fold change (FC) of a known myelin protein of which the abundance is increased (magenta) or reduced (turquoise) in human myelin compared to its average abundance in white matter lysate plotted on a log2 color scale. As to the technical quality of the proteomic data and the purity of the myelin fraction, also see Pearson’s correlation coefficients in Figure 1—figure supplement 2 and heatmap comparisons for marker proteins representing other cell types and organelles in Figure 1—figure supplement 3. (d) Pie chart showing the relative abundance of proteins identified by MSE in myelin purified from the human white matter. Relative abundance is given in percentage with relative standard deviation (% ±RSD). Note that known myelin proteins constitute approximately 82% of the total myelin protein; proteins so far not known as myelin proteins constitute about 18%.
-
Figure 1—source data 1
Label-free quantification of proteins in human central nervous system (CNS) myelin and white matter homogenate by two different data acquisition modes.
Identification and quantification data of detected myelin-associated and homogenate proteins. Tryptic peptides derived from two technical replicates (replicate digestion) per five biological replicates were analyzed by liquid chromatography–mass spectrometry (LC-MS) (10 runs per condition in total). Proteins (false discovery rate [FDR] < 1%; two peptides/protein) and peptides (FDR < 1%; ≥6 amino acids) were identified by database search against the UniProtKB/SwissProt mouse database using ProteinLynx Global Server (PLGS). Data were postprocessed with the software package ISOQuant to calculate absolute in-sample amounts for each detected protein based on the TOP3 approach. Reported abundance values are defined as the relative amount of each protein with respect to the sum over all detected proteins (ppm, parts per million [w/w] of total protein). Typical contaminant proteins like albumin, hemoglobins, keratins, and trypsin were filtered. Tables are sorted by description (column D) in alphabetical order.
- https://cdn.elifesciences.org/articles/77019/elife-77019-fig1-data1-v1.xlsx
Figure 1—figure supplement 1
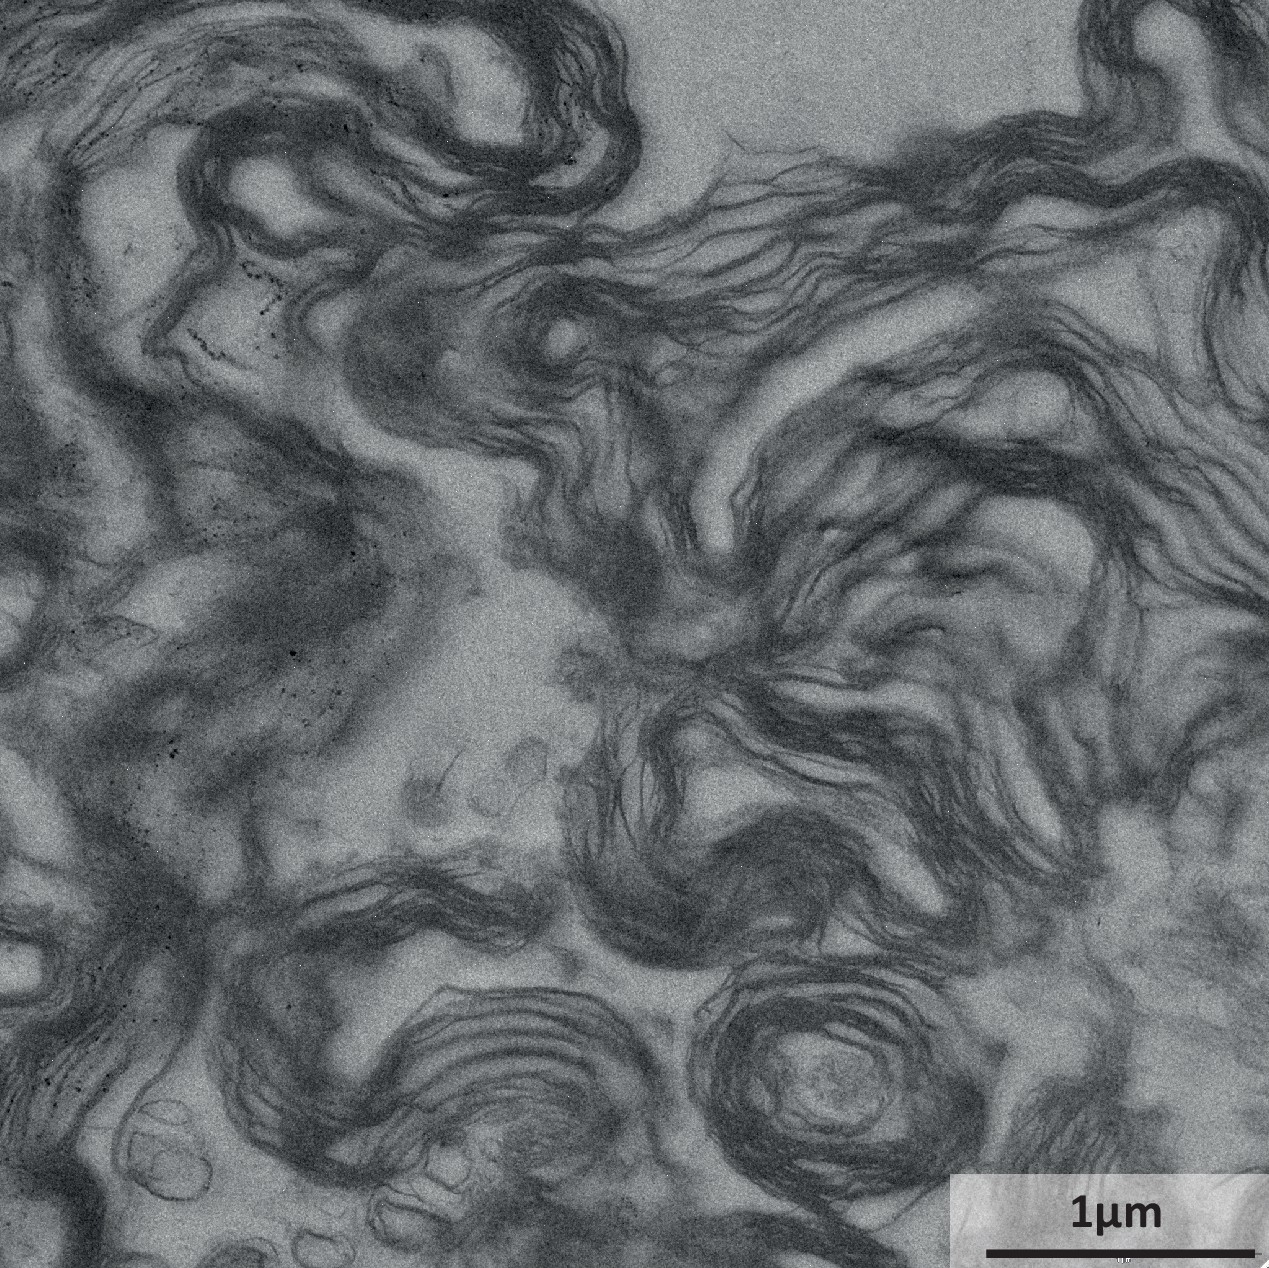
Electron micrograph of the myelin-enriched fraction.
Representative electron micrograph of the myelin-enriched lightweight membrane fraction purified from the normal-appearing white matter of a human subject. Myelin sheaths are identified by their typical multimembrane structure; cellular compartments other than myelin were virtually undetectable.
Figure 1—figure supplement 2
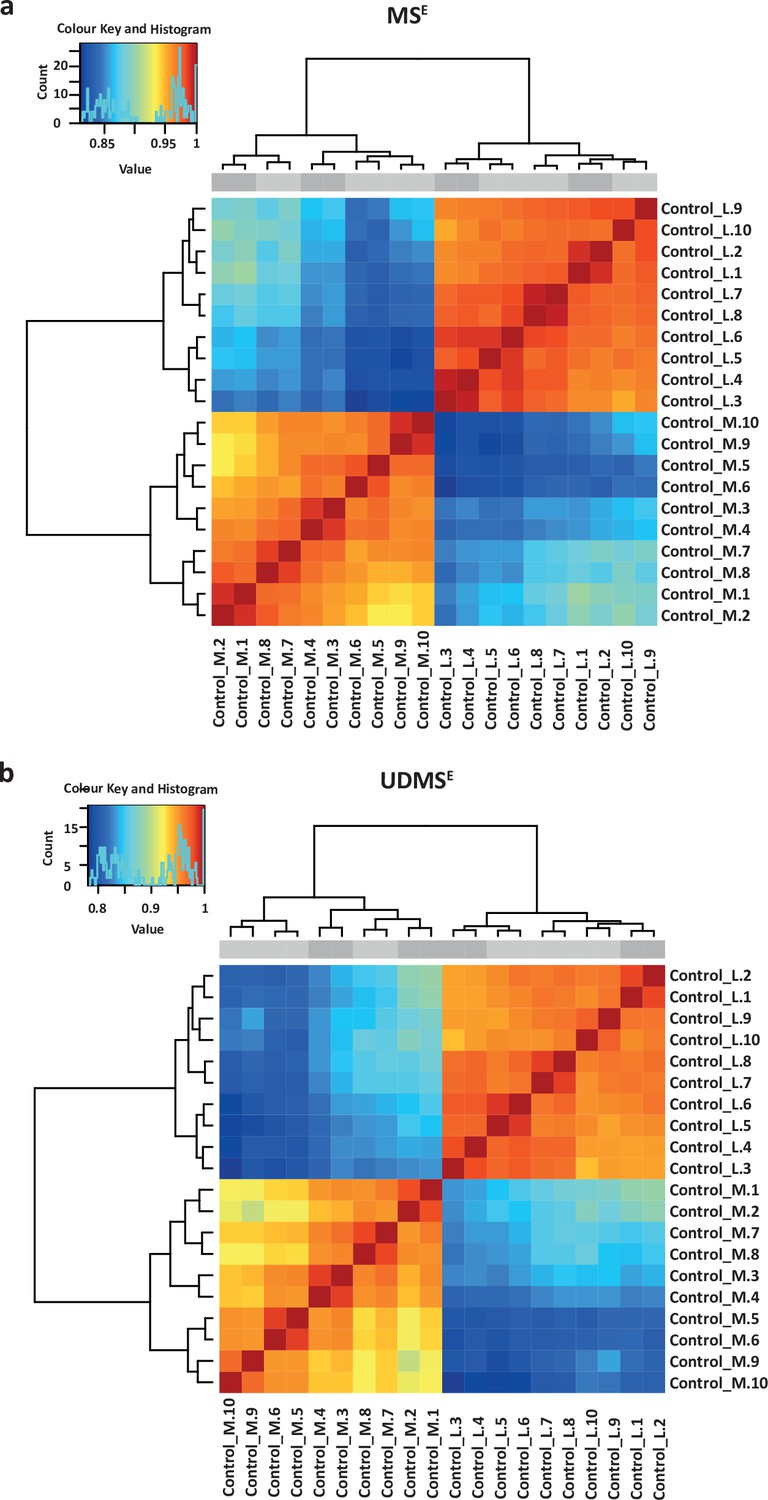
Pearson’s correlation for proteome analysis by MSE and UDMSE.
Clustered heatmap of Pearson’s correlation coefficients for protein abundance comparing myelin-enriched fraction and white matter homogenate by two data acquisition modes MSE in (a); UDMSE in (b). The sex of the human subjects is indicated above the heatmap (female, light gray; male, dark gray). Note that the groups ‘lysate’ (Control_L) and ‘myelin’ (Control_M) as expected cluster with a high correlation of >0.9, and that the two technical replicates cluster together adjacently. See Figure 1—source data 1 for datasets. n = 5 biological replicates analyzed as two technical replicates each.
Figure 1—figure supplement 3
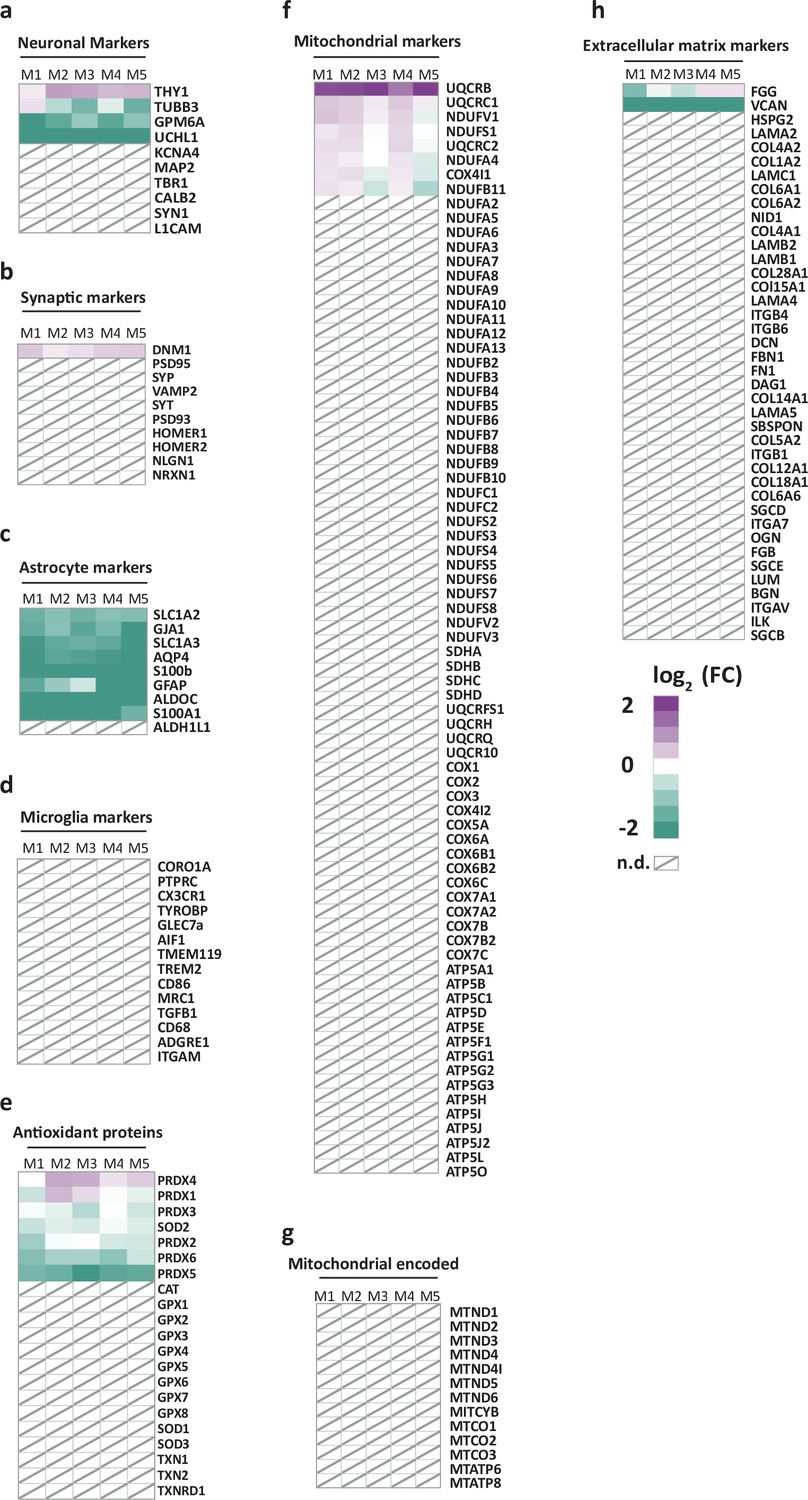
Heatmaps comparing the relative abundance of marker proteins in purified myelin versus white matter homogenate.
(a–h) Fold change (FC) comparing the abundance in myelin purified from human normal-appearing white matter with that in white matter homogenate according to the MSE dataset of marker proteins selected on the basis of prior knowledge for neurons (a), synapses (b), astrocytes (c), microglia (d), antioxidative proteins (e), nuclear-encoded mitochondrial proteins (f), mitochondrial-encoded proteins (g), and constituents of the extracellular matrix (h). In the heatmap, each horizontal line corresponds to the FC of the abundance of a protein in purified myelin compared to its average abundance in white matter homogenate plotted on a log2 color scale with increased (magenta) or decreased (turquoise) abundance in purified myelin. Heatmaps display five biological replicates (M1, M2, M3, M4, M5) as the average of two technical replicates each. See Figure 1—source data 1 for datasets. Note that most marker proteins for cell types or compartments other than myelin are reduced in abundance or not detected (n.d., marked with a diagonally crossed field) in myelin.
Figure 2 with 1 supplement
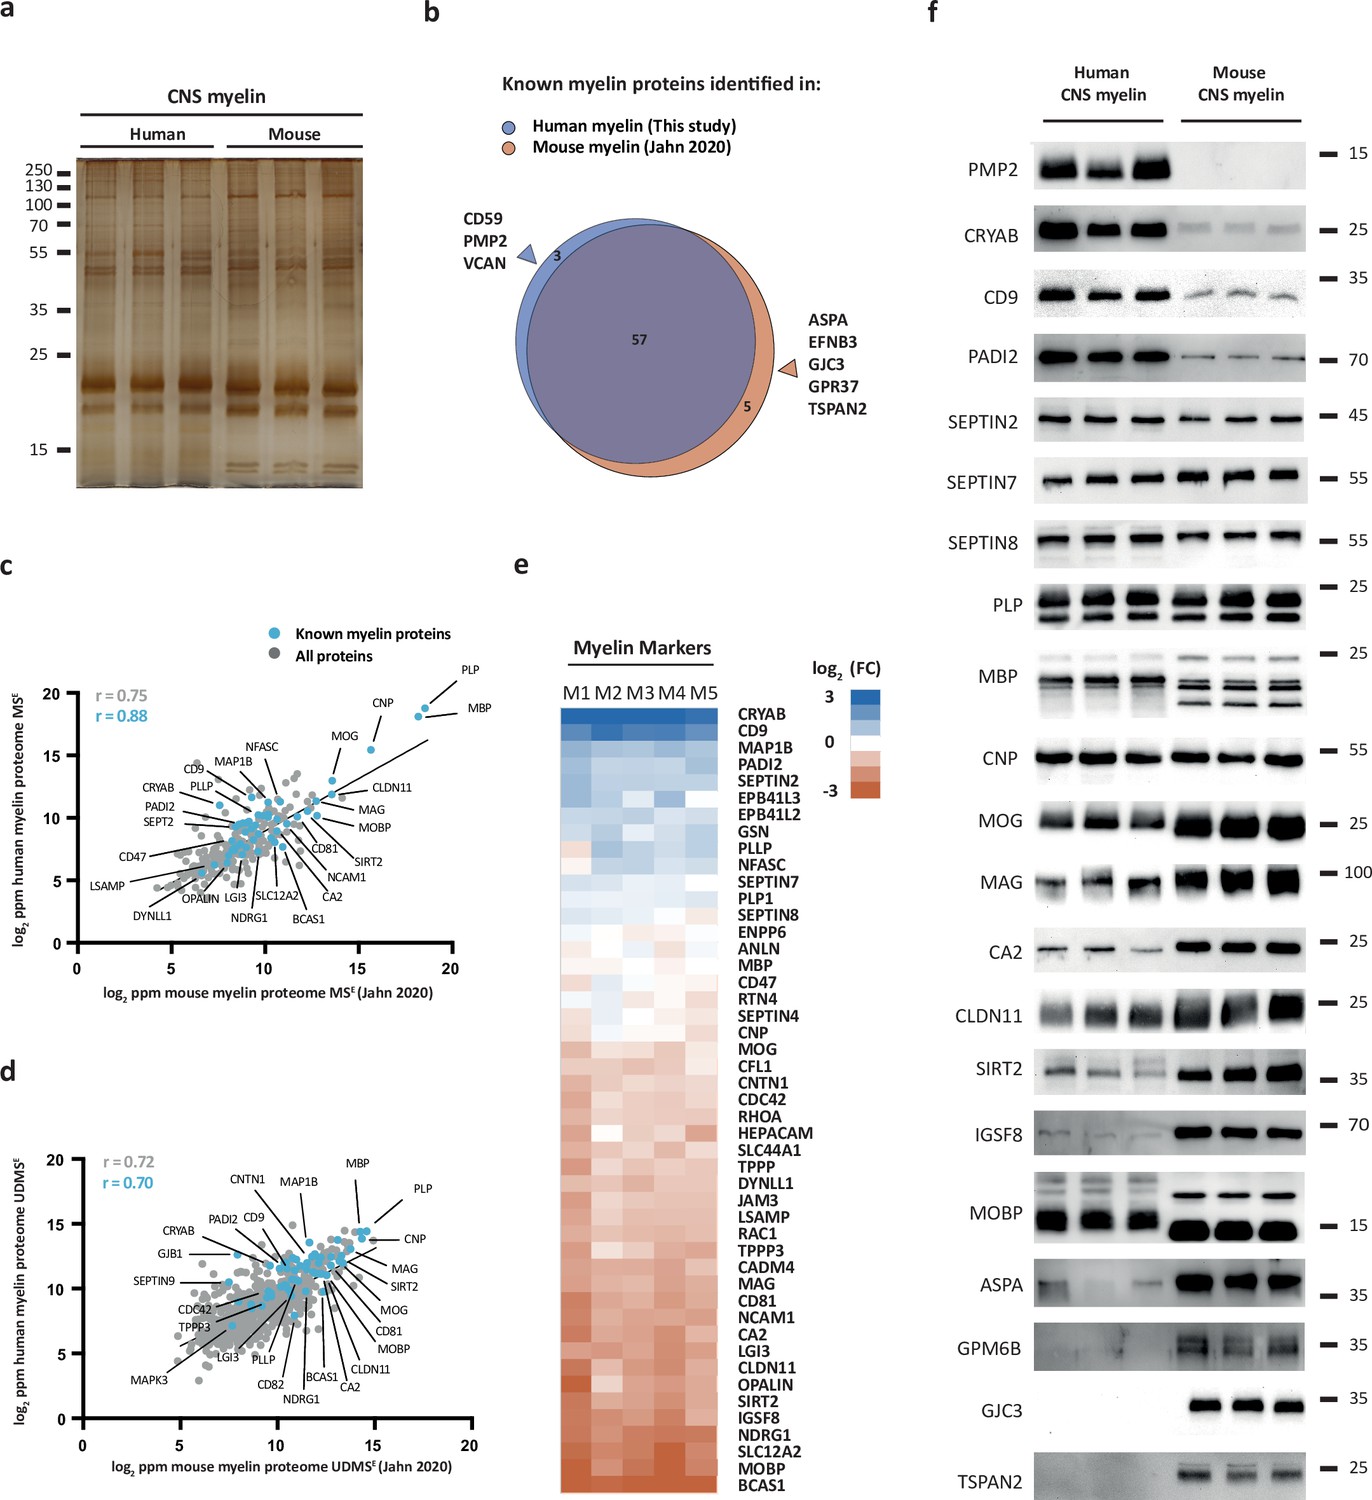
Comparison of the protein composition of human and mouse central nervous system (CNS) myelin.
(a) Silver-stained SDS-PAGE (0.9 μg protein load) of myelin purified from human normal-appearing white matter and C57Bl/6N mouse brains. Note that the band patterns are roughly comparable but not identical. Gel shows n = 3 biological replicates per species. (b) Venn diagram comparing 65 selected known myelin proteins identified by MSE and UDMSE in myelin purified from human white matter (blue) and C57Bl/6N mouse brains (orange) as recently established using the same methods (Jahn et al., 2020). Note that most known myelin proteins were identified in myelin of both species, while multiple myelin proteins were identified in myelin of only one species. (c, d) Scatter plots of the log2-transformed relative abundance of proteins identified in human myelin by MSE (c) or UDMSE (d) plotted against their relative abundance in mouse myelin as recently established using the same methods (Jahn et al., 2020). Correlation coefficients (r) were calculated for all proteins identified in human myelin (gray) or known myelin proteins (blue). Regression lines serve as navigational mean. (e) Heatmap comparing the relative abundance of known myelin proteins identified by MSE in human myelin with that in mouse myelin according to the same method (Jahn et al., 2020). Each horizontal line displays the fold change (FC) of a protein in five biological replicates (M1–M5) of human myelin compared to its average abundance in CNS myelin of mice plotted on a log2-color scale. Note that several proteins display higher abundance in human (blue) or mouse (orange) myelin, while others show approximately similar relative abundance (white). (f) Immunoblot analysis confirms comparatively higher abundance in human myelin of PMP2, CRYAB, CD9, and PADI2, approximately equal abundance of PLP, CNP, SEPTIN2, SEPTIN7, and SEPTIN8, and comparatively higher abundance in mouse myelin of TSPAN2, GPM6B, GJC3, ASPA, MOBP, IGSF8, SIRT2, CLDN11, CA2, MAG, and MOG, as implied by the MSE analysis. Note that immunoblot-based comparison of the relative abundance of MBP across species is not straightforward because MBP displays one dominant isoform (18.5 kDa) in human CNS myelin but three main isoforms (14.0, 17.0, and 18.5 kDa) in mouse CNS myelin due to species-dependent alternative splicing. Blots show n = 3 biological replicates per species. For immunohistochemistry detecting PMP2 in human optic nerve cross sections, see Figure 2—figure supplement 1.
-
Figure 2—source data 1
Labeled original immunoblots.
- https://cdn.elifesciences.org/articles/77019/elife-77019-fig2-data1-v1.xlsx
Figure 2—figure supplement 1
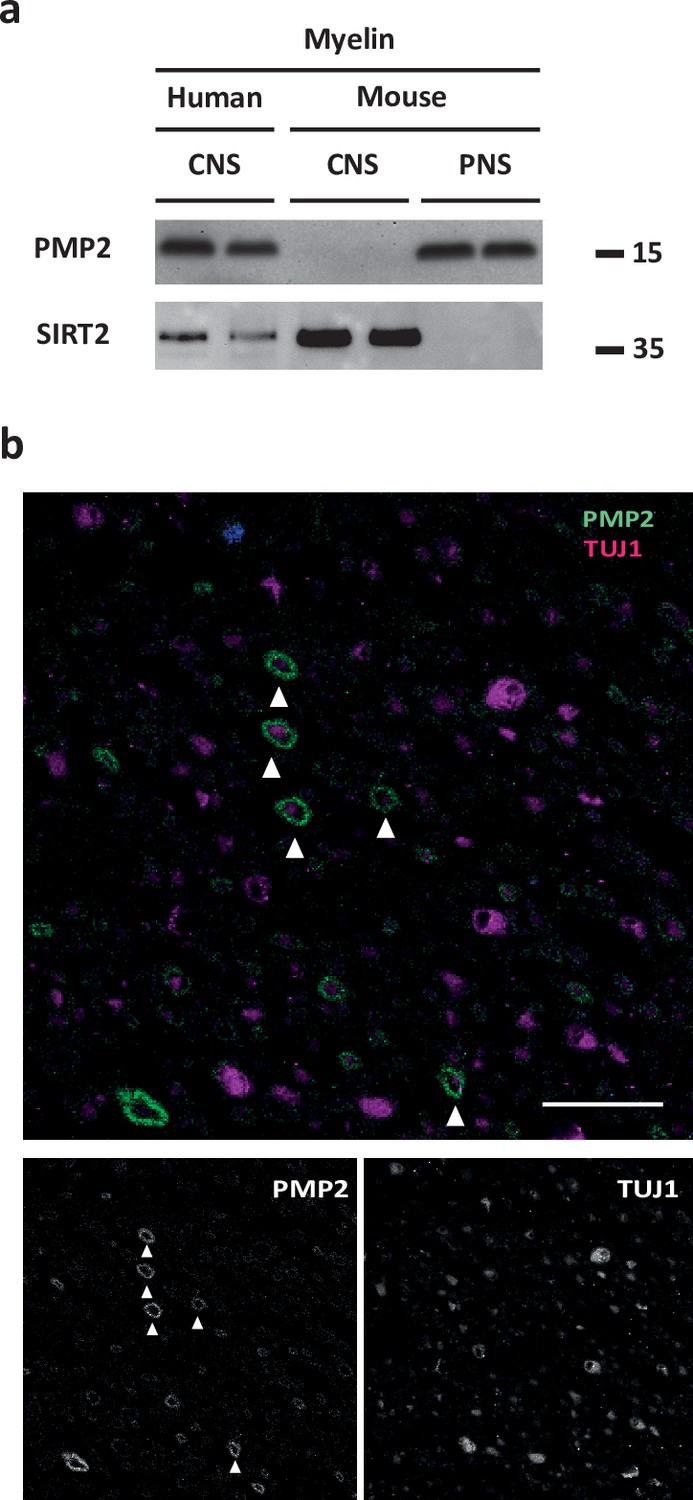
Detection of PMP2 in human central nervous system (CNS) myelin by immunoblot and immunohistochemistry.
(a) Immunoblot analysis of myelin purified from human normal-appearing white matter (CNS), C57Bl/6N mouse brains (CNS), and C57Bl/6N mouse sciatic nerves (peripheral nervous system [PNS]) using antibodies specific for PMP2. Blot shows two biological replicates per condition. Note that PMP2 was readily detected in human CNS myelin and mouse PNS myelin but not in mouse CNS myelin. SIRT2 was detected as a control. (b) Confocal micrograph of immunohistochemistry detecting PMP2 (green) and TUJ1 (magenta) in paraffin-embedded cross-sectioned optic nerves of a human subject. Note that PMP2 labels myelin sheaths (arrowheads), while TUJ1 labels neuron-specific beta-III tubulin, that is, axonal microtubules in this cross section. Nuclear staining (DAPI) is in blue. Shown is one biological replicate representative of three biological replicates. Scale bar, 20 µm.
Figure 3 with 3 supplements
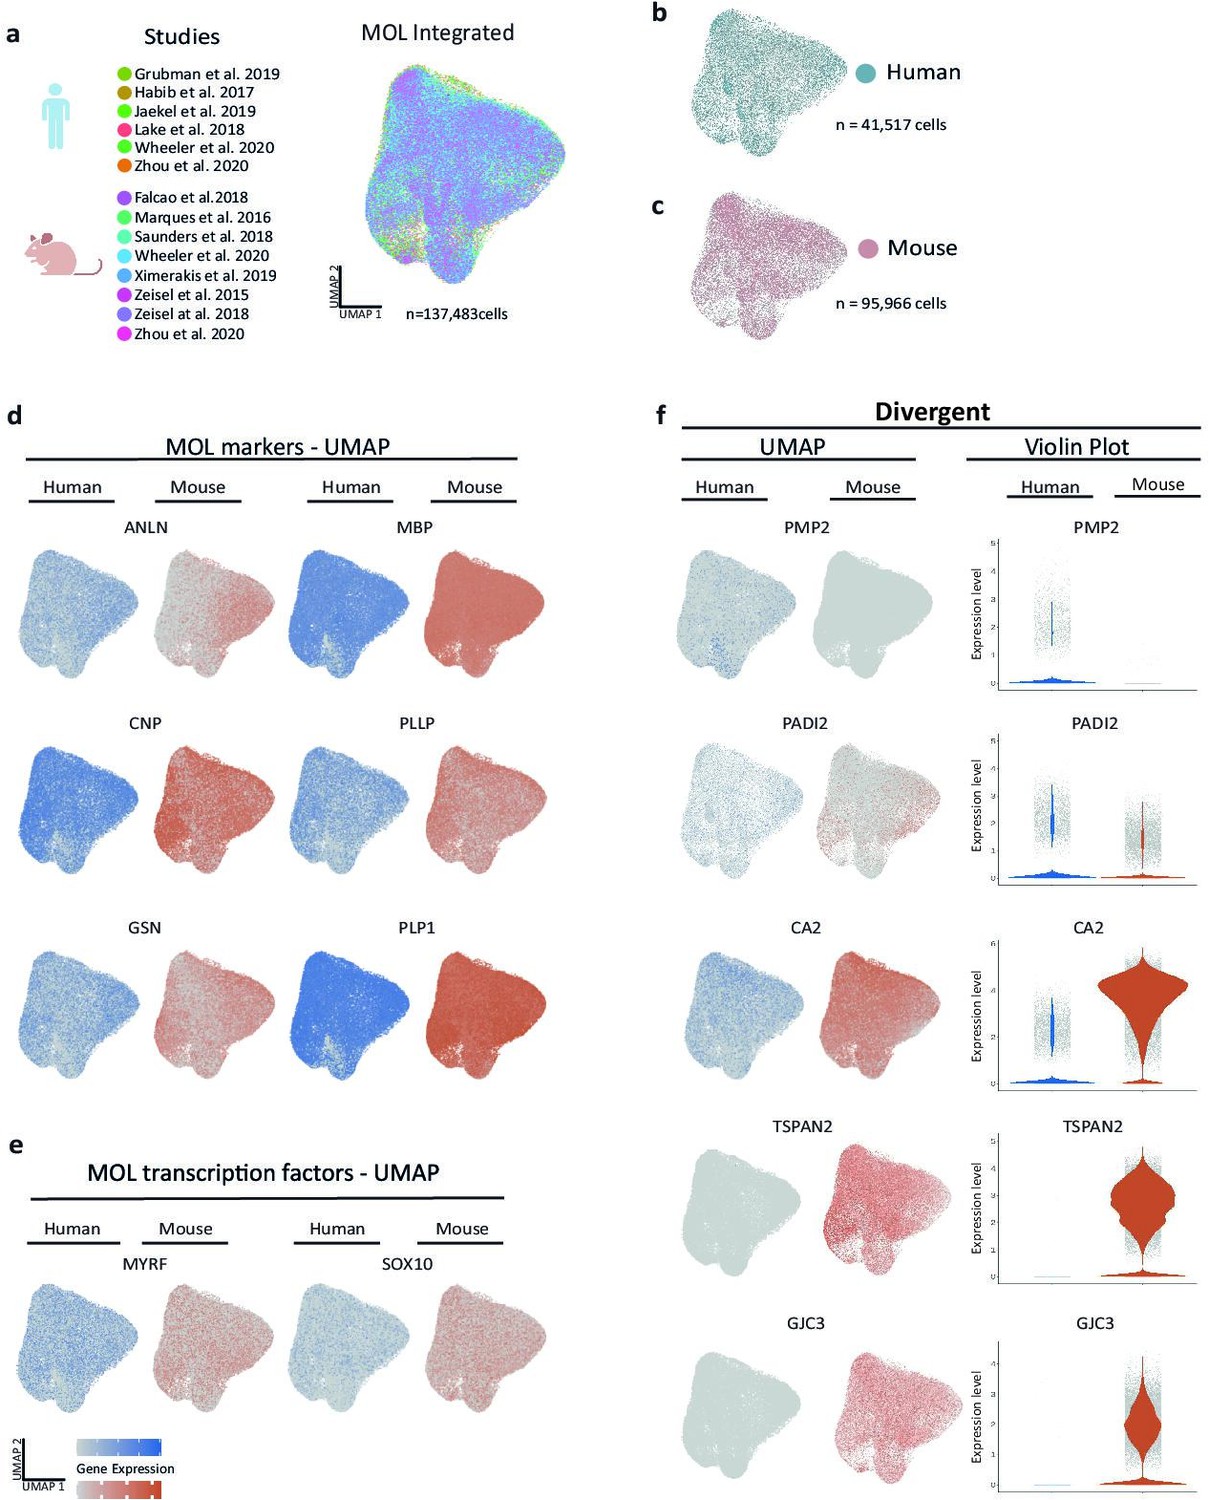
Cross-species scRNA-seq profile comparison of mature oligodendrocytes (MOL).
(a–c) Uniform manifold approximation and projection (UMAP) plot of the scRNA-seq profile of MOL integrated from previously established human (b) and mouse (c) datasets. In (a), cells contributed by distinct studies are highlighted in different colors; the corresponding references are given. (d, e) UMAP feature plots highlighting expression of selected MOL marker genes (d) and transcription factors (e) in the integrated object comprising MOL of both humans (blue) and mice (orange). (f) UMAP feature plots and violin plots exemplify genes that display preferential expression in MOL of humans (PMP2, PADI2) or mice (GJC3, TSPAN2, CA2).
-
Figure 3—source data 1
Parameters applied for scRNA-seq individual dataset quality control and integrative analysis.
- https://cdn.elifesciences.org/articles/77019/elife-77019-fig3-data1-v1.docx
Figure 3—figure supplement 1

Integrated scRNA-seq profiles of the oligodendrocyte lineage in humans and mice.
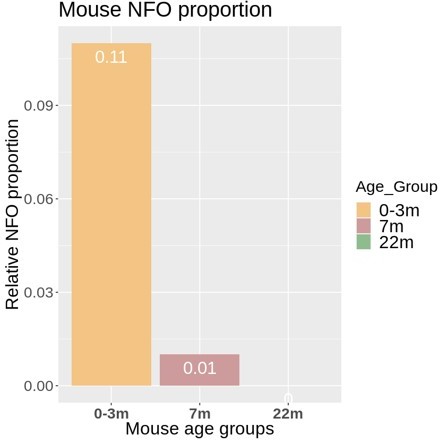
(a, b) Uniform manifold approximation and projection (UMAP) plots of the scRNA-seq profiles of oligodendrocyte lineage cells integrated separately for humans (a) and mice (b) from previously published datasets. Cells contributed by distinct studies are highlighted in different colors; the corresponding references are given. (c–f) UMAP plots highlighting expression of marker genes for oligodendrocyte precursor cells (OPCs; c), newly formed oligodendrocytes (NFOs; d), and mature oligodendrocytes (MOL; e) in the integrated human (blue) and mouse (orange) datasets. Note that some genes display preferential expression in human (PMP2, CD9, CRYAB) or mouse (GJC3, TSPAN2, CA2) oligodendrocytes (f).
Figure 3—figure supplement 2
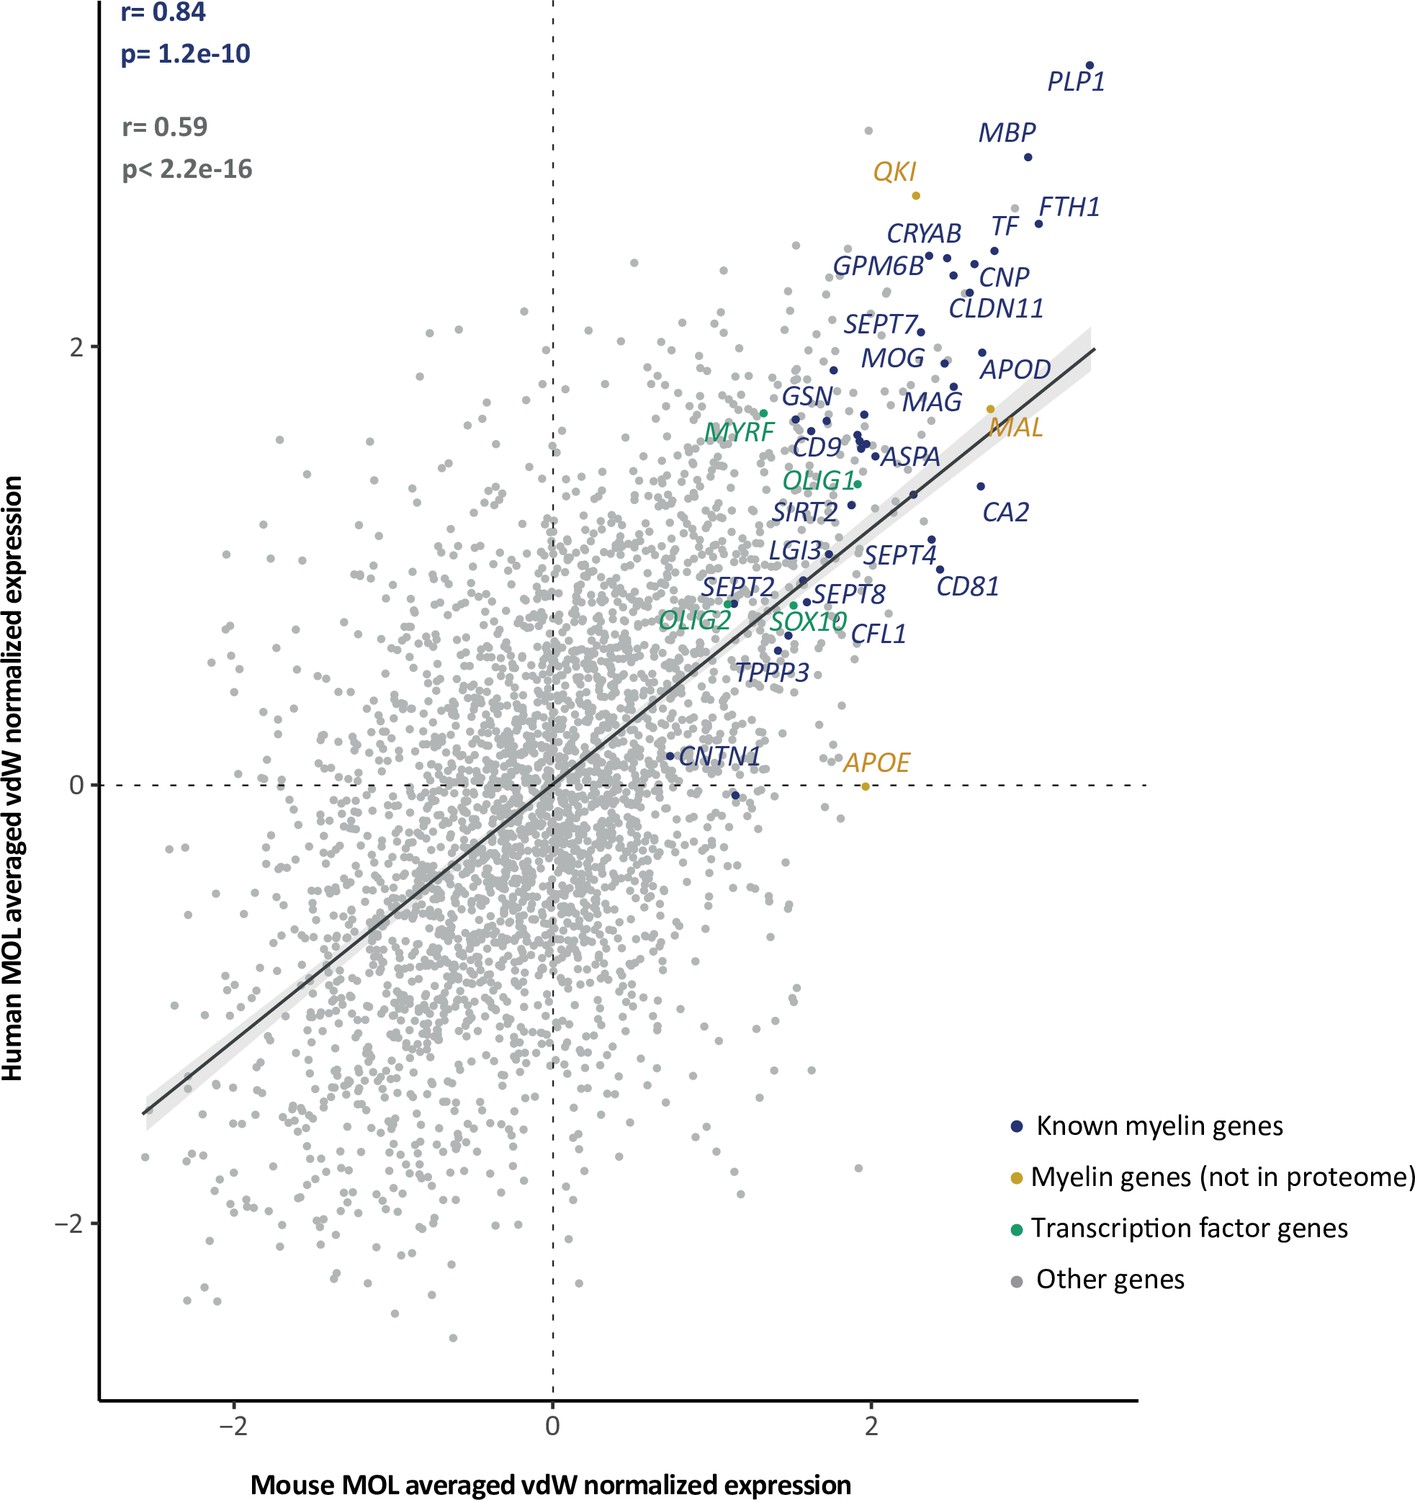
Cross-species mature oligodendrocyte (MOL) transcriptome correlation.
Scatter plot comparing the van der Waerden (vdW) score-transformed average expression of 3000 integration features (i.e., genes) between human and mouse MOLs. Data points of 37 known myelin-related transcripts that encode proteins represented in the myelin proteome are highlighted in blue (25 of which are annotated with gene name); 3 known myelin-related transcripts of which the protein product is not present in the myelin proteome are highlighted in orange; 4 myelination-related transcription factors are highlighted in green; other transcripts are displayed in gray. Pearson’s correlation coefficient is given for known myelin-related transcripts (as highlighted in blue) or all transcripts (in gray). Regression line represents fit of data for navigational purpose.
Figure 3—figure supplement 3
Comparisons of myelin proteome and mature oligodendrocyte (MOL) transcriptome.
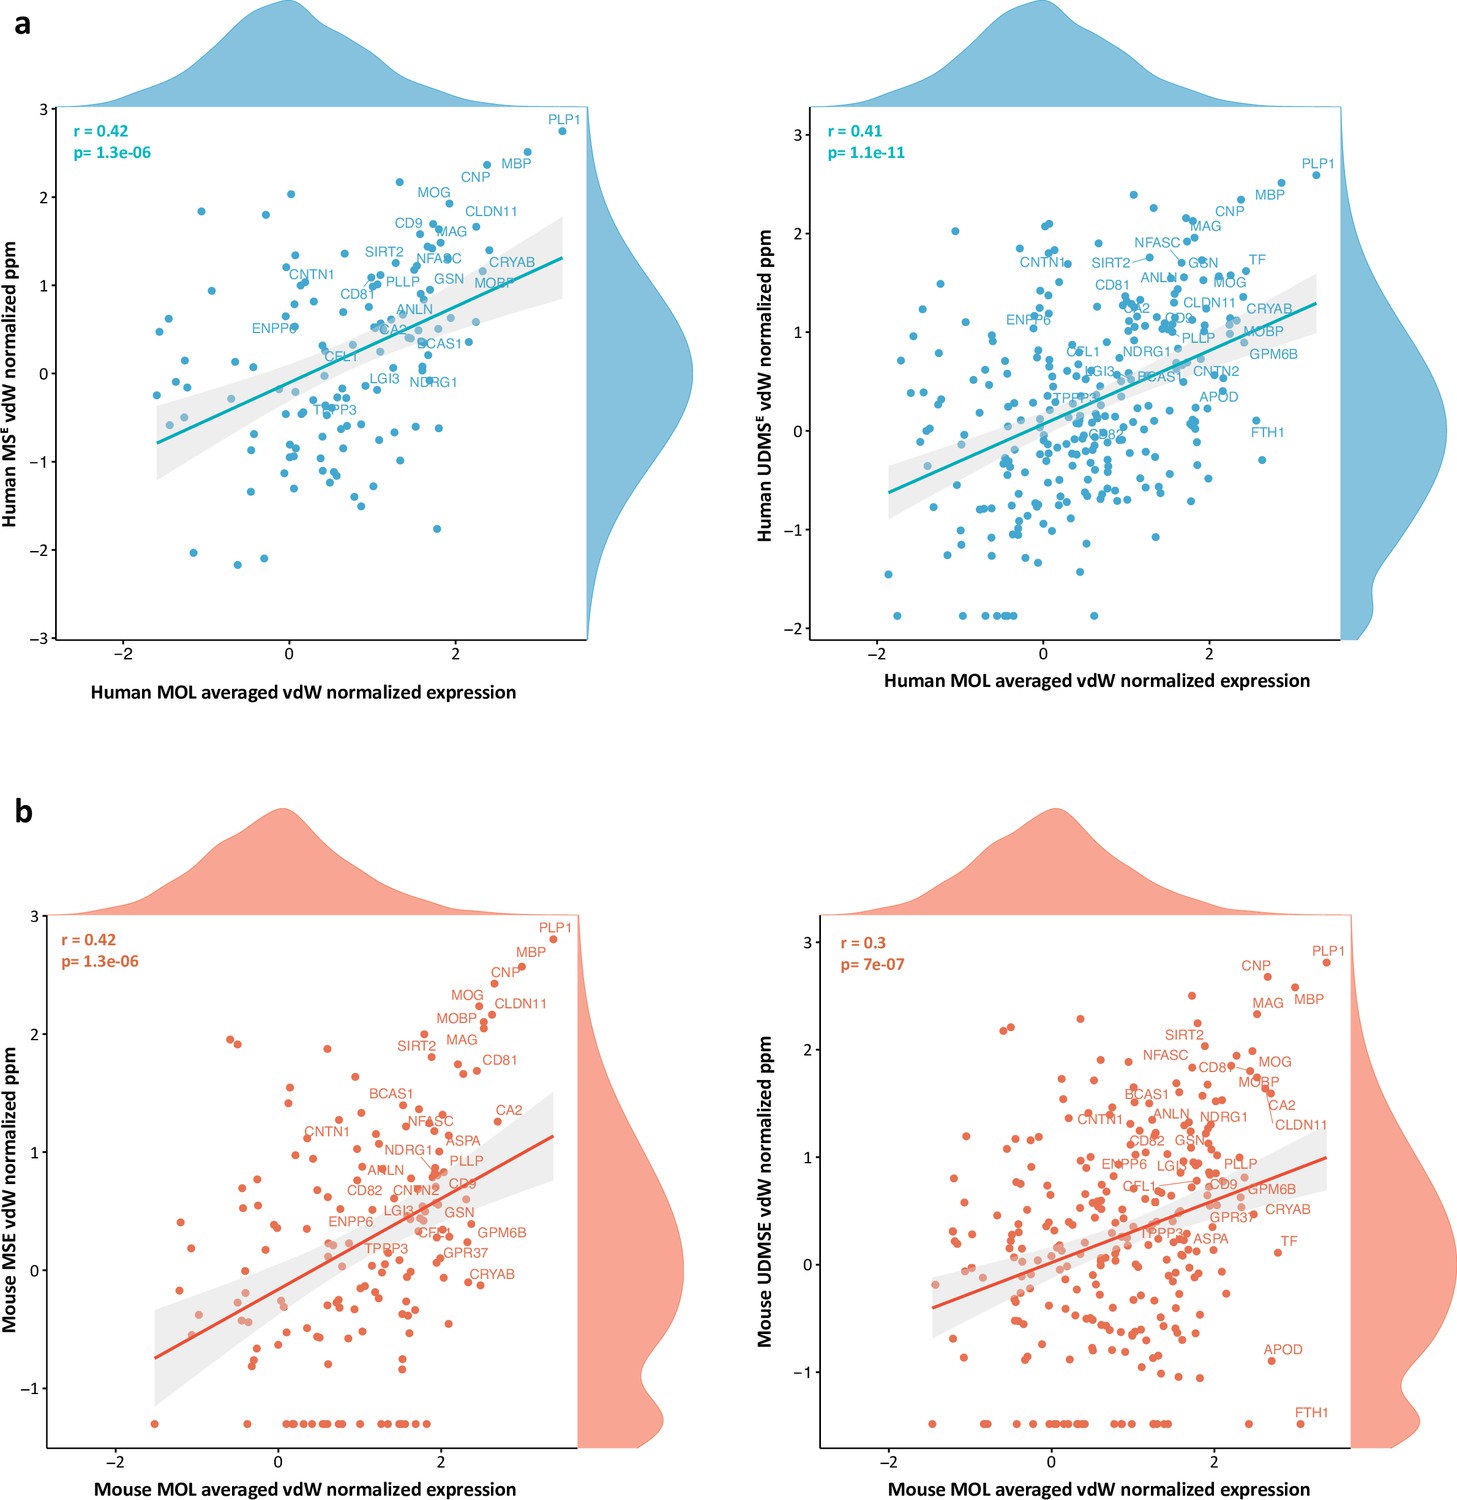
van der Waerden (vdW) scores calculated from the mean abundance of integration features (n = 3000) in integrated scRNA-seq datasets of human (a, b) and mouse (c, d) MOL, and in the central nervous system (CNS) myelin proteome in the respective species as acquired using the MSE (a, c) and UDMSE (b, d) modes. vdW-normalized data were subjected to Pearson’s correlation analysis and visualized as scatter plot. Known myelin proteins are highlighted, and the distribution of normalized protein and RNA profiles is illustrated by density plots along the axes.
Figure 4 with 1 supplement
Human and mouse mature oligodendrocyte (MOL) subpopulation analysis.
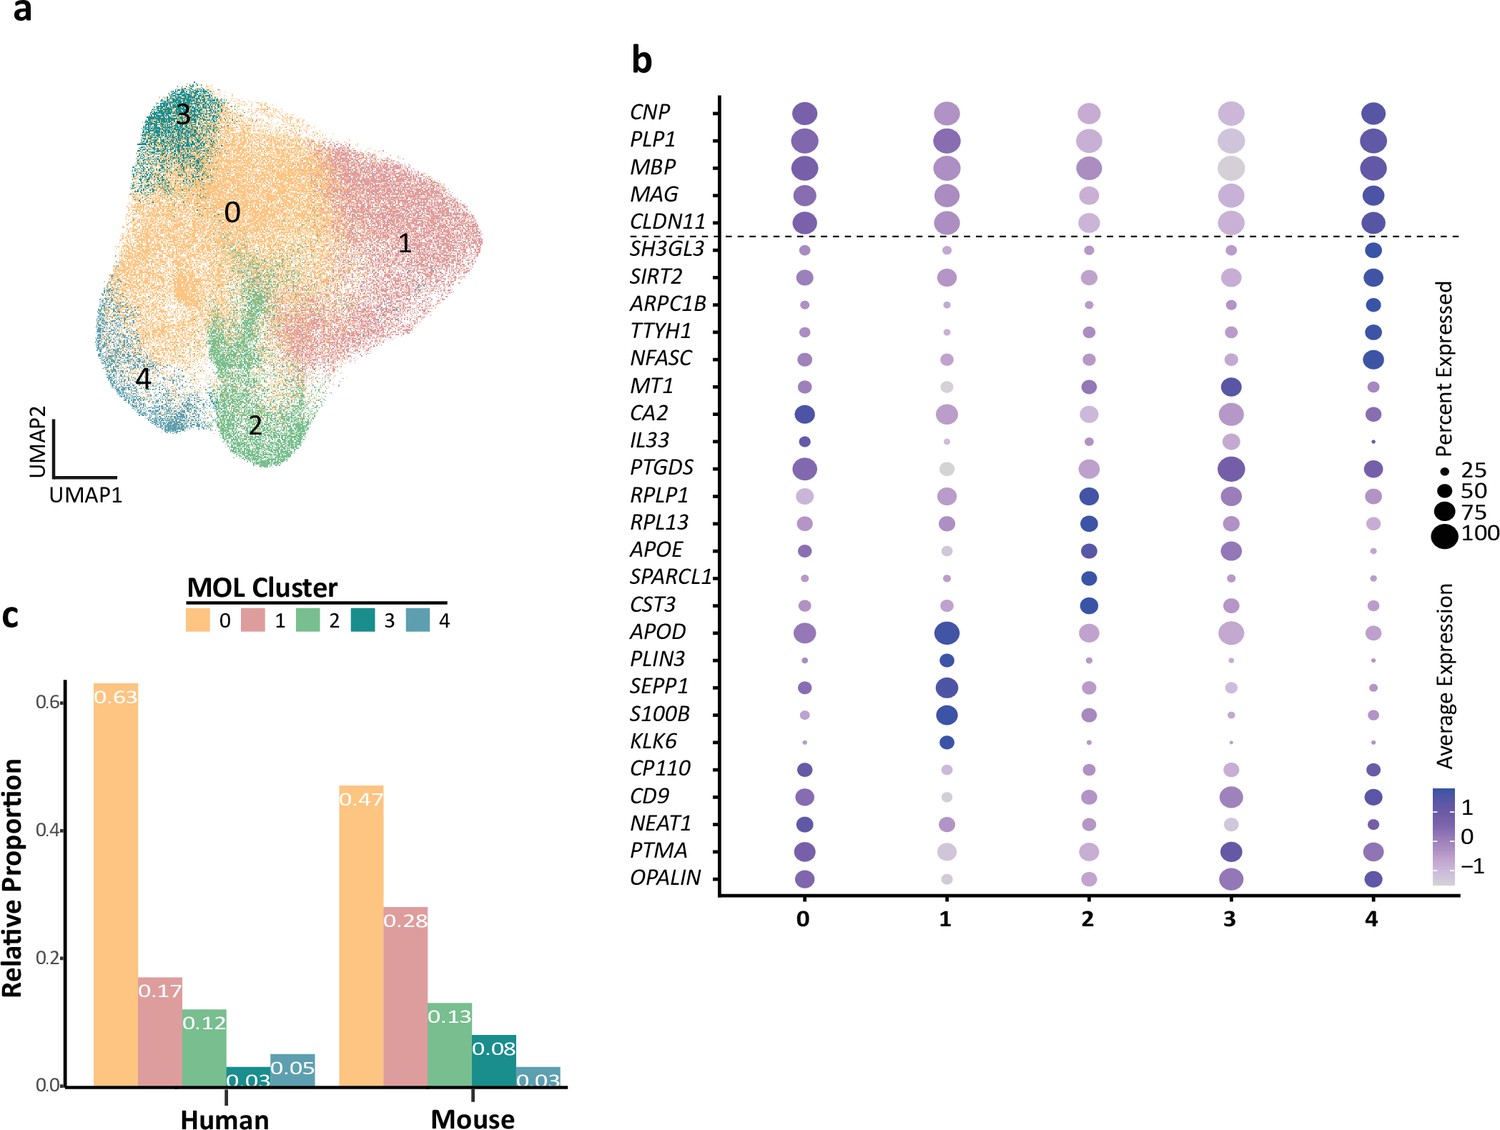
(a) Uniform manifold approximation and projection (UMAP) plot showing five subpopulations of MOL identified upon integrating all human and mouse scRNA-seq datasets. (b) Bubble plot showing the top five subpopulation marker genes. All cells in all clusters also express high levels of known myelin-related marker transcripts (CNP, PLP1, MBP, MAG, CLDN11). (c) Relative proportion of mature oligodendrocyte subpopulations in humans and mice. Note that the MOLs of both species contribute to all subpopulations.
-
Figure 4—source data 1
Model-based analysis of single-cell transcriptomics (MAST)-calculated marker genes from human and mouse integrated mature oligodendrocyte (MOL) subpopulations.
- https://cdn.elifesciences.org/articles/77019/elife-77019-fig4-data1-v1.csv
Figure 4—figure supplement 1

Gene Ontology (GO) term topics enriched per subpopulation.
GO terms of biological processes (small circles) were grouped as topics (large circles). Colors represent association with mature oligodendrocyte (MOL) clusters displayed in Figure 4. False discovery rate (FDR) < 0.05.
Author response image 1
Author response image 2

Author response image 3
Additional files
Download links
A two-part list of links to download the article, or parts of the article, in various formats.
Downloads (link to download the article as PDF)
Open citations (links to open the citations from this article in various online reference manager services)
Cite this article (links to download the citations from this article in formats compatible with various reference manager tools)
Conservation and divergence of myelin proteome and oligodendrocyte transcriptome profiles between humans and mice
eLife 11:e77019.
https://doi.org/10.7554/eLife.77019


