Real time, in vivo measurement of neuronal and peripheral clocks in Drosophila melanogaster
- Department of Biochemistry and Molecular Biology, Dalhousie University, Canada
- Department of Pharmacology, Dalhousie University, Canada
- Institute of Neuro- and Behavioral Biology, Westfälische Wilhelms University, Germany
- You.i Labs Inc, Canada
- Department of Physics, University of Miami, United States
Figures
Figure 1 with 1 supplement
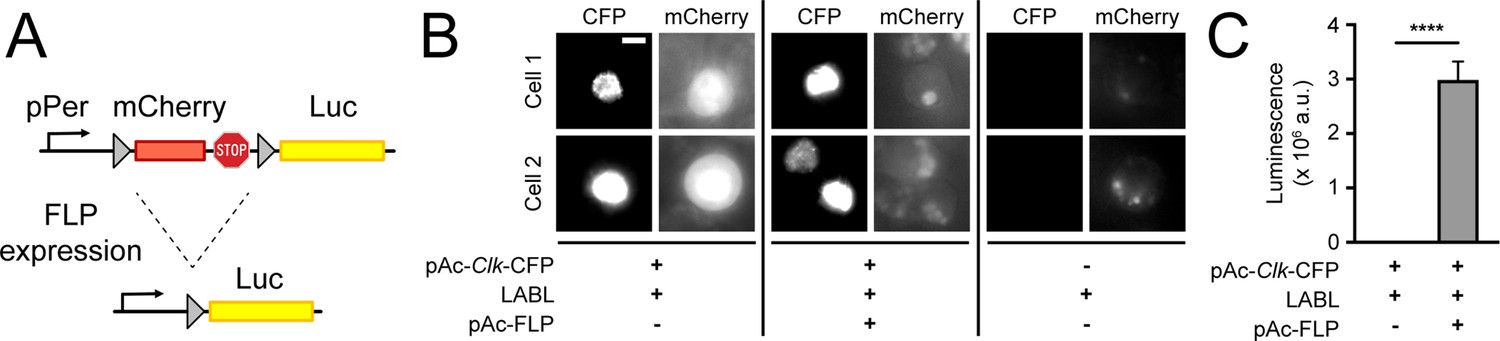
Design and activity of LABL reporter.
(A) The Locally Activatable Bioluminescence (LABL) reporter construct. In architecture, the per promoter (pPer) is fused to mCherry followed by luciferase (Luc). The mCherry gene and three stop codons are flanked by FRT recombination sequences. Expression of Flipase (FLP) excises out mCherry (dashed lines), leaving luciferase under period promoter regulation. (B) Fluorescence image of LABL-expressing S2 cells. Expression of LABL reporter with actin promoter-driven Clk (pAc-Clk-CFP), FLP (pAc-FLP), or both reveals CLK-dependent expression of mCherry in the absence of FLP. Scale bar represents 5 μm. (C) LABL can be activated in cultured S2 cells. Lysed S2 cells emit measurable luminescence in a luciferase assay when expressing LABL reporter in a FLP-dependent manner. ****: p < 0.0001.
Figure 1—figure supplement 1
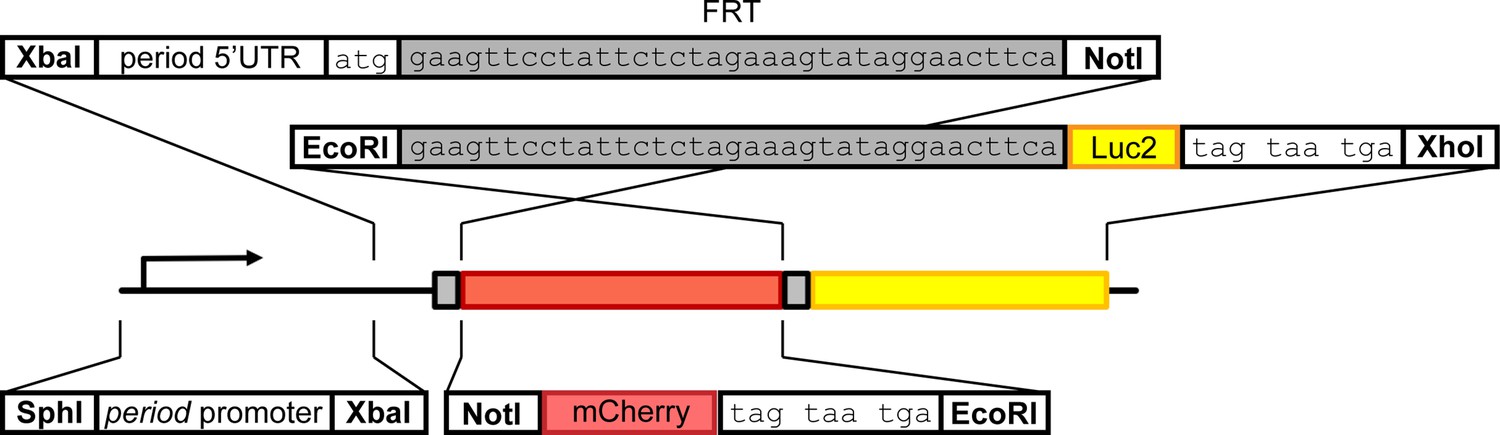
LABL cloning strategy.
The region of per promoter between restriction sites SphI and XbaI (Bargiello et al., 1984) was cloned into pattB cloning vector. The per 5’UTR was amplified from plasmid containing the entire per minigene using synthetic oligos to introduce an FRT recombination site and NotI restriction site 3’ of the UTR, using standard PCR protocols. The mCherry gene was amplified using standard PCR protocols to introduce a 5’ NotI restriction site and 3’ stop codons and EcoRI restriction site. Luc2 (pGL4.10) was amplified using standard PCR protocols to introduce a 5’ EcoRI restriction site and FRT site and 3’ stop codons and an XhoI restriction site to Luc2. All amplicons were assembled sequentially into the pattB plasmid vector, and sequence confirmed.
Figure 2 with 1 supplement
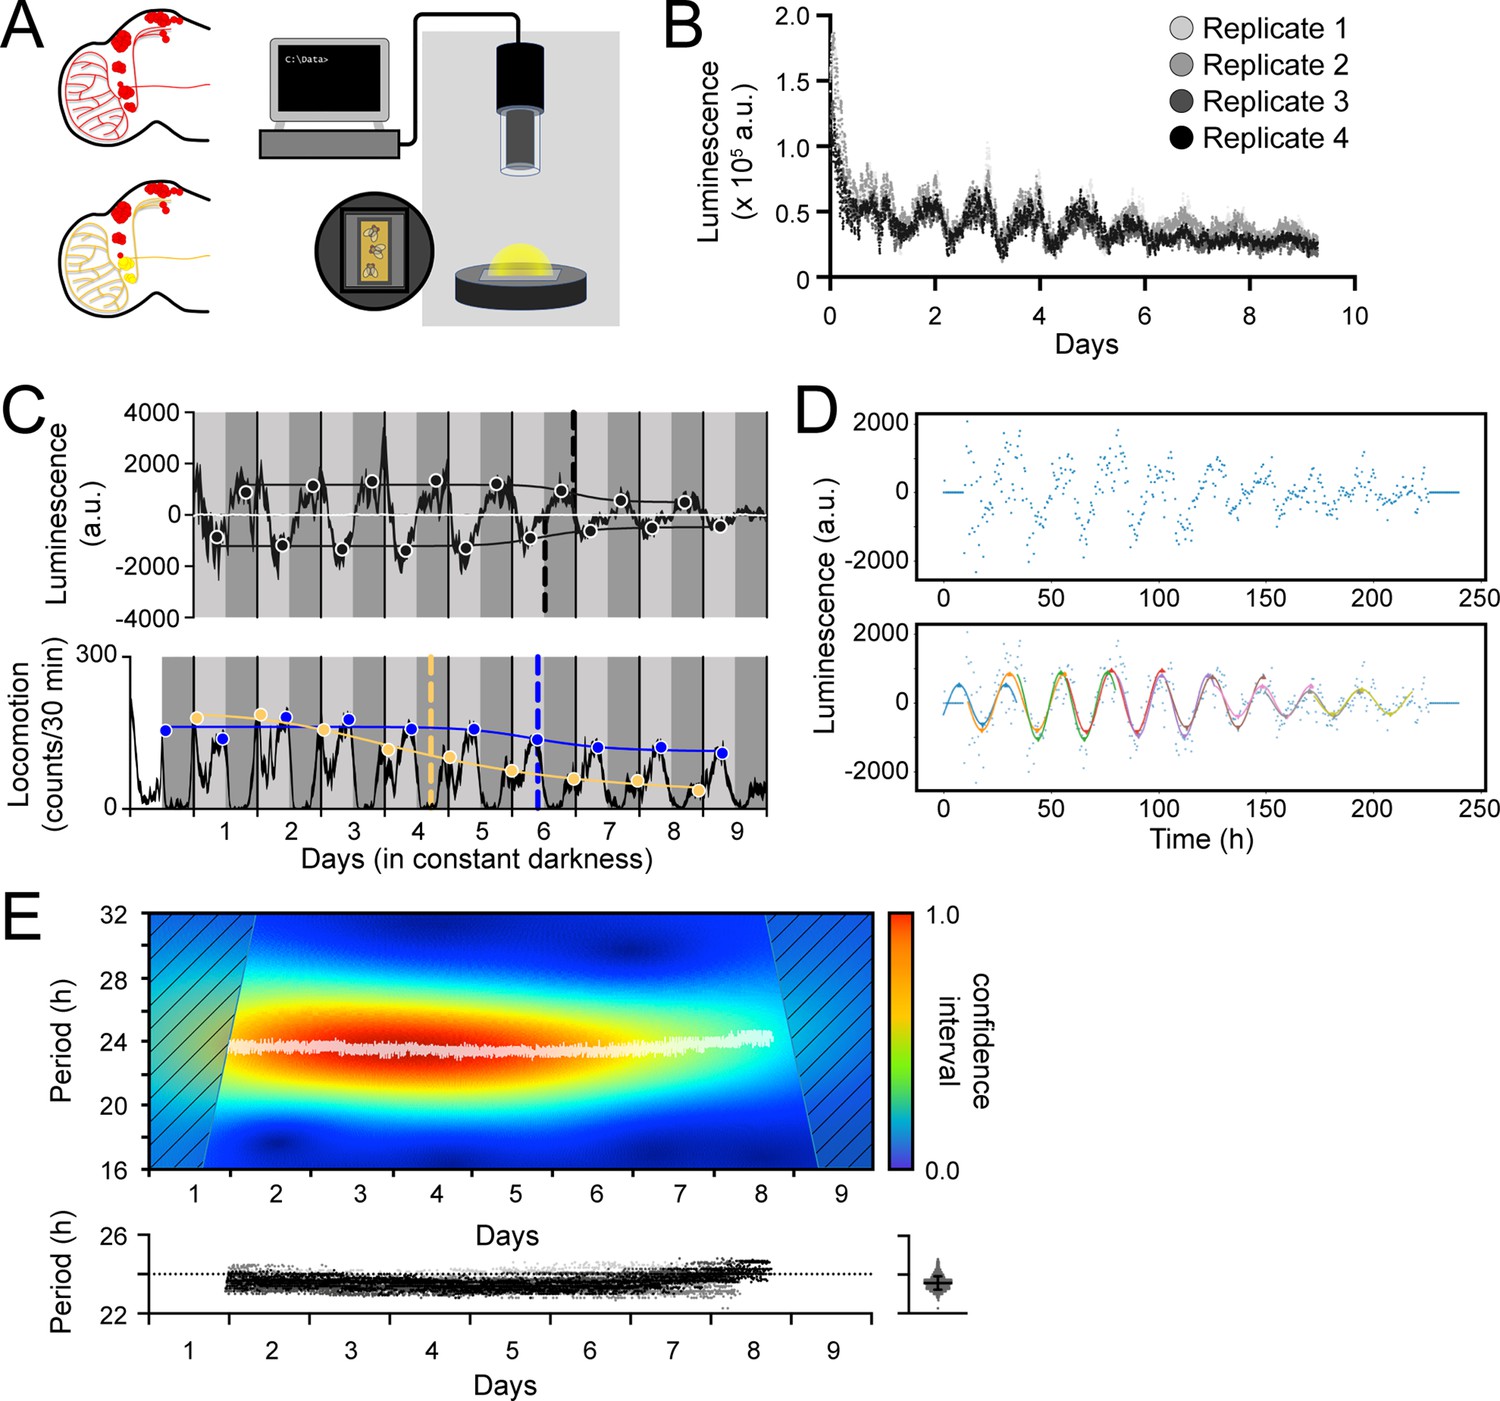
Measurement, quantification, and analysis of luminescence from LABL flies.
(A) LABL activation strategy in Drosophila brain. Fly brain schematic illustrates how LABL can be activated using tissue-specific Gal4 drivers which express UAS-FLP2 to excise mCherry out of the genome in some neurons to permit Luciferase expression (yellow circles) under the regulation of the period promoter, leaving other neurons untouched (red circles). Fifteen LABL flies are placed in custom-made plates containing luciferin mixed with standard fly food. Plates are loaded into a luminometer and luminescence from each cohort is recorded for analysis. (B) Raw luminescence measurements of live flies. Photons were detected from four replicates of 15 flies expressing LABL reporter, UAS-FLP2 and tim-UAS-Gal4 over 9 days at 4-min temporal resolution. (C) Comparison between luminescence signal (upper graph) and locomotor activity (lower graph) of wild-type flies. Luminescence signal from flies described in panel B is normalized to exponential decay of signal, the values are averaged into 30 min bins, and the mean of the four experiments presented, +/-SEM (thickness of curve). Light grey and dark grey backgrounds represent subjective day and subjective night, respectively. Vertical solid black lines divide days. The peaks and troughs of the presented curves are represented by dots, and are the mean of four experiments, +/-SEM. Lines connecting the dots of peaks or troughs are best-fit S-curves. The vertical dashed lines define the point of inflection of each S-curve, which is used to define the A50. Locomotion activity is measured in beam breaks (counts) per 30-min bouts. Curve in lower graph represents rhythmic locomotor activity of 25 flies, +/-SEM (thickness of curve). White background indicates lights on. Vertical solid lines divide days. Light grey and dark grey backgrounds represent subjective day and subjective night, respectively. Blue and yellow dots represent peaks of “morning anticipatory” and “evening anticipatory” locomotion activity, respectively. The vertical dashed lines define the point of inflection of each S-curve, fitted to peaks of activity, which is used to define the decay of amplitude of peaks of behavior. (D) Calculation of oscillation peaks and troughs. A representative single replicate from experiment in panels B and C is plotted. Dots represent averaged luminescence signal in 30-min bins. A sinusoidal curve spanning 2 days is fitted to the data in 1 day increments (distinct colored curves). The peaks and troughs of each curve are calculated (triangles), averaged for both x- and y-values and recorded. This process is repeated for all four replicates and the resulting average is reported as shown in panel C. (E) Changes in oscillation period over time determined by Morlet wavelet fitting. Wavelets of different periods were fitted to luminescence signal from a single representative replicate from experiment in panel B and C, and assigned a confidence interval, across time (upper graph). Periods with highest confidence intervals at a time point (i.e. across the x-axis) were plotted as white dots. Confidence intervals of 25% or less were omitted. These values were replotted along with the other replicates (below), with varying shades of grey representing each of the four experiments. The dotted horizontal line denotes 24 hr as a point of reference. Right panel: All data points without the time dimension are plotted. Bar represents the mean, +/-SD.
Figure 2—figure supplement 1

Dip in luminescence signal in the first peak of transcription oscillation.
Luminescence signal recorded from TUG-activated LABL flies presented in Figure 2C was reproduced and the first peak enhanced for clarity (red box). The red arrow points to the dip in luminescence signal.
Figure 3 with 1 supplement
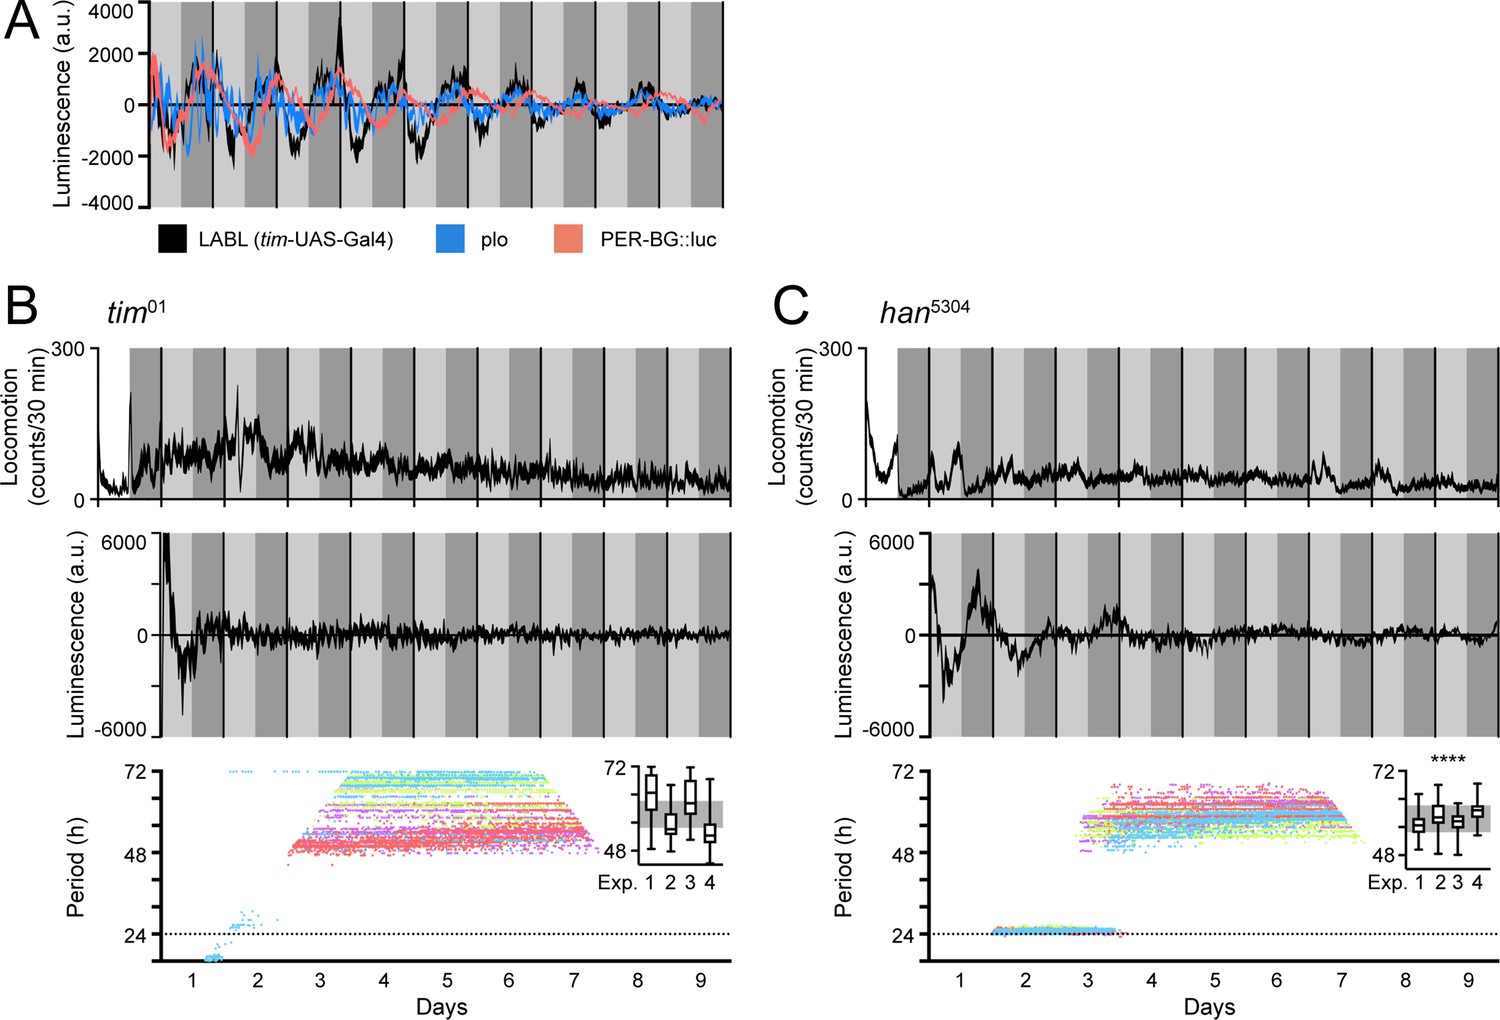
LABL oscillations are comparable to other luminescence reporters and respond to circadian clock manipulation.
(A) Comparison of luminescence reporters. LABL activated by tim-UAS-Gal4 (black curve) is plotted alongside per promoter fused to luciferase (plo; blue curve) and PER-BG::Luc (pink curve). (B) LABL is activated by tim-UAS-Gal4 in a tim01 genetic background. Top graph represents locomotor activity. Locomotion activity is measured in beam breaks (counts) per 30-min bouts. Curve represents rhythmic locomotor activity of 25 flies, +/-SEM (thickness of curve). White background indicates lights on. Vertical solid lines divide days. Light grey and dark grey backgrounds represent subjective day and subjective night, respectively. Middle graph illustrates luminescence signal over time. Luminescence signal is normalized to exponential decay of signal, values averaged into 30-min bins, as the mean of four experiments (n=15 flies) presented, +/-SEM (thickness of curve). Light grey and dark grey backgrounds represent subjective day and subjective night, respectively. Vertical solid black lines divide days. Lower graph illustrates changes in oscillation period over time determined by Morlet wavelet fitting. Parameters are as described in Figure 2E. Each dot color represents an experimental replicate of wavelet period best-fits in the tim01 genetic background. Inset is a box plot of period best-fits of each of the four experimental replicates, plotted. Experimental replicates (Exp.) are numerically labelled. Grey background represents interquartile range of box plots of the han5304 genetic background. (C) LABL is activated by tim-UAS-Gal4 in a han5304 genetic background. Graphs are as described in panel B. Distribution of period fit in the infradian oscillation range (48 h – 72 hr) is significantly different in han5304 flies when compared to tim01 flies, determined by the Kolmogorov-Smirnov test (****: p < 0.0001).
Figure 3—figure supplement 1
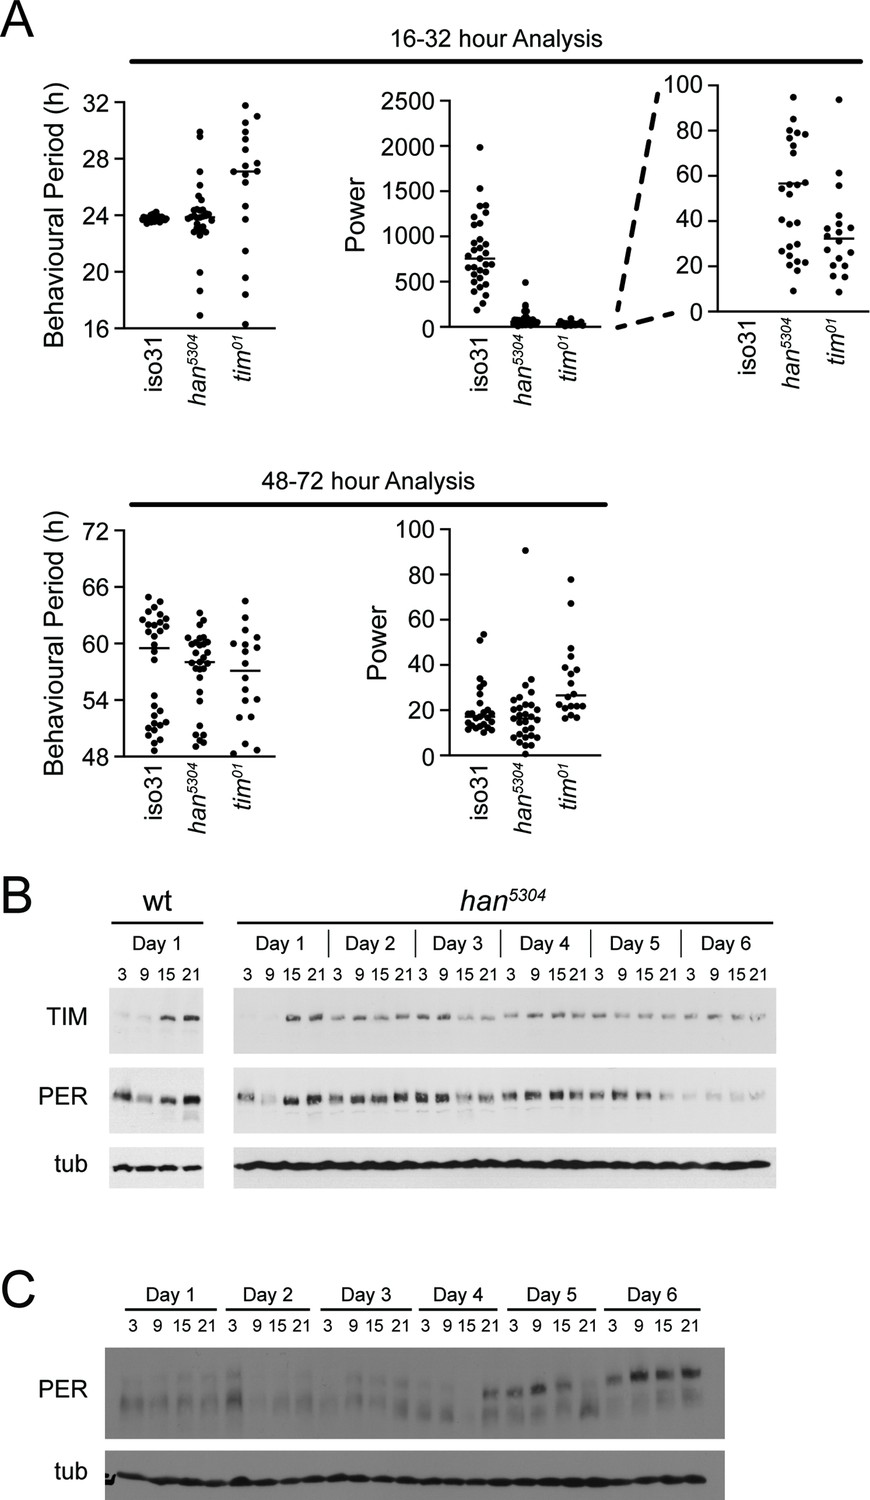
Behavioural period analysis of wild-type, han5304 and tim01 flies.
(A) Behavioural period (left panels) is calculated in the 16-hour to 32-hour range or 48-hr to 72-hr range for wild-type (iso31), han5304 and tim01 mutant flies and plotted. Black bars represent the mean for each genotype. Power of fit of each period determination (right panels, right blowout) is plotted for each fly genotype indicated. Black bar represents the mean. (B) Wild-type (iso31) and han5304 mutant flies were collected at 6 hr intervals at the indicated time points in constant darkness (CT), heads isolated, and protein extracted. Protein extracts were immunoblotted using TIM, PER, and tubulin (tub) antibody. Representative blots shown. (C) Wild-type (iso31) flies were collected at 6 hr intervals at the indicated time points in constant darkness (CT) and protein extracted from whole bodies. Protein extracts were immunoblotted using PER and tubulin antibodies. Representative blots shown.
Figure 4 with 2 supplements
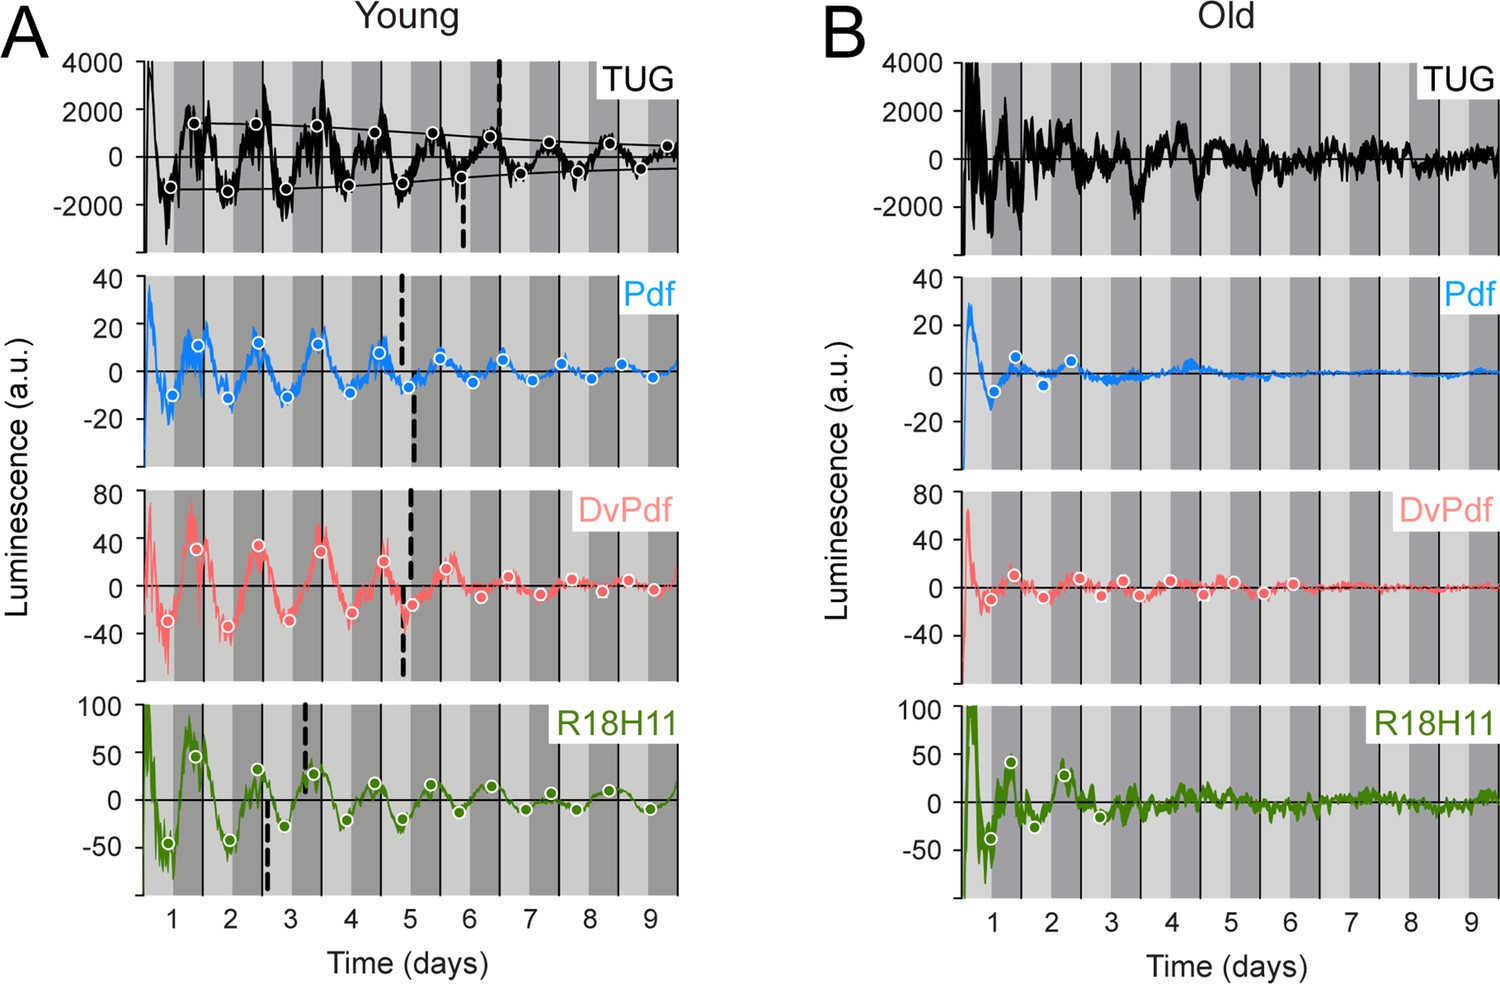
Luminescence oscillations of distinct clocks measured in young and aged flies.
Luminescence signal using different Gal4 drivers to activate LABL compared in young (1–3 day old) and old (39–41 day old) flies. Drivers used to activate LABL are TUG (black), Pdf-Gal4 (blue), DvPdf-Gal4 (pink), or R18H11-Gal4 (green) in otherwise wild-type flies. Luminescence values are normalized and averaged into 30 minute bins, and the mean of four experiments presented, +/-SEM (thickness of curve). Light grey and dark grey backgrounds represent subjective day and subjective night, respectively. Vertical solid black lines divide days. The peaks and troughs of the presented curves are represented by dots, which are the mean of four experiments, +/-SEM. Where dots are absent, no peak/trough could be fitted. Lines connecting peaks or troughs are best-fit S-curves. The vertical dashed lines define the point of inflection of each S-curve, which is used to define the A50. Where a vertical dashed line is absent, either no S-curve could be fitted, or no decay could be detected.
Figure 4—figure supplement 1

Body drivers create ~24 hr oscillation patterns with different amplitude decay in wild-type LABL flies.
Luminescence oscillations measured from LABL flies activated by the indicated Gal4 drivers, in otherwise wild-type flies, plotted over time. Drivers used are Clk4.1-Gal4 (brown), Mai179-Gal4 (purple) and Clk9M-Gal4 (teal). Luminescence signal is normalized to exponential decay of signal, the values are averaged into 30 min bins, and the mean of the four experiments presented, +/-SEM (thickness of curve). Light grey and dark grey backgrounds represent subjective day and subjective night, respectively. Vertical solid black lines divide days. The peaks and troughs of the presented curves are represented by dots, and are the mean of four experiments, +/-SEM. Lines connecting the dots of peaks or troughs are best-fit S-curves. The vertical dashed lines define the point of inflection of each S-curve, which is used to define the A50.
Figure 4—figure supplement 2
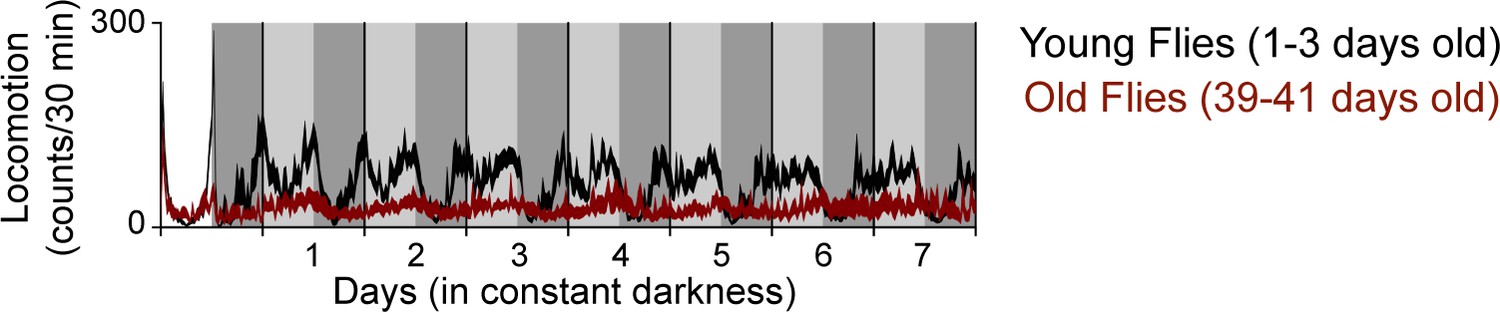
Aged flies exhibit weak locomotor rhythms.
Curve represents rhythmic locomotor activity of 16 young (1–3 days old) flies (black) and 11 old (46–48 days old) flies (dark red), +/-SEM (thickness of curve). Vertical solid lines divide days. Light grey and dark grey backgrounds represent subjective day and subjective night, respectively. White background represents objective day.
Figure 5

Simulations of oscillations with phase decay and measurement of distinct clocks in aged flies reveal rapidly decaying clock amplitude.
(A) Abrupt phase change simulation. Half of 100 simulated oscillations were made to phase advance at 1.5 days (arrow) by the indicated amount of time (red line). Oscillators with no phase change (black line) are illustrated as a reference point. Y-axis represents the peak of oscillations in arbitrary units. The x-axis represents time in days. (B) Gradual phase change simulation. At each time point, each of 100 simulated oscillators were randomly picked from a normal distribution with mean 0 and standard deviation, σ, that increased linearly with time from σ=0 hr at t=0 hr to σ=6 hr (upper graph) or 12 hr (lower graph) at t=336 hr (red line) compared to phase-locked controls (black line). The y-axis of graphs represents the peak of oscillations in arbitrary units, while the x-axis represents time in days. White dots with red borders represent peaks and troughs of local maxima and minima. Black S-curves are fitted to these minima or maxima. The red dashed vertical line represents the point of inflection of the S-curves (A50). Graphs on the right represent the change of oscillator phases across time.
Figure 6
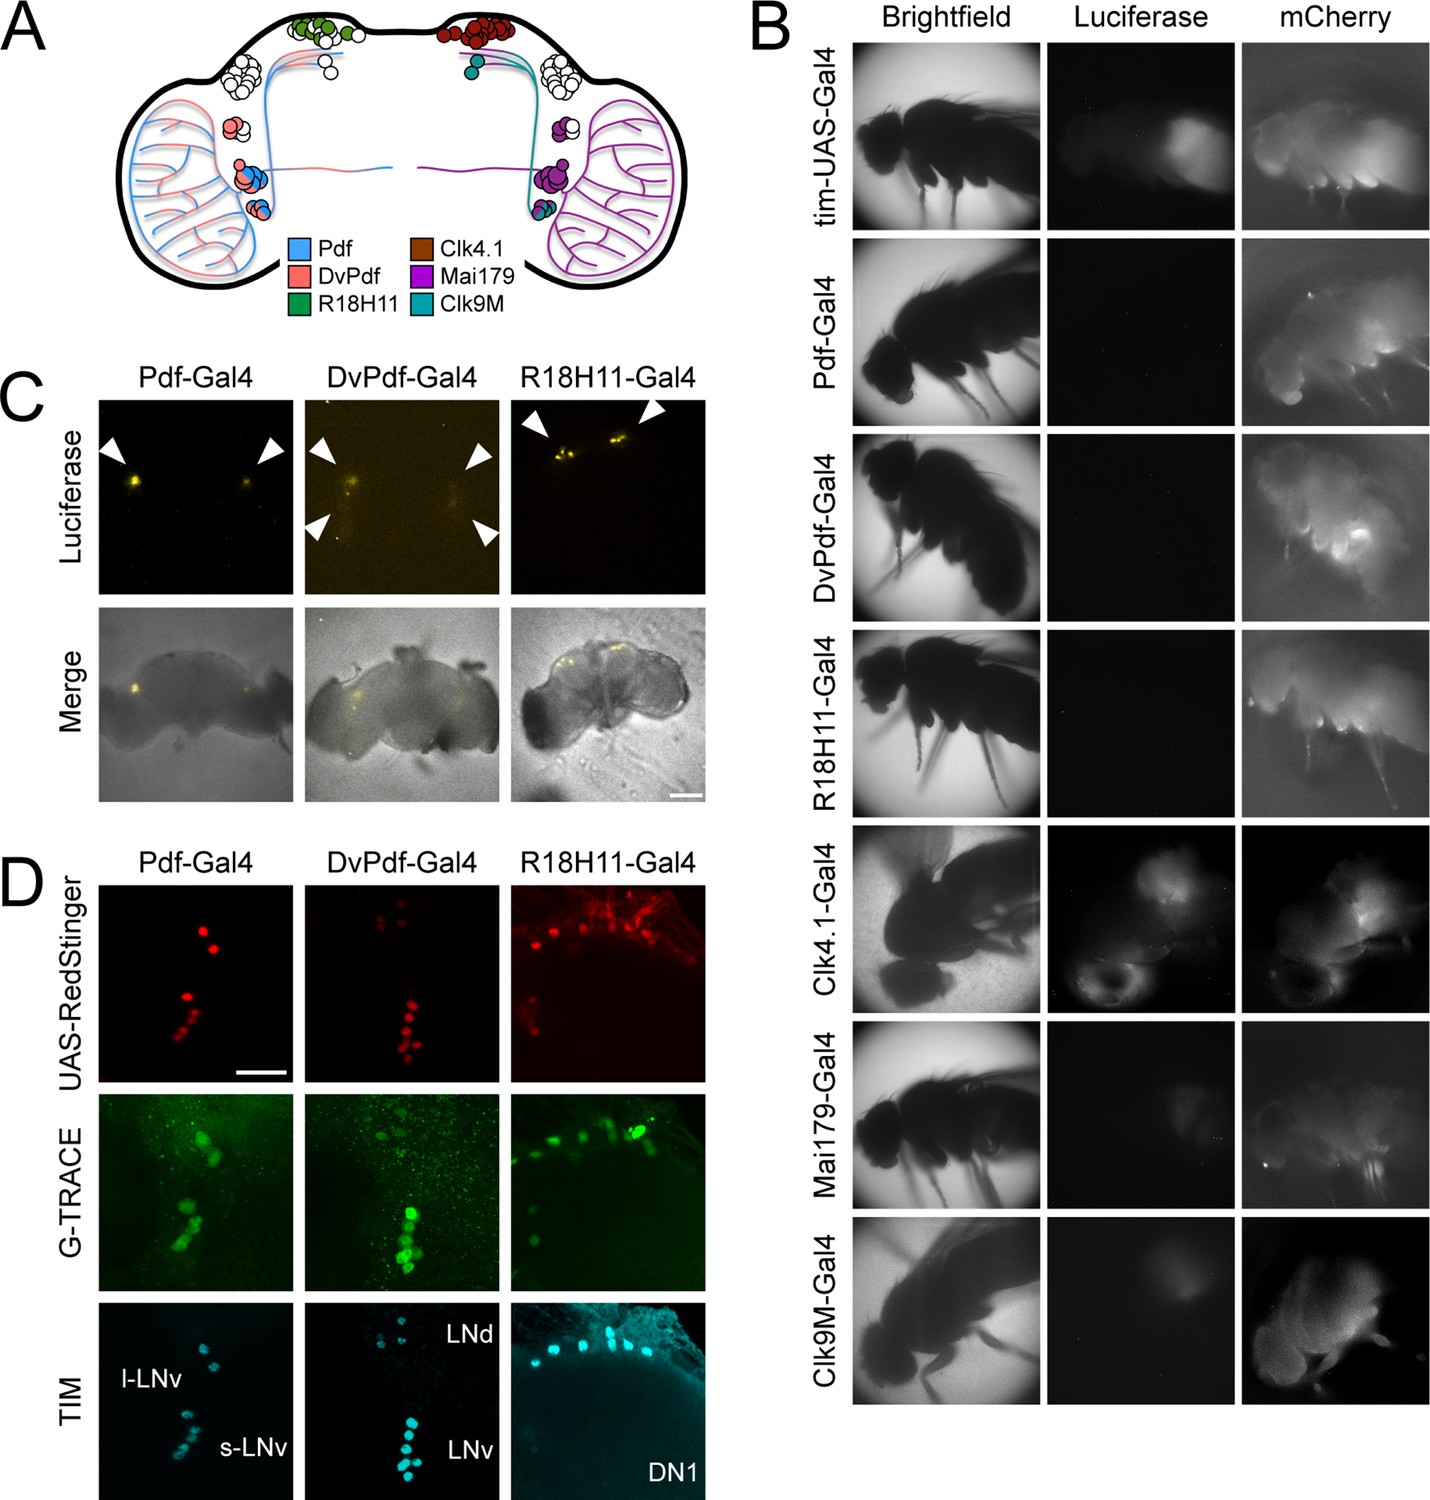
Different circadian Gal4 drivers activate LABL in distinct neurons and tissues.
(A) Schematic of a Drosophila brain and Gal4 driver expression patterns. Pdf-Gal4 (blue): LNvs. DvPdf-Gal4 (pink) and Mai179-Gal4 (purple): LNvs, 3 LNds and 5th s-LNv. R18H11-Gal4 (green) and Clk4.1-Gal4 (brown): DN1s. Clk9M-Gal4 (teal): DN2s and small LNvs. (B) Luminescence and fluorescence images of whole flies. Flies are shown in bright field (first column), imaged for luminescence (Luciferase; second column) and fluorescence (mCherry; third column). Drivers described in panel A were used to activate LABL in the flies, as indicated. (C) Luminescence images of explanted brains. Explanted live brains were imaged for luminescence (Luciferase; top row) and imaged in bright field merged with luminescence (bottom row) to determine sites of LABL activation by the indicated Gal4 drivers. White arrow heads denote estimated location of clock neurons: LNvs in Pdf-Gal4 neurons, LNvs and LNds in DvPdf-Gal4 neurons and DN1s in R18H11-Gal4 neurons. Scale bar represents 50 μm. (D) Sites of Flipase activity in fly brains. Fly lines expressing UAS-RedStinger (red fluorescence protein, shown in red) and the indicated driver were crossed into G-TRACE flies and brains were stained for TIM (cyan), RedStinger (red) and GFP (G-TRACE; green). Identity of fluorescence neurons labelled in bottom row. l-LNv: large ventral lateral neurons. s-LNv: small ventral lateral neurons. LNd: dorsal lateral neurons. DN1: dorsal neurons 1. GFP expression is indicative of FLP activity. Pdf-Gal4 driver targets LNvs, DvPdf-Gal4 driver targets LNvs, 5th s-LNv, 3 LNds, and R18H11-Gal4 driver targets DN1s. Scale bar represents 20 μm.
Figure 7 with 1 supplement
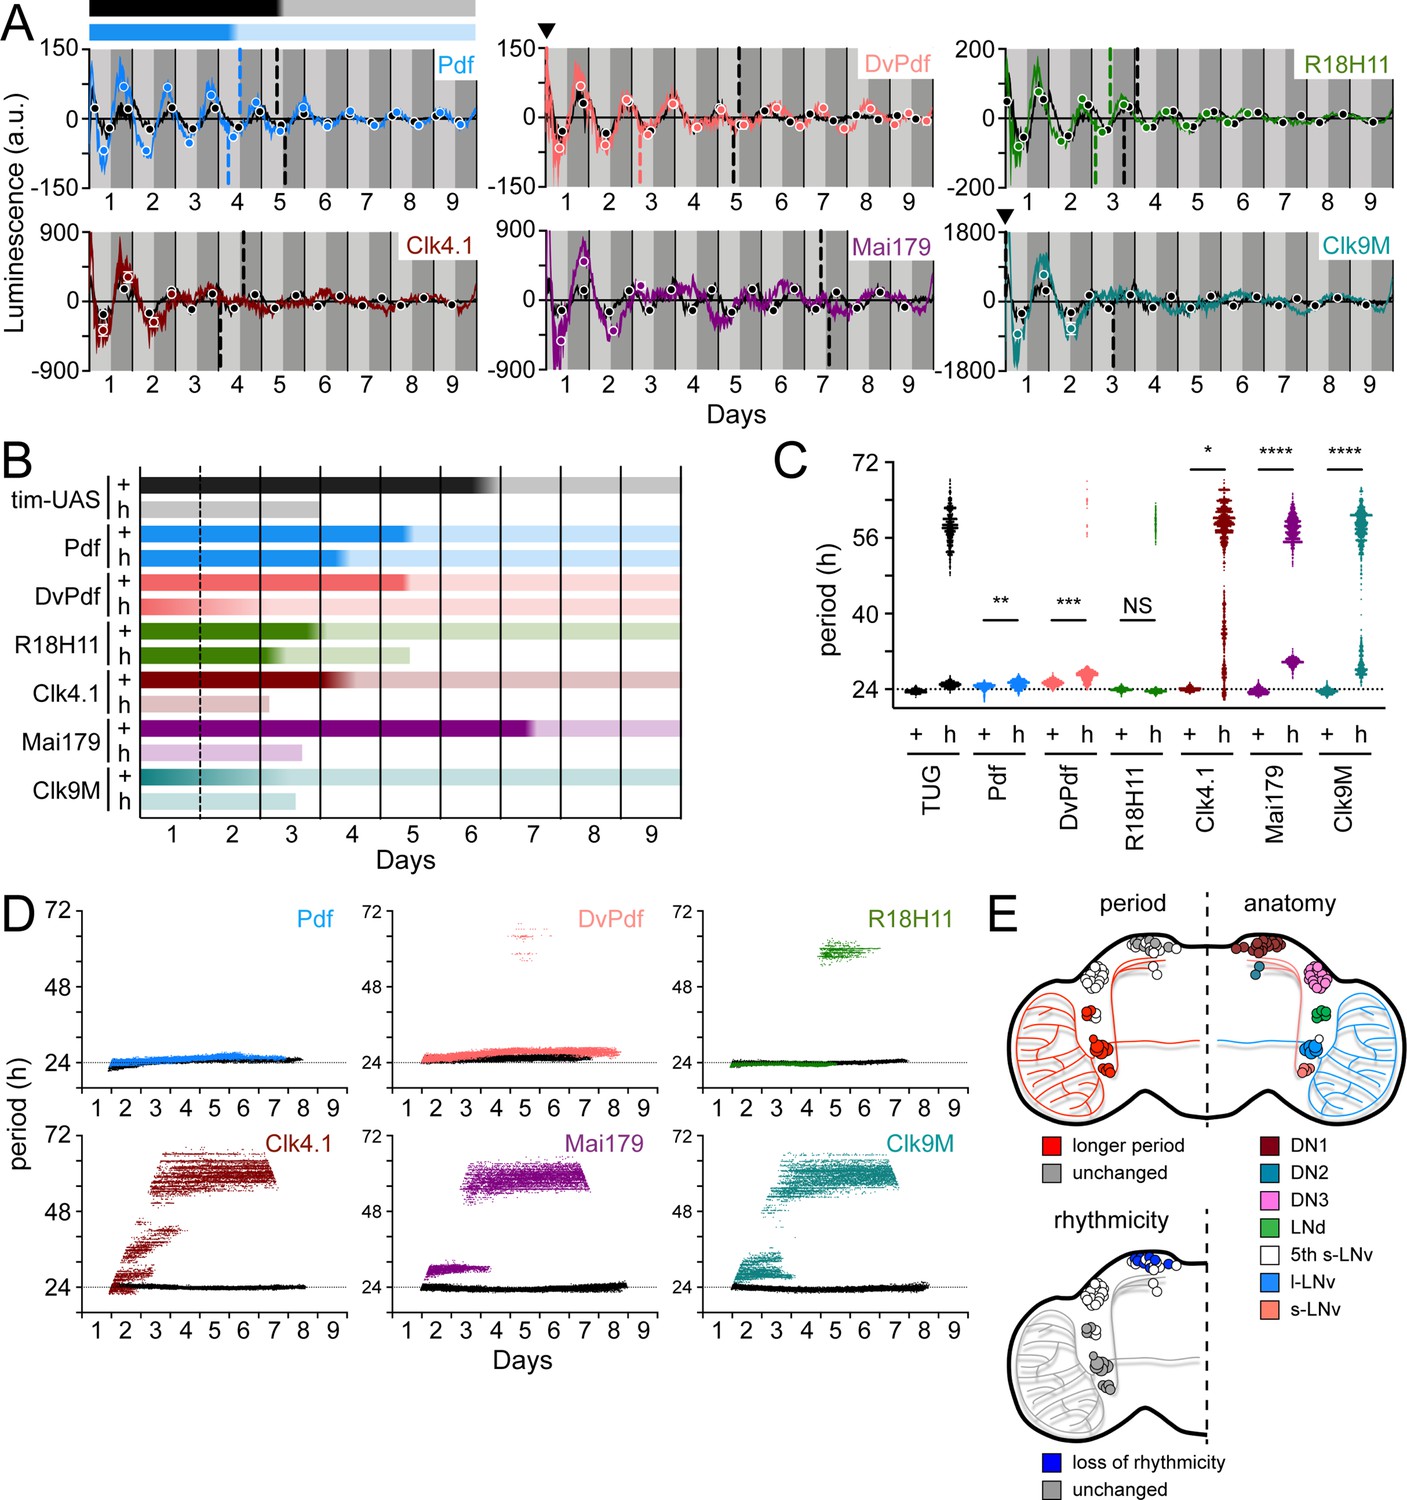
Different circadian Gal4 drivers create distinct oscillation patterns that respond to loss of PDF signaling differently.
(A) Luminescence oscillations measured from LABL flies activated by the indicated Gal4 drivers, in a wild-type or PDF signaling deficient genetic background, plotted over time. Colored curves represent signal from flies with no PDF signaling (han5304) compared to their wild-type counterparts (black curves). Drivers used are Pdf-Gal4 (light blue), DvPdf-Gal4 (pink), R18H11-Gal4 (green), Clk4.1-Gal4 (brown), Mai179-Gal4 (purple), and Clk9M-Gal4 (teal). Otherwise, graphs are as described in Figure 2C. Bar above the curve is a visual representation of the amplitude decay across time: color fade represents the A50 calculated from the peaks and troughs. Black bar represents amplitude decay of Pdf-Gal4 activated oscillations in wild-type flies; blue bar represents amplitude decay of Pdf-Gal4 activated oscillations in han5304 mutant flies. Location of A50 with a value close to x=0 that are not readily visible are indicated with a black triangle. Where A50 values are absent, no reliable S-curve fit was made (i.e. too few data points). (B) Stability of luminescence oscillations from LABL flies expressing different drivers are quantified in a wild-type (+) and PDF signaling-deficient (han5304; h) background. Colors correlate with Gal4 drivers described in panel A. Color fade in the bars represent the A50 calculated from the peaks and troughs. Faded color through entirety of bar illustrates no A50 calculation due to too few data points for S-curve fit. Length of bar indicates time at which luminescence oscillation becomes arrhythmic. (C) Differences in average period of luminescence oscillation measured by Morlet wavelet fitting, comparing wild-type (+) and PDF signaling deficient (han5304; h) flies. Colors correlate with Gal4 drivers described in panel A. If arrhythmic (>48 hr) period fits are excluded, periods of oscillations measured in the brain for wild-type and han5304 flies can be averaged, +/-SD. Wild type: Pdf, 24.53 +/-0.61; DvPdf, 25.33 +/-0.58; R18H11, 23.93 +/-0.33 hr. han5304: Pdf, 25.08 +/-0.78; DvPdf, 26.79 +/-1.02; R18H11, 23.58 +/-0.30 hr. The dotted horizontal line denotes 24 hr as a point of reference. Periods of oscillations between han5304 and wild-type flies before decay into arrhythmic or infradian oscillations (i.e., <48 hr) are averaged (black bars), and statistical significance determined between four experimental replicates (t-test). *: p<0.05, **: p<0.01, ***: p<0.001, ****: p<0.0001, NS: not significant. (D) Changes in oscillation period over time determined by Morlet wavelet fitting. Colored dots represent best fits from flies with no PDF signalilng (han5304) compared to their wild-type counterparts (black curves). Colors correlate with Gal4 drivers described in panel A. The dotted horizontal line denotes 24 hr as a point of reference. (E) Schematic summary of changes in period and rhythmicity of luminescence oscillation in distinct parts of the fly brain caused by loss of PDF signaling (han5304 genetic background). LNvs and 3 LNds exhibit longer luminescence oscillation period (top left hemisphere, red) but remain rhythmic (bottom left hemisphere, grey). Luminescence oscillation in DN1s maintain the same period with loss of PDF signaling (top left hemisphere, grey), but become arrhythmic over time (bottom left hemisphere, blue). Anatomical location of s-LNvs (small ventral lateral neurons), l-LNvs (large ventral lateral neurons), 5th s-LNv (5th small ventral lateral neuron), LNds (dorsal lateral neurons), and DN1s, DN2s, DN3s (dorsal neurons 1, 2, 3), as shown (top right hemisphere).
Figure 7—figure supplement 1
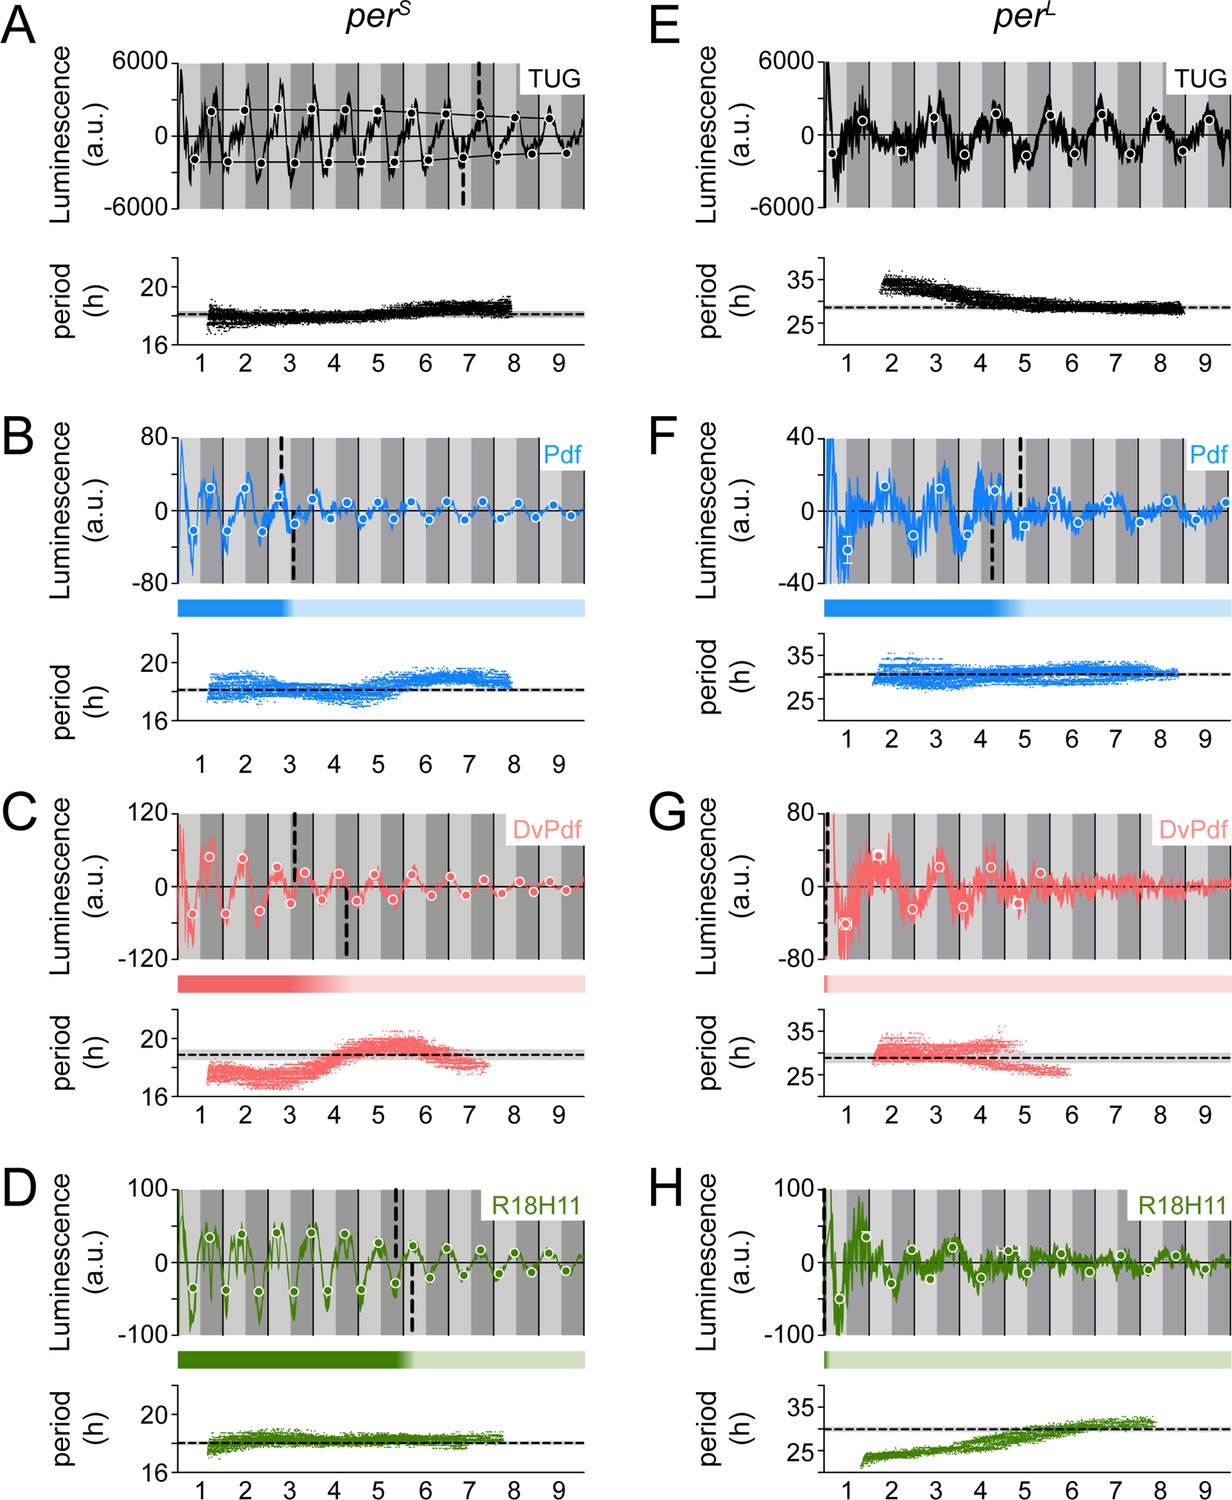
Circadian clock mutant flies perS and perL reveal distinct oscillatory properties in different parts of the brain.
Luminescence signal and locomotor activity of flies carrying the perS (A–D) or perL (E–H) mutations compared. Drivers used to activate LABL are TUG (black; A, E), Pdf-Gal4 (blue; B, F), DvPdf-Gal4 (pink; C, G), or R18H11-Gal4 (green; D, H) in otherwise wild-type flies. Luminescence signal from flies carrying the indicated mutation and with LABL activated using the indicated drivers was averaged into 30-min bins, and the mean of the four experiments presented, +/-SEM (thickness of curve). Light grey and dark grey backgrounds represent subjective day and subjective night, respectively. Vertical solid black lines divide days. The peaks and troughs of the presented curves are represented by a dot, and are the mean of four experiments, +/-SEM. The vertical dashed lines define the point of inflection of each S-curve of amplitude decay to define the A50. Bar below the curve is a visual representation of the amplitude decay across time: color fade represents the A50 calculated from the peaks and troughs. Scatter plot of best-fit Morlet wavelets demonstrate changes in period across time. Confidence intervals of 25% or less were omitted. The dotted horizontal line denotes mean of the period of behavioural rhythms, with the grey shaded area representing the mean, +/-SD.
Figure 8 with 1 supplement
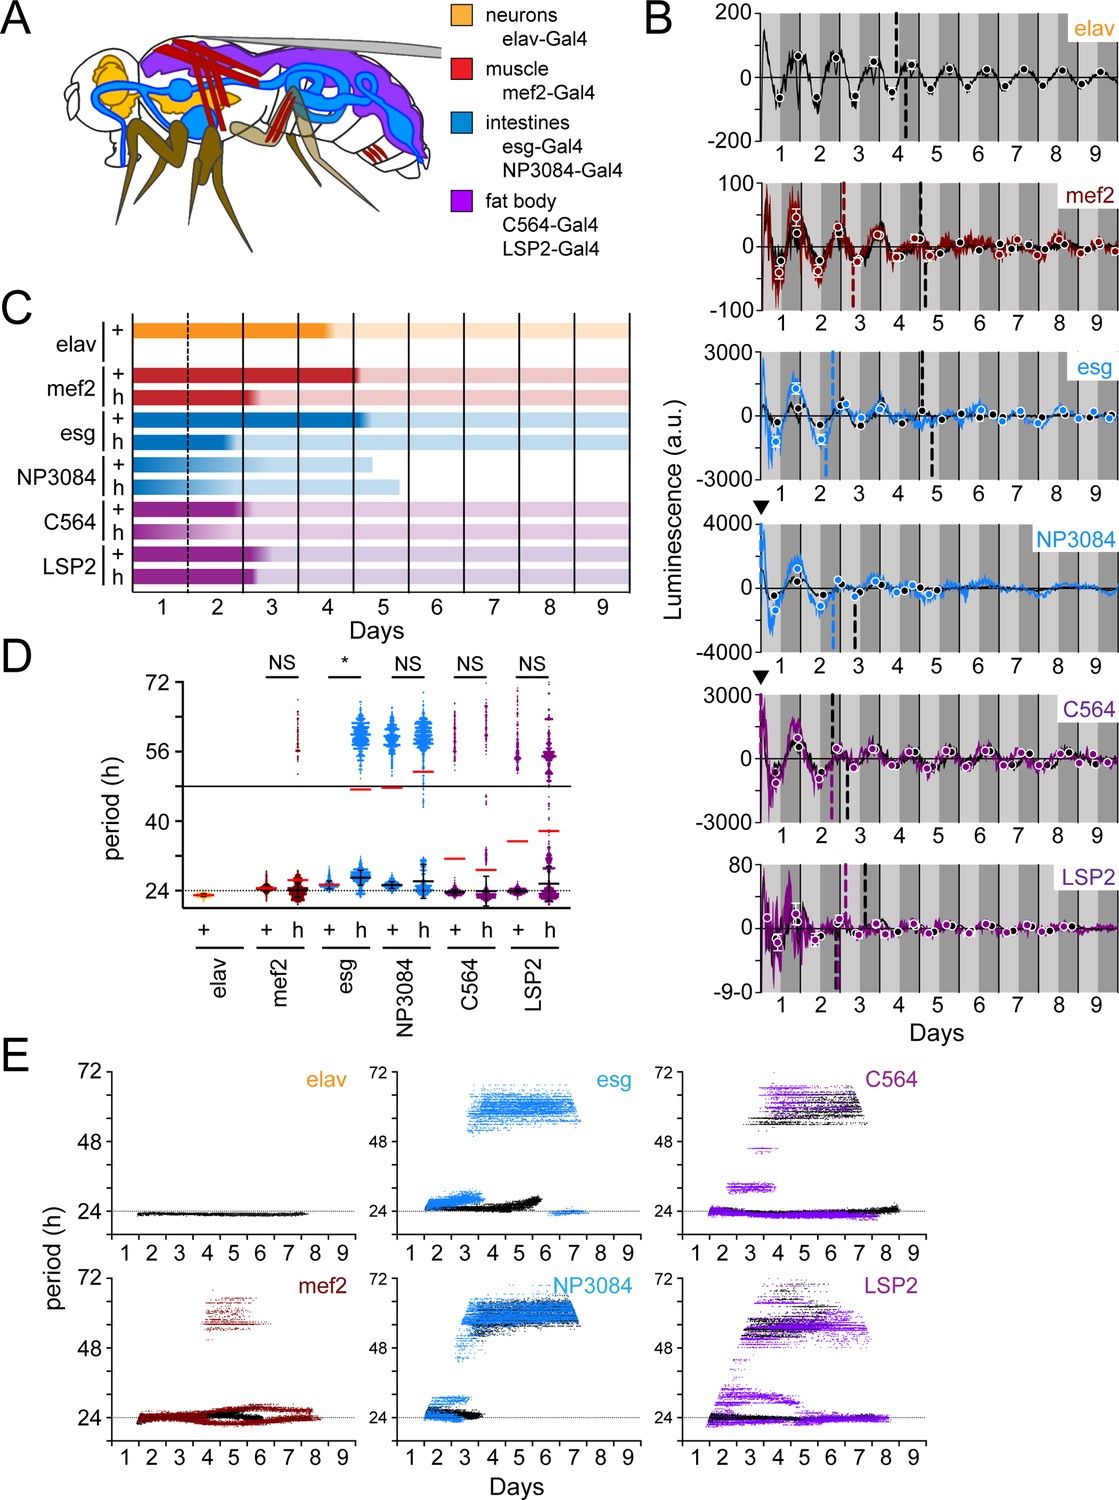
Peripheral clocks have distinct characteristics in a wild-type and PDF receptor mutant genetic background.
(A) Schematic of target expression pattern of peripheral tissue Gal4 drivers in Drosophila. elav-Gal4 (neurons; orange), mef2-Gal4 (muscle; red), esg-Gal4 and NP3084-Gal4 (intestines; blue), and C564-Gal4 and LSP2-Gal4 (fat body; purple). Note that C564-Gal4 also expresses in hemocytes and some male reproductive tissues and mef2-Gal4 has been reported to express LNv neurons. (B) Luminescence oscillations measured from LABL flies activated by the indicated Gal4 drivers in peripheral tissues, in a wild-type or PDF signaling deficient genetic background, plotted over time. Colored curves represent signal from flies with no PDF signaling (han5304) compared to their wild-type counterparts (black curves). Luminescence signals from wild-type flies are reproduced in Figure 8—figure supplement 1 for clarity. Drivers used are as indicated and described in panel A. Graphs are as described in Figure 2C. Location of A50 with a value close to x=0 that are not readily visible are indicated with a black triangle. (C) Stability of luminescence oscillations from LABL flies expressing different drivers are quantified in a wild-type (+) and PDF signaling deficient (han5304; h) background. Colors correlate with Gal4 drivers described in panel A. Color fade in the bars represent the location of the A50 calculated from the peaks and troughs. Length of bar indicates time at which luminescence oscillation becomes arrhythmic. (D) Differences in average period of luminescence oscillation measured by Morlet wavelet fitting, comparing wild-type (+) and PDF signaling deficient (han5304; h) flies. Colors correlate with Gal4 drivers described in panel A. Black bars represent mean period of ‘rhythmic’ oscillations early in measurement, +/-SEM. Red bars represent mean period of all wavelet fits (including those >48 hr). The dotted and solid horizontal lines denote 24 and 48 hras a point of reference, respectively. Periods of oscillations between han5304 and wild-type flies before decay into arrhythmic or infradian oscillations (i.e. <48 hr) are averaged (black bars), and statistical significance determined between four experimental replicates (t-test). *: p<0.05, NS: not significant. (E) Changes in oscillation period over time determined by Morlet wavelet fitting. Colored dots represent best fits from flies with no PDF signaling (han5304) compared to their wild-type counterparts (black curves). Colors correlate with Gal4 drivers described in panel A. The dotted horizontal line denotes 24 hr as a point of reference.
Figure 8—figure supplement 1
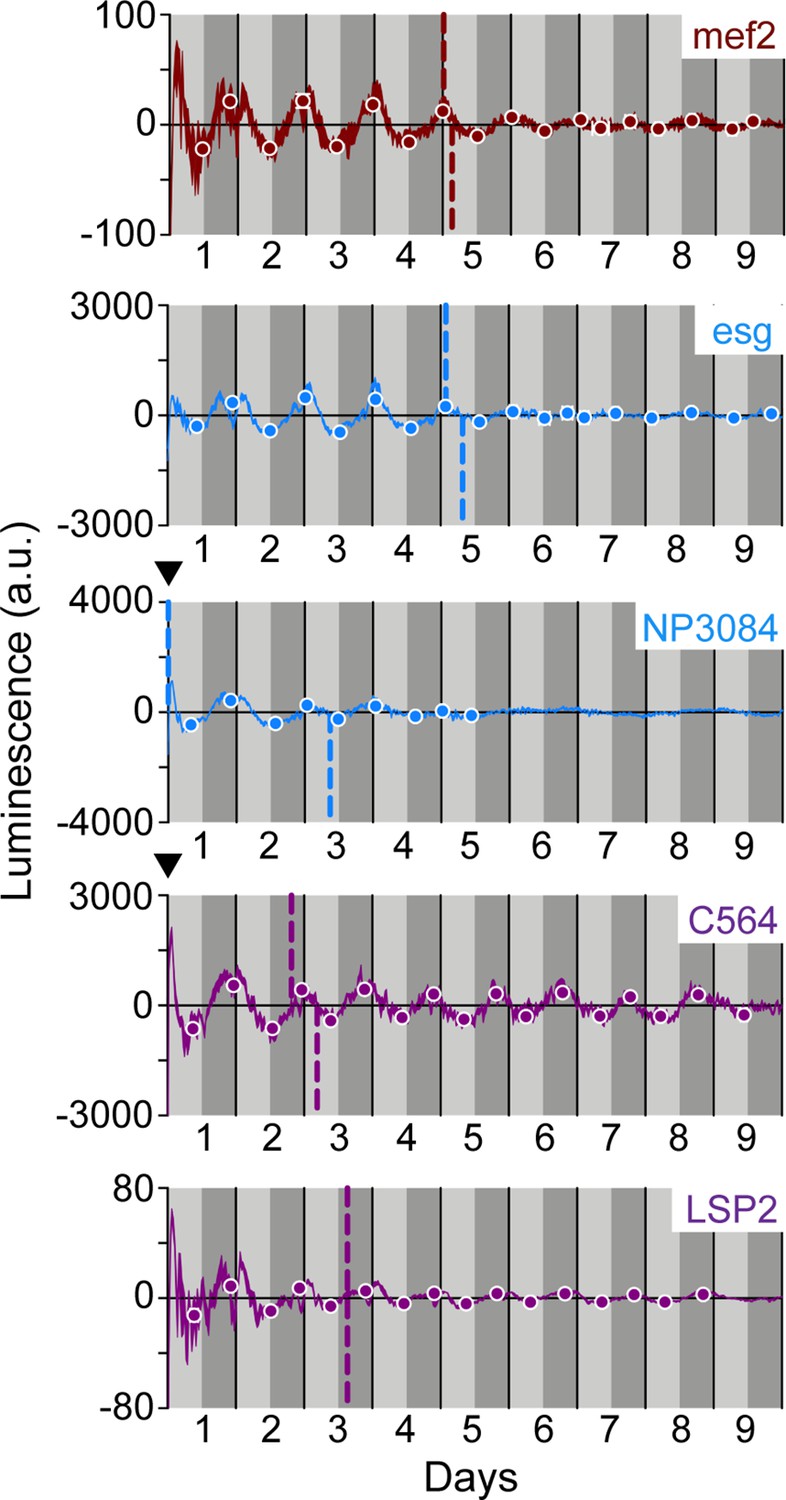
Peripheral clocks exhibit ~24 hr oscillation patterns in wild-type LABL flies.
Luminescence oscillations measured from LABL flies activated by the indicated Gal4 drivers, in otherwise wild-type flies, plotted over time. Drivers used are as labelled: mef2-Gal4 (brown), esg-Gal4 and NP3084-Gal4 (blue), and C564-Gal4 and LSP2-Gal4 (purple) lines. Luminescence signal is normalized to exponential decay of signal, the values are averaged into 30-min bins, and the mean of the four experiments presented, +/-SEM (thickness of curve). Light grey and dark grey backgrounds represent subjective day and subjective night, respectively. Vertical solid black lines divide days. The peaks and troughs of the presented curves are represented by dots, and are the mean of four experiments, +/-SEM. Lines connecting the dots of peaks or troughs are best-fit S-curves. The vertical dashed lines define the point of inflection of each S-curve, which is used to define the A50. Location of A50 with a value close to x=0 that are not readily visible are indicated with a black triangle.
Additional files
-
Transparent reporting form
- https://cdn.elifesciences.org/articles/77029/elife-77029-transrepform1-v2.pdf
-
Supplementary file 1
Genotypes of flies used in the figures.
For LABL experiments, stocks are maintained with one parental line expressing both the Gal4 driver and LABL reporter, and the other parental line expressing UAS-FLP.
- https://cdn.elifesciences.org/articles/77029/elife-77029-supp1-v2.docx
Download links
A two-part list of links to download the article, or parts of the article, in various formats.
Downloads (link to download the article as PDF)
Open citations (links to open the citations from this article in various online reference manager services)
Cite this article (links to download the citations from this article in formats compatible with various reference manager tools)
Real time, in vivo measurement of neuronal and peripheral clocks in Drosophila melanogaster
eLife 11:e77029.
https://doi.org/10.7554/eLife.77029


