Sparse genetically defined neurons refine the canonical role of periaqueductal gray columnar organization
- Neuroscience Interdepartmental Program, University of California, Los Angeles, United States
- Department of Psychology, University of California, Los Angeles, United States
- Hatos Center for Neuropharmacology, University of California, Los Angeles, United States
- Department of Psychiatry and Biobehavioral Sciences, United States
- Semel Institute for Neuroscience and Human Behavior, United States
Figures
Figure 1 with 1 supplement
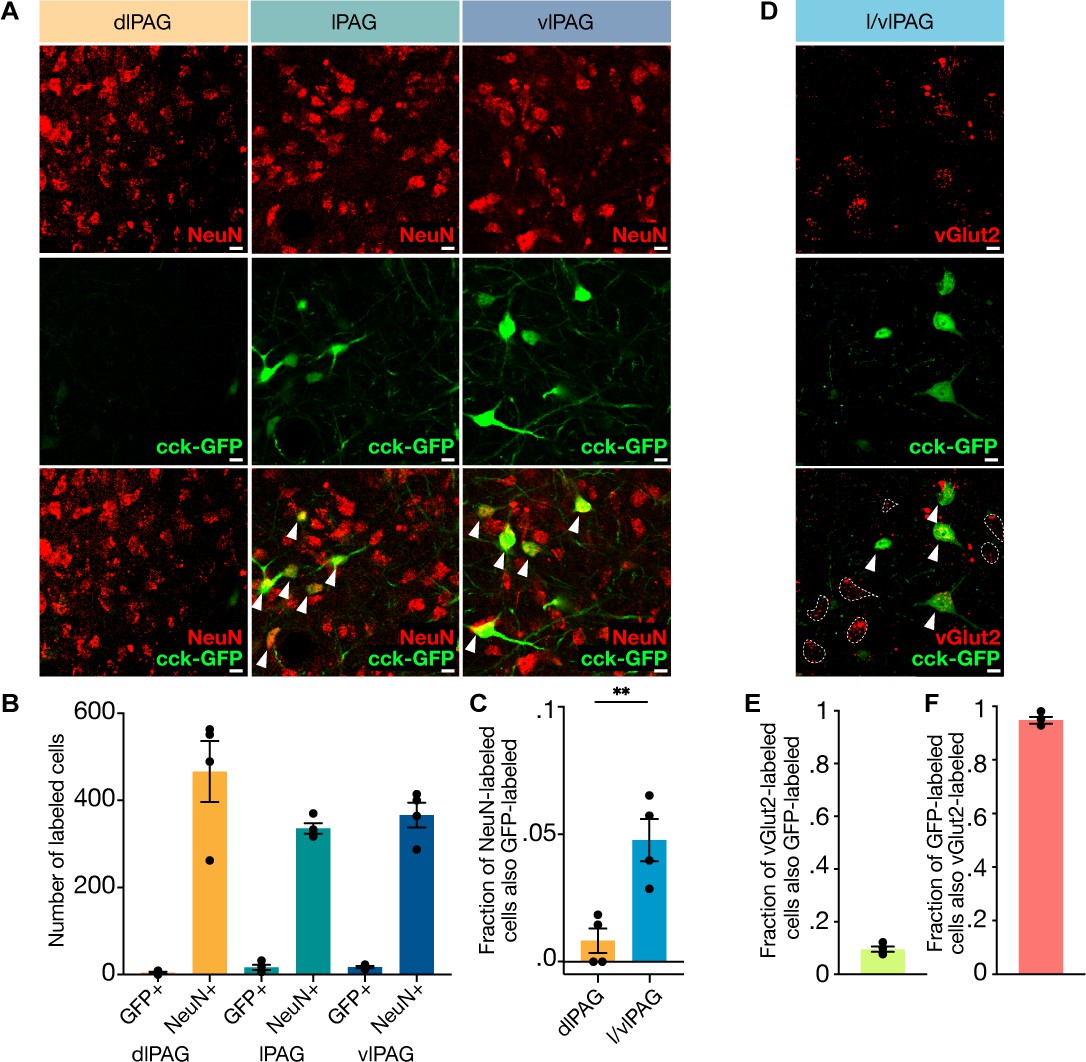
Cholecystokinin-expressing (CCK+) cells comprise approximately 5% of lateral/ventrolateral periaqueductal gray (l/vlPAG) neurons and are primarily glutamatergic.
(A) Example histology images showing immunostaining of pan-neuronal marker NeuN (top row), viral-mediated expression of GFP in CCK-expressing cells (middle row), and overlay of NeuN and CCK-GFP (bottom row) in the dorsolateral (left column), lateral (middle column), and ventrolateral (right column) PAG. Scale bars, 10 μm. (B) Raw counts of CCK-GFP+ and NeuN+ cells in the dorsolateral PAG (dlPAG), lPAG, and vlPAG. (C) Fraction of NeuN-labeled cells that are also GFP-labeled in the dlPAG and l/vlPAG. CCK-expressing cells comprise ~5% of l/vlPAG neurons and constitute significantly more of l/vlPAG neurons than dlPAG neurons (n = 4; paired t-test, **P=.0032). (D) Immunostaining of glutamatergic marker vGlut2 in CCK cells. Example histology images showing vGlut2 (top), CCK-GFP (middle) and vGlut2/GFP overlay (bottom). White arrow indicates vGlut2+/GFP+ cell. Dashed outline indicates vGlut2+/GFP- cell. Scale bar, 10 μm. (E) 9.6% of vGlut2-labeled cells in the l/vlPAG are also GFP-labeled (n = 4; 302 vGlut2/GFP+ of 3115 vGlut2+ cells). (F) A majority (94.8%) of GFP-labeled cells in the l/vlPAG are also vGlut2-labeled (n = 4; 302 vGlut2+/GFP+ of 317 GFP+ cells). Errorbars: mean ± SEM.
Figure 1—figure supplement 1
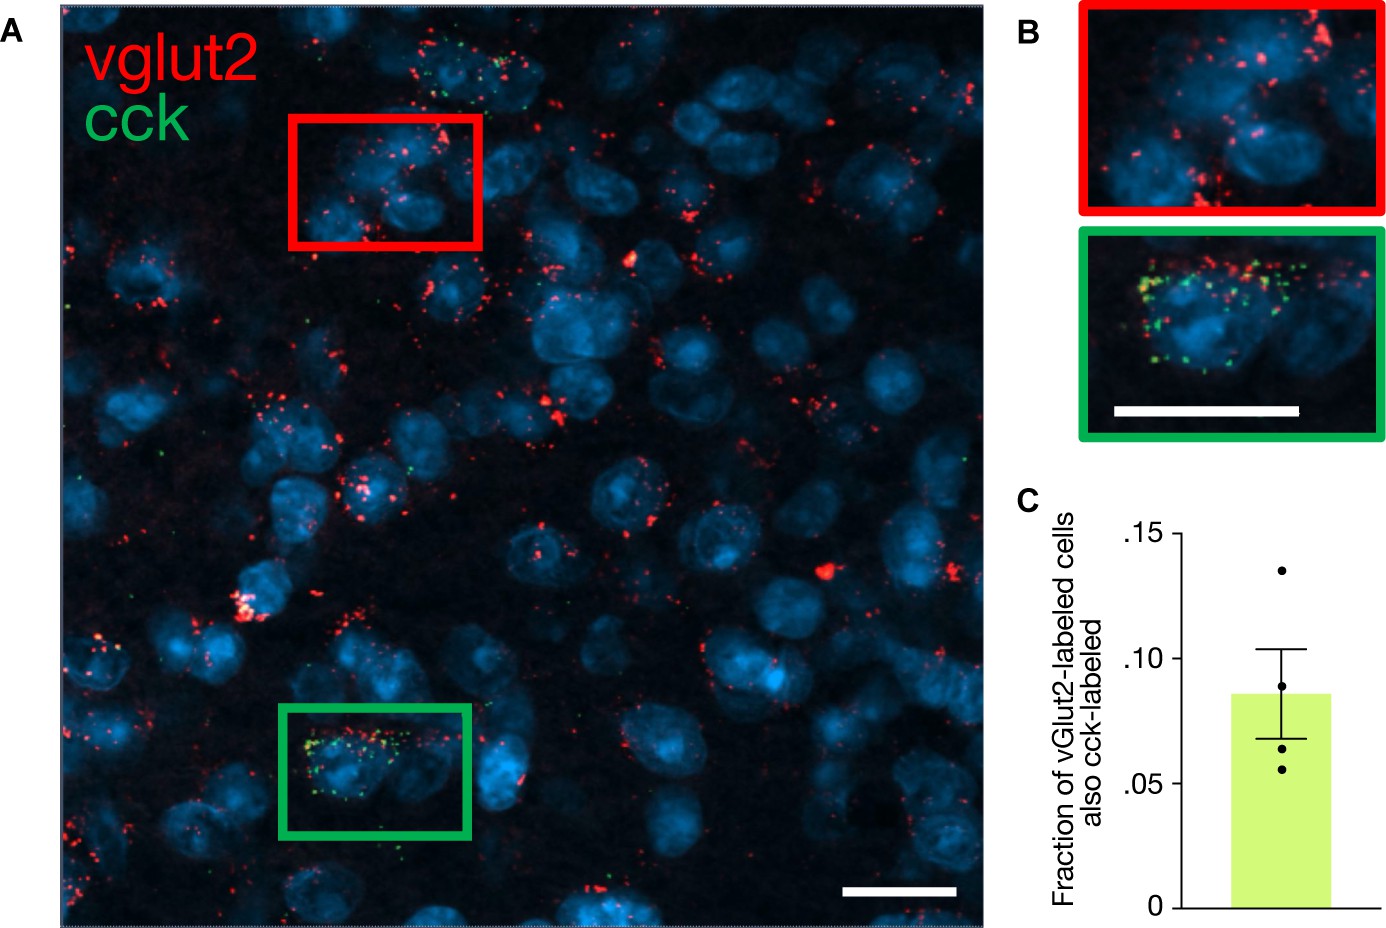
In situ hybridization of vglut2 and cholecystokinin-expressing (CCK) cells in the lateral/ventrolateral periaqueductal gray (l/vlPAG) shows double labeling of vglut2 and CCK.
(A) In situ hybridization labeling of l/vlPAG neurons showing mRNAs for CCK (green) and VGLUT2 (red). Nuclei stained by DAPI are shown in blue. Example image (×40 objective) of vglut2-labeled cells (red rectangle) and double-labeled vglut2/CCK-labeled (green rectangle) in l/vlPAG. Scale bar, 20 µm. (B) Zoomed-in images of subregions in (A). Scale bar, 20 µm. (C) 8.58% of vglut2-labeled cells are also CCK-labeled (15 of 183 total cells). Errorbars: mean ± SEM.
Figure 2 with 1 supplement
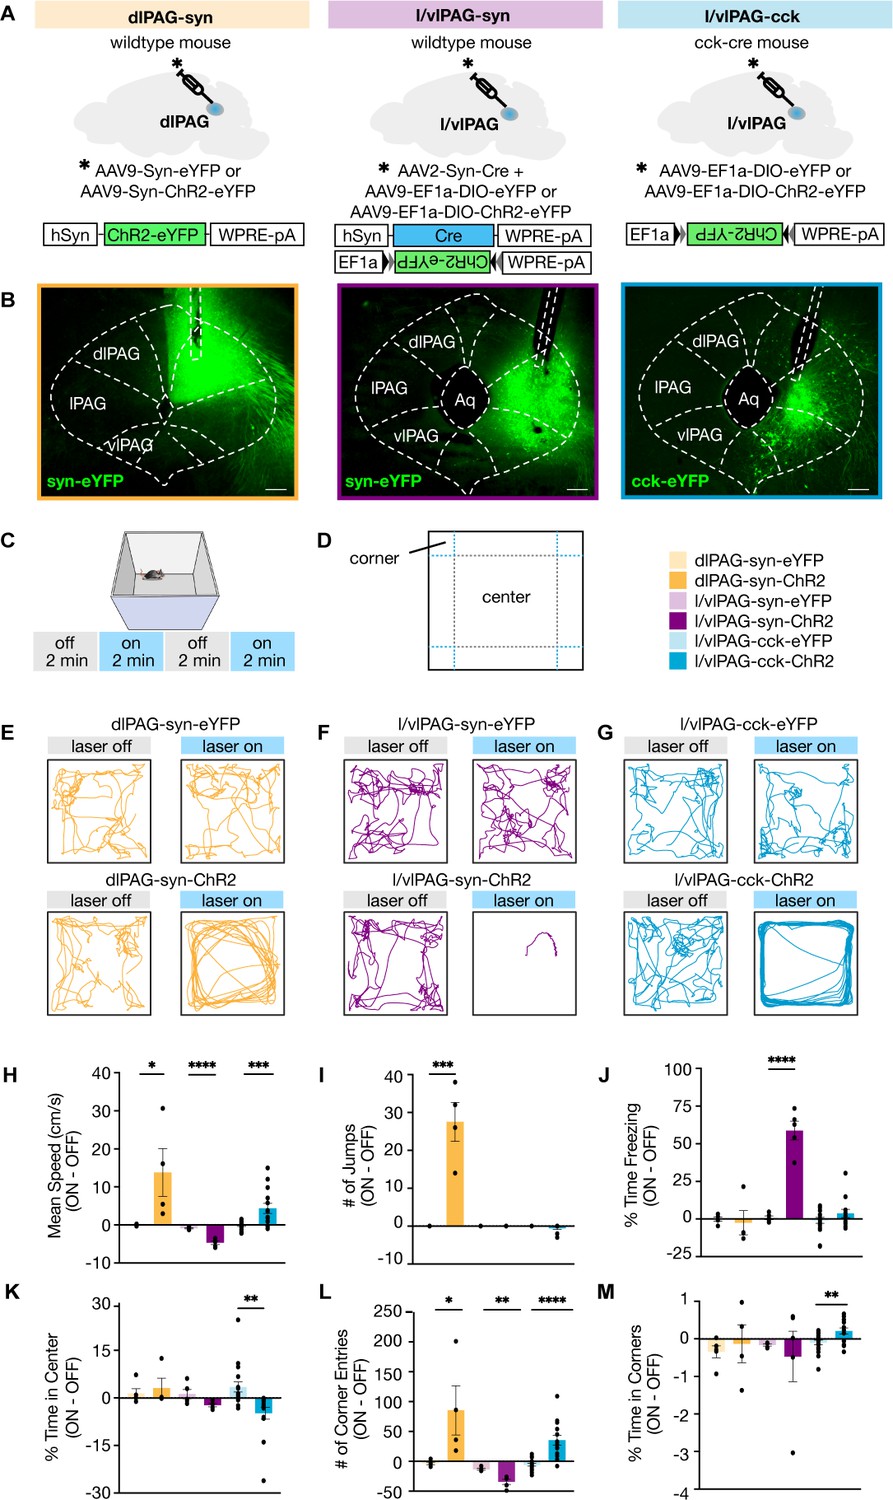
Lateral/ventrolateral periaqueductal gray-cholecystokinin-expressing (l/vlPAG-CCK) cell stimulation induced a repertoire of behaviors distinct from pan-neuronal l/vlPAG and dorsolateral PAG (dlPAG) activation.
(A) Viral strategy to express enhanced yellow fluorescent protein (eYFP) or light-sensitive channelrhodopsin (ChR2-eYFP) in synapsin-expressing cells in the dlPAG (dlPAG-syn, left), synapsin-expressing cells in the l/vlPAG (l/vlPAG-syn, middle), and cholecystokinin-expressing cells in the l/vlPAG (l/vlPAG-CCK, right). A fiber optic cannula was then implanted over respective regions. (B) Histology of eYFP expression in dlPAG-syn (left), l/vlPAG-syn (middle), and l/vlPAG-CCK (right). Scale bar, 200 μm. (C) Stimulation protocol in the open field. Blue light (473 nm, 5 ms, 20 Hz) was delivered in alternating 2 min epochs (OFF-ON-OFF-ON) for 8 min total. (D) Diagram indicating center and corners of the open-field assay. (E–G) Example locomotion maps in the open field during laser-on and laser-off epochs of either mice expressing eYFP (top) or ChR2-eYFP (bottom) in dlPAG-syn (E), l/vlPAG-syn (F), and l/vlPAG-CCK (G) populations. (H–M) Bars depict respective behaviors during light-off epochs subtracted from light-on epochs (ON minus OFF). Light delivery to dlPAG of syn-ChR2 mice increased mean speed, jumps, and corner entries compared to dlPAG-syn-eYFP mice (dlPAG-eYFP, n = 5; dlPAG-ChR2, n = 4; unpaired t-tests; speed, *p=0.041; jumps, ***p=0.0005; corner entries, *p=0.044). Light delivery to the l/vlPAG of syn-ChR2 mice reduced mean speed, increased freezing, and reduced corner entries compared to l/vlPAG-syn-eYFP mice (l/vlPAG-syn-eYFP, n = 5; l/vlPAG-syn-ChR2, n = 5; unpaired t-tests; speed, ****p<0.0001; freezing, ****p<0.0001; corner entries, **p=0.0019). Light delivery to the l/vlPAG of CCK-ChR2 mice increased mean speed and corner entries while reducing center time compared to l/vlPAG-CCK-eYFP mice (l/vlPAG-CCK-eYFP, n = 17; l/vlPAG-CCK-ChR2, n = 14; unpaired t-tests; speed, ***p=0.001; corner entries, ****p<0.0001; center time, **p=0.0023). Importantly, time spent in corners increased during light delivery to l/vlPAG-CCK-ChR2 mice compared to l/vlPAG-CCK-eYFP mice (unpaired t-test, **p=0.006). Errorbars: mean ± SEM.
Figure 2—figure supplement 1
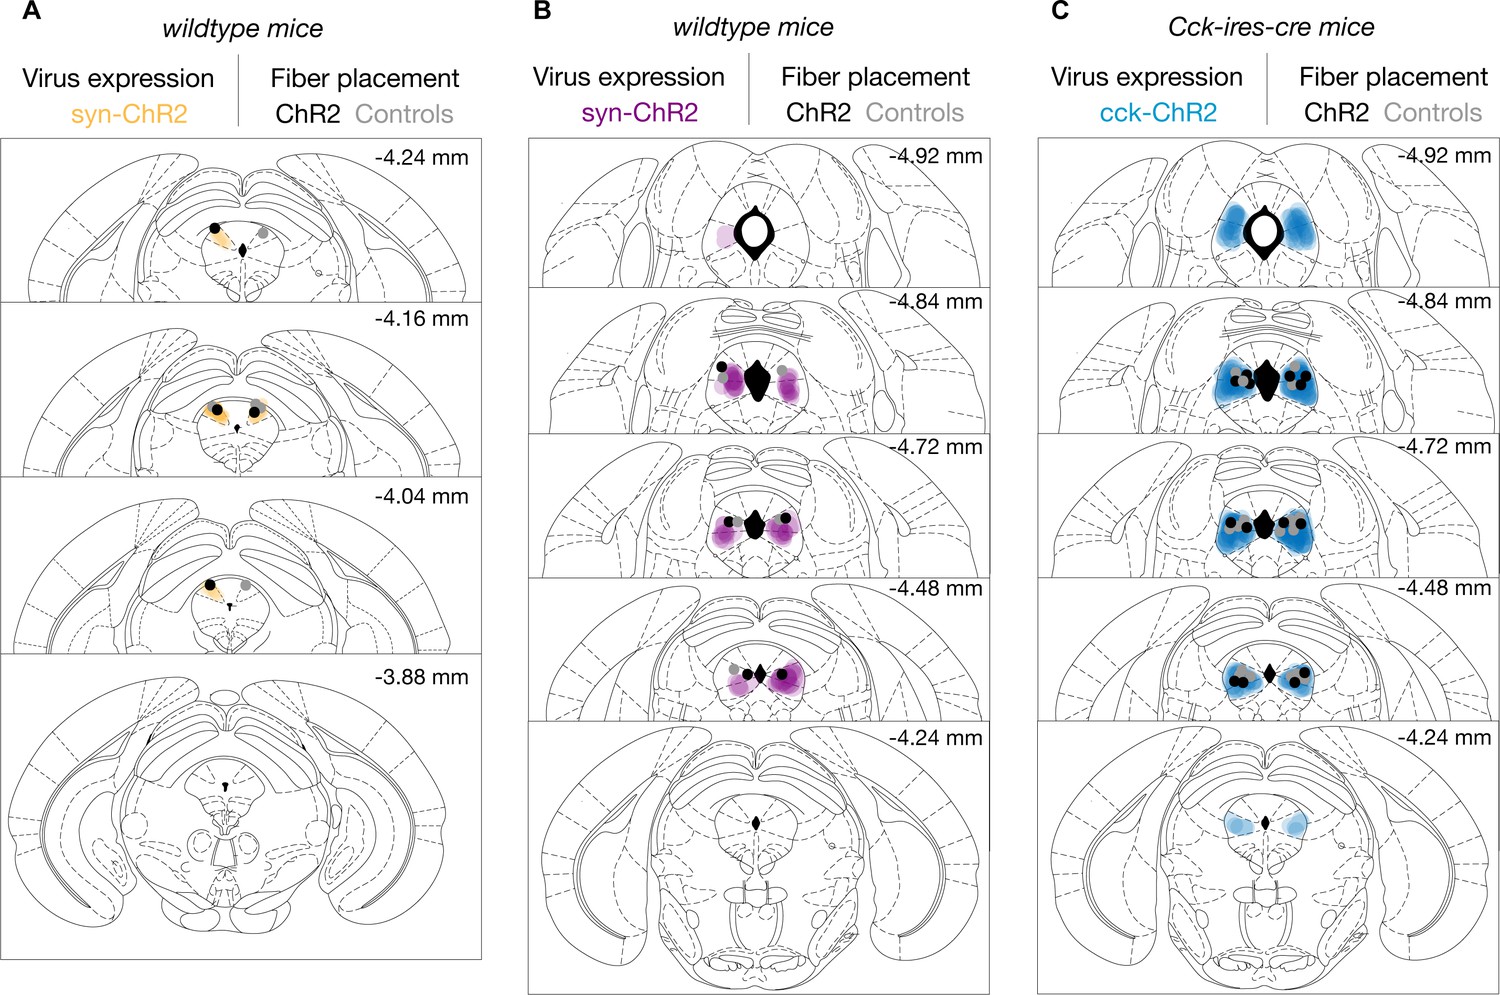
ChR2 expression and fiber placement in the periaqueductal gray (PAG) in coronal brain sections.
ChR2 expression is depicted in shading and fiber placement is represented by dots for (A) synapsin-expressing cells in the dorsolateral PAG (dlPAG-syn) mice, (B) synapsin-expressing cells in the lateral/ventrolateral PAG (l/vlPAG-syn) mice, and (C) cholecystokinin-expressing cells in the l/vlPAG (l/vlPAG-CCK) mice. Fibers targeting the l/vlPAG in (B) and (C) were placed at 15° angle. All fiber placements were unilateral and counterbalanced across left and right PAG. Center of fiber was determined at the widest point in histological slices.
Figure 3

Lateral/ventrolateral periaqueductal gray-cholecystokinin-expressing (l/vlPAG-CCK) cell stimulation prompts entry into a dark burrow in the absence of threat, unlike pan-neuronal l/vlPAG and dorsolateral PAG (dlPAG) stimulation.
(A) Timeline of latency to enter assay. Mice were habituated to a chamber containing a dark burrow for 10 min 1 day prior to test. Mice with preference for burrow during habituation were included during test. (B) Schematic of latency to enter assay during test. Left: at the beginning of each trial, mice were confined to a corner opposite of a dark burrow with a transparent wall (holding zone). After 15 s, the transparent barrier is removed and mice can freely move about the chamber. The trial ends when mice enter the burrow or 60 s have passed. Blue light (473 nm, 5 ms, 20 Hz) is delivered in alternating trials. In light-on trials, blue light delivery begins 5 s prior to barrier removal. After burrow entry, mice can remain in the burrow for 10 s before being returned to the holding zone. (C) Bars represent average time spent in the burrow during a 10 min habituation (dlPAG: eYFP, n = 5; ChR2, n = 4; l/vlPAG-syn: eYFP, n = 5; ChR2, n = 5; l/vlPAG-CCK: eYFP, n = 17, ChR2, n = 14). (D, E) Example locomotion map of five light-off (left) and five light-on trials (right) in a l/vlPAG-CCK-eYFP mouse (D) and l/vlPAG-CCK-ChR2 mouse (E). (F) Individual dots represent mean latency during five light-on epochs subtracted by mean latency during five light-off epochs (ON minus OFF). Trials without entry were regarded as latency of 61 s. Light delivery increased latency to enter the burrow in l/vlPAG-syn-ChR2 mice compared to l/vlPAG-syn-eYFP mice (l/vlPAG-syn-eYFP, n = 5; l/vlPAG-syn-ChR2, n = 5; unpaired t-test, **p=0.0054). Light delivery reduced latency to enter the burrow in l/vlPAG-CCK-ChR2 mice compared to l/vlPAG-CCK-YFP mice (l/vlPAG-CCK-eYFP, n = 17; l/vlPAG-CCK-ChR2, n = 14; unpaired t-test, ***p=0.0003). Stimulation of the dlPAG did not affect latency (dlPAG-eYFP, n = 5; dlPAG-ChR2, n = 4). Errorbars: mean ± SEM.
Figure 4
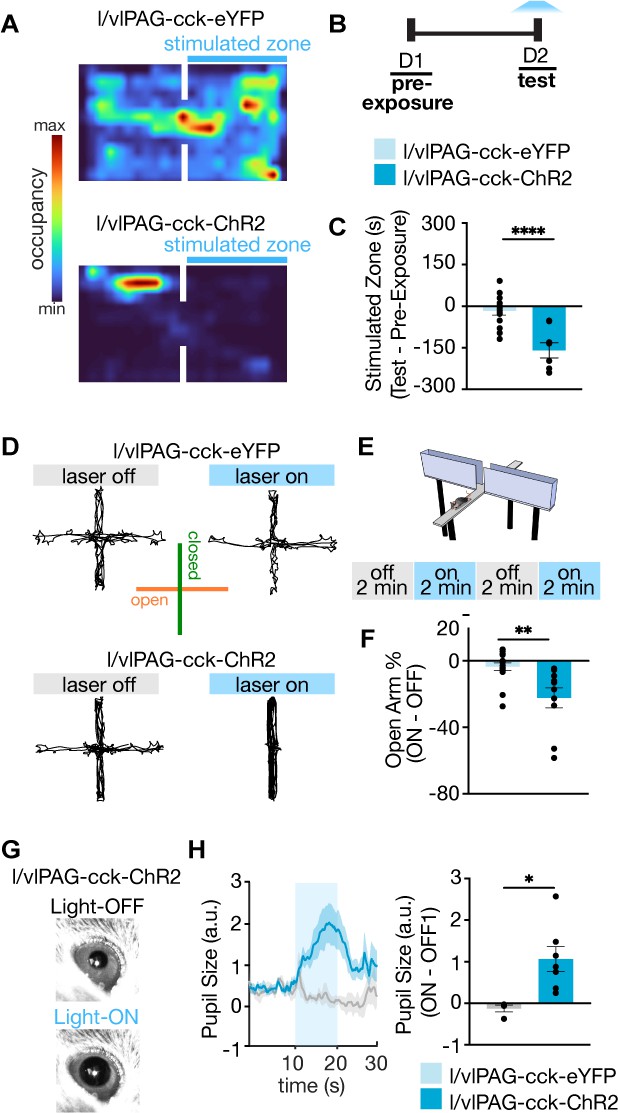
Further characterization of lateral/ventrolateral periaqueductal gray-cholecystokinin-expressing (l/vlPAG-CCK) neurons demonstrates stimulation is aversive, anxiogenic, and induces hallmark sympathetic responses.
(A) Example spatial map of real-time place test (RTPT) depicting min/max occupancy during test of a l/vlPAG-CCK-eYFP mouse (top) and l/vlPAG-CCK-ChR2 mouse (bottom). Blue light delivery was paired with occupancy of one chamber in the RTPT during the 10 min test. (B) Timeline for RTPT assay. Each session lasted 10 min. (C) Dots represent time spent in the stimulated zone during test minus time spent in the same zone during pre-exposure (without light delivery). Bars are averaged across l/vlPAG-CCK-eYFP and l/vlPAG-CCK-ChR2 groups, respectively. Stimulation of l/vlPAG-CCK neurons results in avoidance of stimulated zone, compared to control YFP group (eYFP, n = 14; ChR2, n = 8; unpaired t-test, ****p<0.0001). (D) Example locomotion maps of l/vlPAG-CCK-eYFP (top) and l/vlPAG-CCK-ChR2 mice (bottom) during light-off (left) and light-on (right) epochs. (E) Stimulation protocol in elevated plus maze (EPM) assay. (F) Dots represent percent of time spent in open arms during light-on epochs normalized by light-off epochs (ON minus OFF) of l/vlPAG-CCK-eYFP or l/vlPAG-CCK-ChR2 mice. Light delivery to ChR2 mice reduced open-arm occupancy relative to eYFP mice (eYFP, n = 16; ChR2, n = 10; unpaired t-test, **p=0.0024). (G) Example pupil images of a head-fixed l/vlPAG-CCK-ChR2 mouse without (top) and with blue-light delivery (bottom). (H) Left: average data showing pupil size during baseline, stimulation, and post-stimulation periods (labeled OFF, ON, and OFF, respectively). Each period lasted 10 s. During stimulation, blue light was delivered to l/vlPAG. Right: blue light delivery increased pupil size in l/vlPAG-CCK-ChR2 compared to l/vlPAG-CCK-eYFP mice (eYFP, n = 4; ChR2, n = 7; unpaired t-test, *p=0.0174). Errorbars: mean ± SEM.
Figure 5 with 1 supplement

Lateral/ventrolateral periaqueductal gray-cholecystokinin-expressing (l/vlPAG-CCK) inhibition delays entry into a dark burrow.
(A) Left: strategy for viral expression of cre-dependent GFP or Arch-GFP in l/vlPAG of CCK-cre mice. Right: histology showing Arch-GFP expressed in CCK+ cells in the l/vlPAG. Scale bar, 200 μm. (B) Top: timeline of latency to enter assay. Test consists of 10 trials, with green light delivery to l/vlPAG in alternating trials. Bottom: schematic of assay during test. At the start of trial, mice were confined to a holding zone for 15 s with a transparent barrier. When the barrier was removed, mice were free to explore the arena. Trial ended upon burrow entry or 60 s have passed. (C) Example locomotion maps of five trials without (left) and with (right) green light delivery in l/vlPAG-CCK-GFP mice. (D) Same as (C) but in l/vlPAG-CCK-Arch mouse. (E) No difference in burrow occupancy during 10 min habituation between l/vlPAG-CCK-GFP and l/vlPAG-CCK-Arch mice (GFP, n = 6; Arch, n = 7; unpaired t-test). (F) Green light delivery to l/vlPAG increased latency to enter burrow in l/vlPAG-CCK-Arch mice compared to l/vlPAG-CCK-GFP mice. Each dot represents average latency during five light-on trials minus average latency of five light-off trials (GFP, n = 6; Arch, n = 7; unpaired t-test, *p=0.0324). Errorbars mean ± SEM.
Figure 5—figure supplement 1
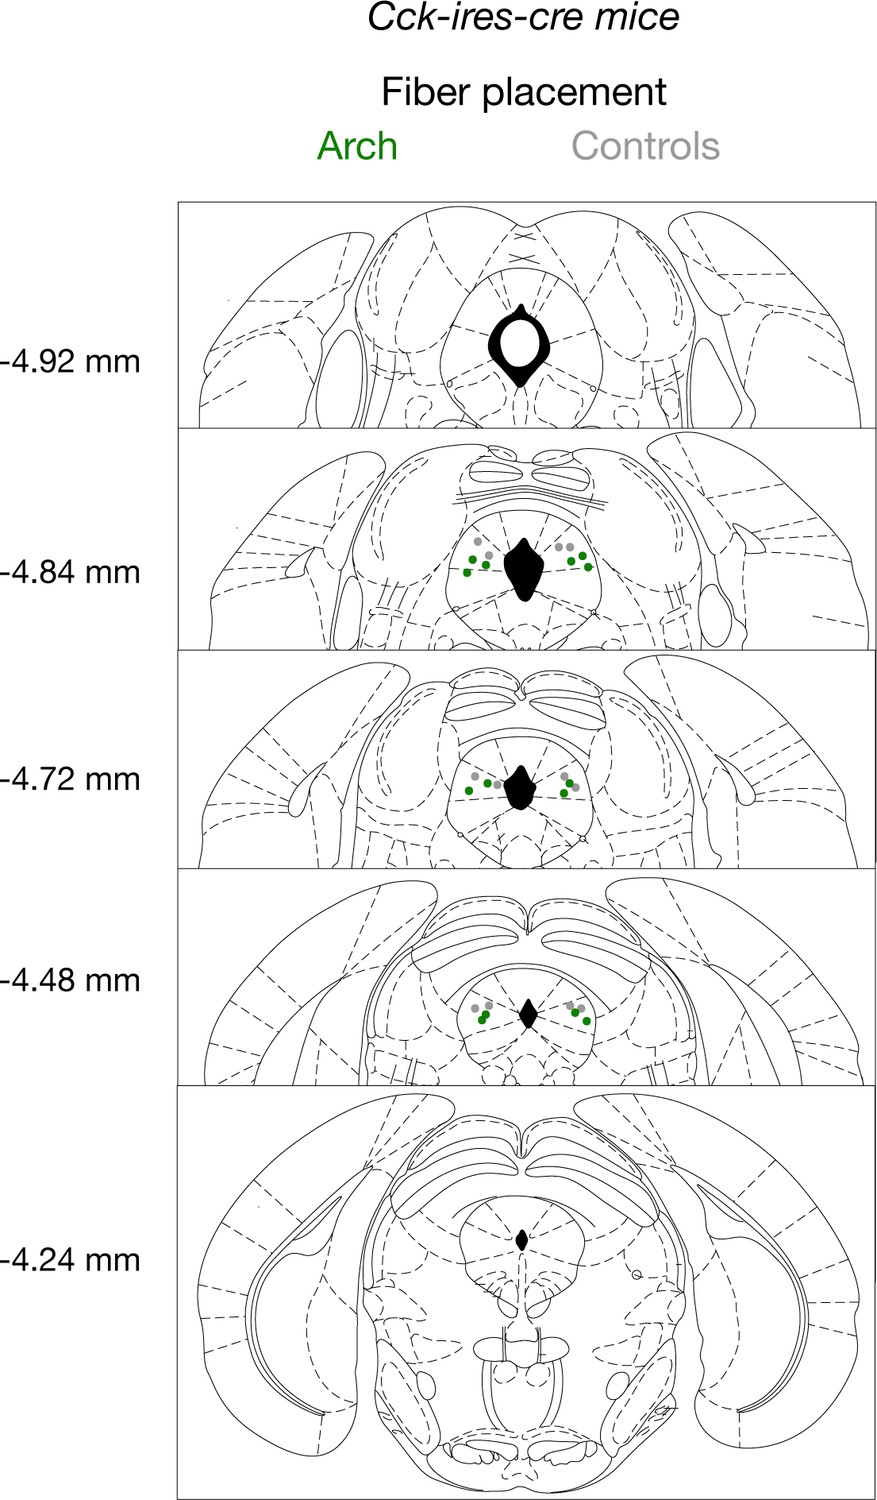
Bilateral fiber placement for optogenetic inhibition in coronal brain sections.
Dots represent fiber placement in lateral/ventrolateral periaqueductal gray-cholecystokinin-expressing-archaerhodopsin (l/vlPAG-CCK-Arch (green) or l/vlPAG-CCK-GFP (gray)) mice. All fiber placements were bilateral and placed at 15° angle. Center of fiber was determined at the widest point in histological slices.
Figure 6 with 1 supplement
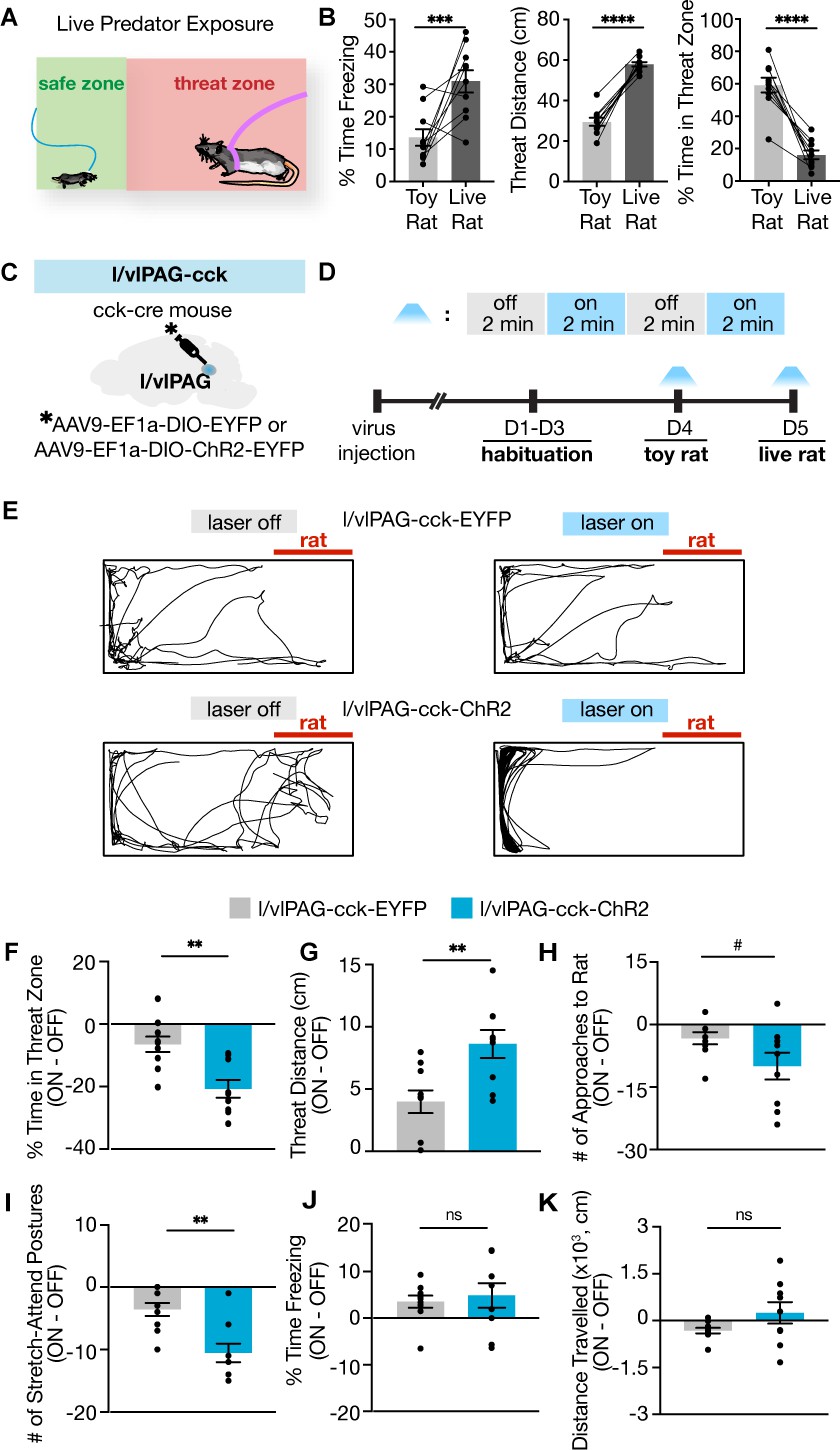
Lateral/ventrolateral periaqueductal gray-cholecystokinin-expressing (l/vlPAG-CCK) activation robustly enhances avoidance from a live predator without altering freezing.
(A) Schematic of live predator exposure assay. Mice are placed in a long rectangular chamber (70 × 25 × 30 cm) containing an awake rat restrained with a harness to one end. The chamber does not contain a barrier and mice can move freely. The area containing the rat is considered a ‘threat zone,’ and the area furthest from the rat is considered a ‘safe zone.’ (B) Exposure to a live rat increased freezing and threat distance while reducing time in threat zone compared to exposure to a toy rat (n = 10, paired t-tests; freezing, ***p=0.0065; threat distance, ****p<0.0001; time in threat zone, ****p<0.0001). (C) EYFP or ChR2-eYFP was expressed in l/vlPAG-CCK cells and a fiber-optic cannula was implanted over the l/vlPAG. (D) Timeline of live predator assay. Blue light was delivered in alternating 2 min epochs during toy rat exposure and live rat exposure. (E) Example locomotion maps during laser-off (left) and laser-on (right) epochs of an eYFP mouse (top) and ChR2-eYFP mouse (bottom). (F–K) Optogenetic stimulation of l/vlPAG-CCK cells reduced time in threat zone (F; eYFP, n = 10; ChR2, n = 9; unpaired t-test, **p=0.0014), increased threat distance (G, unpaired t-test, **p=0.0048), and reduced stretch-attend postures (I, unpaired t-test, **p=0.0012). Number of approaches to the rat trended toward significance (H, #p=0.066). Freezing (J) and distance traveled (K) were not significantly affected. Errorbars: mean ± SEM.
Figure 6—figure supplement 1
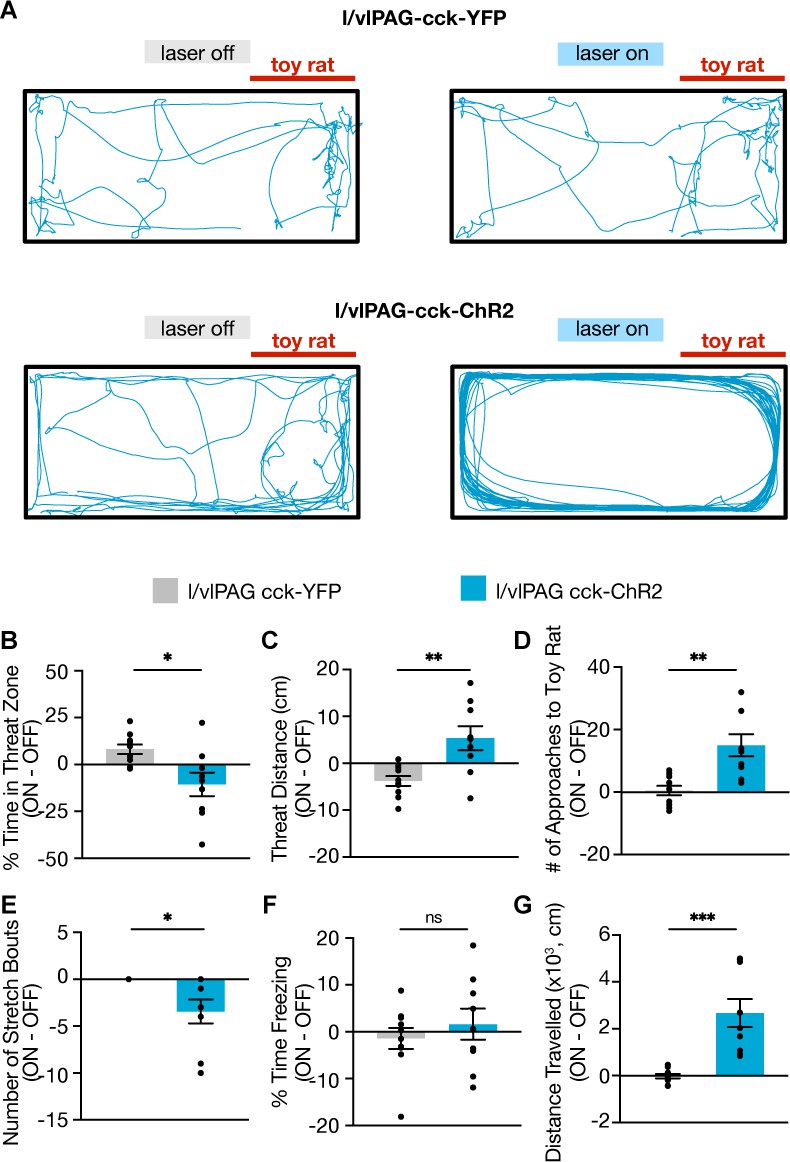
Optogenetic activation of lateral/ventrolateral periaqueductal gray-cholecystokinin-expressing (l/vlPAG-CCK) neurons during toy rat exposure.
(A) Example locomotion maps during laser-off (left) and laser-on (right) epochs of an l/vlPAG-CCK-eYFP mouse (top) and an l/vlPAG-CCK-ChR2 mouse (bottom). Stimulation induced robust traversal of all four corners of the enclosure (bottom-right). (B–G) Optogenetic stimulation of l/vlPAG-CCK cells reduced time spent in threat zone (B, eYFP, n = 10, ChR2, n = 9; unpaired t-test, *p=0.0104), increased threat distance (C, eYFP, n = 10, ChR2, n = 9; unpaired t-test, **p=0.0032), increased number of approaches to the toy rat (D, eYFP, n = 10, ChR2, n = 9; unpaired t-test, **p=0.0011), reduced stretch bouts (E, eYFP, n = 10, ChR2, n = 9; unpaired t-test, *p=0.0107), and increased distance traveled (G, eYFP, n = 10, ChR2, n = 9; unpaired t-test, ***p=0.0002). Stimulation did not alter freezing (F). Errorbars: mean ± SEM.
Figure 7 with 2 supplements

Lateral/ventrolateral periaqueductal gray-cholecystokinin-expressing (l/vlPAG-CCK) inhibition increases time spent near a live predator and reduces escape vigor without altering freezing.
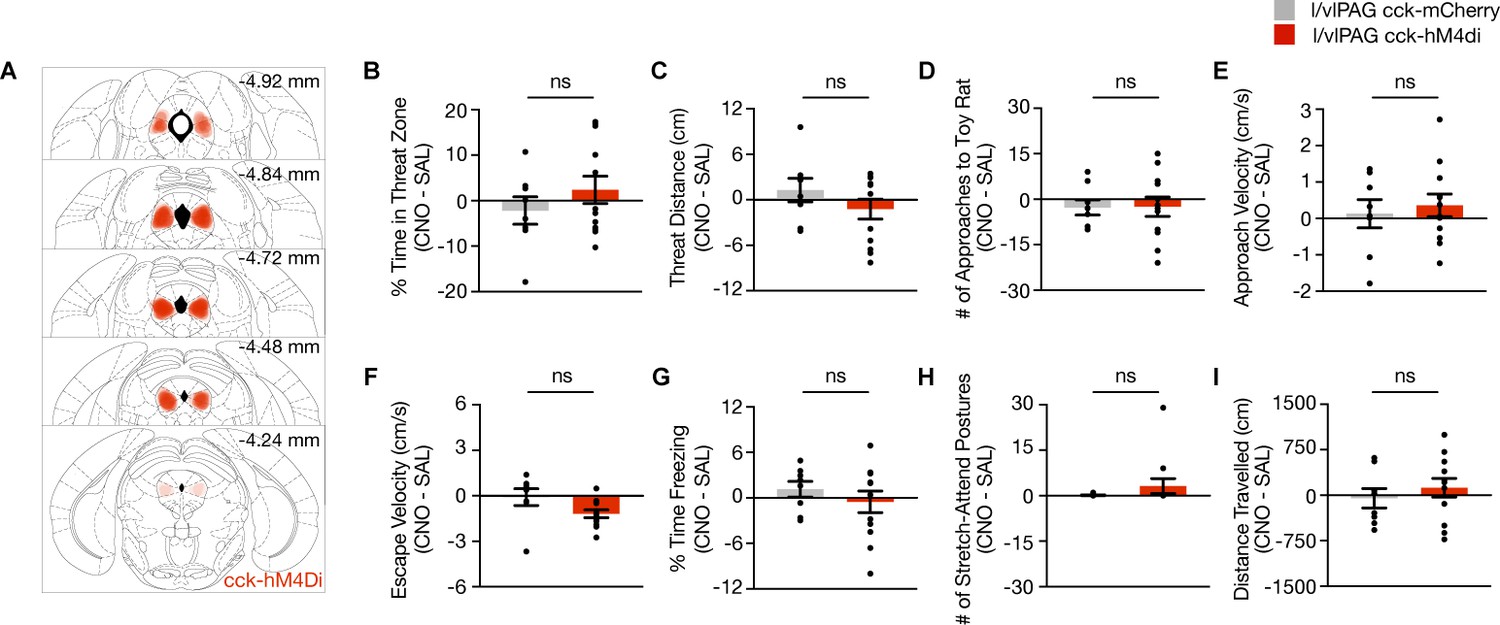
(A) Viral strategy for bilateral expression of inhibitory designer receptor hM4Di-mCherry or mCherry in CCK cells in the l/vlPAG. (B) Top-left: expression of hM4Di-mCherry in l/vlPAG-CCK cells. Scale bar, 200 μm. Bottom: timeline for DREADD experiments. Saline or clozapine-N-oxide (CNO, 10 mg/kg) occurred 40 min prior to exposure. (C) Live predator exposure schematic. Mice were placed in the presence of an awake rat restrained to one end of a chamber. Each exposure lasted 10 min. (D–K) Chemogenetic inhibition of l/vlPAG CCK cells increased time spent in threat zone (D, unpaired t-test, *p=0.0199), increased number of approaches toward the rat (F, unpaired t-test, *p=0.0496), and reduced escape velocity from the rat (H, unpaired t-test, *p=0.0431). Threat distance trended toward significance with CCK inhibition (E, unpaired t-test, #p=0.069). Approach velocity (G), stretch-attend postures (I), freezing (J), and distance traveled (K) were unaltered with inhibition (D–F, I–K: mCherry, n = 8; hM4Di, n = 12; G: mCherry, n = 5, hM4Di, n = 9; H: mCherry, n = 7, hM4Di, n = 11). Errorbars: mean ± SEM.
Figure 7—figure supplement 1
Chemogenetic of lateral/ventrolateral periaqueductal gray-cholecystokinin-expressing (l/vlPAG-CCK) population using DREADDs during exposure to a toy rat.
(A) Bilateral cre-dependent HM4Di expression in l/vlPAG of Cck-ires-cre mice. (B–I) Chemogenetic inhibition of l/vlPAG-CCK cells during exposure to toy rat (mCherry, n = 8; hM4Di, n = 12; unpaired t-test). Errorbars: mean ± SEM.
Figure 7—figure supplement 2
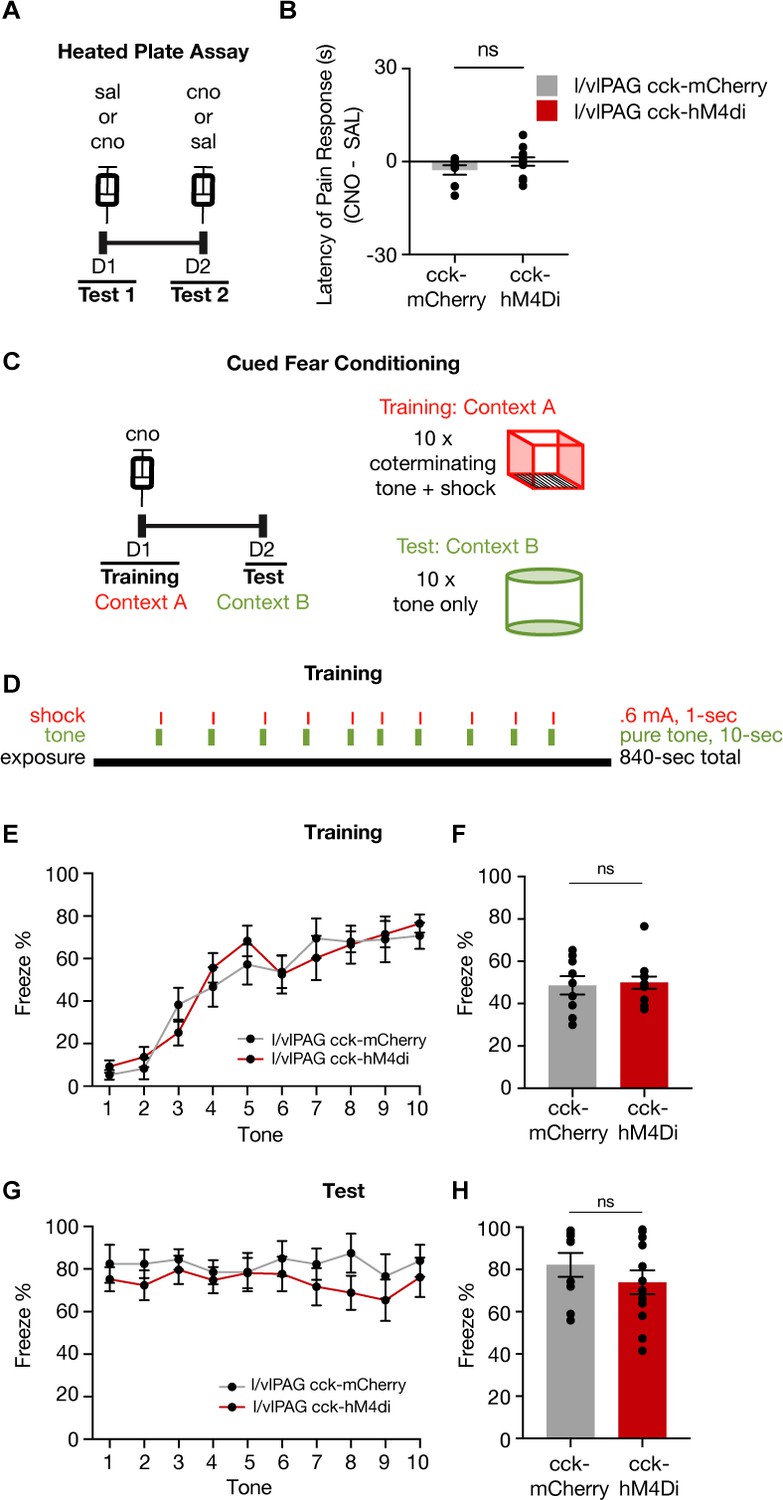
Inhibition of lateral/ventrolateral periaqueductal gray-cholecystokinin-expressing (l/vlPAG-CCK) neurons does not alter pain response latency or acquisition of learned fear.
(A) Timeline of heated plate assay with chemogenetic inhibition of l/vlPAG-CCK cells. (B) Inhibition of l/vlPAG-CCK cells does not alter latency of pain response (clozapine-N-oxide [CNO] minus saline; mCherry, n = 8; hM4Di, n = 12; unpaired t-test). Mean ± SEM. (C) Timeline of cued fear conditioning across 2 days (training and test) with l/vlPAG-CCK chemogenetic inhibition during training. Training occurred in context A, which consisted of metal bar flooring, bare gray walls, warm-colored lighting, and cleaned with 70% ethanol. Training included tone-shock pairings. Test occurred in context B, which consisted of rounded white walls, gray smooth flooring, blue-colored lighting, and cleaned with Strike-Bac. Both contexts A and B were illuminated to 40 lux. Test included tone presentations only. (D) Schedule of tone and shock presentations during training. Trial was 14 min in total, with 10 pairs of co-terminating 10 s tones and 1 s shocks. The tone was a 70 dB pure-tone, and all shocks were 0.6 mA. (E) Mean freezing of CCK-mCherry and CCK-hM4Di mice during 10 s tone presentations during training (mCherry, n = 9; hM4Di, n = 12). (F) No difference in freezing during training between groups (mCherry, n = 9; hM4Di, n = 12; unpaired t-test, p=0.799). (G) Same as (E) but during test (mCherry, n = 9; hM4Di, n = 12). (H) Same as (F) but during test (mCherry, n = 9; hM4Di, n = 12; unpaired t-test, p=0.328). Errorbars: mean ± SEM.
Figure 8 with 3 supplements
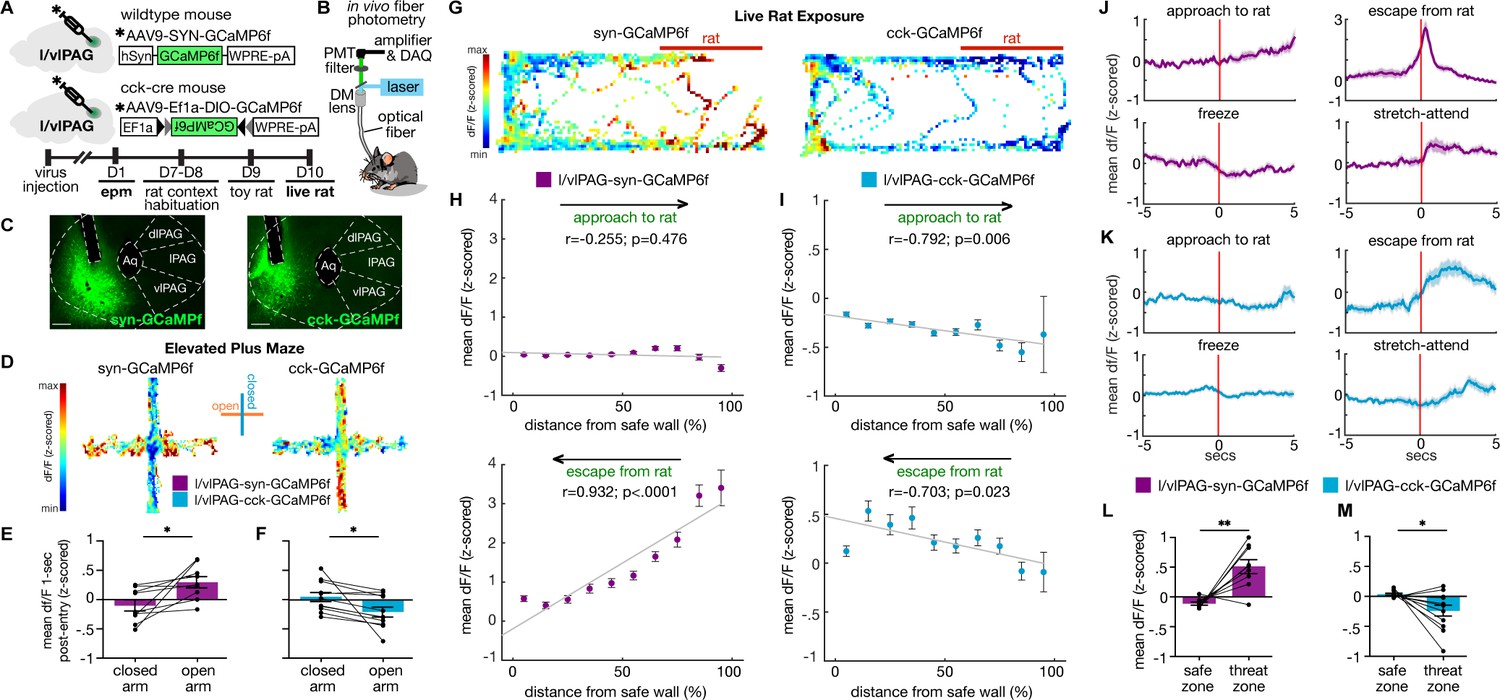
Lateral/ventrolateral periaqueductal gray-synapsin-expressing (l/vlPAG-syn) cells are more active near threat, while l/vlPAG-cholecystokinin-expressing (l/vlPAG-CCK) cells are more active far from threat.
(A) Top: viral schematic for synapsin-specific and CCK-specific GCaMP6 expression in l/vlPAG. Bottom: timeline for in vivo photometry recordings. (B) Fiber photometry recording set-up. (C) Histology of GCaMP6f expression in synapsin-specific (left) and CCK-specific (right) cells in the l/vlPAG. Scale bar, 200 μm. (D) Example heatmaps showing z-scored dF/F in mice expressing synapsin-specific GCaMP6 (left) or CCK-specific GCaMP6 (right) in l/vlPAG in an elevated plus maze assay. Vertical arms of heatmaps represent closed arms. (E, F) Mean dF/F (z-scored) 1 s after arm entry in syn-GCaMP6 (E) and CCK-GCaMP6 mice (F). Mean dF/F 1 s post-entry into the open arms is greater than into closed arms in syn-GCaMP6 mice (E, n = 9; paired t-test, *p=0.0213), whereas mean dF/F 1 s post-entry into the open arms is lower than into the closed arms for CCK-GCaMP6 mice (F, n = 11; paired t-test, *p=0.0283). (G) Example heatmaps showing z-scored dF/F in syn-GCaMP6 (left) or CCK-GCaMP6 (right) in live rat exposure assay. Rat was confined to the right of the map, as indicated by the red bar. (H, I) Mean dF/F (z-scored) during approaches toward the rat (top) or escapes from the rat (bottom) within 10 spatial bins of varying distance from the safe wall of syn-GCaMP6 (H, n = 9) or CCK-GCaMP6 (I, n = 13) mice (syn-approach, n = 6744 samples; syn-escape, n = 2150 samples; CCK-approach, n = 7170 samples; CCK-escape, n = 2088 samples). (H) In syn-GCaMP6f mice, dF/F is positively correlated with distance from the safe wall during escapes from the predator (Pearson’s correlation coefficient r = 0.932, p<0.0001). (I) In CCK-GCaMP6f mice, dF/F is negatively correlated with distance from safe wall during both approaches and escapes (approach, r = −0.792, p=0.006; escape, r = –0.703, p=0.023). (J, K) Mean dF/F (z-scored) 5 s before and after approaches, escapes, freeze bouts, and stretch-attend postures in syn-GCaMP6 (L) and CCK-GCaMP6 (M) populations (syn, n = 9; CCK, n = 13 for freeze, n = 12 for other behaviors). (L, M) Mean dF/F (z-scored) in the safer zone (one-third of assay near safer wall) and threat zone (two-thirds of assay distal from safer wall) in syn-GCaMP6 and CCK-GCaMP6 mice. Pan-neuronal l/vlPAG activity was increased in the threat zone compared to the safer zone (syn, n = 9; paired t-test, **p=0.0024), whereas CCK-specific activity was decreased in the threat zone compared to the safer zone (CCK, n = 12; paired t-test, *p=0.0223). Errorbars: mean ± SEM.
Figure 8—figure supplement 1
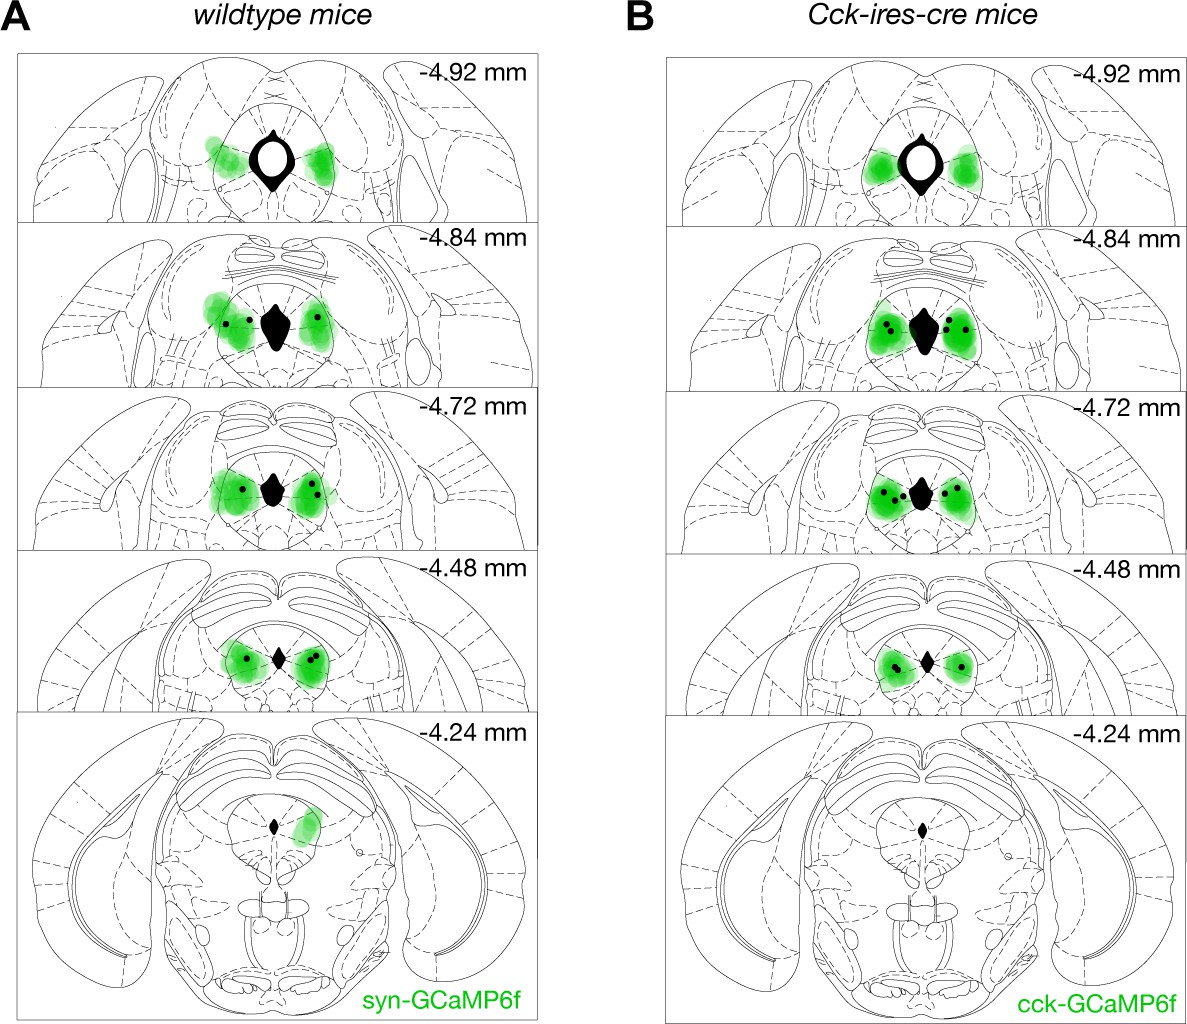
GCaMP6f expression and fiber placement in the lateral/ventrolateral periaqueductal gray (l/vlPAG) in coronal brain sections.
GCaMP6f expression is depicted in shading and fiber placement is represented by dots for (A) l/vlPAG-synapsin-expressing (l/vlPAG-syn) mice and (B) l/vlPAG-cholecystokinin-expressing (l/vlPAG-CCK) mice. All fibers were placed at a 15° angle. All viral injections and fiber placements were unilateral and counterbalanced across left and right PAG. Center of fiber was determined at widest point in histological slices.
Figure 8—figure supplement 2
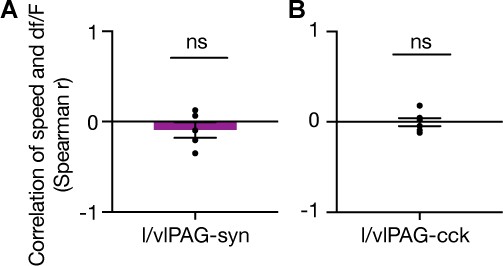
No correlation between speed and df/F.
(A, B) Spearman’s correlation of speed and fiber photometry df/F of (A) lateral/ventrolateral periaqueductal gray-synapsin-expressing (l/vlPAG-syn) or (B) l/vlPAG-cholecystokinin-expressing (l/vlPAG-CCK) population during exposure to toy rat (syn, n = 5; CCK, n = 6; one-sample t-test). Errorbars: mean ± SEM.
Figure 8—figure supplement 3
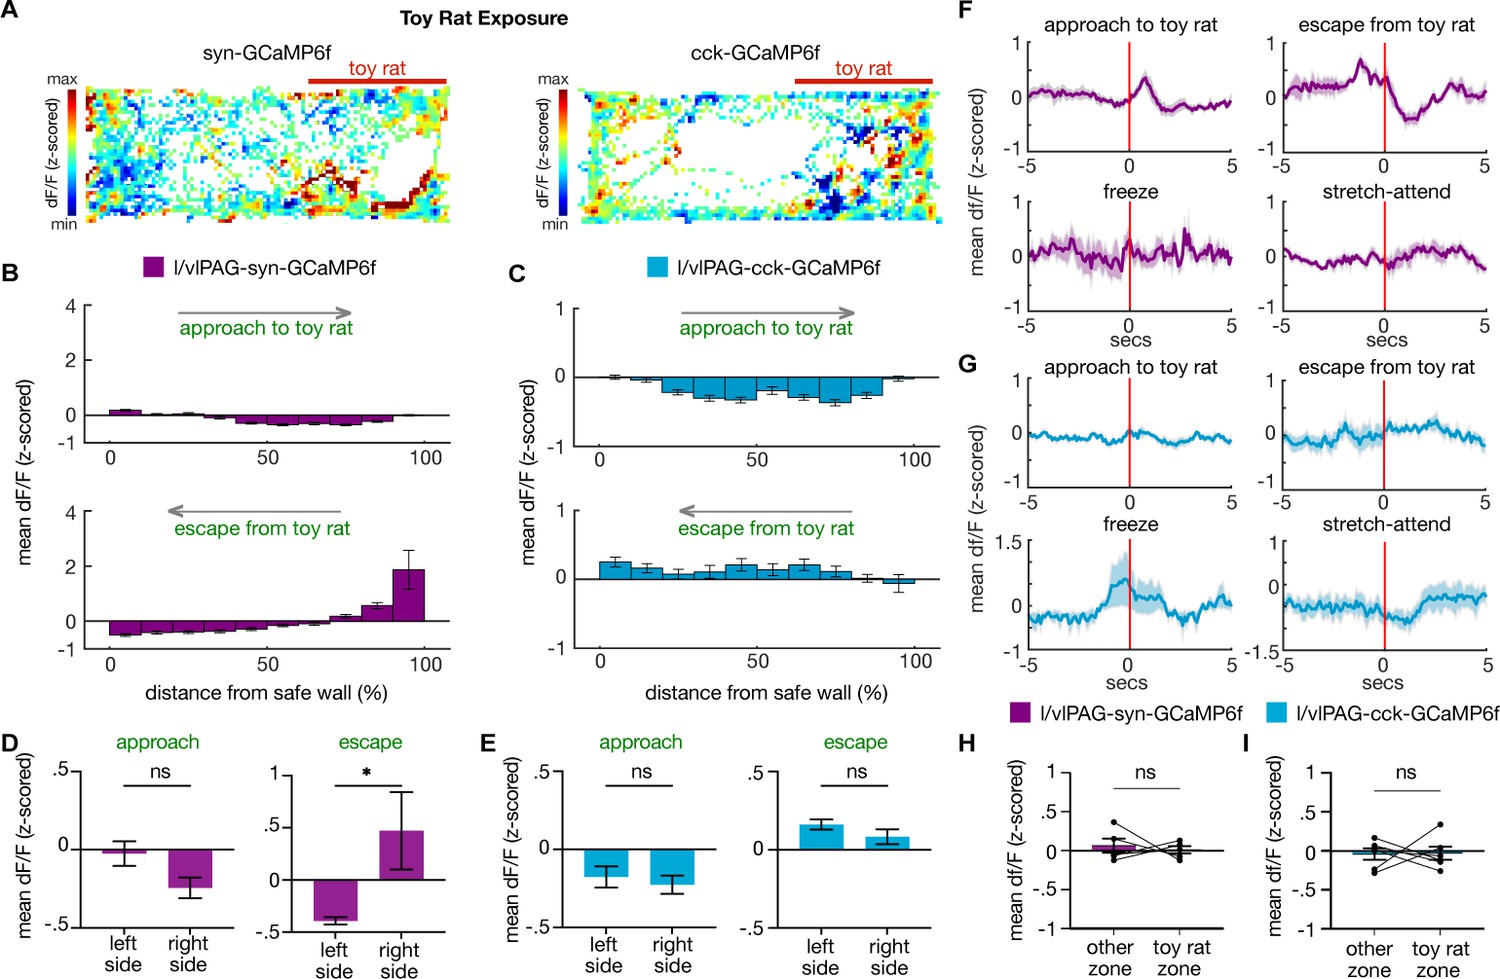
Lateral/ventrolateral periaqueductal gray-synapsin-expressing (l/vlPAG-syn) and cholecystokinin (CCK) activity during exposure to a control toy rat.
(A) Example heatmaps showing z-scored dF/F in syn-GCaMP6 (left) or CCK-GCaMP6 (right) during exposure to a control toy rat. The toy rat was confined to the right of the map, as indicated by the red bar. (B, C) Mean dF/F (z-scored) during approaches toward the toy rat (top) or escapes from the toy rat (bottom) within 10 spatial bins of varying distance from the safer wall of syn-GCaMP6 (B, n = 5) or CCK-GCaMP6 (C, n = 6) mice (syn-approach, n = 7361 samples; syn-escape, n = 1884 samples; CCK-approach, n = 3632 samples; CCK-escape, n = 1128 samples). (D, E) Analysis of data shown in (B) and (C), respectively. Comparisons of mean dF/F during approaches and escapes from toy rat from samples in the left or right side of the enclosure. The toy rat was located in the right side of the enclosure. Average activity in bins on right side is greater than average activity in left side during escapes in syn-GCaMP6f mice (left side, n = 5 bins, right side, n = 5 bins; unpaired t-test, *p=0.0486). (F, G) Mean dF/F (z-scored) 5 s before and after approaches, escapes, freeze bouts, and stretch-attend postures in syn-GCaMP6 (F, n = 5) and CCK-GCaMP6 (G, n = 6) populations. (H, I) Mean dF/F (z-scored) in the empty zone and zone containing the toy rat in syn-GCaMP6 (H) and CCK-GCaMP6 (I) mice (syn, n = 5; CCK, n = 6; paired t-test, ns = not significant). Errorbars: mean ± SEM.
Author response image 1
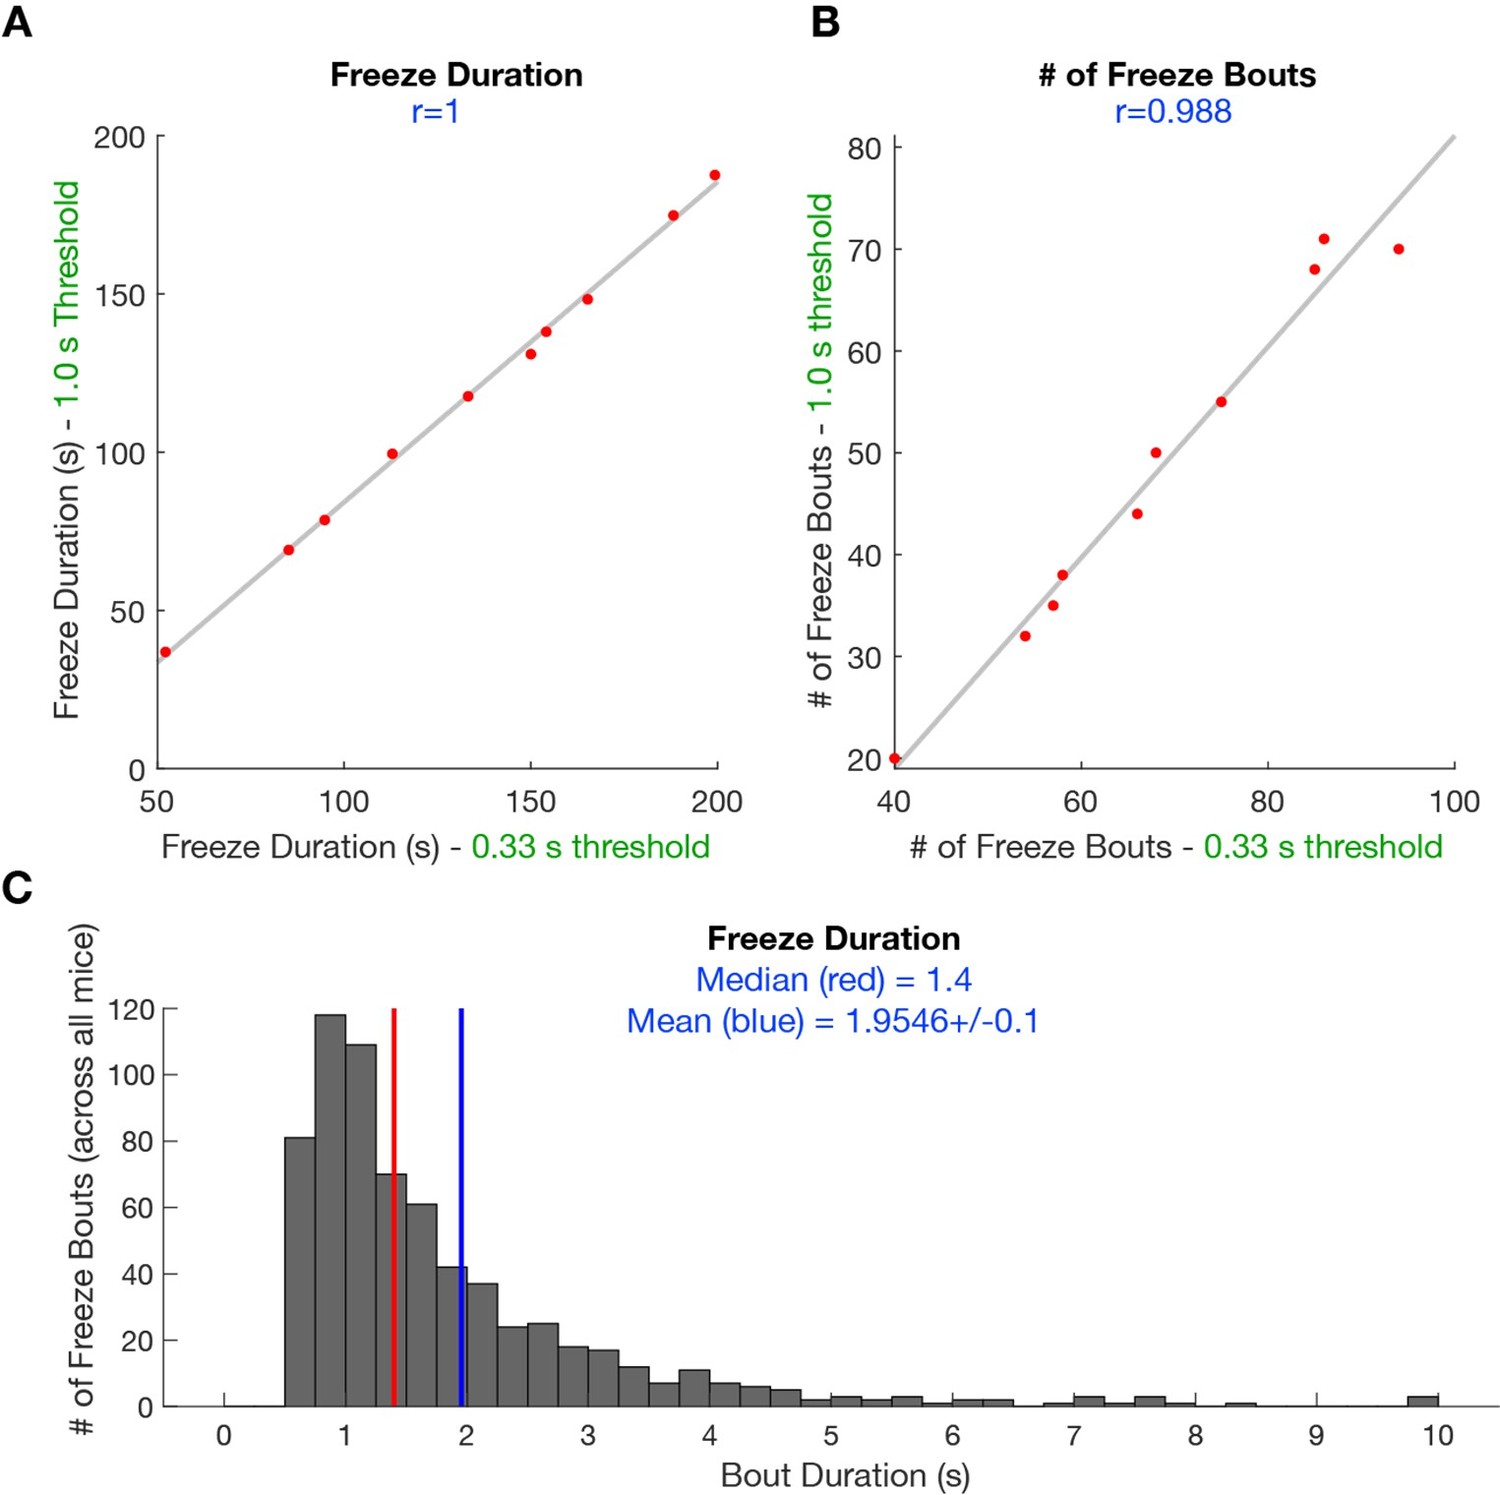
Scatterplot shows the correlation between scored freeze duration (A) and scored freeze bouts (B) when minimum freezing bout duration is 1s and 0.
33 s. This behavioral data is derived from YFP mice undergoing predator exposure without laser manipulation (n=10). (C) Histogram shows the median freeze bout duration is 1.4 s and average bout duration is 2 s (n=682 freezes).
Author response image 2
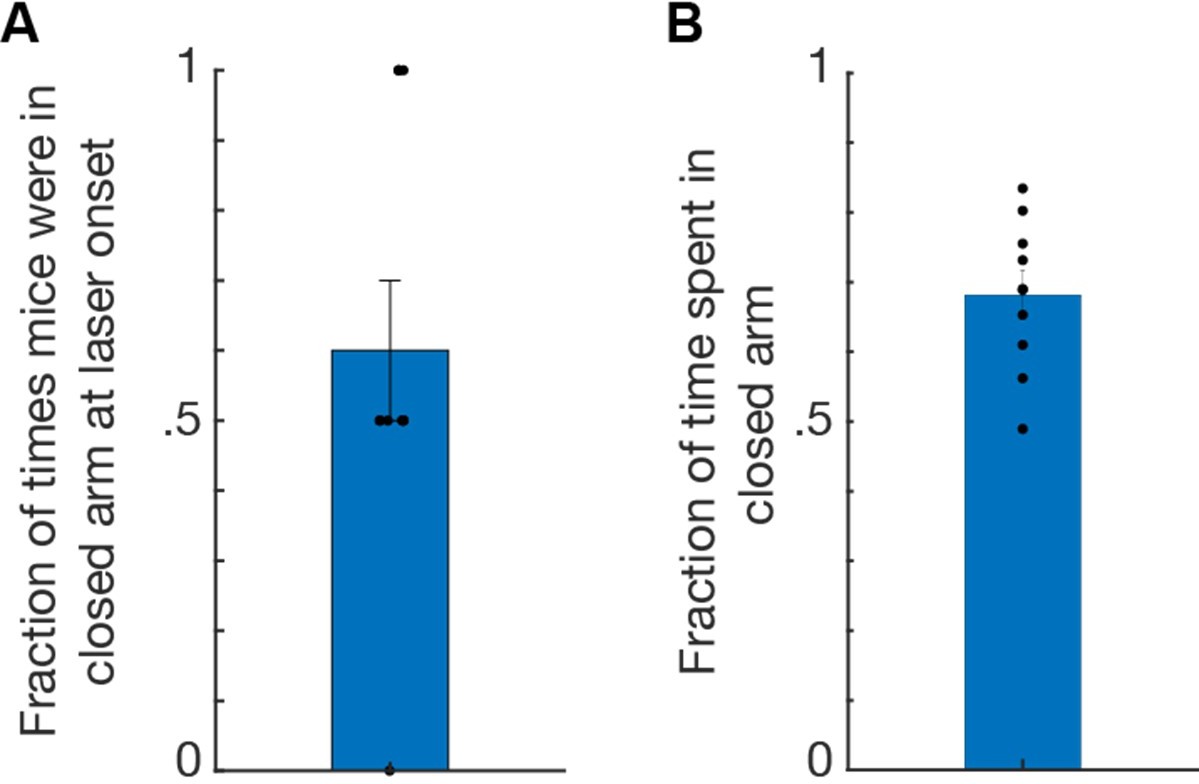
Data from ChR2 mice (n=10) receiving stimulation to l/vlPAG-CCK cells during elevated plus maze assay.
(A) Bar plot showing mice occupied a closed arm during 60% of laser onsets. Each 8-min EPM trial consisted of four 2-min epochs with alternating laser delivery (OFF-ON-OFF-ON) resulting in two laser onsets per trial. (B) Mice spent 68.16% of time in the closed arms during laser delivery; thus mice spent the majority of time in the closed arms, indicating that arm occupancy during laser onset did not result in aversion of said arm. Mean ± SEM.
Additional files
Download links
A two-part list of links to download the article, or parts of the article, in various formats.
Downloads (link to download the article as PDF)
Open citations (links to open the citations from this article in various online reference manager services)
Cite this article (links to download the citations from this article in formats compatible with various reference manager tools)
Sparse genetically defined neurons refine the canonical role of periaqueductal gray columnar organization
eLife 11:e77115.
https://doi.org/10.7554/eLife.77115


