Contractile force assessment methods for in vitro skeletal muscle tissues
- University of Navarra, Tecnun School of Engineering, Manuel de Lardizábal, Spain
- University of Navarra, Biomedical Engineering Center, Campus Universitario, Spain
- Group of Neurosciences, Department of Pediatrics, UPV/EHU, Hospital Donostia - IIS Biodonostia, Spain
- CIBERNED, Instituto de Salud Carlos III, Ministry of Science, Innovation, and Universities, Spain
Figures
Figure 1
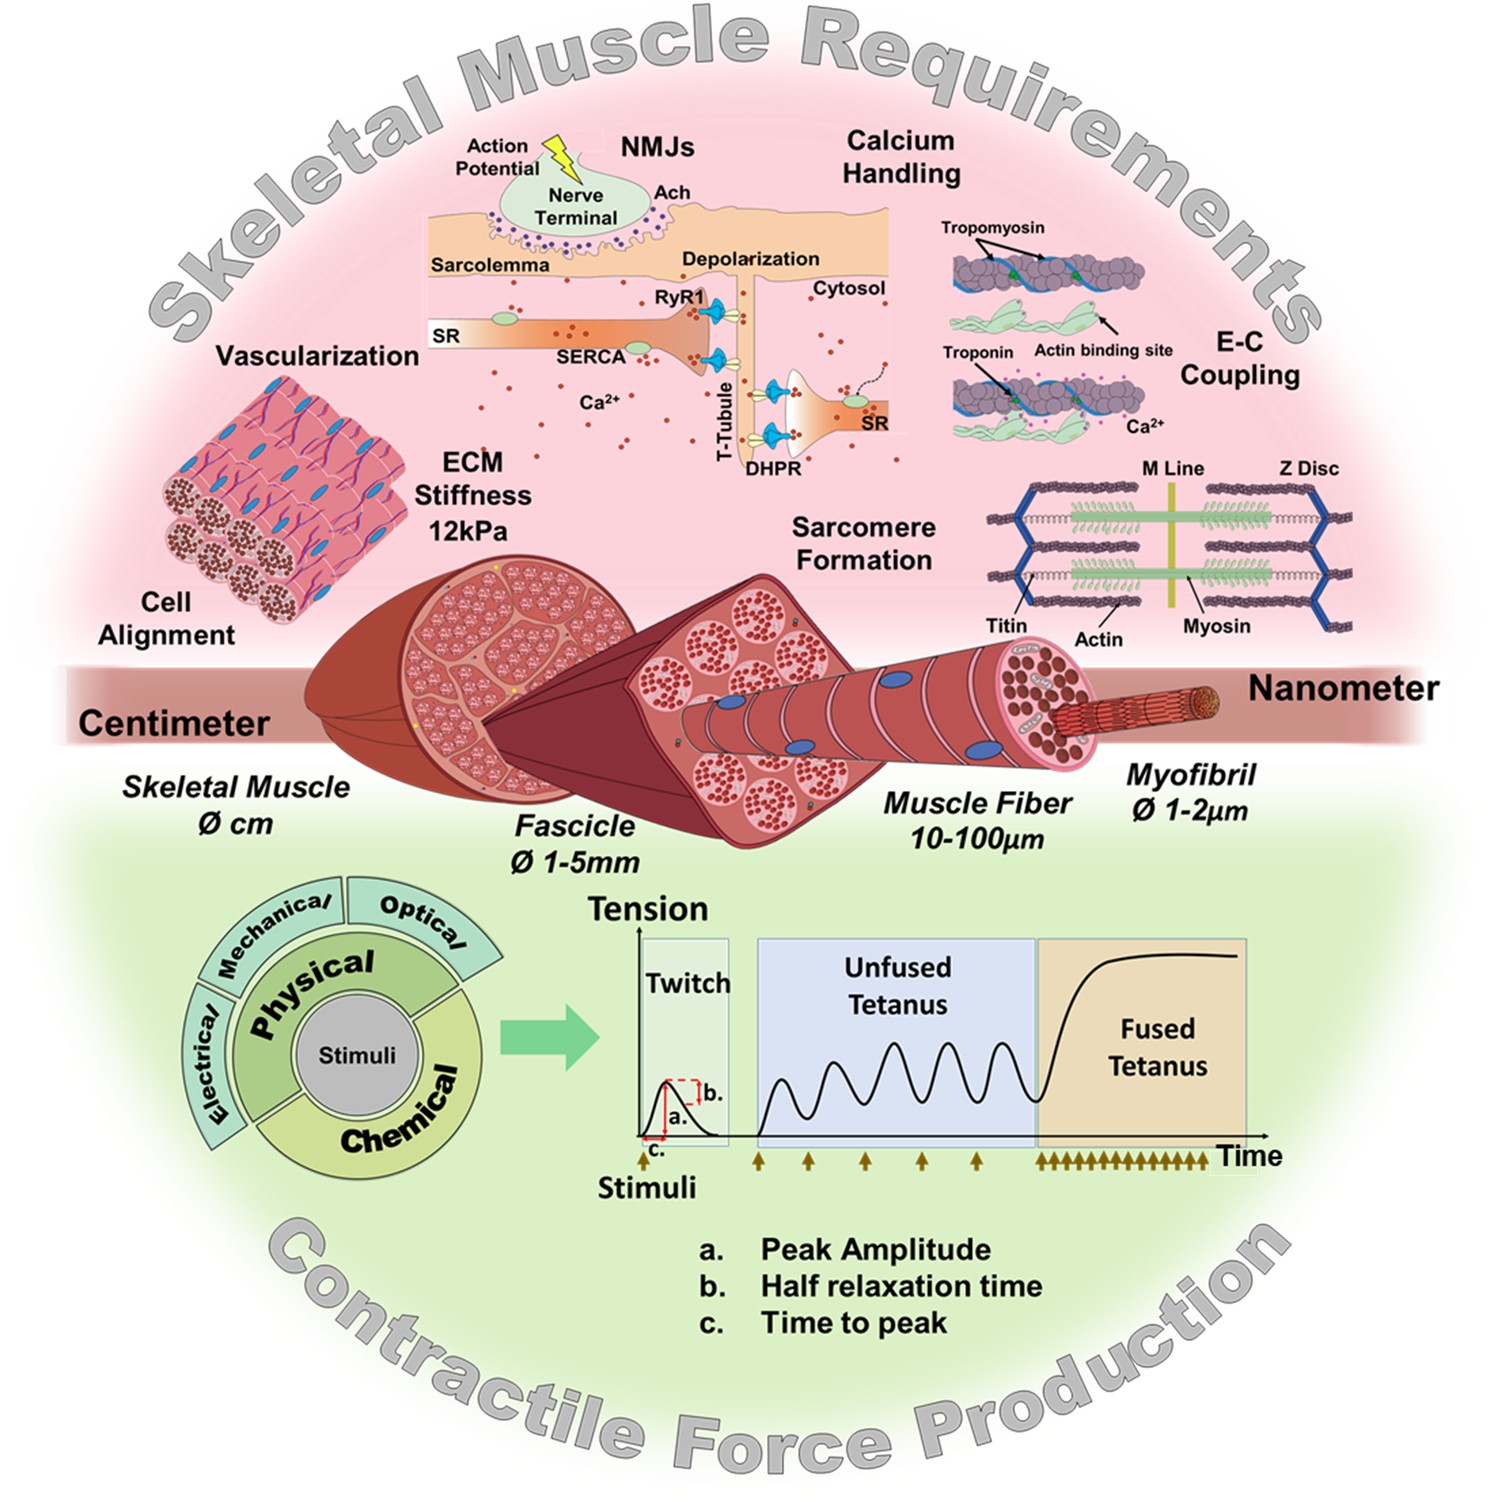
Skeletal muscle structure and requirements for contractile force production.
(Top) Summary of the main requirements to enable contractility in skeletal muscle in vitro models. (Middle) Representation of the muscular hierarchy and (bottom) summary of contractile stimuli and contraction profiles.
Figure 2
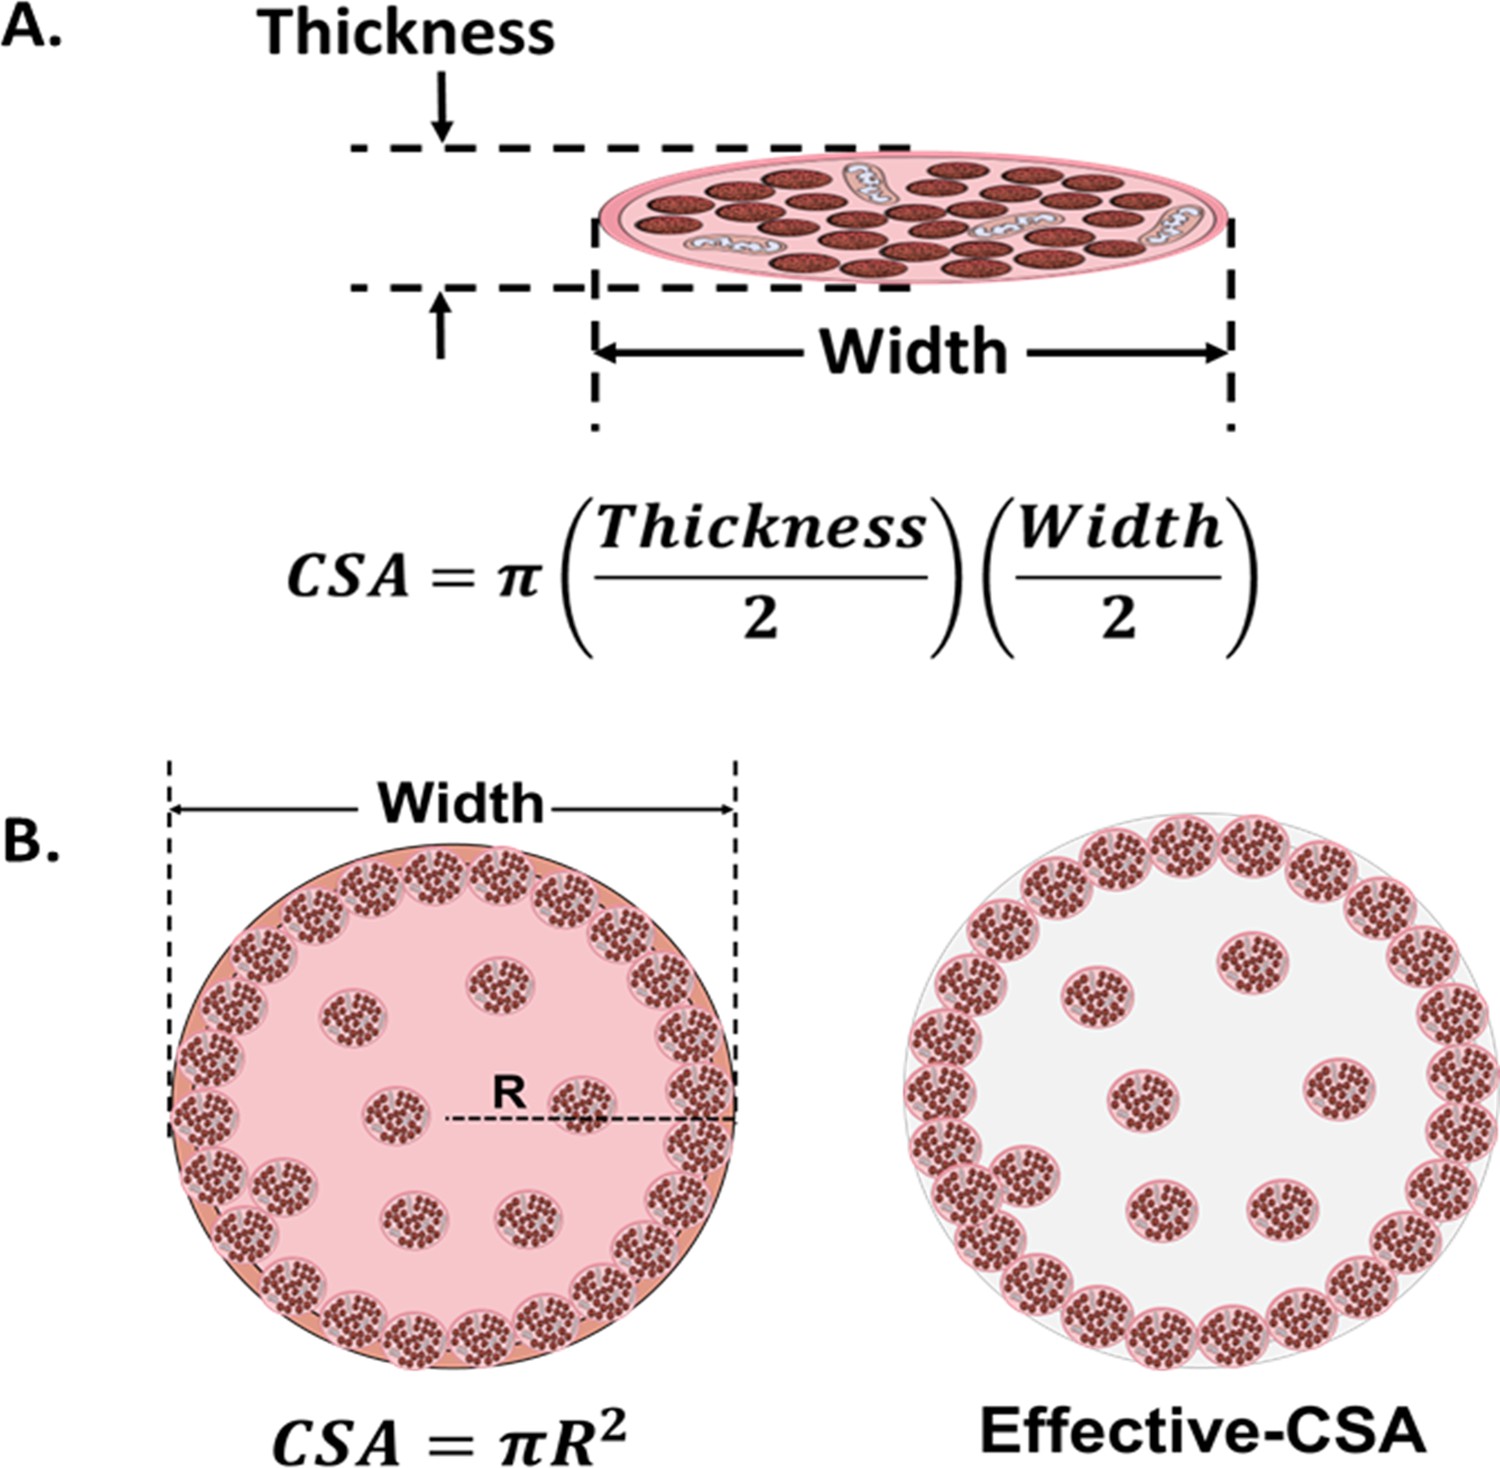
Cross-sectional area (CSA) in 2D and 3D muscle models.
(A) Myotube CSA estimated as an elliptical shape from the thickness and the width of the cell. (B) CSA of 3D muscle constructs can be estimated by approximation to different shapes (circle, in left panel), or calculated from immunohistochemical sections. Effective-CSA is known as the area occupied by myotubes (red area in the right panel).
Figure 3
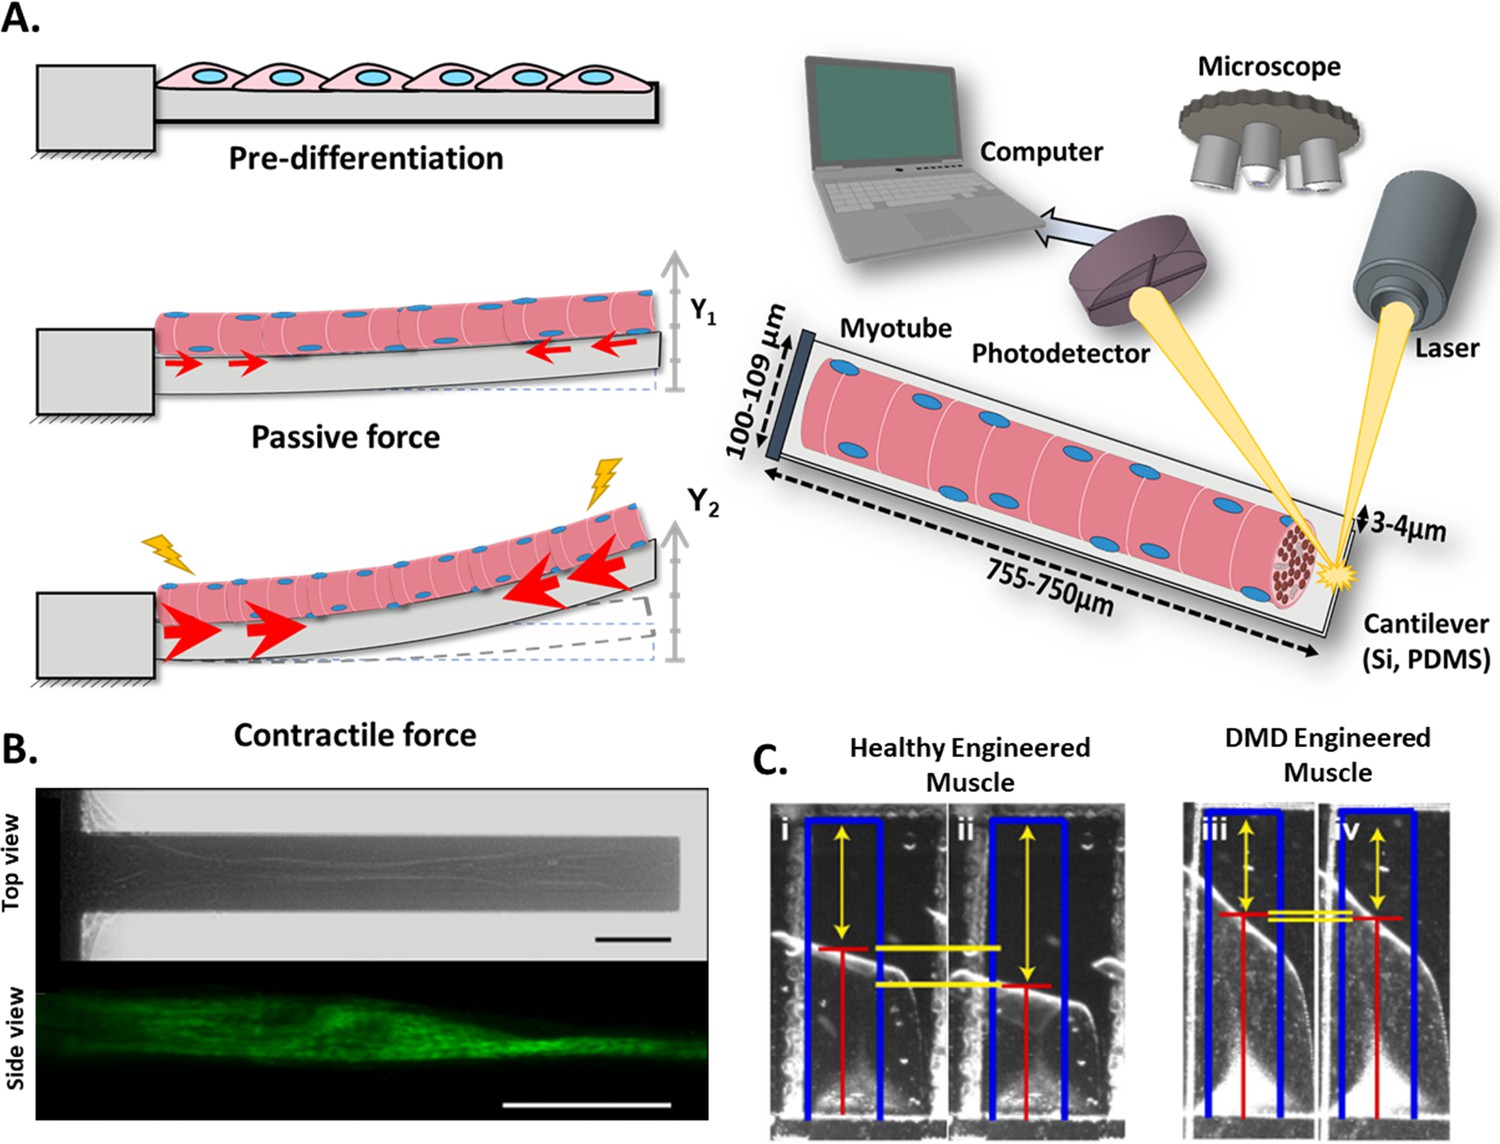
Cantilever deflection setup.
(A) The beam deflects due to myotube contraction (Left). In this case, cantilever deflection is interrogated by a laser beam and detected using a photodetector (Right). Commonly, cantilever arrays are made of Silicon (Si) or PDMS. Different coatings (FN, laminin, collagen I) have been tested to improve cell attachment and longer culture times. (B) Human myotubes on silicon cantilevers in bright field, top view (top) and immunostained for Myosin Heavy chain, side view (above). Scale bar: 50 µm. (C) Representative images from healthy and DMD myotubes at baseline (i and iii) and peak stress (ii and iv). Blue rectangles represent film length. Red lines represent the tracking of the film edge. Yellow arrows represent the distance between the projected film length and the unstressed film length. The yellow horizontal lines represent the change in projected film length from baseline stress (top bar) to peak stress (bottom bar).
© 2014, Elsevier. Figure 3B is reprinted with permission from Figure 1 from Smith et al., 2014. It is not covered by the CC-BY 4.0 license and further reproduction of this panel would need permission from the copyright holder.
© 2016, Nesmith et al. Figure 3C is reprinted with permission from Figure 5B from Nesmith et al., 2016 (published under a CC BY-NC-SA 3.0 license). It is not covered by the CC-BY 4.0 license and further reproduction of this panel would need permission from the copyright holder.
Figure 4
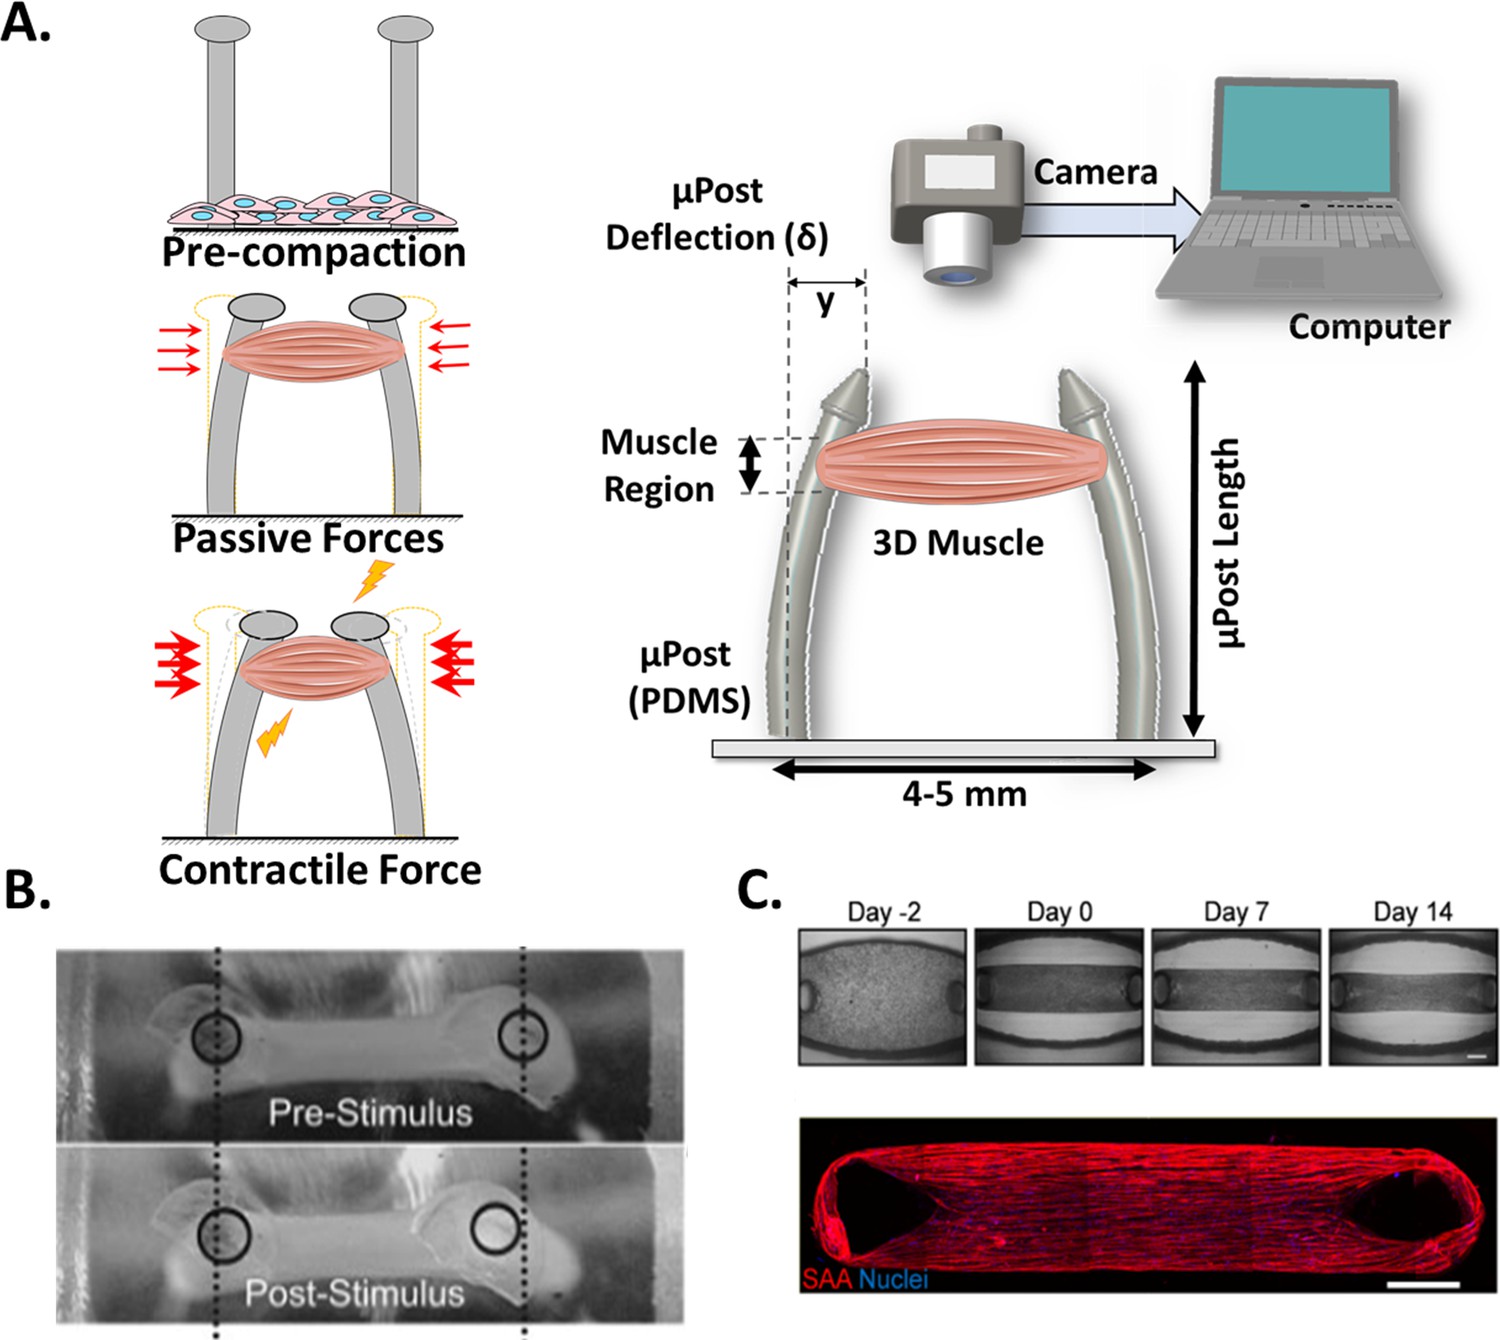
Post Deflection features.
(A) In vitro skeletal muscle is grown between two micropost which serve as anchors (tendons). As muscle contracts in response to a stimulus, posts bend proportionally. By tracking these displacements and knowing the mechanical characteristics of the platform, the force exerted by the muscle can be quantified. (B) Micropost displacement due to miniature bioartificial muscle (mBAM) contraction in response to a maximum tetanic electrical stimulus. Scale bar: 100 µm. (C) Formation of human skeletal muscle micro-tissue (hMMTs). Phase-contrast images depicting the remodeling of the ECM by human myoblast over time. Muscle construct immunostained (2 weeks) for sarcomeric α-actinin (SAA, red) and counterstained with DRAQ5 (1, 5-bis{[2-(di-methylamino)ethyl]amino}–4, 8-dihydroxyanthracene-9, 10-dione) nuclear stain in blue. Scale bar: 500 µm. Reprinted from Figure 2A and C from Afshar et al., 2020.
© 2008, John Wiley and Sons. Figure 4B is reprinted with permission from Figure 4A from Vandenburgh et al., 2008 with permission from John Wiley and Sons. It is not covered by the CC-BY 4.0 license and further reproduction of this panel would need permission from the copyright holder.
Figure 5
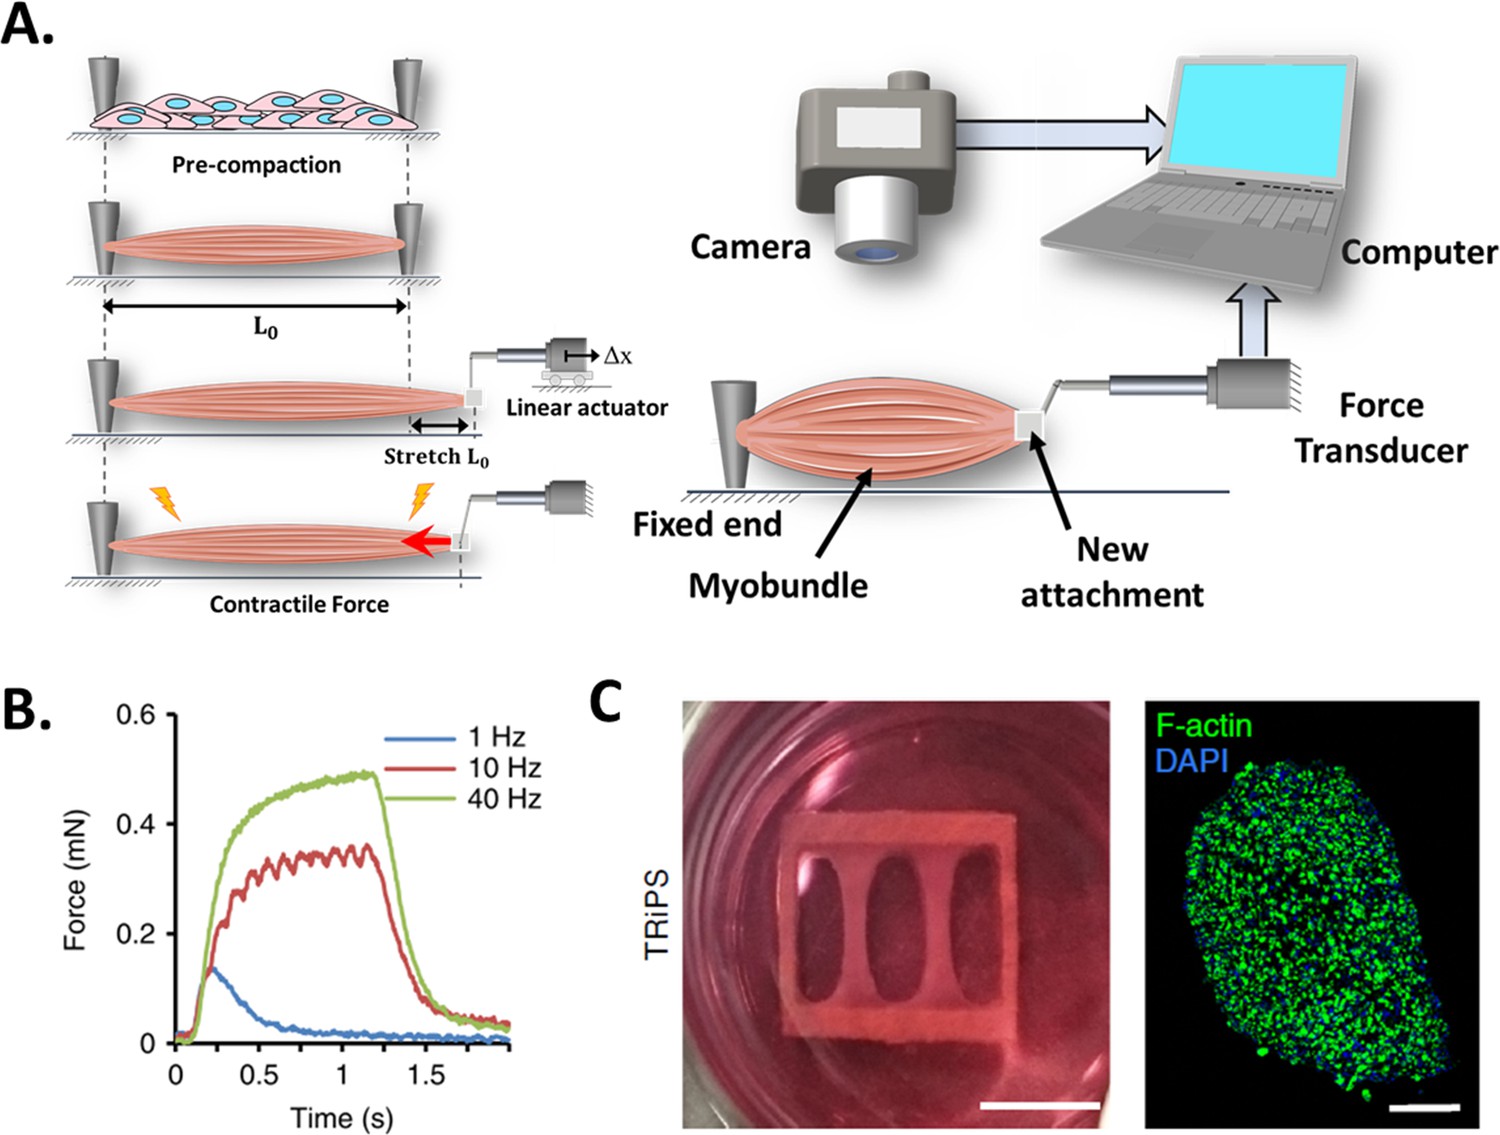
Force transducers.
(A) In vitro 3D tissue is grown between two anchors. To assess contraction force, one of its sides is connected to a force transducer which will evaluate the force exerted by the muscle due to stimuli. (B) Representative contractile properties of hPSC-derived iSKM bundles. TRiPS-derived bundle (4 weeks) shows increases in contractile force with an increase of stimulation frequency up to the formation of tetanic contraction. Specific force and tetanic-to-twitch ratio of H9 and TRiPS-derived bundle (2 weeks) and (C) (Left) two-week differentiated iSKM bundles pair anchored within a nylon frame. (Right) Representative immunostaining of dense, uniformly distributed myotubes in bundle-CSA. Panel B reprinted from Figures 3A, B and 4A from Rao et al., 2018.
Figure 6
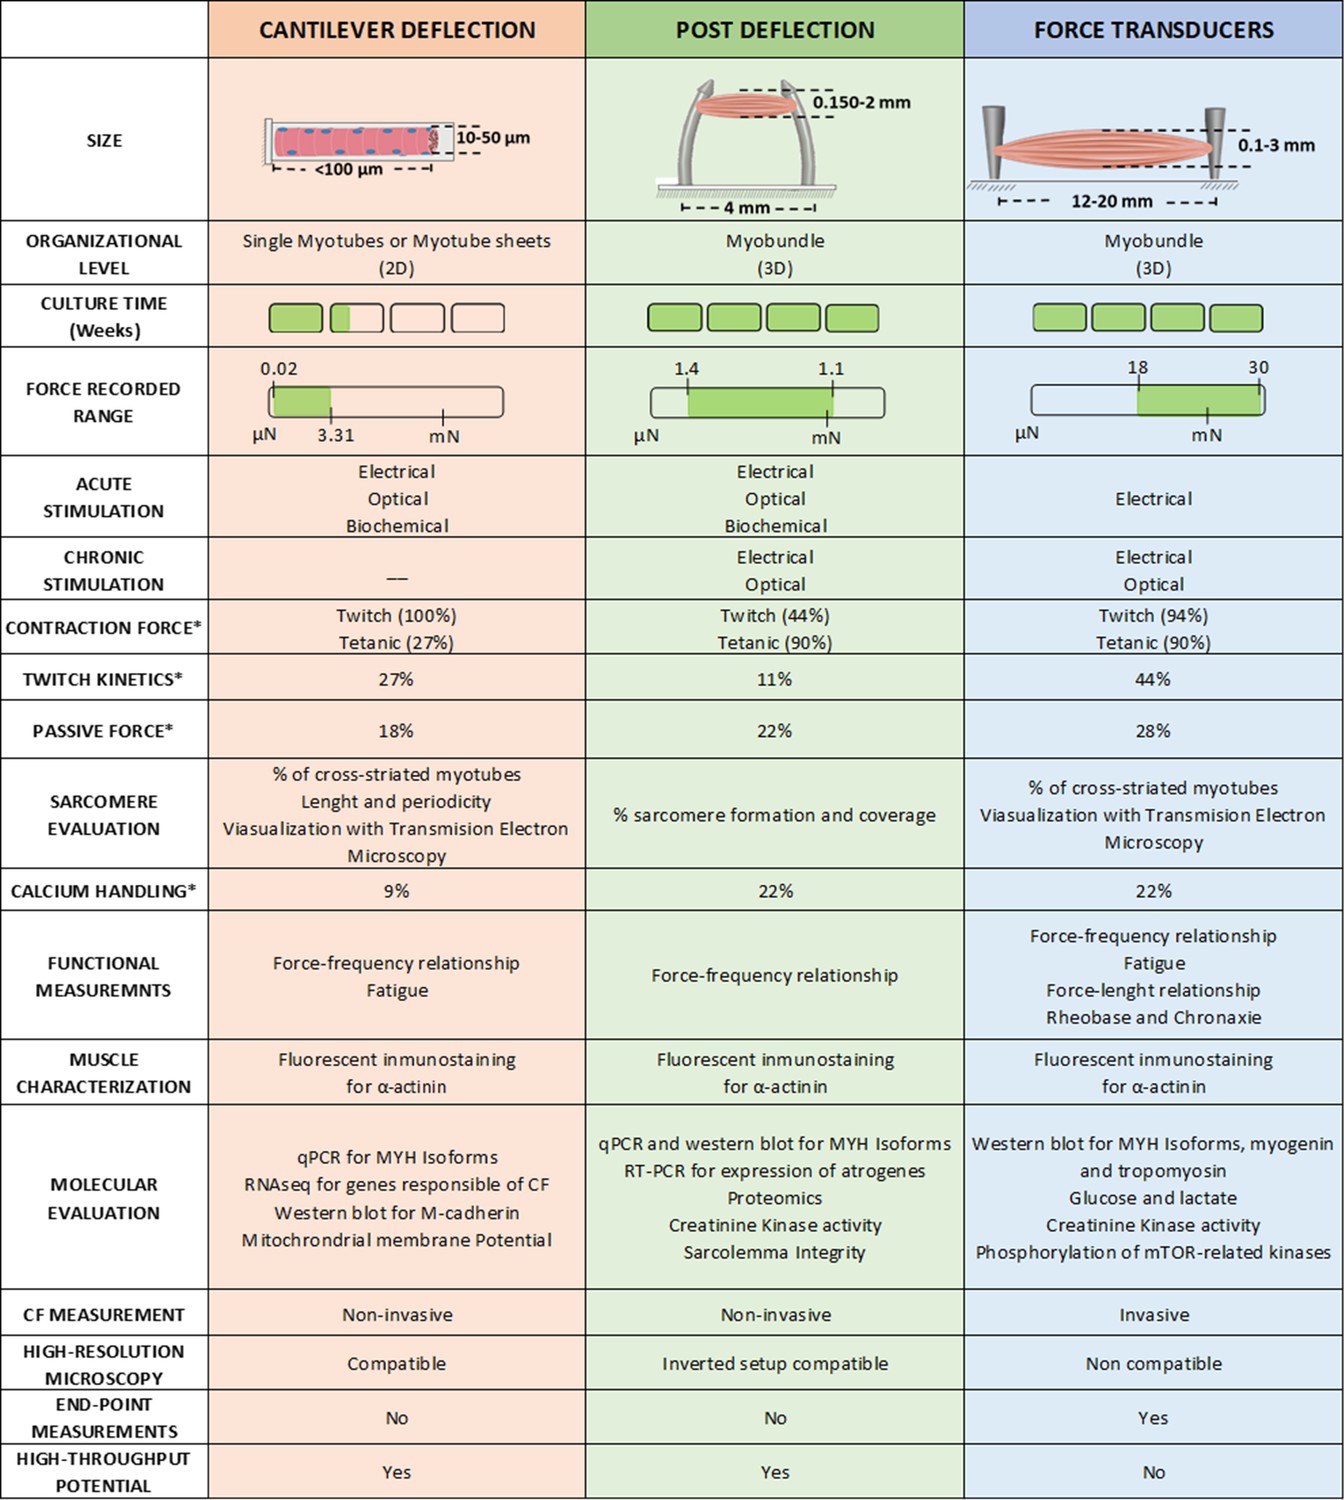
Overview of the different techniques used to measure contractile force in vitro.
* Represents de % of studies that have performed this measurement.
-
Figure 6—source data 1
Editable version of Figure 6.
- https://cdn.elifesciences.org/articles/77204/elife-77204-fig6-data1-v1.xlsx
Figure 7
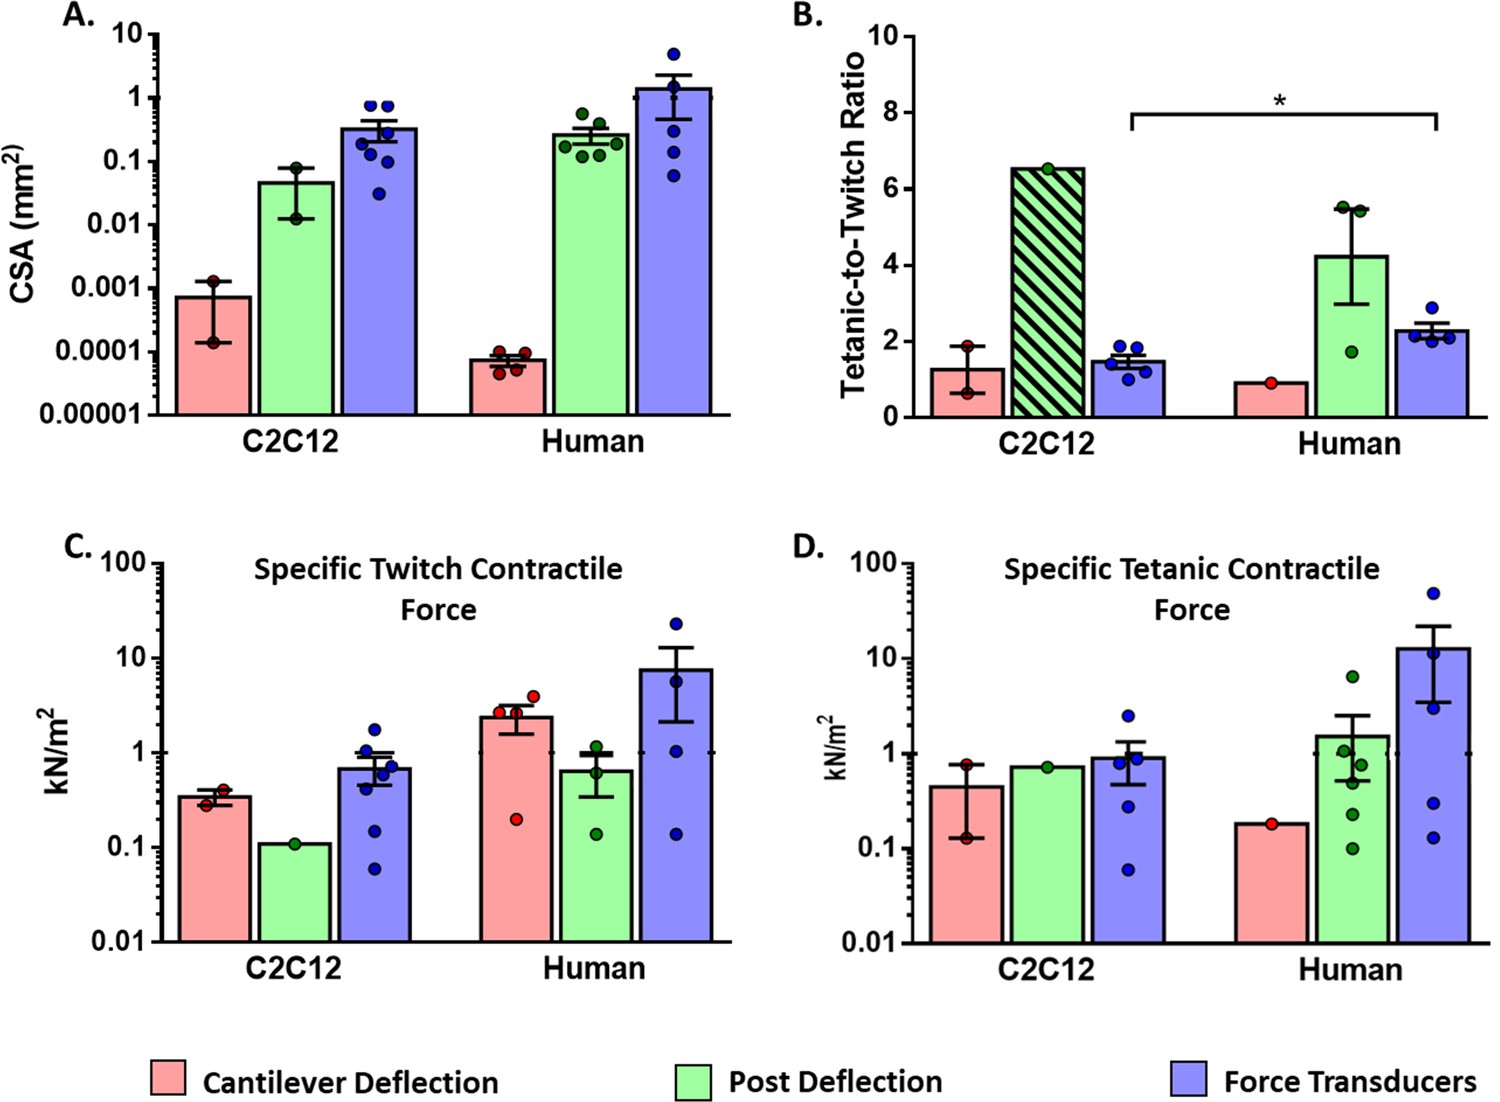
Functional characteristics of in vitro 2D and 3D skeletal muscle tissues from C2C12 and human sources (immortalized, iPSC and primary myoblast).
(A) Whole cross-sectional area (CSA) of muscle tissues. (B) Tetanic-to-Twitch ratio was calculated from data within the same study, except for bar with a diagonal pattern in post deflection, which was calculated from two different studies. (C) Twitch and Tetanic specific force measure in the three platforms for C2C12 constructs and (D) Human source. Data is presented as mean ± SEM. *p < 0.05, unpaired t-Test.
Tables
Table 1
Maximum contractile force data from in vitro muscle models measured by the three main platforms.
| Cell source | Evaluation time | Size | CSA(mm2) | Twitch contraction | Tetanic contraction | Tetanic-Twitch Ratio* | References | |||
|---|---|---|---|---|---|---|---|---|---|---|
| CF (µN) | sF (kN/m²) | CF (µN) | sF (kN/m²) | |||||||
| Cantilever deflection | C2C12 myoblasts (mouse) | Day 7 | 50 μm (Width)i 33 µm (Thickness)* | 0.001308* | 0.54 ± 0.02 | 0.41* | 1.01 ± 0.14 | 0.77* | 1.87 | Fujita et al., 2010 |
| Rat myoblasts (embryonic) | Day 10–13 | 22.5 µm (Width)i 10 µm (Thickness) | 0.000176* | 0.23* | 1.3 | __ | __ | __ | Wilson et al., 2010 | |
| C2C12 myoblasts (mouse) | Day 6 | 12.75 µm (Width)* 8–9 µm (Thickness) | 0.0000851* | 0.80* | 9.4 ± 4.6 | __ | __ | __ | Sun et al., 2013 | |
| Rat myoblasts (embryonic) | Day 12–14 | 11.7–23.4 μm (Width) 7.9–13 μm (Thickness) | 0.000144* | 0.04–0.26 Stoney’s Eq. 0.03–0.18 FEA | 0.359–1.70 Stoney’s Eq. 0.168–1.17 FEA | __ | __ | __ | Pirozzi et al., 2013 | |
| Primary human myoblast | Day 23 | 10 µm (Width)i 6.67 µm (Thickness)* | 0.000052* | 0.14g | 2.69* | __ | __ | __ | Smith et al., 2014 | |
| Rat myoblasts (adult) | Day 4–7 | 16.74 µm (Width)* 11.16 µm (Thickness)g | 0.000146* | 0.17g | 1.15* | __ | __ | __ | McAleer et al., 2014 | |
| Human myoblasts | Day 3–6 | 12.11 μm (Width)g 8.07 µm (Thickness)* | 0.0000767* | 0.78* | 9.98g | __ | __ | __ | Nesmith et al., 2016# | |
| Human induced pluripotent stem cell | Day 14 | 11.82 μm (Width)g 10.35 μm (Thickness)g | 0.0000961* | 0.38* | 3.98g | __ | __ | __ | Badu-Mensah et al., 2020 | |
| Human induced pluripotent stem cell | Day 10–11 | 9.30 μm (Width)g 6.2 μm (Thickness)* | 0.0000452* | 0.12 ± 0.02 | 2.65* | __ | __ | __ | Guo et al., 2020 | |
| Chick myoblasts | 3 weeks | 11.24 µm (Width)g 7.49 μm (Thickness)* | 0.0000661* | 1.44* | 21.89g | 3.31* | 50g | 2.28 | Santoso et al., 2021 | |
| C2C12 myoblasts (mouse) | 16.30 µm (Width)g 10.86 μm (Thickness)* | 0.000139* | 0.027 | 0.2g | 0.018 | 0.129g | 0.64 | |||
| Human myoblasts | 14.02 µm (Width)g 9.34 μm (Thickness)* | 0.0001028* | 0.020 | 0.2g | 0.019 | 0.182g | 0.91 | |||
| Human induced pluripotent stem cell | Day 7–10 | 22.5 μm (Width)* 15 μm (Thickness) | 0.000265* | 0.26* | 0.986g | 0.52 | 1.986g | 2.01 | Al Tanoury et al., 2021 | |
| Post deflection | Primary Mouse myoblasts | Day 1–12 | 2 mmi | 3.14* | __ | __ | 42.5g | 13.53* | __ | Vandenburgh et al., 2008# |
| C2C12 myoblasts (mouse) | Day 14 | 0.14 ± 0.01 mm | 0.0125 (active) 0.0012 (effective) | 1.4* | 0.11 (active)* 1.12 (effective)* | __ | Sakar et al., 2012 | |||
| C2C12 myoblasts (mouse) | Day 6 | 0.32 mmi | 0.079* | __ | __ | 57.5 ± 12.8 | 0.72* | Shimizu et al., 2017# | ||
| Primary human myoblasts | Day 11 | 0.85 mm* | 0.566i | 79.44i | 0.14* | 428.57i | 0.76* | 5.42 | Mills et al., 2019 | |
| Derived-Myoblasts from Human Dermal Fibroblast | Day 4–10 | 0.30 mmi | 0.120* | __ | __ | 12.2 ± 5.3 | 0.10* | __ | Shimizu et al., 2020 | |
| Primary human myoblasts | Day 7–14 | 0.71 mm* | 0.395* | __ | __ | 192* | 0.49* | __ | Afshar et al., 2020 | |
| Immortalized human myoblast | Day 8 | 0.4 mm | 0.125* | __ | __ | 28.5 ± 10.5 | 0.23 | __ | Nagashima et al., 2020 | |
| Immortalized human myoblast | Day 7–14 | 0.47 mm* | 0.17 ± 0.03 | 200 ± 40 | 1.17 | 1100 ± 300 | 6.47 | 5.52 | Hofemeier et al., 2021 | |
| Immortalized human myoblast | Day 10 | 0.49 mmi | 0.189* | 118.01g | 0.62* | 201.89g | 1.07* | 1.72 | Ebrahimi et al., 2021 | |
| Force tranducers | Rat myoblasts (adult) | Day 31 ± 4 | 0.49 ± 0.04 mm | 0.188* | 215 ± 26 | 1.14* | 440 ± 45 | 2.9 ± 0.5 | 2.54 | Dennis and Kosnik, Ii, 2000 |
| Rat myoblast (Extensor digitorum longus) | Day 32 ± 4 | 0.17 mm* | 0.024 ± 0.009 | 162 ± 125 | 6.75* | 281 ± 218 | 11.70* | 1.73 | Dennis et al., 2001 | |
| Rat myoblasts | 3 weeks | 0.18 ± 0.01 mm | 0.0246* | 329 ± 26.3 | 13.37* | 805.8 ± 55 | 32.75 | 2.45 | Huang et al., 2005 | |
| Rat myoblasts | Day 16–18 | 0.25 mmg | 0.048* | 102g | 2.12* | 212g | 4.41* | 2.08 | Larkin et al., 2006 | |
| C2C12 myoblasts (mouse) | Day 5–8 | 0.21 mm* | 0.0978i | 71.39* | 0.73 ± 2.13 | 86.06* | 0.88 ± 0.48 | 1.20 | Fujita et al., 2009# | |
| C2C12 myoblasts (mouse) | Day 2–17 | 0.2 mm* | 0.031* | 33.2 | 1.06 | __ | __ | __ | Yamamoto et al., 2011# | |
| Rat myoblasts (neonatal) | Day 14 | 2.7 ± 0.18 mm (Bundle) | 5.72 (Bundle)* | 1680 ± 320 | 0.29* 5.5 ± 0.6 (effective) | 2840 ± 500 | 0.50* 9.4 ± 0.7 (effective) | 1.72 | Hinds et al., 2011 | |
| C2C12 myoblasts (mouse) | Day 7 | 0.40 mm | 0.13* | 18.3 ± 2.4 | 0.15* | 34.5 ± 2.8 | 0.276* | 1.84 | Sato et al., 2013# | |
| Rat myoblasts | 2 weeks | 1.38 mm (Bundle)* 0.9 mm (F-actin+) * | 1.50 (Bundle)g 0.63 ± 0.05 (F-actin+) | 17830 ± 1000 | 11.89 (Bundle)* 28.30 (F-actin+)* | 28800 ± 930 | 19.2 (Bundle)* 43.39 ± 3.82 (F-actin+) | 1.61 | Juhas and Bursac, 2014# | |
| Primary Human myoblast | 4 weeks | 2.5 mmi | 4.91* | 701g | 0.14* | 1460g | 0.30* | 2.14 | Madden et al., 2015 | |
| C2C12 myoblasts (mouse) | Day 14 | 0.5 ± 0.08 mm | 0.19* | 81.26g | 0.42* | 151.37g | 0.79* | 1.88 | Ikeda et al., 2016# | |
| C2C12 myoblasts (mouse) | 3 weeks | 0.6 mmi | 0.28* | 166.3 ± 59.4 | 0.59* | __ | __ | __ | Nakamura et al., 2017 | |
| hPSC derived human myoblasts | 2 weeks | 0.42 mmi | 0.14* | 140g | 1.04 | 402g | 3.00* | 2.88 | Rao et al., 2018 | |
| C2C12 myoblasts (mouse) | Day 14 | 0.98 mmi | 0.756* | 48.39 ± 3.49 | 0.06 | 47.74 ± 0.31 | 0.06 | 1 | Capel et al., 2019 | |
| Primary Human Myoblast | 2 weeks | 0.62 mmi | 0.30* | 1700 ± 130 | 5.70* | 3400 ± 180 | 11.40* | 2 | Khodabukus et al., 2019 | |
| hPSC derived human myoblasts | 4 weeks | 0.28 mmi | 0.06* | 1393 ± 342 | 23.21* | 2924 ± 517 | 48.73* | 2.09 | Xu et al., 2019 | |
| C2C12 myoblasts (mouse) | 10 Days | 0.99 mm | 0.77* | 1360 ± 210 | 1.77* | 1930 ± 120 | 2.50* | 1.41 | Akiyama et al., 2021 | |
| Primary Human Myoblast | Day 17–19 | 1.39 mmi | 1.51* | __ | __ | 175* | 0.13* | __ | Alave Reyes-Furrer et al., 2021 | |
-
*Recalculated data; gData extract from a graph; iData extract from an image; #Studies with where maximal instantaneous CF data was used.
-
Table 1—source data 1
Additional information specific to the experimental setup and stimulation parameters.
- https://cdn.elifesciences.org/articles/77204/elife-77204-table1-data1-v1.pdf
Table 2
Summary of several skeletal muscle disease models in post deflection and force transducer platforms.
Key parameters like drugs, change in CF (%∆CF) and other observed effects are detailed.
| Disease model | Drug | Platform | Cell source | %∆CF(Dose) | Observed effect | Reference |
|---|---|---|---|---|---|---|
| Atrophy | Dexamethasone | Post deflection | C2C12 myoblast (mouse) | –53% (100 µM) | Increase in the expression of Atrogin-1 (2.6) and MuRF-1 (2.2) Decrease in number of fibers with striation patterns (20% vs 8%) | Shimizu et al., 2017 |
| Immortalized human myogenic cells | –57% (100 µM) | Increase in the expression of Atrogin-1 and MuRF-1. Expression of FOXO3 and KLF15 | Nagashima et al., 2020 | |||
| Primary Human myoblast | –85% (10 nM) | Dose-dependent decrease in myotube width | Afshar et al., 2020 | |||
| C2C12 myoblast (mouse) | –48% (1 mM) | Yoshioka et al., 2020 | ||||
| Force transducer | Primary Human myoblast | –67% (25 µM) | Decrease in myotube diameter (25 µM, 12%) Decrease in effective-CSA (60%) Decrease in injury biomarkers CK and LDH | Khodabukus et al., 2020 | ||
| C2C12 myoblast (mouse) | –70% (100 µM) | Decrease in myotube-CSA (37%) | Aguilar-Agon et al., 2021 | |||
| Hypertrophy | IGF-1 | Force transducer | Rat myoblast | + 31% (75 ng) | Increase in CF (75 ng, 31%) Slow Time to peak twitch force (25 ng, 26%) | Huang et al., 2005 |
| Primary Human myoblast | + 28% (0.5 mg/ml) | Increase in myotube diameter (0.5 mg/ml, 21%) Increase in injury biomarkers CK and LDH | Khodabukus et al., 2020 | |||
| Post deflection | Primary Mouse myoblast | + 66% (100 ng/ml) | Increase in fiber-CSA (41%) | Vandenburgh et al., 2008 | ||
| Immortalized control C57 and mdx myoblast | + 93% (0.01 µM) | Vandenburgh et al., 2009 | ||||
| C2C12 myoblast (mouse) | + 25% | Increase in CF in Dex-induced atrophic tissues (45%*) | Shimizu et al., 2017 | |||
| Derived myoblast from human dermal fibroblast | + 72% (100 ng/ml) | Decrease in CF in non-cryopreserved cells (100 ng/ml, 79%*) | Shimizu et al., 2020 | |||
| Statin-induced myopathy (Rhabdomyolysis) | Lovastatin | Force transducer | Primary Human myoblast | –75% (2 µM) | Dose-dependent lipid accumulation | Madden et al., 2015 |
| Primary Human myoblast | –53% (5 µM) | Dose-dependent lipid accumulation | Ananthakumar et al., 2020 | |||
| Post deflection | Immortalized human myogenic cells | –75% (2 µM) | Increase in the expression of Atrogin-1 and MuRF-1. | Nagashima et al., 2020 | ||
| Cerivastatin | Force transducer | Primary Human myoblast | –50% (50 nM) | Decrease in CF (50 nM, 50%*) Dose-dependent lipid accumulation | Madden et al., 2015 | |
| Primary Human myoblast | –85% | Reduction in myotube diameter Dose-dependent decrease in injury biomarkers CK and LDH | Vandenburgh et al., 1996 | |||
| Human Skeletal myoblast | –40% (100 nM) | Decrease in CF Decrease in passive force Myofibers Sarcomere degradation | Zhang et al., 2018 | |||
| Post deflection | Primary Human myoblast | –62% (10 nM) | Decrease in CF (10 nM, 62%*) Dose-dependent decrease in myotube width | Alave Reyes-Furrer et al., 2021 |
-
*Recalculated data.
Download links
A two-part list of links to download the article, or parts of the article, in various formats.
Downloads (link to download the article as PDF)
Open citations (links to open the citations from this article in various online reference manager services)
Cite this article (links to download the citations from this article in formats compatible with various reference manager tools)
Contractile force assessment methods for in vitro skeletal muscle tissues
eLife 11:e77204.
https://doi.org/10.7554/eLife.77204


