Transition to siblinghood causes a substantial and long-lasting increase in urinary cortisol levels in wild bonobos
- Endocrinology Laboratory, German Primate Center, Leibniz Institute for Primate Research, Germany
- Max Planck Institute for Evolutionary Anthropology, Germany
- Domestication Lab, Konrad Lorenz Institute of Ethology, Department of Interdisciplinary Life Sciences, University of Veterinary Medicine Vienna, Austria
- Comparative BioCognition, Institute of Cognitive Science, University of Osnabrück, Germany
- Center for the Advanced Study of Human Paleobiology, Department of Anthropology, George Washington University, United States
- Max Planck Institute of Animal Behavior, Germany
- Centre for Research and Conservation, Royal Zoological Society of Antwerp, Belgium
Figures
Figure 1 with 5 supplements
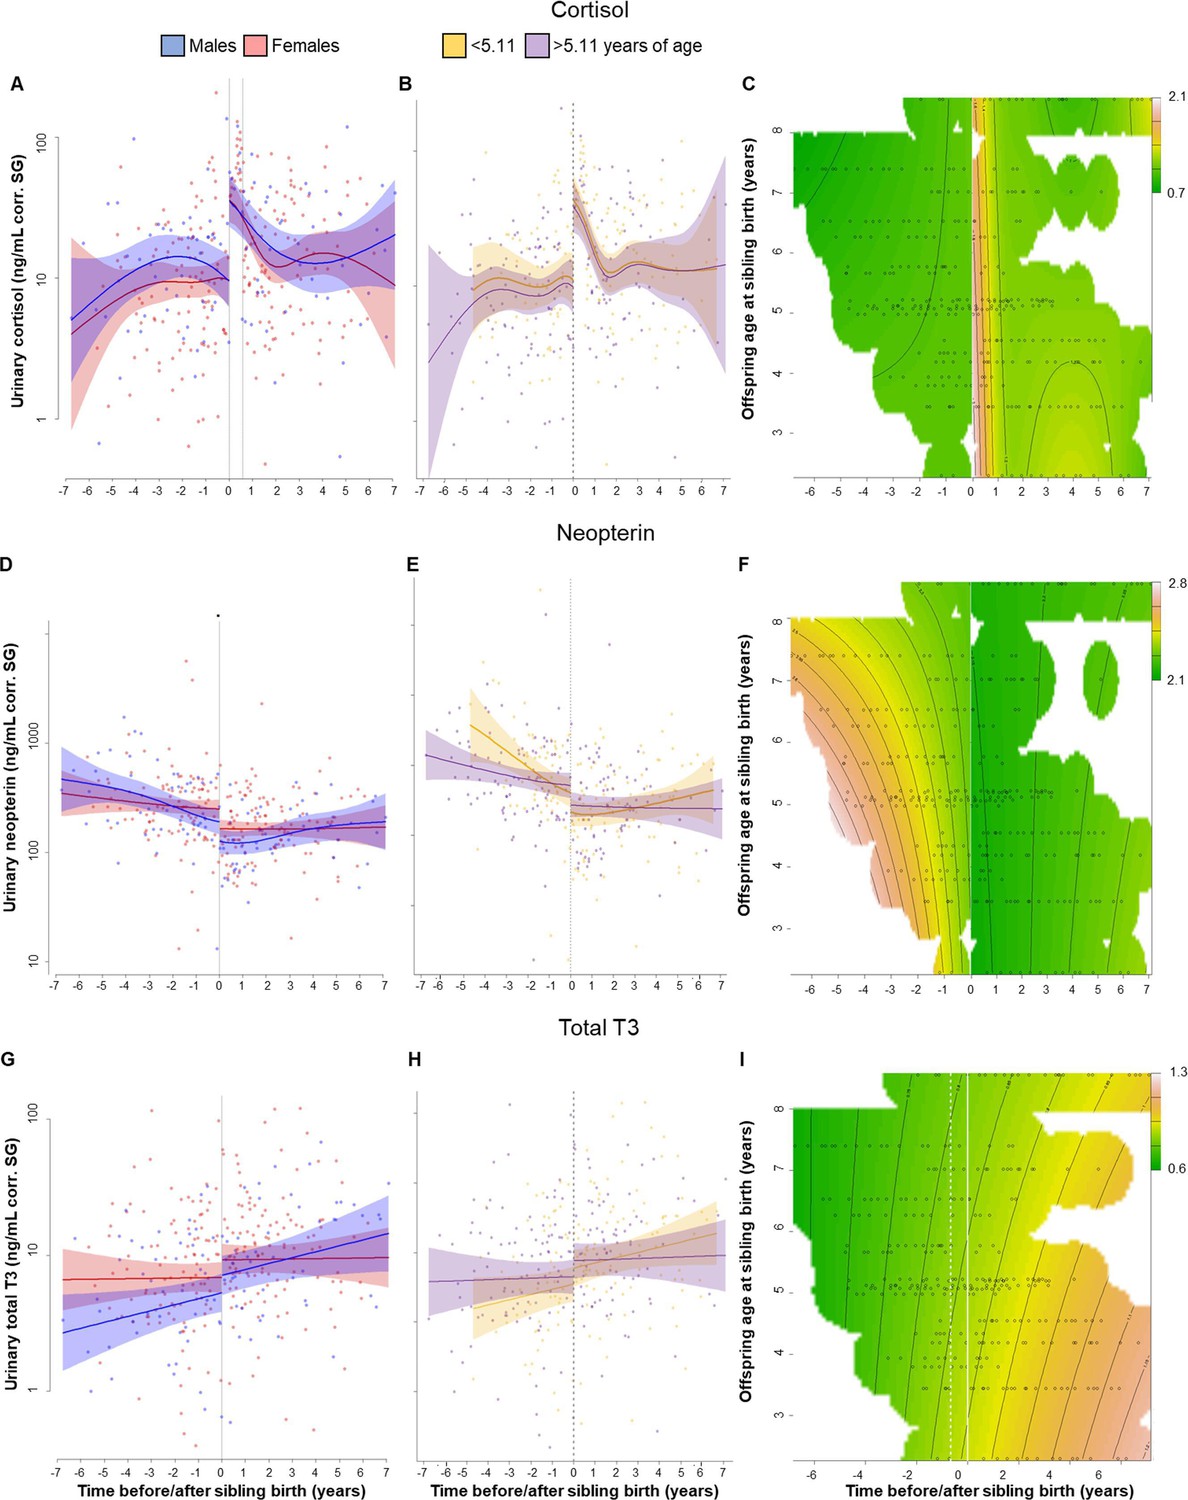
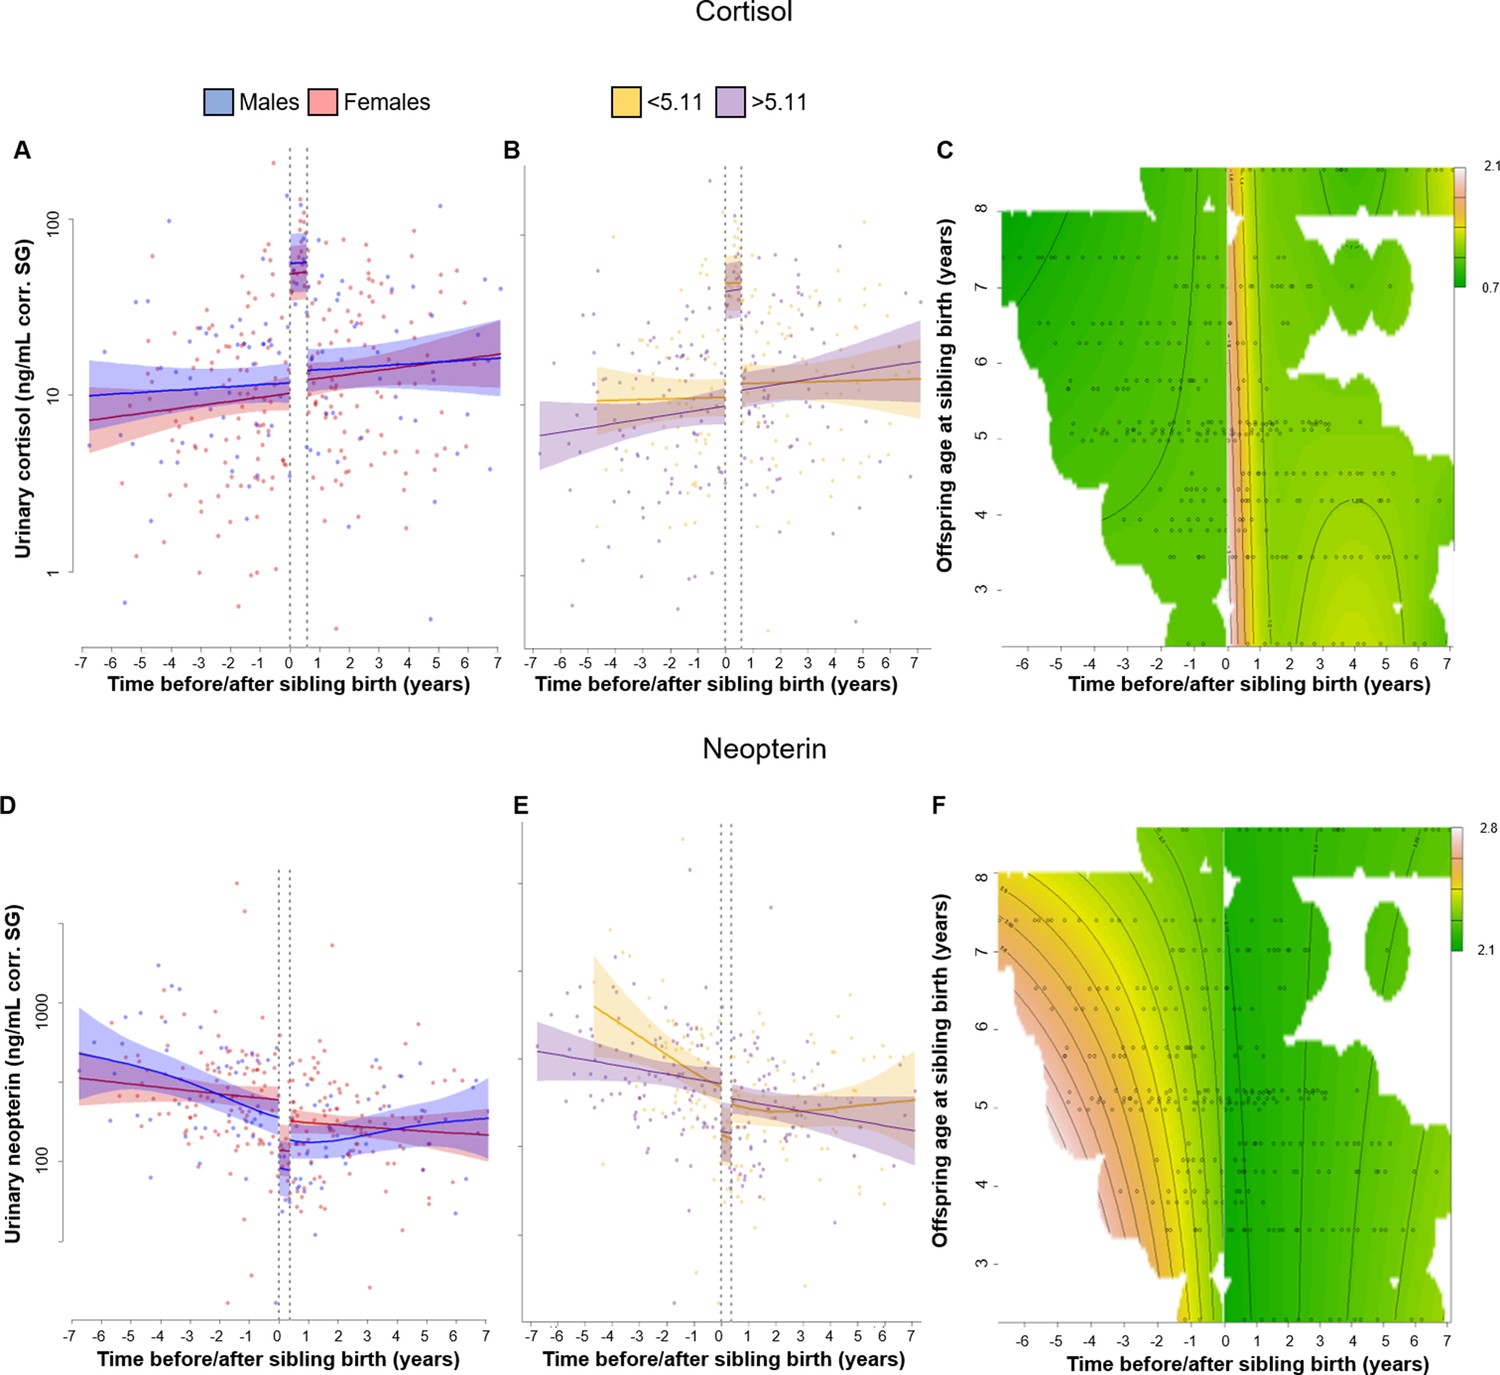
Physiological changes in cortisol (A–C), neopterin (D–F), and total T3 (triiodothyronine) (G–I) levels in the older offspring, 7 years before and after sibling birth (sibling birth at 0).
Data points are physiological measures corrected for specific gravity (SG). All smooths are not controlled for age to show cumulative pattern. Axes for physiological variables are log-transformed. 95% confidence intervals are plotted. Left-hand plots (A, D, G): sex-specific trajectories around sibling birth (blue: males; red: females). Middle plots (B, E, H): age-specific trajectories around sibling birth for offspring that were older (purple) or younger (yellow) than the median value of 5.1 years at sibling birth. Right-hand plots (C, F, I): interaction plots visualizing how trajectories around sibling birth change with increasing offspring age at sibling birth (scale from dark green [lowest levels] to brown [highest levels]; white space: extrapolation would be unreliable due to lacking data) for the respective perspective plots, see Figure 1—figure supplement 5. (A) Urinary cortisol levels showed a significant, sudden rise to fivefold values at sibling birth (dotted line); no sex differences or age effects. (B, C) The sudden rise in cortisol levels was independent of the age of the older offspring at sibling birth. (D) Urinary neopterin levels decreased by 1/3 at sibling birth (dotted line; no sex differences or age effects). (E, F) The sudden decrease in neopterin levels was independent of the age of the older offspring at sibling birth. (G–I). Urinary total T3 levels increased around sibling birth, but this effect was indistinguishable from a general age effect. There was no significant sudden change at sibling birth in total T3 levels (G), and there was no significant effect of the age at sibling birth (H, I).
Figure 1—figure supplement 1
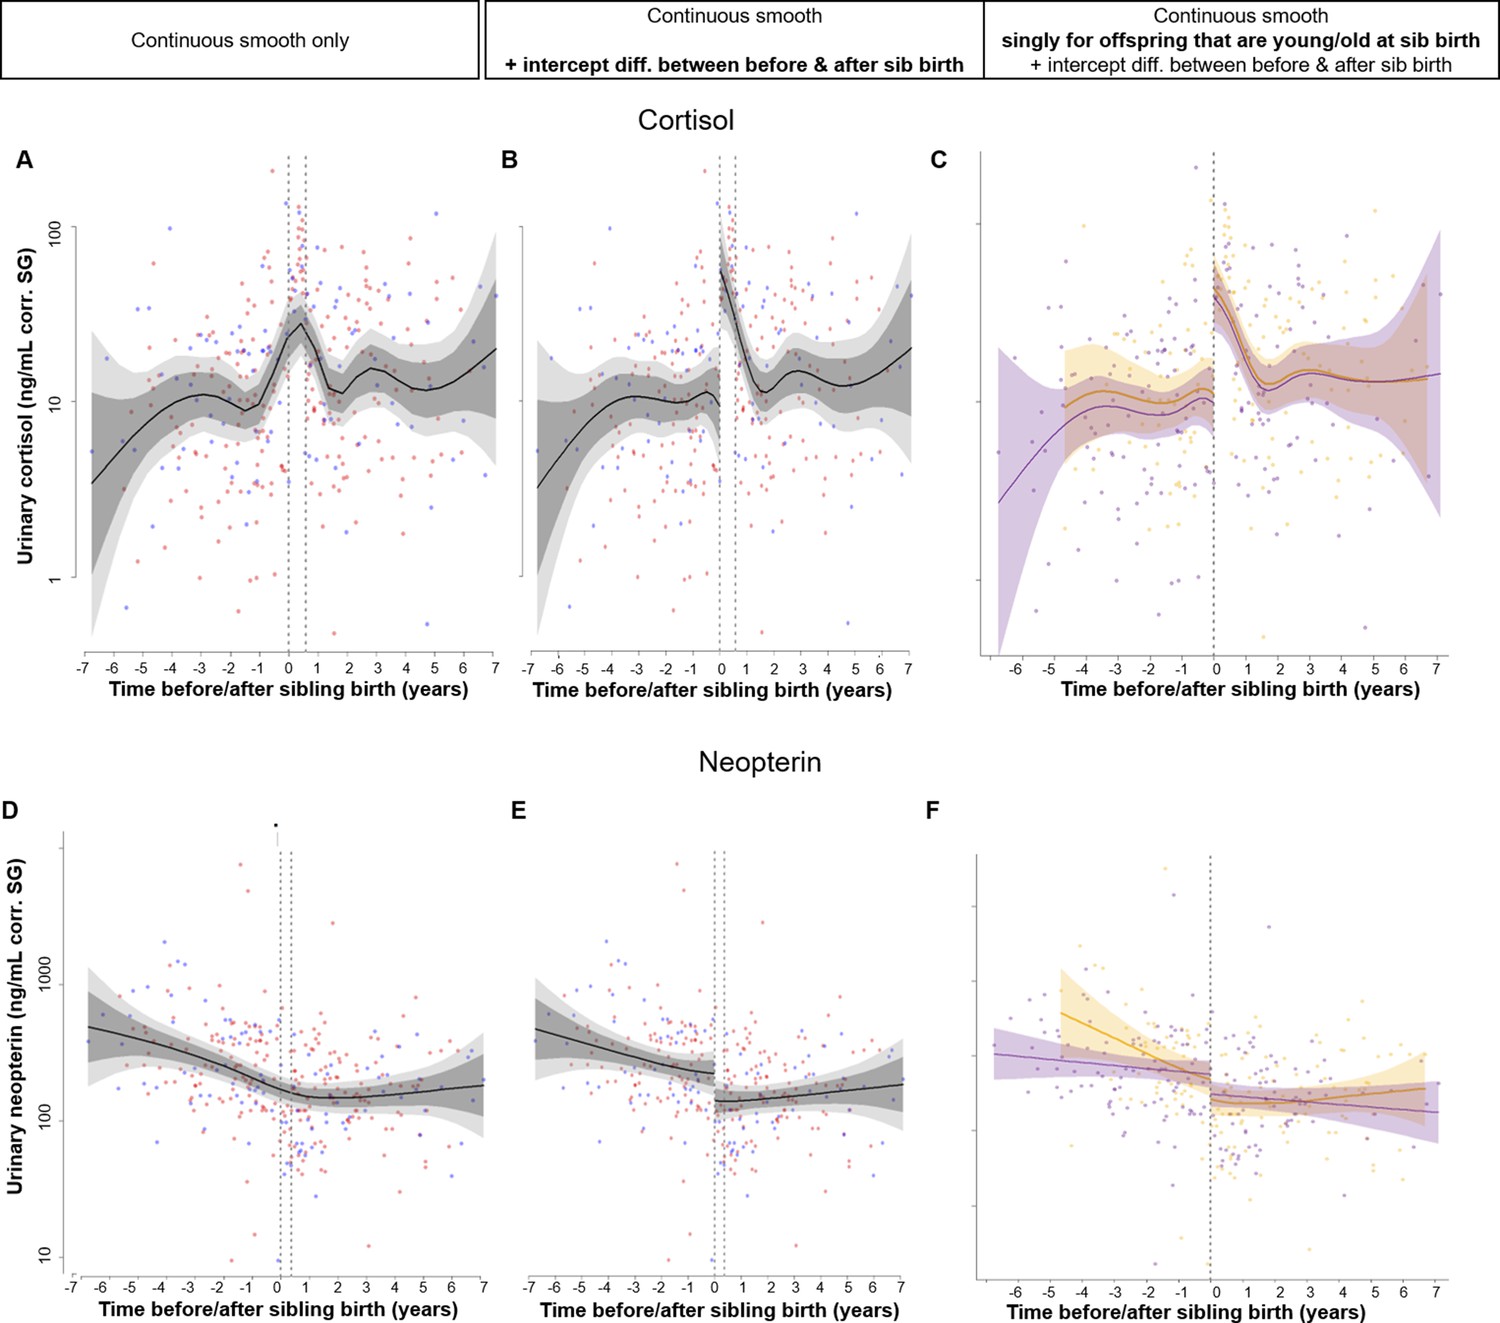
Explanation of the principal concept of the applied series of statistical models using the example of our main analysis on offspring urinary cortisol and neopterin levels 7 years before and after sibling birth (0 marks the time of sibling birth).
Confidence intervals: 95% (dark gray) and 99.9% (light gray). Dotted lines: sibling birth (left) and potential second discontinuity in data at 7 (cortisol) and 4.5 months (neopterin) after sibling birth. Data points are original values of physiological measures corrected for specific gravity (SG) and are depicted with females in red and males in blue. All smooths are not controlled for age to show cumulative pattern. Axes for physiological variables are log-transformed. Real models were additionally allowed for sex-specific trajectories (see main text). (A–C) Response variable: urinary cortisol. (A) For all our physiological and behavioral response variables, we first ran a model with a continuous smooth only that allows for nonlinear modeling of changes around sibling birth but not for a discontinuity ( = sudden change) in values. (B) Next, we ran an identical model as in (A) but additionally allowing for an intercept difference between before and after the birth of a younger sibling, thereby allowing for a discontinuity and thus an abrupt change of response values at sibling birth. Significance of this discontinuity was estimated through model comparison between (A) and (B). (C) The same as (B) but additionally with separate smooths ( = trajectories) for offspring that were younger or older than the median age (5.11 years) at sibling birth, allowing for a change in pattern with increasing offspring age. Significance of this age difference was estimated through model comparison between (B) and (C). To allow for visual inspection, we further provide continuous interaction plots showing how trajectories in the response variables around sibling birth change continuously with the age of the offspring at sibling birth. (D–F) Same as (A–C) but for urinary neopterin.
Figure 1—figure supplement 2
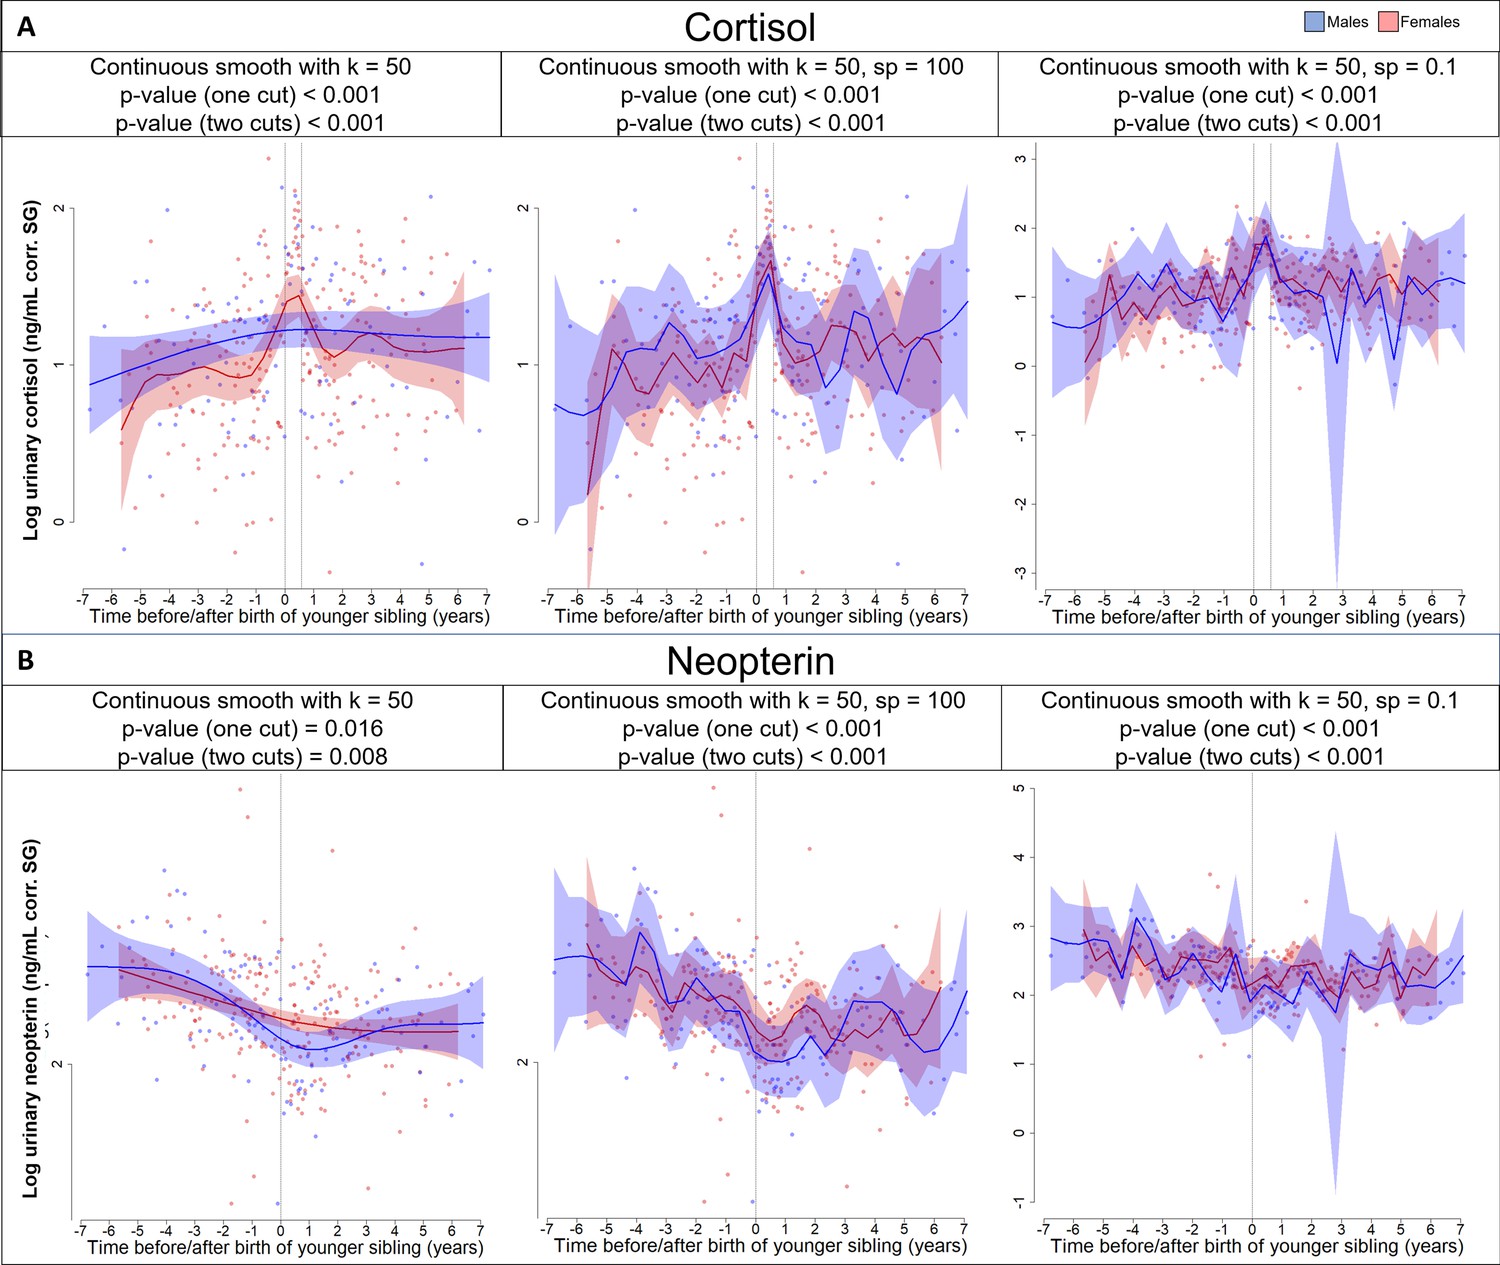
Different models of continuous smooths of (A) cortisol and (B) neopterin levels around sibling birth that are allowed for high levels of wiggliness and thus overfitting.
We tested whether the additional allowance for one or two discontinuities still provides a better model fit in a model comparison if compared with such continuous but highly flexible smooths that could theoretically also sufficiently fit the sudden changes. k = number of basis functions (here set to 50 for the predictor variables but kept at 6 for the random smooths to allow for high wiggliness and also for model comparison with the discontinuous models). sp = smoothing penalty, set to low values (and deactivating the default, automatic smoothing penalty estimation of the generalized additive mixed models [GAMM]).
Figure 1—figure supplement 3
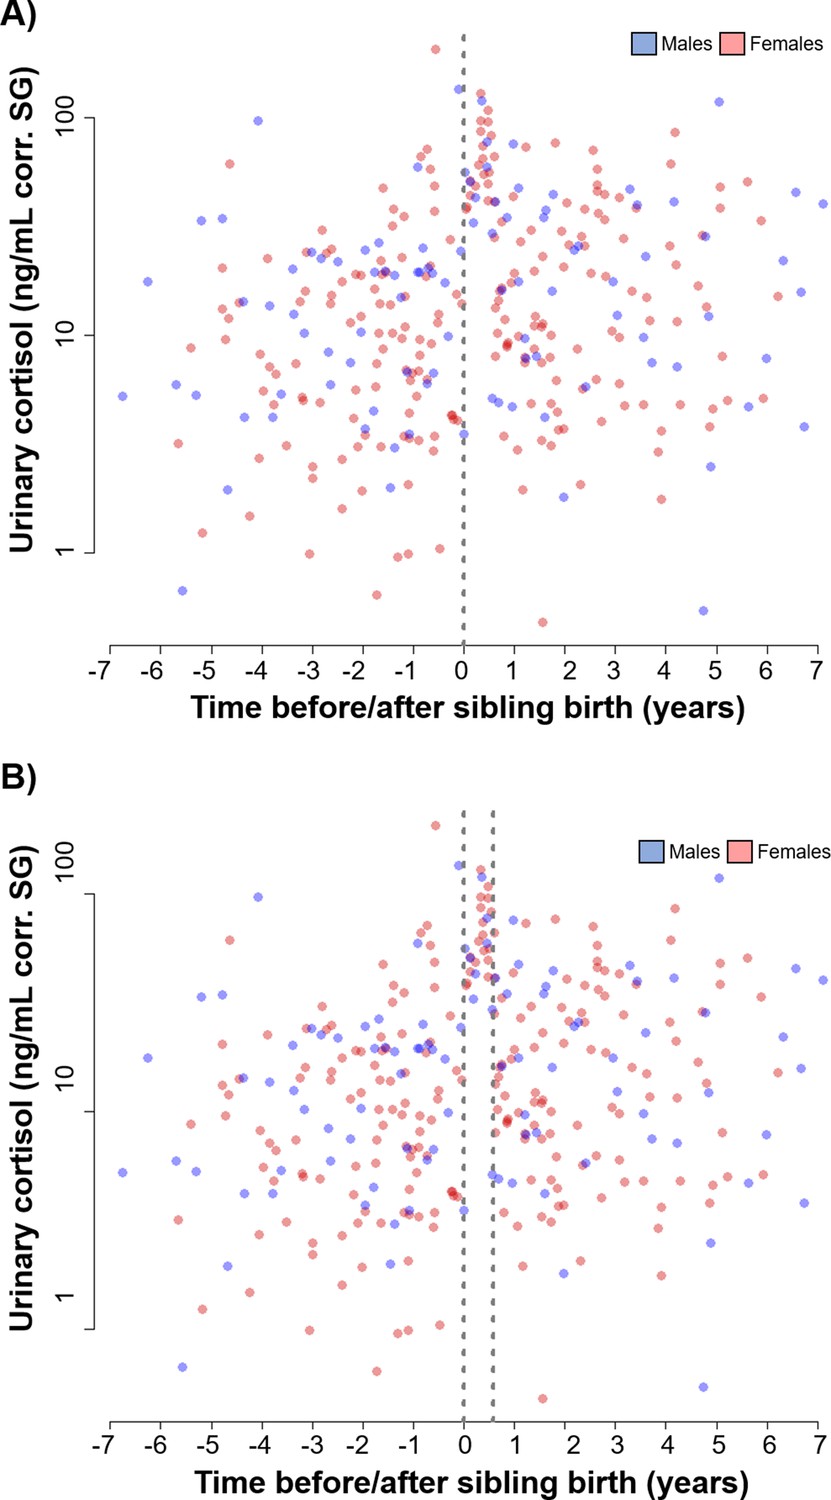
Scatter plot of the older sibling urinary cortisol data (blue: males; red: females) in relation to sibling birth (A) with a vertical dotted line at sibling birth (sibling birth is at 0) and (B) with two vertical dotted lines, one at sibling birth and the second one at the end of a 7-month period.
Between the two vertical dotted lines, we did not find any low cortisol levels. Data points are physiological measures corrected for specific gravity (SG).
Figure 1—figure supplement 4
Physiological changes in cortisol (A–C) and neopterin (D–F) levels in the older offspring 7 years before and after sibling birth (sibling birth is at 0) with a sudden change at sibling birth and a second sudden change after a 7-month period (cortisol) or 4.5-month period (neopterin).
Data points are physiological measures corrected for specific gravity (SG). All smooths are not controlled for age to show cumulative pattern. Axes for physiological variables are log-transformed. 95% confidence intervals are plotted. Left-hand plots (A, D): sex-specific trajectories around sibling birth (blue: males; red: females). Middle plots (B, E): age-specific trajectories around sibling birth, for offspring that were older (purple) or younger (yellow) than the median value of 5.1 years at sibling birth. Right-hand plots (C, F): interaction plots visualizing how trajectories around sibling birth change with increasing offspring age at sibling birth (scale from dark green [lowest levels] to brown [highest levels]; white space: extrapolation would be unreliable due to lacking data).
Figure 1—figure supplement 5
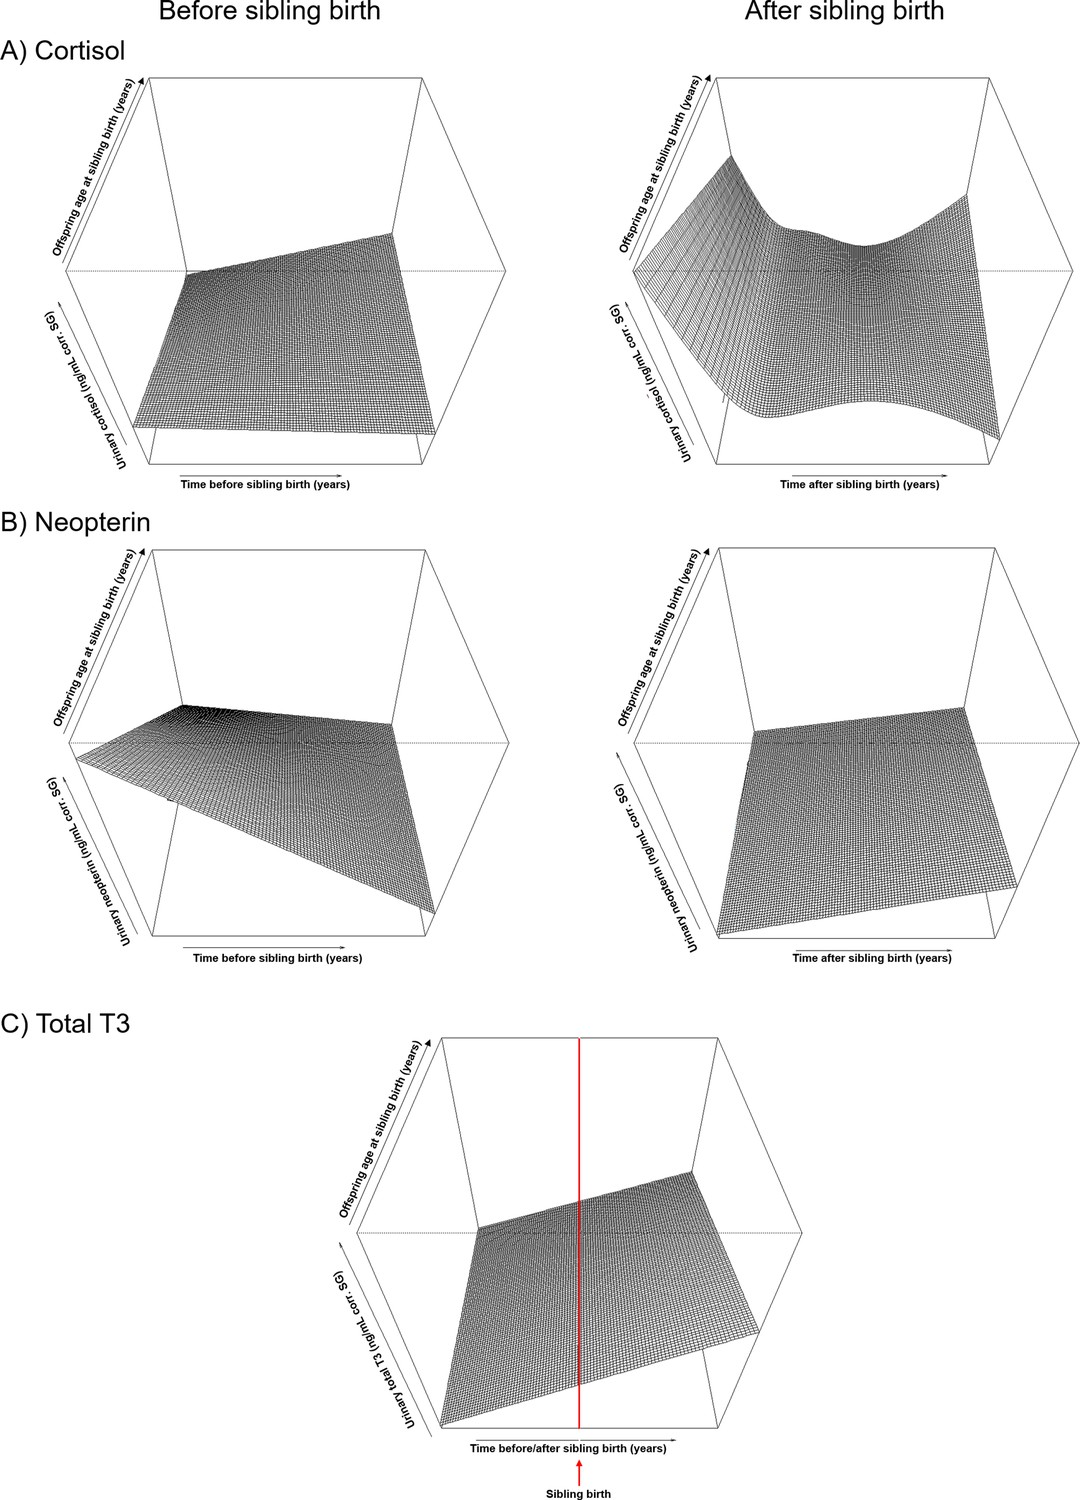
Perspective plots of cortisol, neopterin and total T3, showing how the trajectories of the physiological measures change with increasing age of the offspring at sibling birth.
The plots are identical to the plots in Figure 1 and represent another type of visualization of the contour plots shown in Figure 1C, F, and I. Z-axes represent levels of physiological measures (log-transformed and corrected for specific gravity). All smooths are not controlled for age to show cumulative pattern. (A) Cortisol levels before (left) and after (right; both on same scale) sibling birth. (B) Neopterin levels before (left) and after (right; both on same scale) sibling birth. (C) Total T3 levels before and after sibling birth. Red line = time of sibling birth.
Figure 2 with 2 supplements

Behavioral changes in nipple contact (A–C), riding (D–F), body contact (G–I) and 5 m proximity (J–L) with the mother of the older sibling in relation to sibling birth (sibling birth is set to 0).
Vertical dotted lines = time of putative conception (left dotted line) and sibling birth (right dotted line). Data points represent the proportion of time and circle size the underlying sample size (square-rooted; ranges: riding 3–44, all other behaviors 3–303). All smooths are not controlled for age to show cumulative pattern. 95% confidence intervals are plotted. Left-hand plots (A, D, G, J): sex-specific trajectories around sibling birth (blue: males; red: females). Middle plots (B, E, H, K): age-specific trajectories around sibling birth for offspring that were older (purple) or younger (yellow) than the median value of 5.1 years at sibling birth. Right-hand plots (C, F, I, L): interaction plots visualizing how trajectories around sibling birth change with increasing offspring age at sibling birth (scale from dark green [lowest levels] to brown [highest levels]; white space: extrapolation would be unreliable due to lacking data) for the respective perspective plots, see Figure 2—figure supplement 1. (A–C) Proportion of time spent suckling decreased to zero already before sibling birth (A) and was largely absent in older offspring (B, C), without a sudden change at sibling birth. (D–F) The proportion of time riding on the mother showed a significant and sudden decline at sibling birth (D), but this cut was evident only in offspring younger than 5 years old at sibling birth and not anymore in older offspring (E, F). (G–I) The proportion of time spent in body contact with the mother showed a significant and sudden increase at sibling birth, irrespective of the sex or age of the offspring. (J–L) The proportion of time in 5 m proximity to the mother decreased around sibling birth, but this effect was indiscernible from a general age effect. There was no significant sudden change at sibling birth (J), and there was no significant effect of offspring age at sibling birth (K, L).
Figure 2—figure supplement 1
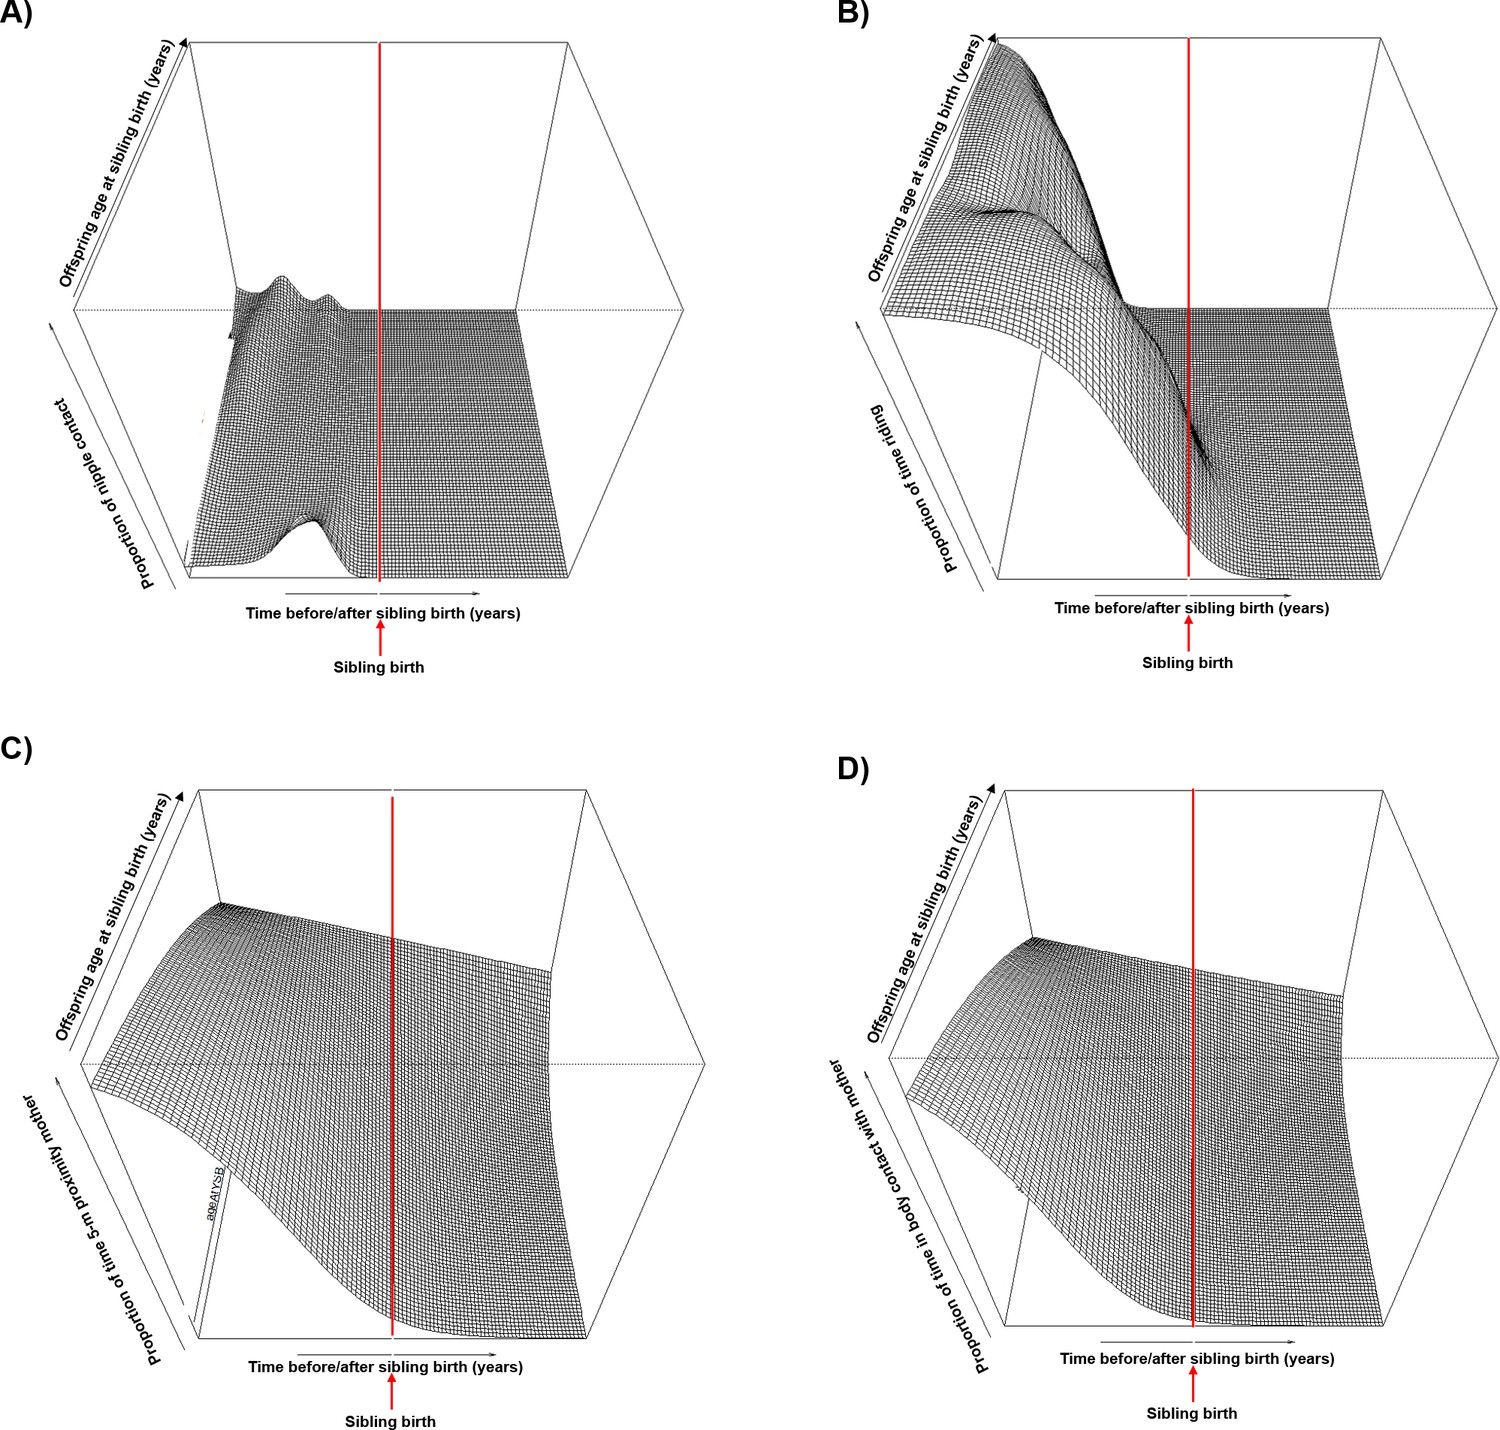
Perspective plots of niplle contact, riding on the mother, body contact and proximity to the mother, showing how the trajectories of the behavioral measures change with increasing age of the offspring at sibling birth.
The plots are identical with the plots in Figure 2 and represent another type of visualization of the contour plots (Figure 2C, F, I, and L). Z-axes represent proportion of time spent (A) nipple contact, (B) riding on mother, (C) in body contact with the mother, and (D) in 5 m proximity to the mother. All smooths are not controlled for age to show cumulative pattern. Red line = time of sibling birth.
Figure 2—figure supplement 2
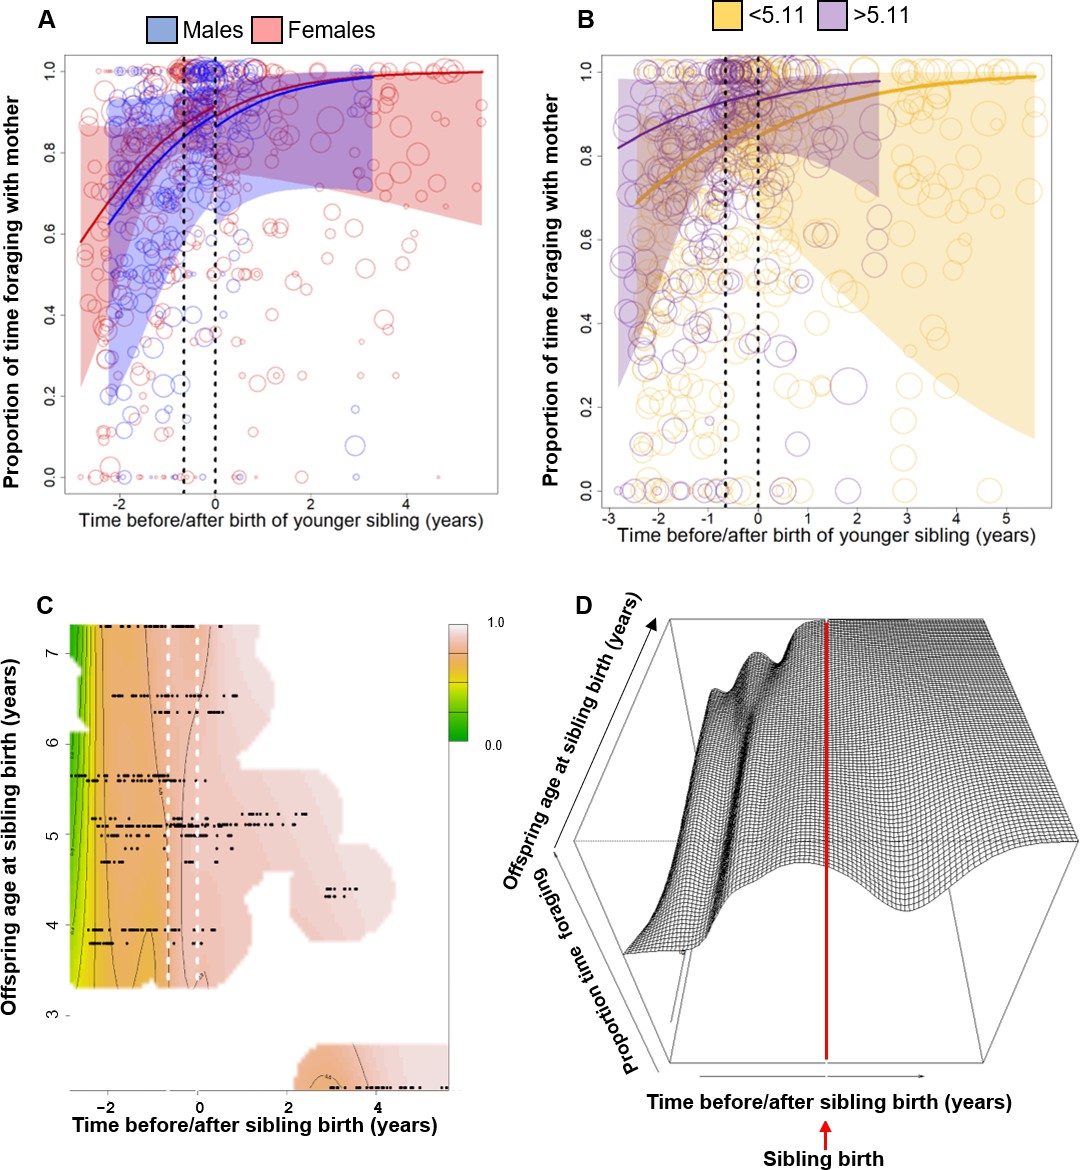
Behavioral changes in the proportion of time spent foraging independently while the mother is foraging (to control for foraging opportunity).
All smooths are not controlled for age to show cumulative pattern. 95% confidence intervals are plotted. (A, B) Vertical dotted lines = time of putative conception (left dotted line) and sibling birth (right dotted line). Data points represent the proportion of time and circle size the underlying sample size (square-rooted; range 1–182). (A) Sex-specific trajectories around sibling birth (blue: males; red: females). (B) Age-specific trajectories around sibling birth for offspring that were older (purple) or younger (yellow) than the median value of 5.1 years at sibling birth. (C, D) Interaction plots visualizing how trajectories around sibling birth change with increasing offspring age at sibling birth. (C) Contour plot: scale from dark green (lowest levels) to brown (highest levels). White space: extrapolation would be unreliable due to lacking data. Vertical dotted lines = time of putative conception and sibling birth. (D) The respective perspective plot. The z-axis represents the proportion of time spent foraging independently. Red line = time of sibling birth.
Tables
Table 1
Summary of the main findings of analyses of physiological markers and scores of older offspring behavioral during the transition to siblinghood (TTS).
| Cortisol | Neopterin | Total T3 | Nursing | Riding | 5m-proximity with mother | Body contact with mother | Independent foraging | |
|---|---|---|---|---|---|---|---|---|
| Sudden change at sibling birth | Yes, increase | Yes, decrease | No | No | Yes | No | Yes, but increase | No |
| Effect of TTS attenuates with offspring age | No | No | No | No: all changes before sibling birth | Yes, effect exists only up to 5 years old | No | No | No: all changes finished before sibling birth |
Table 2
General additive mixed model results for physiological changes (urinary cortisol, urinary neopterin, and urinary total T3 levels; all log-transformed) in the older offspring 7 years before and after sibling birth.
| Reference | Log cortisol | Log neopterin | Log total T3 | ||||||||||
| Factor variables: | Category | Est. | SE | t | p | Est. | SE | t | p | Est. | SE | t | p |
| (intercept) | 0.85 | 0.05 | 16.23 | 2.41 | 0.04 | 58.68 | 0.89 | 0.05 | 17.26 | ||||
| Males | Females | 0.11 | 0.05 | 2.09 | 0.037 | –0.03 | 0.04 | –0.69 | 0.488 | –0.11 | 0.05 | –2.19 | 0.030 |
| After S-birth* | Before† | 0.43 | 0.08 | 5.27 | <0.001 | –0.19 | 0.06 | –3.01 | 0.002 | 0.13 | 0.08 | 1.61 | 0.114 |
| Smooth term variables: | edf | Ref. df | F | p | edf | Ref. df | F | p | edf | Ref. df | F | p | |
| Time-S-birth: males | 2.65 | 3.17 | 1.17 | 0.262 | 1.00 | 1.00 | 0.53 | 0.469 | 1.00 | 1.00 | 3.76 | 0.054 | |
| Time-S-birth: females | 1.77 | 2.12 | 0.69 | 0.433 | 1.50 | 1.83 | 0.56 | 0.603 | 1.00 | 1.00 | 0.01 | 0.922 | |
| Time-S-birth: males | Females | 1.00 | 1.00 | 0.05 | 0.818 | 1.00 | 1.00 | 0.23 | 0.585 | 1.00 | 1.00 | 2.85 | 0.093 |
| Age: males | 1.00 | 1.00 | 3.22 | 0.074 | 3.19 | 3.74 | 4.25 | 0.002 | - | - | - | - | |
| Age: females | 1.00 | 1.00 | 1.37 | 0.243 | 1.00 | 1.00 | 0.03 | 0.874 | - | - | - | - | |
| Age: males | Females | 1.00 | 1.00 | 0.43 | 0.513 | 2.17 | 2.63 | 1.08 | 0.243 | - | - | - | - |
| Daytime | 1.20 | 1.37 | 29.27 | <0.001 | 1.00 | 1.00 | 4.82 | 0.029 | 2.10 | 2.56 | 1.77 | 0.142 | |
| Seasonal effect | 2.38 | 3.00 | 11.18 | <0.001 | 0.51 | 3.00 | 0.22 | 0.278 | 0.00 | 3.00 | 0.00 | 0.723 | |
| Random effects: | |||||||||||||
| Time-S-birth per ID (smooth) | 0.00 | 111.0 | 0 | 0.238 | 0.00 | 112.0 | 0 | 0.850 | 7 | 148.0 | 0 | 0.015 | |
| Age per ID (smooth) | 0.00 | 109.0 | 0 | 0.291 | 0.00 | 108.0 | 0 | 0.737 | - | - | - | - | |
| Mother ID (intercept) | 0.00 | 13.0 | 0 | 0.175 | 0.00 | 13.0 | 0 | 0.313 | 0 | 13.0 | 0 | 0.230 | |
| Year (intercept) | 0.00 | 1.0 | 0 | 0.012 | 0.00 | 1.0 | 0 | 0.277 | 0 | 1.0 | 0 | 0.850 | |
| R2adj (deviance explained) | 0.311 (33.8%) | 0.169 (19.6%) | 0.117 (15.3%) | ||||||||||
| N (p-value, full/null comp) | 319 (<0.001) | 314 (<0.001) | 319 (0.020) | ||||||||||
-
Green indicates classic interaction term derived from a separate model calculation (see ‘Methods’). Data points are physiological measures corrected for specific gravity (SG). All smooths are not controlled for age to show cumulative pattern.
-
ID = individual; T3 = total triiodothyronine; S-birth = sibling birth. .
-
*
After sibling birth.
-
†
Before sibling birth.
Table 3
Generalized additive mixed model (GAMM) results of behavioral changes (nipple contact, riding, and body contact and 5 m proximity with the mother) in the older offspring around sibling birth (±2 years).
Binomial GAMMs on proportions of time per day and individual.
| Reference | Nipple contact | Riding | Proximity | Body contact with mother | |||||||||||||
|---|---|---|---|---|---|---|---|---|---|---|---|---|---|---|---|---|---|
| Factor variables: | Category | Est. | SE | z | p | Est. | SE | z | p | Est. | SE | z | p | Est. | SE | z | p |
| (intercept) | –7.34 | 0.84 | –8.73 | –1.36 | 0.52 | –2.65 | 0.21 | 0.16 | 1.30 | –2.79 | 0.19 | –14.50 | |||||
| Males | Females | 0.76 | 0.61 | 1.24 | 0.21 | 1.18 | 0.36 | 3.22 | 0.001 | –0.08 | 0.13 | –0.66 | 0.51 | 0.22 | 0.11 | 2.05 | 0.040 |
| After YS-birth* | Before† | 1.39 | 0.88 | 1.55 | 0.12 | –2.00 | 0.55 | –3.64 | <0.001 | 0.02 | 0.10 | 0.18 | 0.85 | 0.47 | 0.11 | 4.17 | <0.001 |
| Year | - | - | - | - | - | - | - | - | - | - | - | - | - | - | - | - | |
| Smooth term Variables: | edf | Ref. df | Chi² | p | edf | Ref. df | Chi² | p | edf | Ref. df | Chi² | p | edf | Ref. df | Chi² | p | |
| T-S-birth: males | 4.45 | 4.95 | 12.38 | 0.002 | 1.00 | 1.00 | 0.03 | 0.86 | 1.00 | 1.00 | 6.91 | 0.009 | 1.00 | 1.00 | 12.48 | <0.001 | |
| T-S-birth: females | 3.72 | 4.19 | 12.38 | 0.017 | 1.00 | 1.00 | 5.24 | 0.022 | 3.28 | 3.37 | 8.03 | 0.032 | 1.00 | 1.00 | 28.70 | <0.001 | |
| T-S-birth: males | Females | 1.00 | 1.00 | 0.20 | 0.66 | 1.00 | 1.00 | 2.78 | 0.095 | 1.00 | 1.00 | 0.05 | 0.83 | 1.00 | 1.00 | 1.04 | 0.31 |
| Age: males | 1.00 | 1.00 | 0.55 | 0.46 | 1.00 | 1.00 | 19.89 | <0.001 | - | - | - | - | - | - | - | - | |
| Age: females | 1.00 | 1.00 | 0.12 | 0.71 | 1.00 | 1.00 | 4.39 | 0.036 | - | - | - | - | - | - | - | - | |
| Age: males | Females | 1.00 | 1.00 | 0.00 | 0.99 | 1.00 | 1.00 | 4.38 | 0.036 | - | - | - | - | - | - | - | - |
| Daytime | 3.64 | 3.92 | 14.31 | 0.012 | 3.51 | 3.85 | 7.46 | 0.09 | 3.81 | 3.98 | 170.67 | <0.001 | 3.96 | 4.00 | 456.4 | <0.001 | |
| Seasonal effect | 1.10 | 3.00 | 1.89 | 0.021 | 8.89 | 3.00 | 1.91 | 0.063 | 0.00 | 3.00 | 0.00 | 0.05 | 2.64 | 3.00 | 61.22 | <0.001 | |
| Random effects: | |||||||||||||||||
| Time-S-birth per ID (smooth) | 3.13 | 113.00 | 82.07 | <0.001 | 33.32 | 70.00 | 251.9 | <0.001 | 62.11 | 76.00 | 1323.3 | <0.001 | 58 | 76.0 | 1569 | <0.001 | |
| Age per ID (smooth) | 8.05 | 94.00 | 34.07 | <0.001 | 0.00 | 61.00 | 0.00 | 0.010 | - | - | - | - | - | - | - | - | |
| Mother ID (intercept) | 2.45 | 10.00 | 0.00 | <0.001 | 0.00 | 10.00 | 0.00 | 0.001 | 6.28 | 12.00 | 0.00 | <0.001 | 0.01 | 12.0 | 0.01 | <0.001 | |
| Date (intercept) | 3.65 | 1.00 | 0.00 | 0.23 | 0.00 | 1.00 | 0.00 | 0.28 | 0.00 | 1.00 | 0.00 | <0.001 | 0.00 | 1.00 | 0.00 | <0.001 | |
| R2adj (deviance explained) | 0.39 (62.4%) | 0.827 (81.7%) | 0.226 (29.3%) | 0.319 (39.7%) | |||||||||||||
| N (p-value, full/null comp) | 545 (<0.001) | 301 (<0.001) | 545 (<0.001) | 545 (<0.001) | |||||||||||||
-
Green: classic interaction term derived from a separate model calculation (see ‘Methods’). Statistics for year (categorical control variable) not shown for clarity.
-
ID: individual; S-birth = sibling birth; ‘:’ = interaction term.
-
*
After sibling birth.
-
†
Before sibling birth.
Additional files
-
Supplementary file 1
General additive mixed model results for physiological changes (urinary cortisol and urinary neopterin, levels; all log-transformed) in the older offspring 7 years before and after sibling birth.
Green: classic interaction term derived from a separate model calculation (see ‘Methods’). ID = individual; S-birth = sibling birth; * before = before sibling birth; * early after = 7 and 4.5 months following sibling birth for cortisol and neopterin, respectively; * late after = time following early after. Data points are physiological measures corrected for specific gravity (SG). All smooths are not controlled for age to show cumulative pattern.
- https://cdn.elifesciences.org/articles/77227/elife-77227-supp1-v2.docx
-
Supplementary file 2
Number of individuals and samples/data points (in brackets) for each physiological marker or behavior shown for each sex in relation to sibling birth.
sib birth = sibling birth; total T3 = total triiodothyronine.
- https://cdn.elifesciences.org/articles/77227/elife-77227-supp2-v2.docx
-
Transparent reporting form
- https://cdn.elifesciences.org/articles/77227/elife-77227-transrepform1-v2.pdf
Download links
A two-part list of links to download the article, or parts of the article, in various formats.
Downloads (link to download the article as PDF)
Open citations (links to open the citations from this article in various online reference manager services)
Cite this article (links to download the citations from this article in formats compatible with various reference manager tools)
Transition to siblinghood causes a substantial and long-lasting increase in urinary cortisol levels in wild bonobos
eLife 11:e77227.
https://doi.org/10.7554/eLife.77227


