Pinpointing the tumor-specific T cells via TCR clusters
- Center of Life Sciences, Skolkovo Institute of Science and Technology, Russian Federation
- Genomics of Adaptive Immunity Department, Shemyakin and Ovchinnikov Institute of Bioorganic Chemistry, Russian Federation
- Department of Molecular Biology, Moscow State University, Russian Federation
- Pirogov Russian National Research Medical University, Russian Federation
- Laboratory of Genomics of Antitumor Adaptive Immunity, Privolzhsky Research Medical University, Russian Federation
- Oncodermatology Department, NN Blokhin Russian Cancer Research Center, Russian Federation
Figures
Figure 1
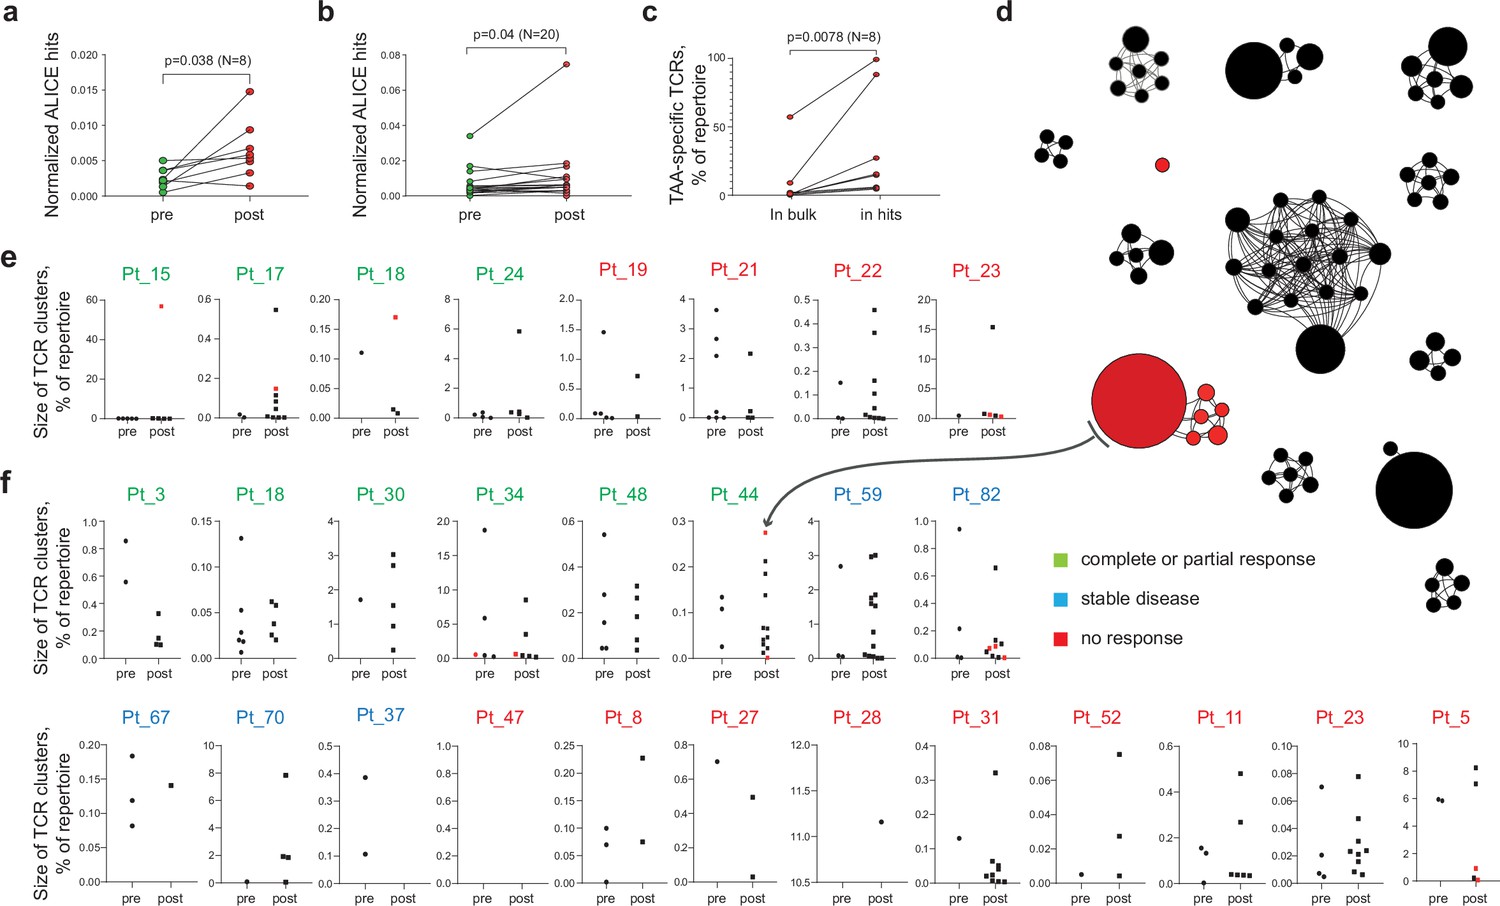
Melanoma tumor-infiltrating lymphocyte (TIL) T cell receptor (TCR) clusters before and after immunotherapy.
(a, b) Normalized counts of cluster-related TCRβ clonotypes from metastatic melanoma samples before and after anti-PD-1 therapy from datasets published in (a) (Riaz et al., 2017) and (b) (Tumeh et al., 2014). (c) Cumulative frequency of VDJdb-matched tumor-associated antigen (TAA)-specific clonotypes within the whole repertoire (in bulk) and within cluster-related clonotypes (ALICE hits) of patients that have at least one VDJdb-matched cluster (N = 8 patients) from the two published datasets. (d) TCRβ clusters from patient pt44 (Riaz et al., 2017). Each dot represents individual TCRβ clonotype. Dot size is proportional to the clonotype frequency in the bulk TCRβ repertoire. VDJdb-matched TAA-specific clonotypes are colored in red. (e, f) TCRβ clusters before and after therapy for each patient from (e) (Riaz et al., 2017) and (f) (Tumeh et al., 2014). One dot corresponds to one cluster. Y axis shows the size of corresponding clusters (e.g. cumulative frequency of clonotypes within a cluster, % of the whole repertoire). VDJdb-matched TAA-specific clusters are colored in red. N = number of biological replicates in each group. Data in (a) were analyzed with paired t-test; b, c were analyzed with the Wilcoxon test.
Figure 2 with 2 supplements
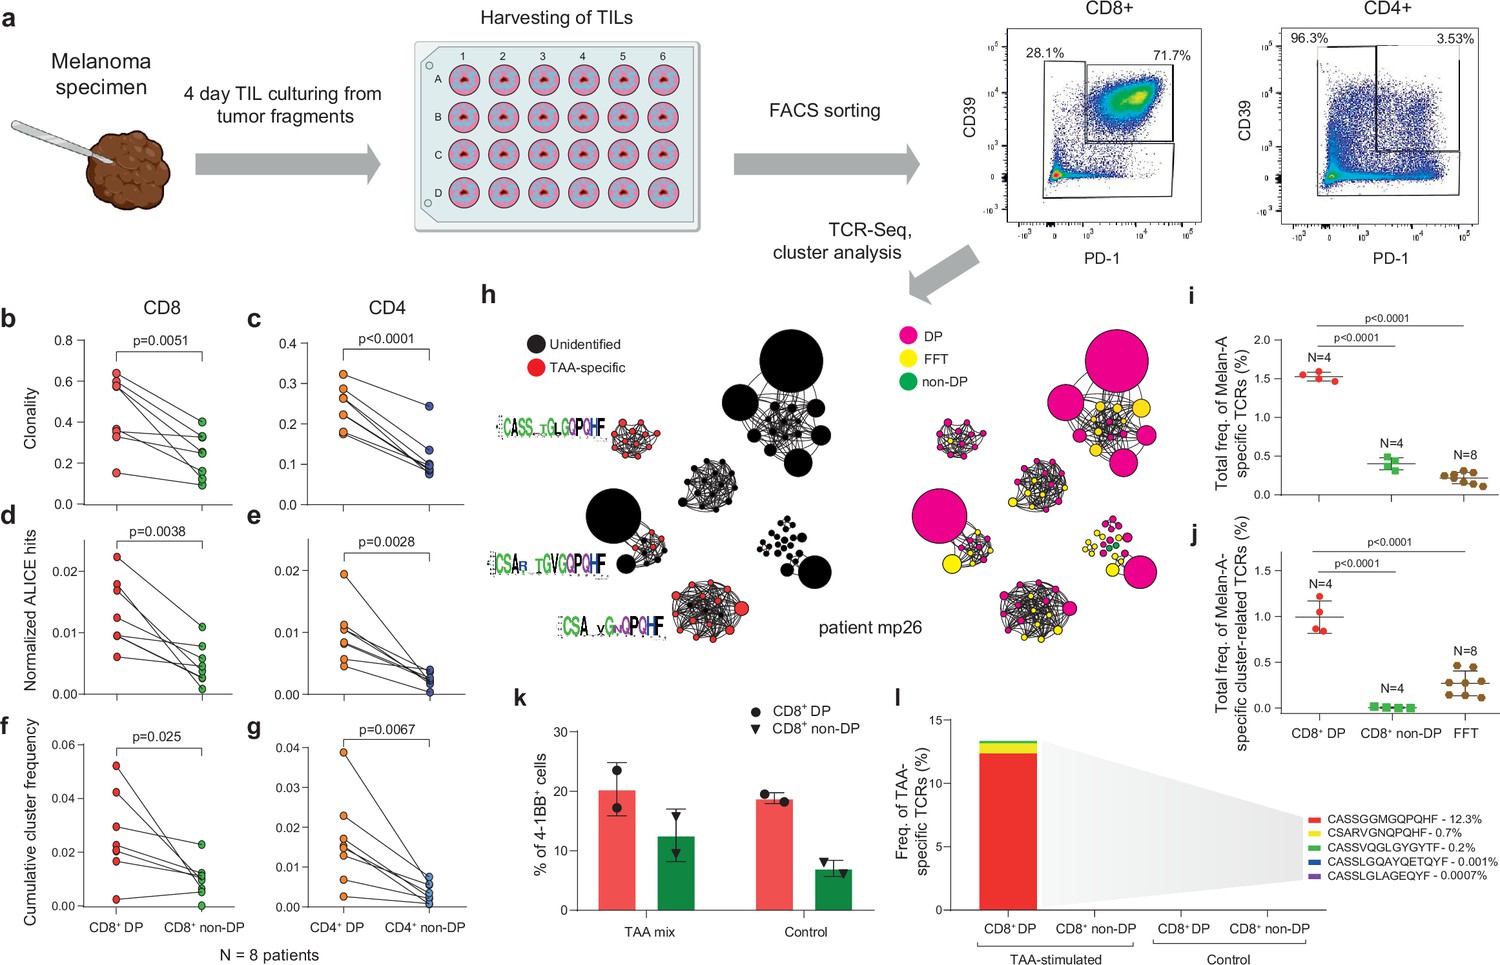
T cell receptor (TCR) clusters in CD39+PD1+ tumor-infiltrating lymphocytes (TILs).
(a) The experimental workflow. (b–g) TCRβ repertoire analysis for CD8+ (b, d, f) and CD4+ (c, e, g) double-positive (DP) and non-DP TIL subsets sorted from metastatic lymph nodes of eight melanoma patients. Panels show repertoire clonality calculated as [1 − Normalized Shannon-Wiener index] (b, c), normalized counts (d, e), and cumulative frequency of cluster-related clonotypes, that is, total weight of all clusters as a proportion of TCRβ repertoire (f, g). Paired t-test. (h) TCRβ clusters identified in repertoires obtained from fresh-frozen tumor (FFT) samples, and sorted CD8+ DP and non-DP TILs for HLA-A*02 patient mp26. VDJdb-matched TAA-specific clusters are colored in red. ( i, j) Cumulative frequency of (i) VDJdb-matched TAA-specific clonotypes and (j) VDJdb-matched TAA-specific cluster-related clonotypes within CD8+ DP, CD8+ non-DP, and FFT TCRβ repertoires of patient mp26. One-way ANOVA, Bonferroni multiple comparisons correction. (k, l) Proportion of CD137+ cells among CD8+ T cells (k) and proportion of VDJdb-matched TAA-specific clonotypes in sorted CD137+CD8+ T cells (l) in DP and non-DP TILs from patient mp26 that were cultured and re-stimulated with TAA-loaded or control dendritic cells.
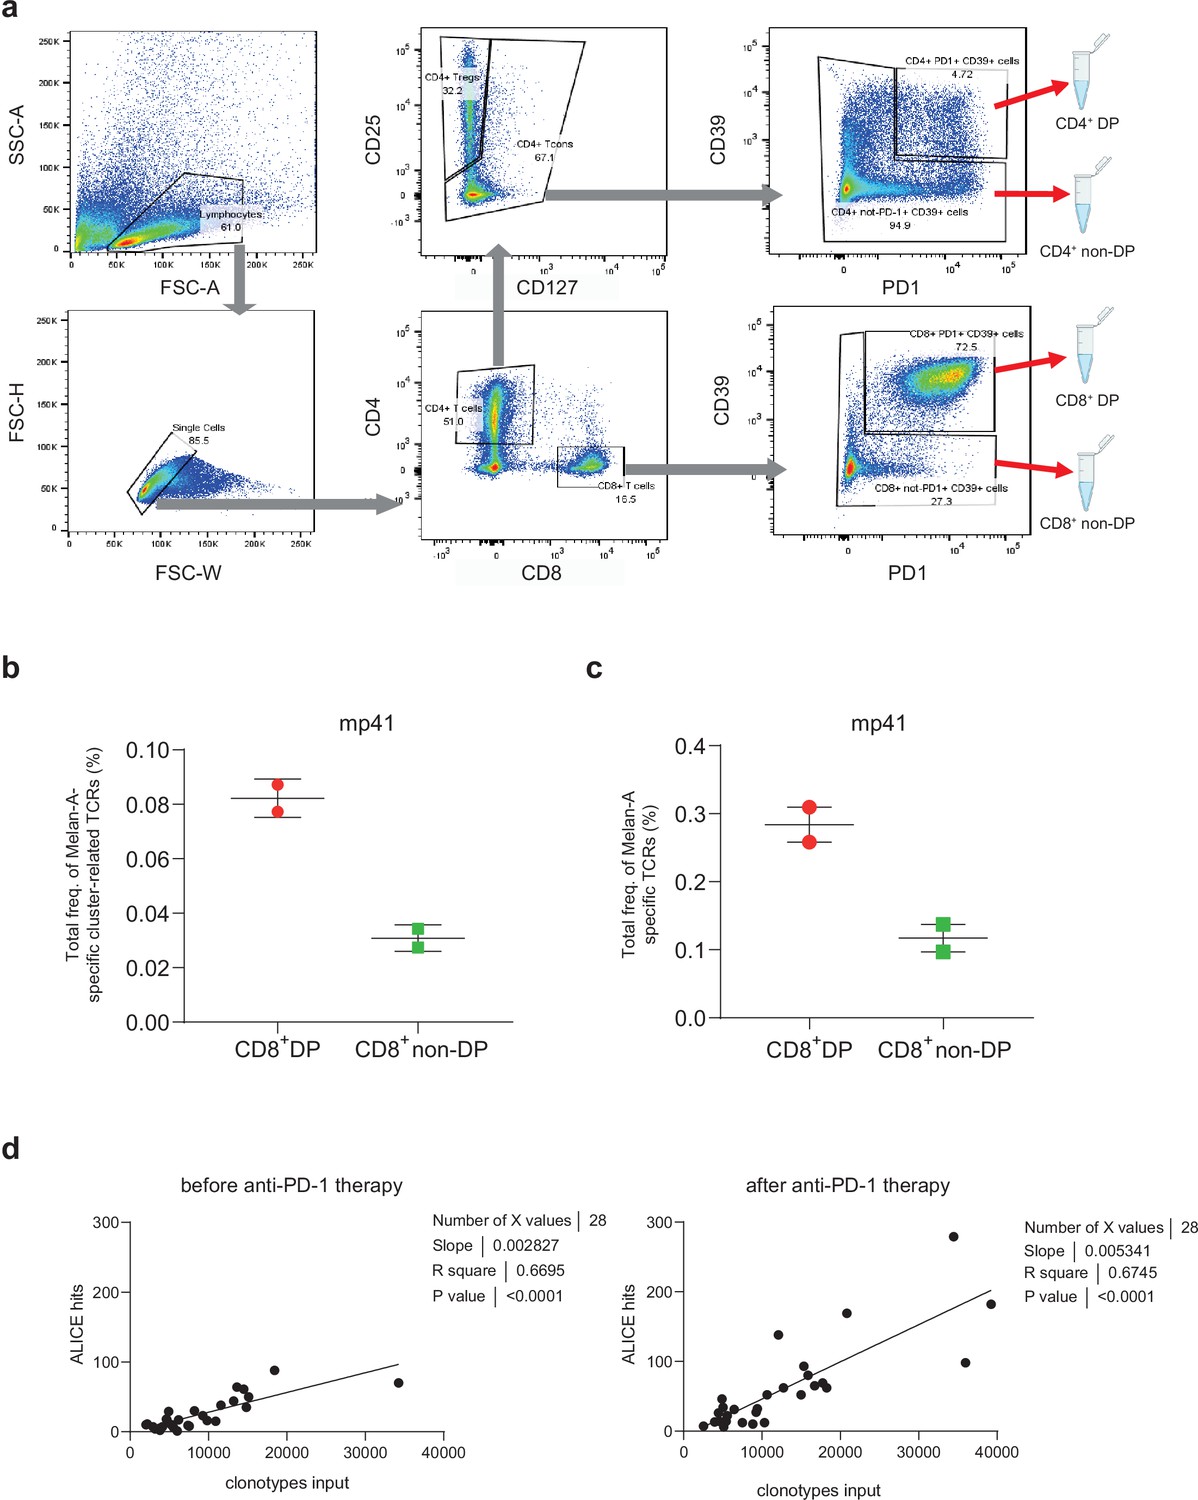
Figure 2—figure supplement 1
(a) Fluorescence-activated cell sorting (FACS) gating for sorting of CD8+ and CD4+ CD39+PD-1+ double-positive (DP) and non-DP T cells from briefly cultured melanoma tumor-infiltrating lymphocytes (TILs) and single-cell suspensions prepared from tumor samples (b,c).
Cumulative frequency of cluster-related Melan-A-specific T cell receptors (TCRs) (b) and all Melan-A-specific TCRs (c) in CD8+ DP and CD8+ non-DP TIL repertoires from patient mp41. (d) Number of ALICE hits significantly correlates with the number of input clonotypes. TCR repertoires of melanoma TILs before and after anti-PD-1 immunotherapy were used for the analysis (public datasets from Riaz et al., 2017; Tumeh et al., 2014).
Figure 2—figure supplement 2
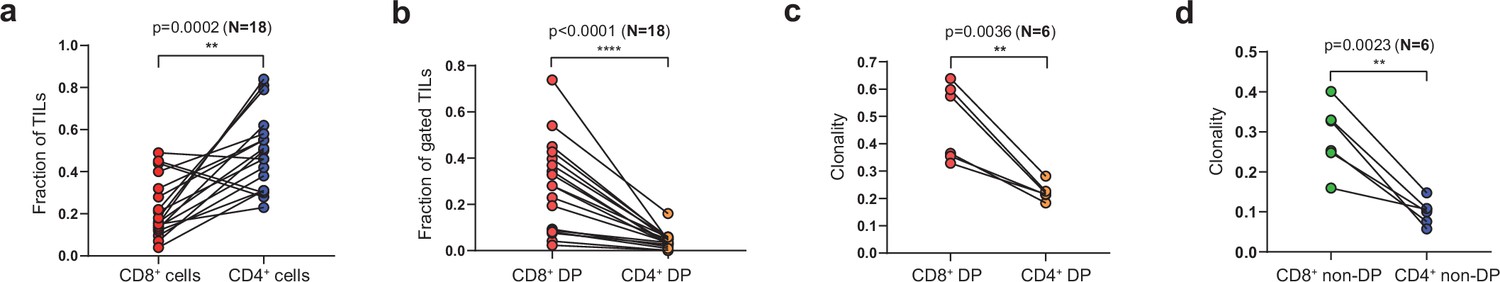
Characteristics of sorted tumor-infiltrating lymphocytes (TILs).
(a) Fraction of CD8+ and CD4+ cells out of all tumor-infiltrating CD3+T cells. (b) Fraction of CD39+PD-1+ cells consisting of CD8+ and CD4+ TILs. (c, d) Clonality (calculated as [1 − Normalized Shannon-Wiener index]) of CD8+ and CD4+ (c) doube-positive (DP) and (d) non-DP TILs. N = number of tested patients. Data analyzed by paired t-test.
Figure 3 with 1 supplement

Influence of culture conditions on tumor-infiltrating lymphocytes (TILs) and T cell receptor (TCR) clusters.
(a) Combined TCRβ clusters for fresh-frozen tumor (FFT), CD8+ double-positive (DP), CD8+ non-DP, and TILs cultured in four different conditions from metastatic tumor sample of patient mp26. Left: colors indicate VDJdb-defined clonotype specificities. Right: colors indicate the sample of origin. (b–e) TCRβ repertoire analysis for patient mp26 TILs cultured in four distinct conditions. Panels show (b) normalized counts of cluster-related TCRβ clonotypes, (c) proportion of the repertoire occupied by Melan-A-specific TCRβ clusters, (d) count and subset matching of clonotypes preferentially expanded compared to the IL-2high condition, and (e) the count of CD8+ DP matched clonotypes among the top 1500 clonotypes. N = number of separate tumor fragments. (f) Fraction of regulatory T cells (Tregs) (CD25+CD127-FoxP3+) among CD4+ T cells in cultured TILs from patient mp41 in each culture condition. (g) TIL counts relative to IL-2high culture conditions; n = 4 patients. (h) CD8+/CD4+ ratio for TILs from patient mp41 in each culture condition. Data in b ,c, f, g were analyzed with one-way ANOVA, Bonferroni multiple comparisons correction, with each condition compared to the IL-21/IL-2low/anti-PD-1 condition. Data in the panel (e) was analyzed with Kruskal-Wallis test, Dunn’s multiple comparison test, with each group compared to IL-21/IL-2low/anti-PD-1.
Figure 3—figure supplement 1
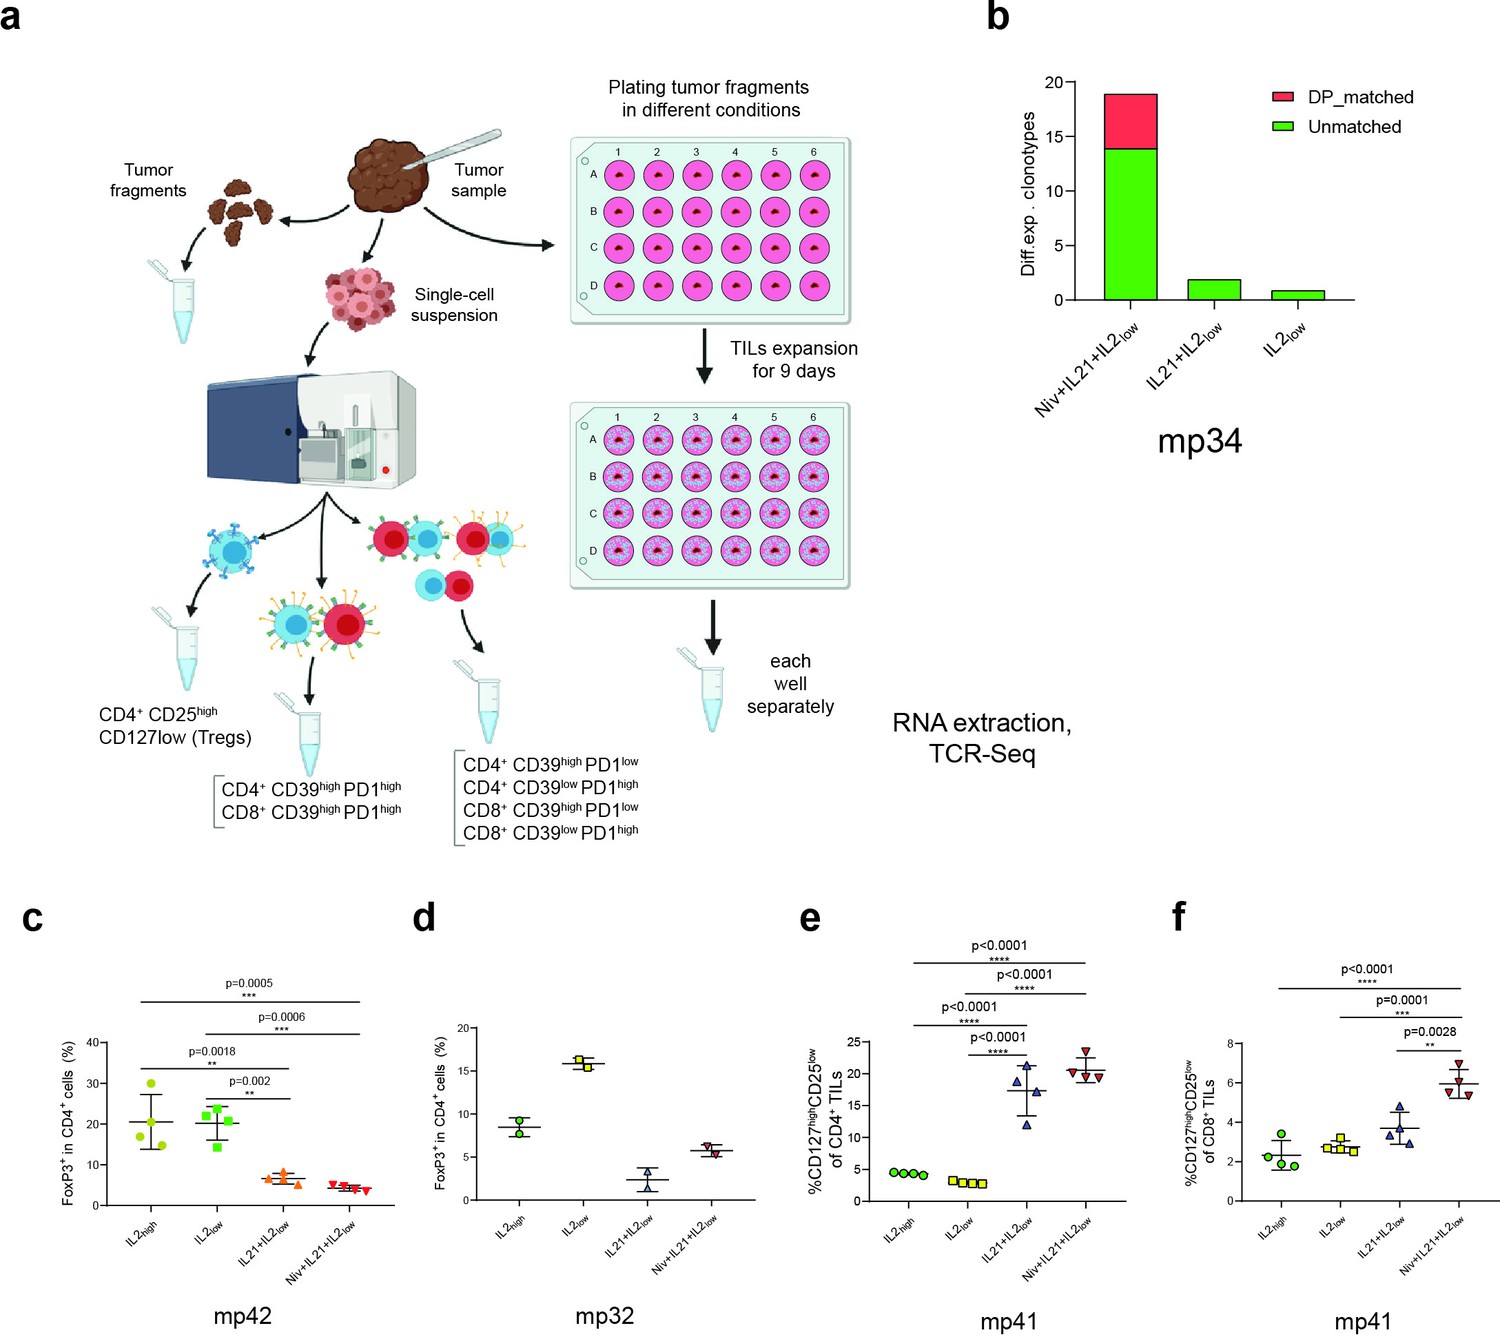
Expansion of tumor-infiltrating lymphocyte (TIL) subtypes in different cultivation conditions.
(a) Experimental pipeline for evaluating CD39+PD-1+ T cell clonotypes expansion from bulk melanoma TILs cultivated in different conditions. (b) Number of T cell receptor (TCR) clonotypes preferentially expanded in bulk TILs of patient mp34 under various culture conditions compared to classical IL-2high conditions. (c, d) Fraction of regulatory T cells (Tregs) (gated as CD4+CD25+CD127-FoxP3+) among CD4+ T cells of patients (c) mp42 and (d) mp32. (e, f) Proportion of CD127highCD25low cells among (e) CD4+ and (f) CD8+ TIL subsets from patient mp41. Data in c, e, f analyzed by one-way ANOVA, Bonferroni’s multiple comparisons test.
Author response image 1
Author response image 2
Author response image 3
Author response image 4
Tables
Key resources table
| Reagent type (species) or resource | Designation | Source or reference | Identifiers | Additional information |
|---|---|---|---|---|
| Other | Human AB serum | PanBiotech, Germany | P30-2901 | Cell culture medium component |
| Peptide, recombinant protein | IL-2 (Ronkoleukine)1,000,000 IU/mL | BiotechSpb, Russia | – | 100–3000 IU/mL |
| Other | RPMI-1640 | PanEco, Russia | C310 | Cell culture medium |
| Chemical compound, drug | HEPES, pH 7.2, 1 M | PanEco, Russia | Ф134 | 25 µM/mL |
| Chemical compound, drug | Penicillin/streptomycin | Gibco, USA, Waltham, Massachusetts | 10378016 | 1:100 |
| Chemical compound, drug | Gentamicin | Gibco, USA, Waltham, Massachusetts | 15750–037 | 1:5000 |
| Other | Non-essential amino acids mix | Gibco, USA, Waltham, Massachusetts | 11140–035 | 1:100 |
| Other | GlutaMAX | Gibco, USA, Waltham, Massachusetts | 35050–061 | 1:100 |
| Chemical compound, drug | β-Mercaptoethanol | Gibco, USA, Waltham, Massachusetts | 31350010 | 1:1000 |
| Chemical compound, drug | Sodium pyruvate | Gibco, USA, Waltham, Massachusetts | 11360–070 | 1:100 |
| Other | RLT cell lysis buffer | Qiagen, The Netherlands | 160046763 | Sample:RLT ratio >1 : 3.5 |
| Peptide, recombinant protein | IL-21 | SCI-STORE, Russia | PSG260-10 | 50 ng/mL |
| Antibody | Nivolumab(Opdivo 10 mg/mL) | Bristol-Myers Squibb, USA, New York City, New York | NDC 00003-3772-11 | 1:500 |
| Commercial assay or kit | Anti-CD3/CD28 Dynabeads | Thermo Fisher Scientific, USA | 11131D | |
| Other | Ficoll-Paque Plus | GE Healthcare, USA, Chicago, Illinois | GE17-1440-03 | For PBMC isolation |
| Other | SepMate-50 tubes | StemCell Technologies, Canada | 86450 | For PBMC isolation |
| Commercial assay or kit | Anti-CD14 MicroBeads | Miltenyi Biotec, Germany | 130-050-201 | |
| Other | X-Vivo-15 medium | Lonza, Switzerland | BE02-060F | Cell culture medium for dendritic cells |
| Peptide, recombinant protein | IL-4 | PeproTech, Germany | 200–04 | 400 IU/mL |
| Peptide, recombinant protein | GM-CSF | PeproTech, Germany | 300–03 | 800 IU/mL |
| Peptide, recombinant protein | PepTivator Melan-A/MART-1 | Miltenyi Biotec, Germany | 130-094-597 | 1:100 |
| Peptide, recombinant protein | PepTivator gp100/Pmel | Miltenyi Biotec, Germany | 130-094-449 | 1:100 |
| Peptide, recombinant protein | PepTivator MAGE-A3 | Miltenyi Biotec, Germany | 130-095-384 | 1:100 |
| Chemical compound, drug | Prostaglandin E2 | Sigma-Aldrich, USA, St. Louis, Missouri | P0409 | 1 µg/mL |
| Peptide, recombinant protein | IL-1β | PeproTech, Germany | 200-01B | 10 ng/mL |
| Peptide, recombinant protein | TNF-α | PeproTech, Germany | 300–01A | 25 ng/mL |
| Other | AIM-V serum-free medium | Gibco, USA, Waltham, Massachusetts | 12055–091 | Serum-free cell culture medium |
| Antibody | Mouse monoclonal CD4-BV510 (RPA-T4) | BioLegend, Germany | cat 300546 | FACS, flow cytometry, 5 µL/test |
| Antibody | Mouse monoclonal CD8-Alexa-647 (SK1) | BioLegend, Germany | cat 344726 | FACS, flow cytometry, 5 µL/test |
| Antibody | Mouse monoclonal CD127-APC-Cy7 (IL-7Rα, A019D5) | BioLegend, Germany | 351348 | FACS, flow cytometry, 5 µL/test |
| Antibody | Mouse monoclonal CD25-PE (IL-2Rα) | Beckman Coulter, USA, Brea, California | A07774 | FACS, flow cytometry, 10 µL/test |
| Antibody | Mouse monoclonal CD39-FITC (eBioA1) | eBioscience, USA, Santa Clara, California | 11-0399-42 | FACS, flow cytometry, 5 µL/test |
| Antibody | Mouse monoclonal CD137-PE (4B4-1) | BioLegend, Germany | 309804 | FACS, flow cytometry, 5 µL/test |
| Antibody | Mouse monoclonal СD25-APC (BC96) | BioLegend, Germany | 302610 | FACS, flow cytometry, 5 µL/test |
| Antibody | Mouse monoclonalPD-1-BV421 (CD279, EH12.2H7) | BioLegend, Germany | 329920 | FACS, flow cytometry, 5 µL/test |
| Antibody | Mouse monoclonal CD127-Alexa488 (A019D5) | BioLegend, Germany | 351314 | FACS, flow cytometry, 5 µL/test |
| Antibody | Mouse monoclonal CD8-BV421 (SK1) | BioLegend, Germany | 344748 | FACS, flow cytometry, 5 µL/test |
| Antibody | Mouse monoclonal anti-FoxP3-PE (236 A/E7) | BD Biosciences, USA, Franklin Lakes, New Jersey | 560852 | Flow cytometry, 5 µL/test |
| Commercial assay or kit | TRIzol reagent | Invitrogen, USA, Carlsbad, California | 15596026 | |
| Commercial assay or kit | RNeasy mini kit | Qiagen, The Netherlands | 74104 | |
| Commercial assay or kit | Qubit RNA HS Assay Kit | Thermo Fisher Scientific, USA, Waltham, Massachusetts | Q32855 | |
| Commercial assay or kit | Human RNA TCR Multiplex kit | MiLaboratories Inc, USA, Sunnyvale, California | – |
Additional files
-
Supplementary file 1
Patients and clinical characteristics.
- https://cdn.elifesciences.org/articles/77274/elife-77274-supp1-v3.docx
-
MDAR checklist
- https://cdn.elifesciences.org/articles/77274/elife-77274-mdarchecklist1-v3.pdf
Download links
A two-part list of links to download the article, or parts of the article, in various formats.
Downloads (link to download the article as PDF)
Open citations (links to open the citations from this article in various online reference manager services)
Cite this article (links to download the citations from this article in formats compatible with various reference manager tools)
Pinpointing the tumor-specific T cells via TCR clusters
eLife 11:e77274.
https://doi.org/10.7554/eLife.77274


