Transcriptome-wide association study and eQTL colocalization identify potentially causal genes responsible for human bone mineral density GWAS associations
- Center for Public Health Genomics, School of Medicine, University of Virginia, United States
- Department of Biochemistry and Molecular Genetics, School of Medicine, University of Virginia, United States
- Department of Radiation Oncology, University of Virginia, United States
- Department of Microbiology, Immunology, and Cancer Biology, School of Medicine, University of Virginia, United States
- Department of Orthopedics, Anschutz Medical Campus, University of Colorado, United States
- Department of Public Health Sciences, School of Medicine, University of Virginia, United States
- Department of Mechanical Engineering, Boston University, United States
- Department of Mechanical Engineering, University of Colorado Boulder, United States
- Department of Orthopaedic Surgery, Boston University Medical Center, United States
Figures
Figure 1 with 1 supplement
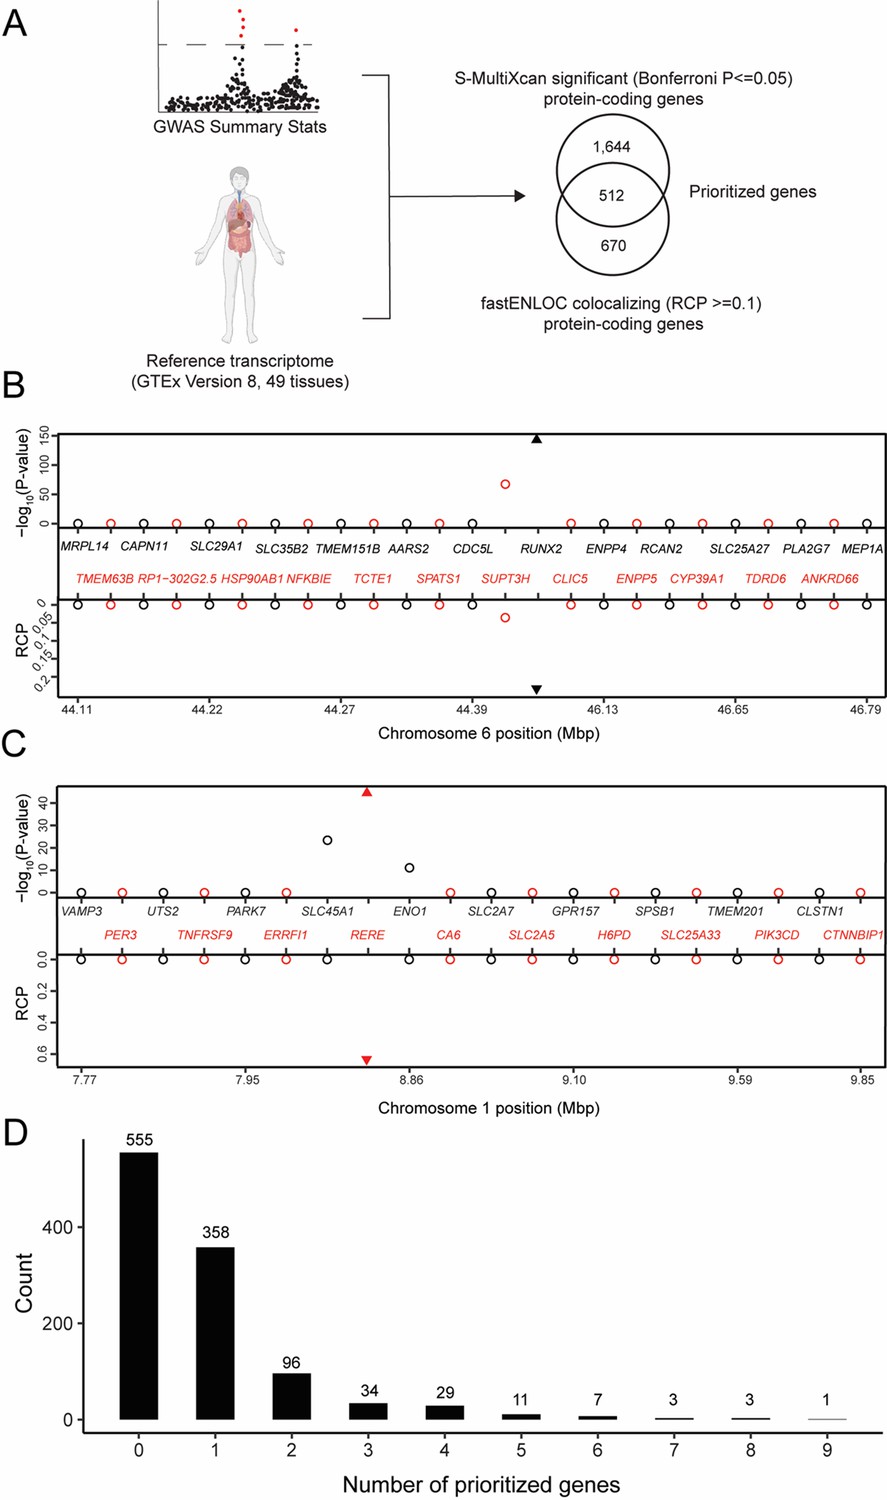
Transcriptome-wide association study (TWAS) and expression quantitative trait loci (eQTL) colocalization identify potentially causal bone mineral density (BMD) genome-wide association study (GWAS) genes.
(A) Overview of the analysis. The human image was obtained from BioRender.com. TWAS/colocalization plot for genes in the locus around RUNX2 (B) and RERE (C). The −log10 Bonferroni-adjusted p values from the TWAS analysis (top panel) and the maximum regional colocalization probabilities (RCPs) from the colocalization analyses (bottom panel). Genes alternate in color for visual clarity. Triangles represent RUNX2 (B) and RERE (C). (D) Distribution of prioritized genes within estimated BMD (eBMD) GWAS loci.
Figure 1—figure supplement 1
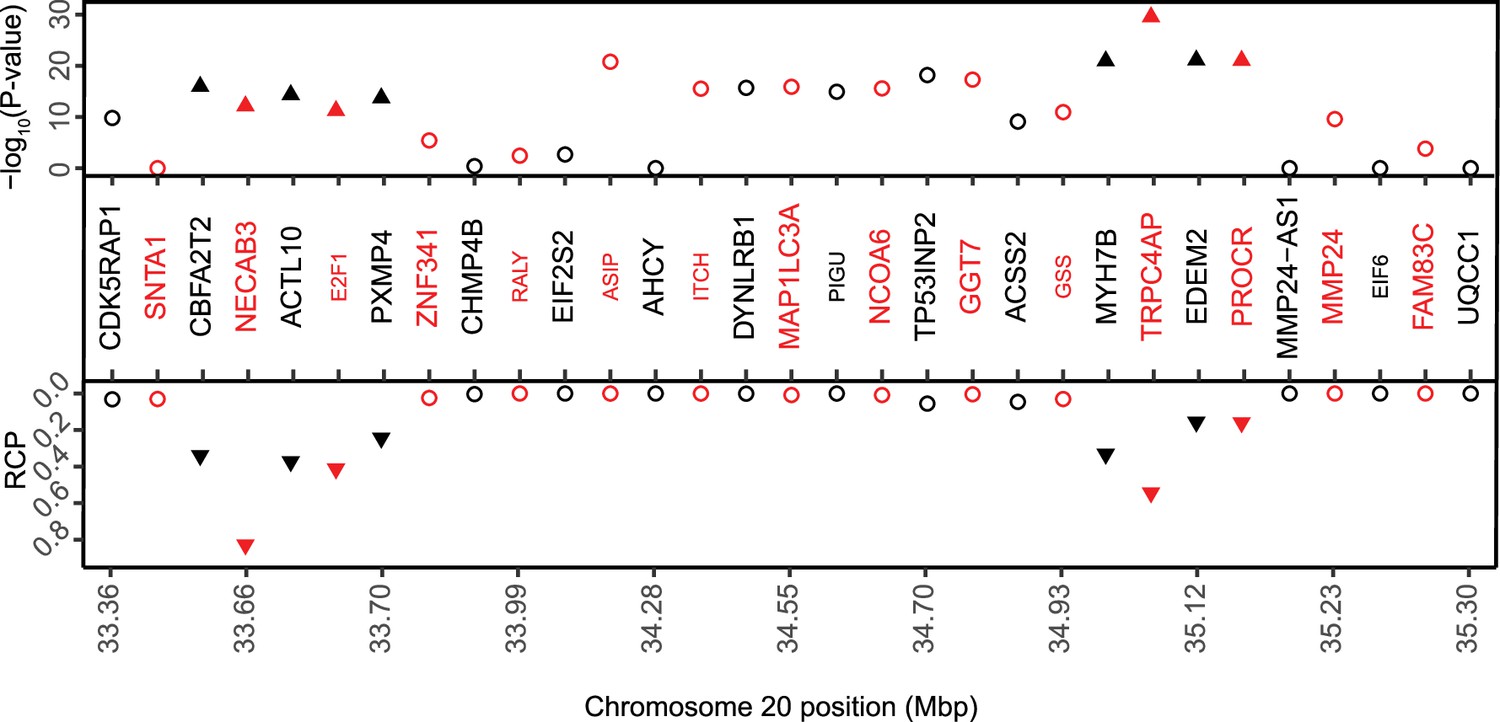
Chromosome 20 contains a locus with nine prioritzed genes.
Transcriptome-wide association study (TWAS)/colocalization plot for genes in the chromosome 20 locus (lead (single nucleotide polymorphism)SNP rs6142137). The −log10 Bonferroni-adjusted p values from the TWAS analysis (top panel) and the maximum regional colocalization probabilities (RCPs) from the colocalization analyses (bottom panel) are shown. Genes alternate in color for visual clarity. Traingles represent the nine prioritized genes in the locus.
Figure 2 with 1 supplement
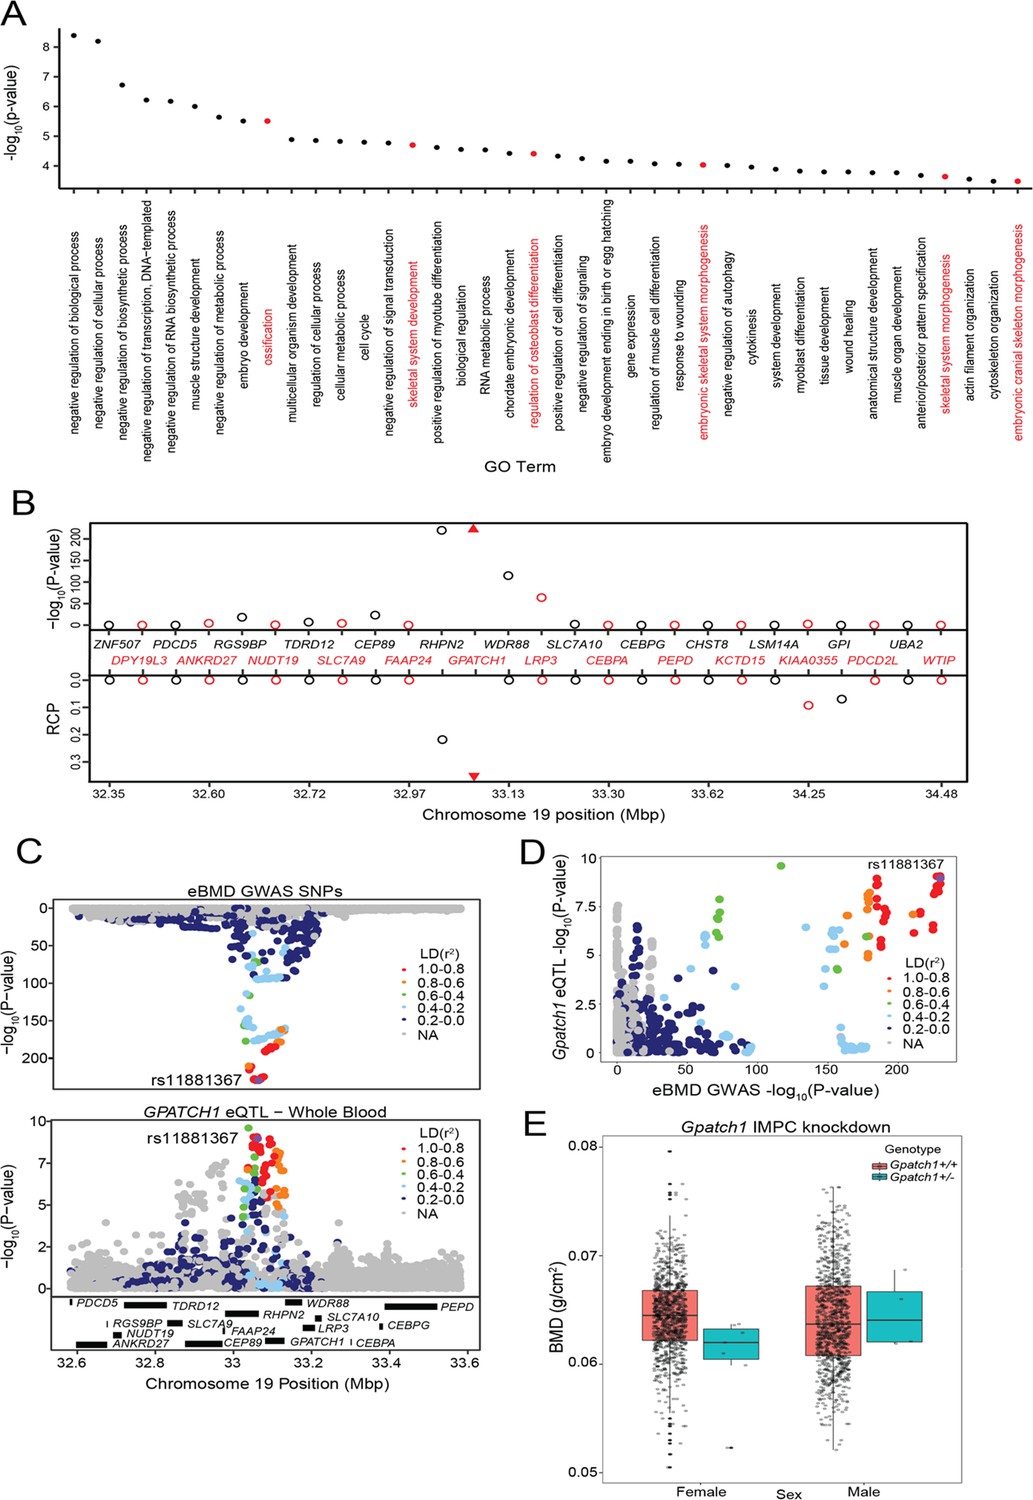
Transcriptome-wide association study (TWAS) and expression quantitative trait loci (eQTL) colocalization identify Gpatch1 a potentially causal bone mineral density (BMD) genome-wide association study (GWAS) gene.
(A) The top 40 terms from a Gene Ontology analysis of the 512 potentially causal BMD genes identified by our analysis. Terms with clear relevance to bone are highlighted in red. Only terms from the ‘Biological Process’ (BP) subontology are listed, and similar terms were removed for clarity. (B) TWAS/colocalization plot for genes in the locus around GPATCH1 (±1.5 Mbp). The −log10 Bonferroni-adjusted p values from the TWAS analysis (top panel) and the maximum regional colocalization probabilities (RCPs) from the colocalization analyses (bottom panel). Genes alternate in color for visual clarity. Triangles represent GPATCH1. (C) Mirrorplot showing estimated BMD (eBMD) GWAS locus (top panel) and colocalizing GPATCH1 eQTL in whole blood (bottom panel). SNPs are colored by their linkage disequilibrium (LD) with rs11881367 (purple), the most significant GWAS SNP in the locus. (D) Scatterplot of −log10 p values for GPATCH1 eQTL versus eBMD GWAS SNPs. SNPs are colored by their LD with rs11881367 (purple). (E) BMD in Gpatch1 knockdown mice. N = 7 females and N = 4 males for Gpatch1+/− mice, N = 880 females and N = 906 males for Gpatch1+/+ mice. Boxplots indicate the median (middle line), the 25th and 75th percentiles (box) and the whiskers extend to 1.5 * IQR.
Figure 2—figure supplement 1
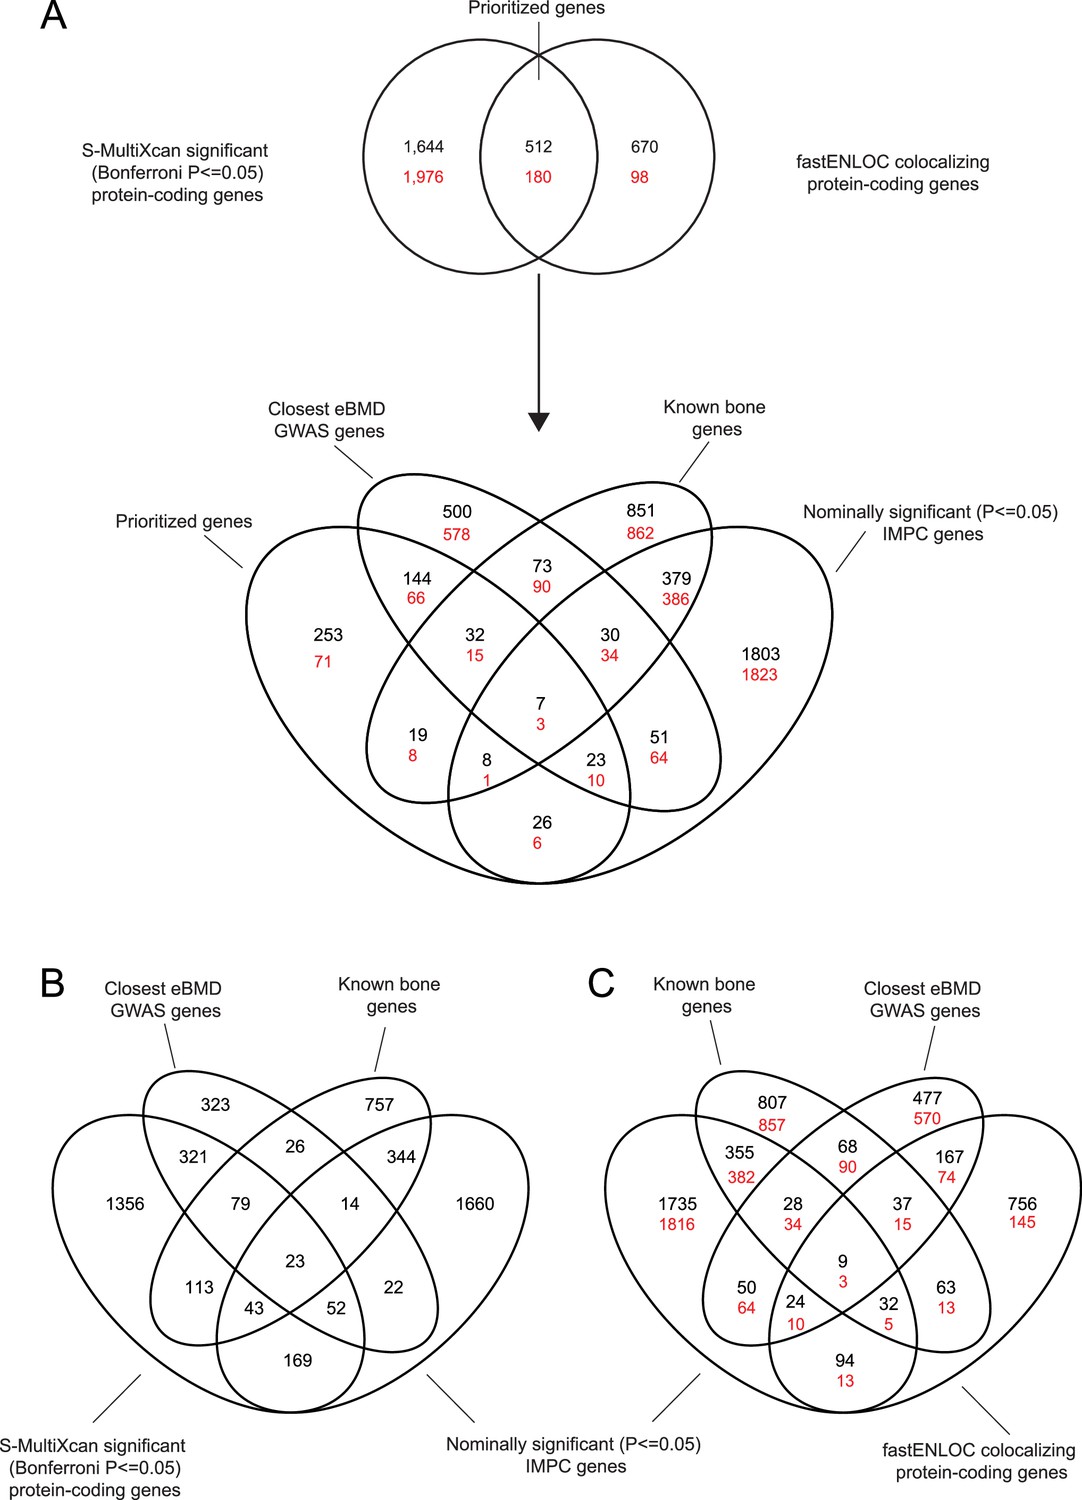
Schematic of prioritization pipeline.
(A) Venn diagram showing the overlaps in data in the general gene prioritization pipeline. Overlapping transcriptome-wide association study (TWAS)/colocalization genes are termed ‘prioritized genes’. (B) Venn diagram showing overlap between the significant (p ≤ 0.05) S-MultiXcan TWAS genes and the prioritization datasets. (C) Venn diagram showing overlap between the fastENLOC colocalizing genes and the prioritization datasets.For all data, the black values indicate values obtained when a fastENLOC colocalization threshold of 0.1 is used, while the red values are those that are obtained when a fasENLOC colocalization threshold of 0.5 is used.
Figure 3
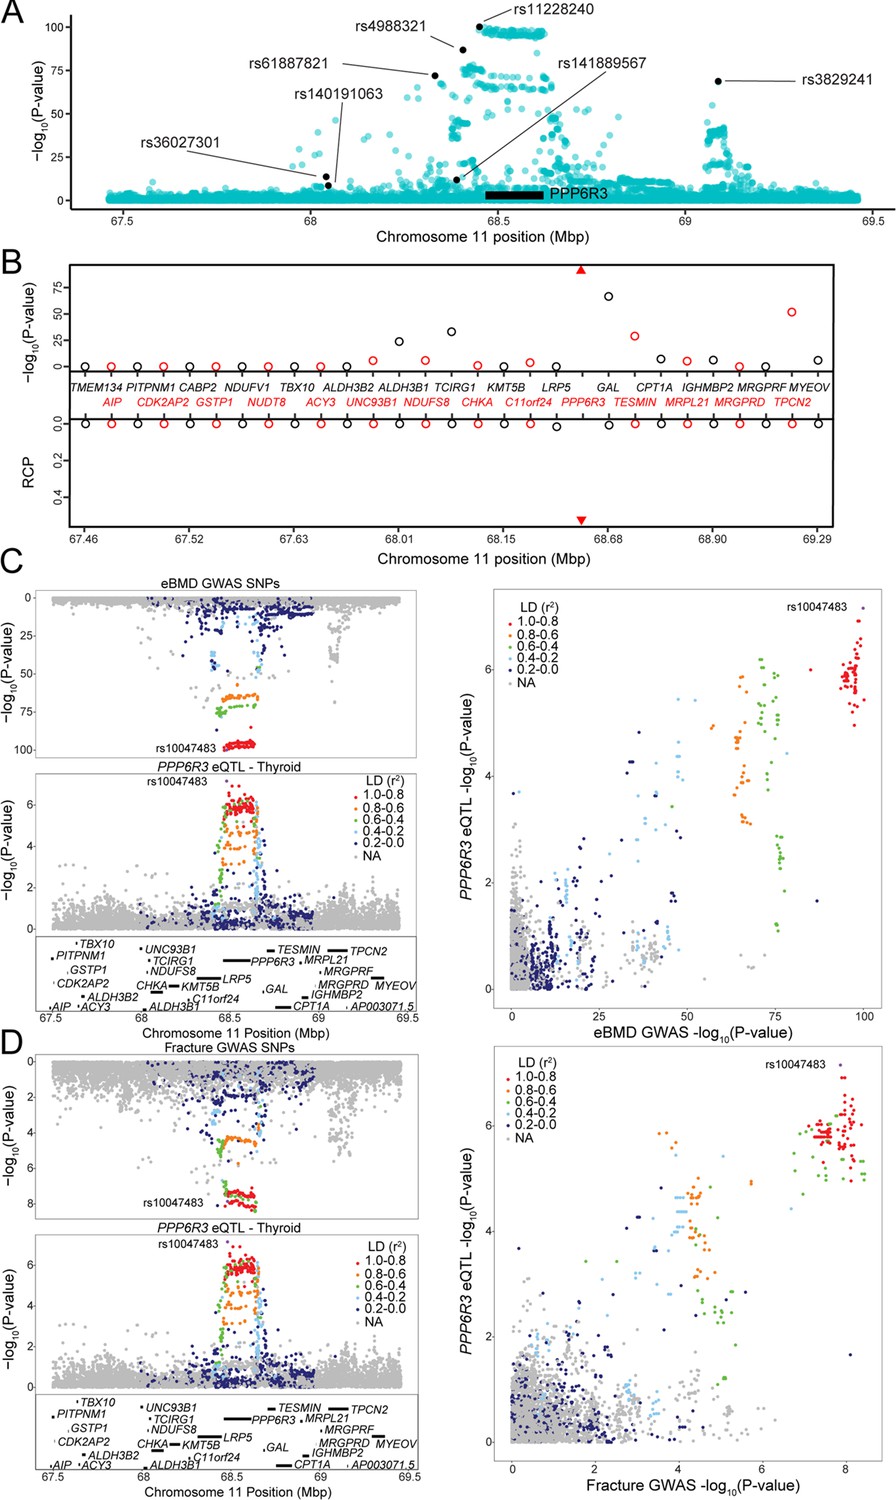
PPP6R3 is a top 10 novel estimated bone mineral density (eBMD) gene.
(A) eBMD genome-wide association study (GWAS) SNPs around the PPP6R3 locus (±1 Mbp). The y-axis represents −log10 eBMD GWAS p values. Highlighted SNPs (black) are the seven lead eBMD GWAS SNPs in the locus. (B) Transcriptome-wide association study (TWAS)/colocalization plot for genes in the locus around PPP6R3 (±1 Mbp). The −log10 Bonferroni-adjusted p values from the TWAS analysis (top panel) and the maximum regional colocalization probabilities (RCPs) from the colocalization analyses (bottom panel). Genes alternate in color for visual clarity. Triangles represent PPP6R3. Mirrorplot of the eBMD locus (C) and PPP6R3 expression quantitative trait loci (eQTL) in thyroid, and fracture locus and PPP6R3 eQTL in thyroid (D). The panels on the right are scatterplots of −log10 p values for PPP6R3 eQTL and eBMD GWAS SNPs (C) and the PPP6R3 eQTL and fracture GWAS SNPs (D). SNPs are colored by their linkage disequilibrium (LD) with rs10047483 (purple), the most significant PPP6R3 eQTL in the locus. Not all genes are shown.
Figure 4 with 6 supplements
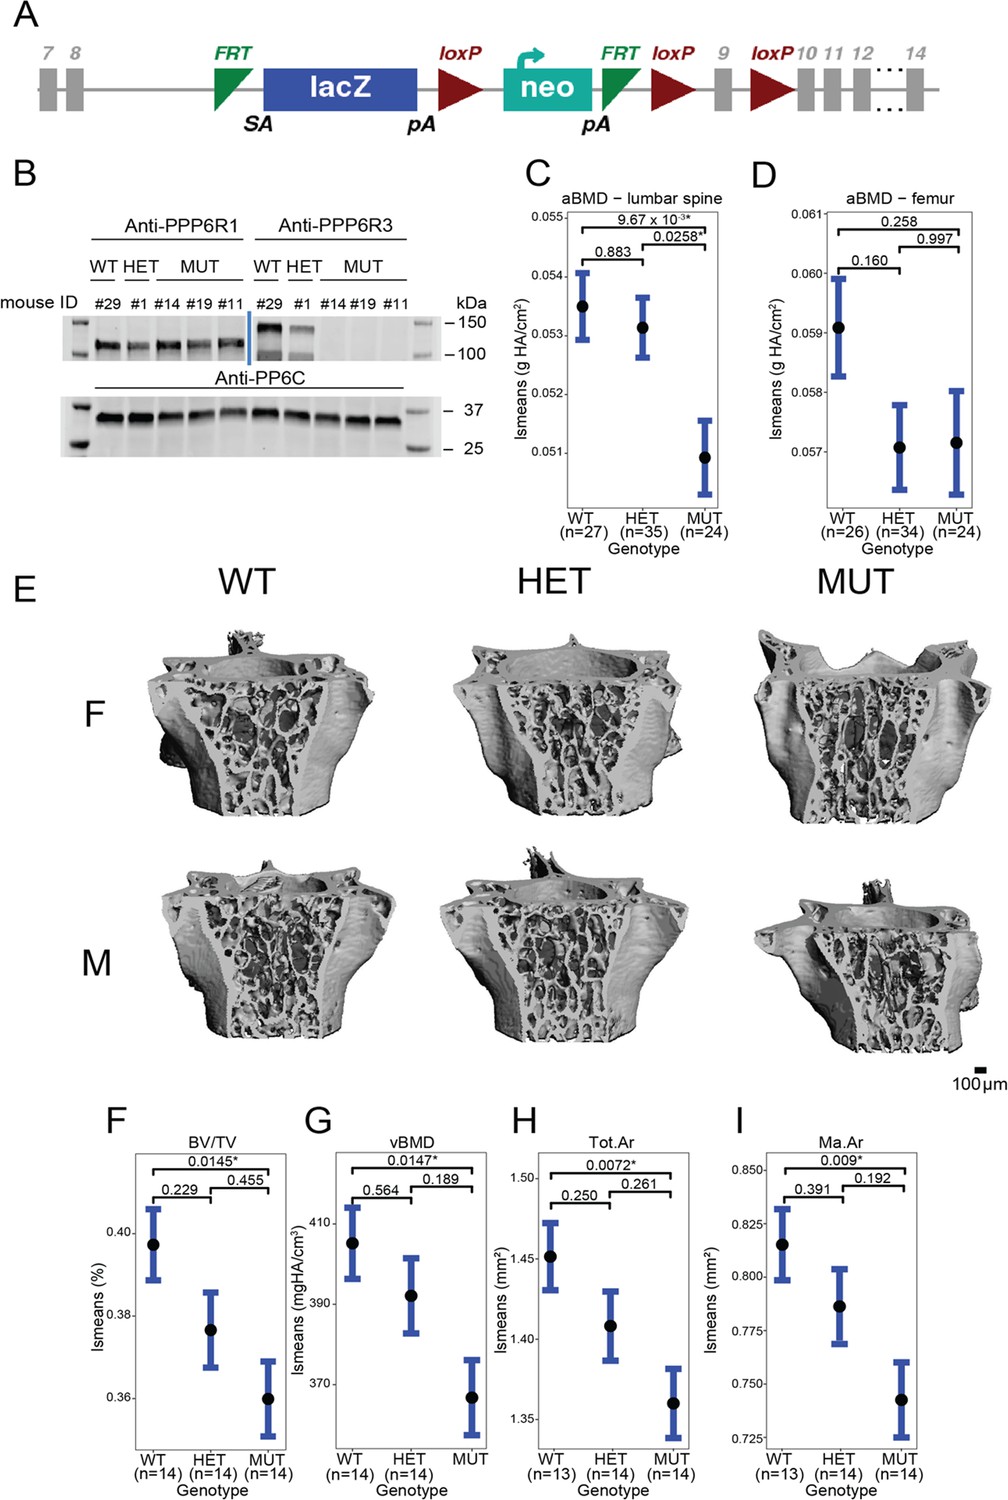
Ppp6r3 functional validation shows an effect of genotype on bone mass.
(A) Schematic of the Ppp6r3 gene-trap allele (Ppp6r3tm1a(KOMP)Wtsi). Image obtained from the International Mouse Phenotype Consortium (IMPC). (B) Western blot of Ppp6r3 in experimental mouse spleens. Top left panel shows that PPP6R1 protein (control) levels are not affected by the Ppp6r3 gene-trap allele. Top right panel shows the effect of the gene-trap allele on PPP6R3 protein levels. The two bands are ostensibly due to different PPP6R3 isoforms. Bottom panel shows that PP6C protein (control) levels are not affected by the Ppp6r3 gene-trap allele. For raw blots, refer to Figure 4—source data 1. Least-squares means for spinal (C) and femoral (D) areal BMD (aBMD) dual X-ray absorptiometry (DXA) in Ppp6r3 wild-type (WT), heterozygous (HET), and mutant (MUT) mice. Contrast p values, adjusted for multiple comparisons are presented. *p ≤ 0.05. (E) Representative images of vertebrae for the Ppp6r3 experimental mice. Scale is shown on the bottom right. (F, G) Least-squares means for micro-computed tomography (μCT) measurements in the lumbar spines of Ppp6r3 WT, HET, and MUT mice. Contrast p values, adjusted for multiple comparisons are presented. *p ≤ 0.05. (H, I) Least-squares means for μCT measurements in the femoral midshaft of Ppp6r3 WT, HET, and MUT mice. Contrast p values, adjusted for multiple comparisons are presented. *p ≤ 0.05. Abbreviations: BV/TV – bone volume fraction, vBMD – volumetric bone mineral density, Tot.Ar – total area, Ma.Ar – medullary area. In panels (C, D and F–I), the center points represent the least-square means, and the error bars represent confidence intervals at a confidence level of 0.9. Data presented here are from both male and female mice.
-
Figure 4—source data 1
Raw, unedited, PPP6R3 western blots.
- https://cdn.elifesciences.org/articles/77285/elife-77285-fig4-data1-v1.zip
Figure 4—figure supplement 1

LSBMD and FNBMD genome-wide association study (GWAS) SNPs in the PPP6R3 locus.
(A) GWAS SNPs for LSBMD in the PPP6R3 locus. SNPs in red are significant PPP6R3 expression quantitative trait loci (eQTL) in thyroid tissue. The dashed line represents the genome-wide significance level (p value = 5 × 10⁻⁸). (B) GWAS SNPs for FNBMD in the PPP6R3 locus. SNPs in red are significant PPP6R3 eQTLin thyroid tissue. The dashed line represents the genome-wide significance level (p value = 5 × 10⁻⁸). (C) Mirroplot of LSBMD SNPs and PPP6R3 eQTL SNPs are colored by their linkage disequilibrium (LD) with rs10047483 (purple), the most significant PPP6R3 eQTL in thyroid. In the LSBMD panel, the most significant SNP is highlighted in purple, as rs10047483 was not assayed. (D) Mirroplot of FNBMD SNPs and PPP6R3 eQTL SNPs are colored by their LD with rs10047483 (purple), the most significant PPP6R3 eQTL in thyroid. In the FNBMD panel, the most significant SNP is highlighted in purple, as rs10047483 was not assayed.
Figure 4—figure supplement 2
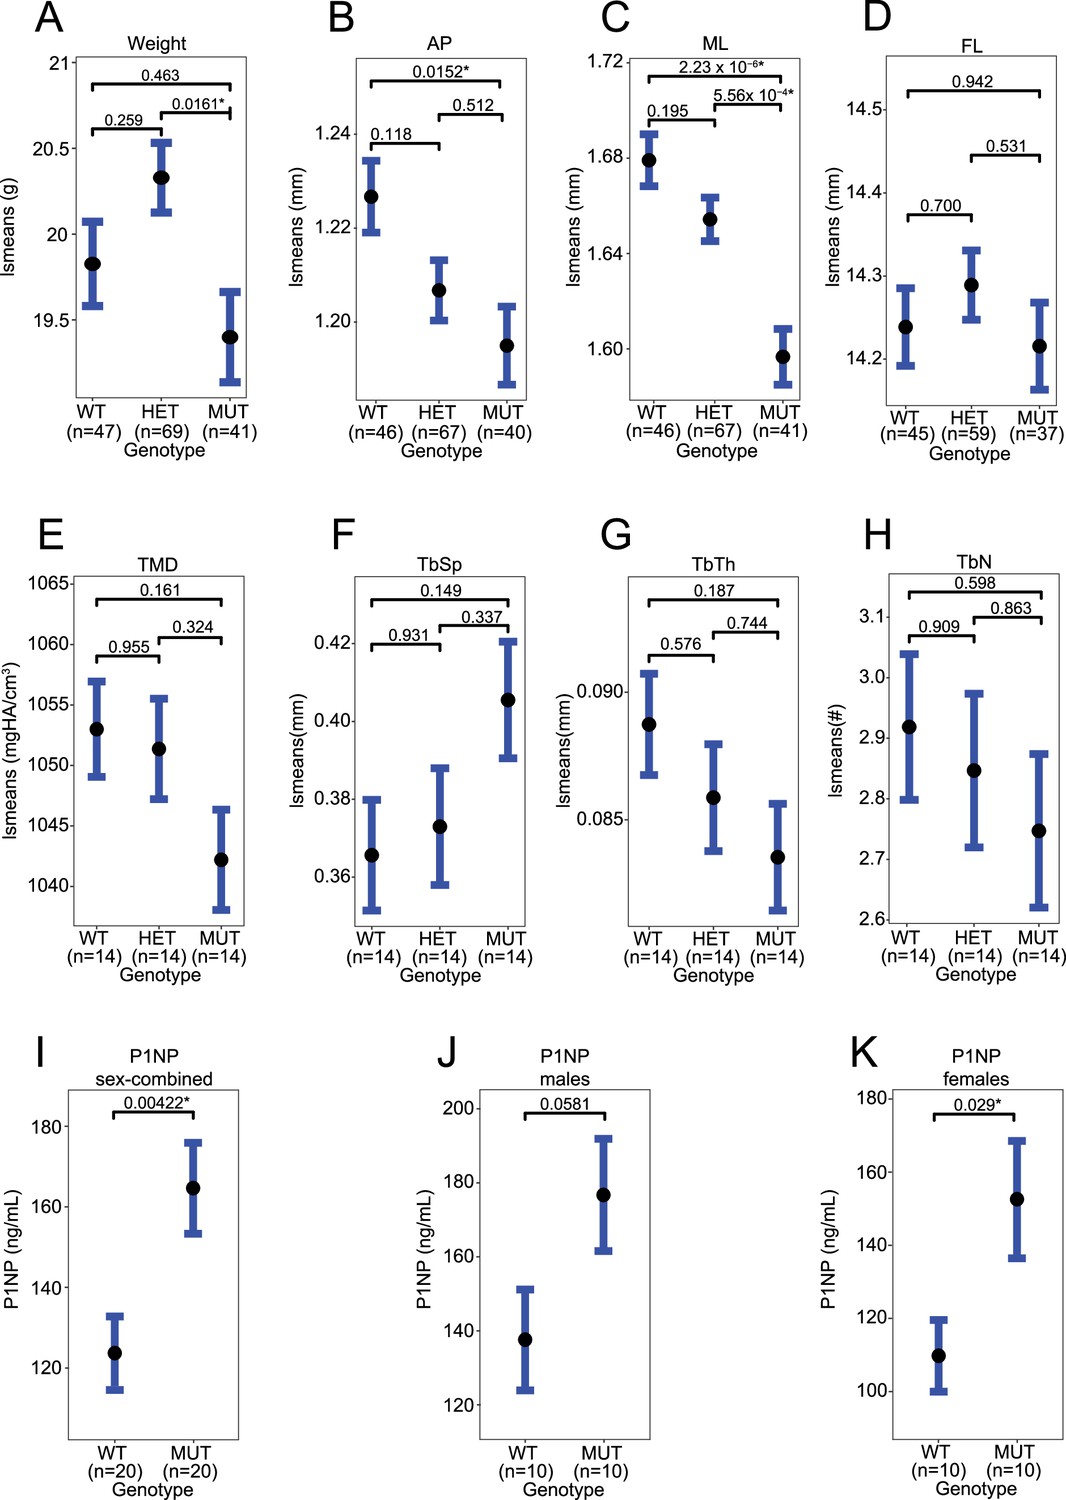
Ppp6r3 functional validation.
(A) Weight. (B) Anterior–posterior (AP) femoral width. (C) Medial–lateral (ML) femoral width. (D) Femoral length (FL). (E) Lumbar spine tissue mineral density (TMD). (F) Lumbar spine trabecular separation (TbSp). (G) Lumbar spine trabecular thickness (TbTh). (H) Lumbar spine trabecular number (TbN). (I) P1NP serum concentration in sex-combined samples. (J) P1NP serum concentration in male samples. (K) P1NP serum concentration in female samples. Panels (E–H) are measured by micro-computed tomography (μCT). In panels A–H, least-square means are plotted. p values are contrast p values, adjusted for multiple comparisons. In panels I–K, p values are calculated by t-test. Asterisks represent significance (p ≤ 0.05).
Figure 4—figure supplement 3
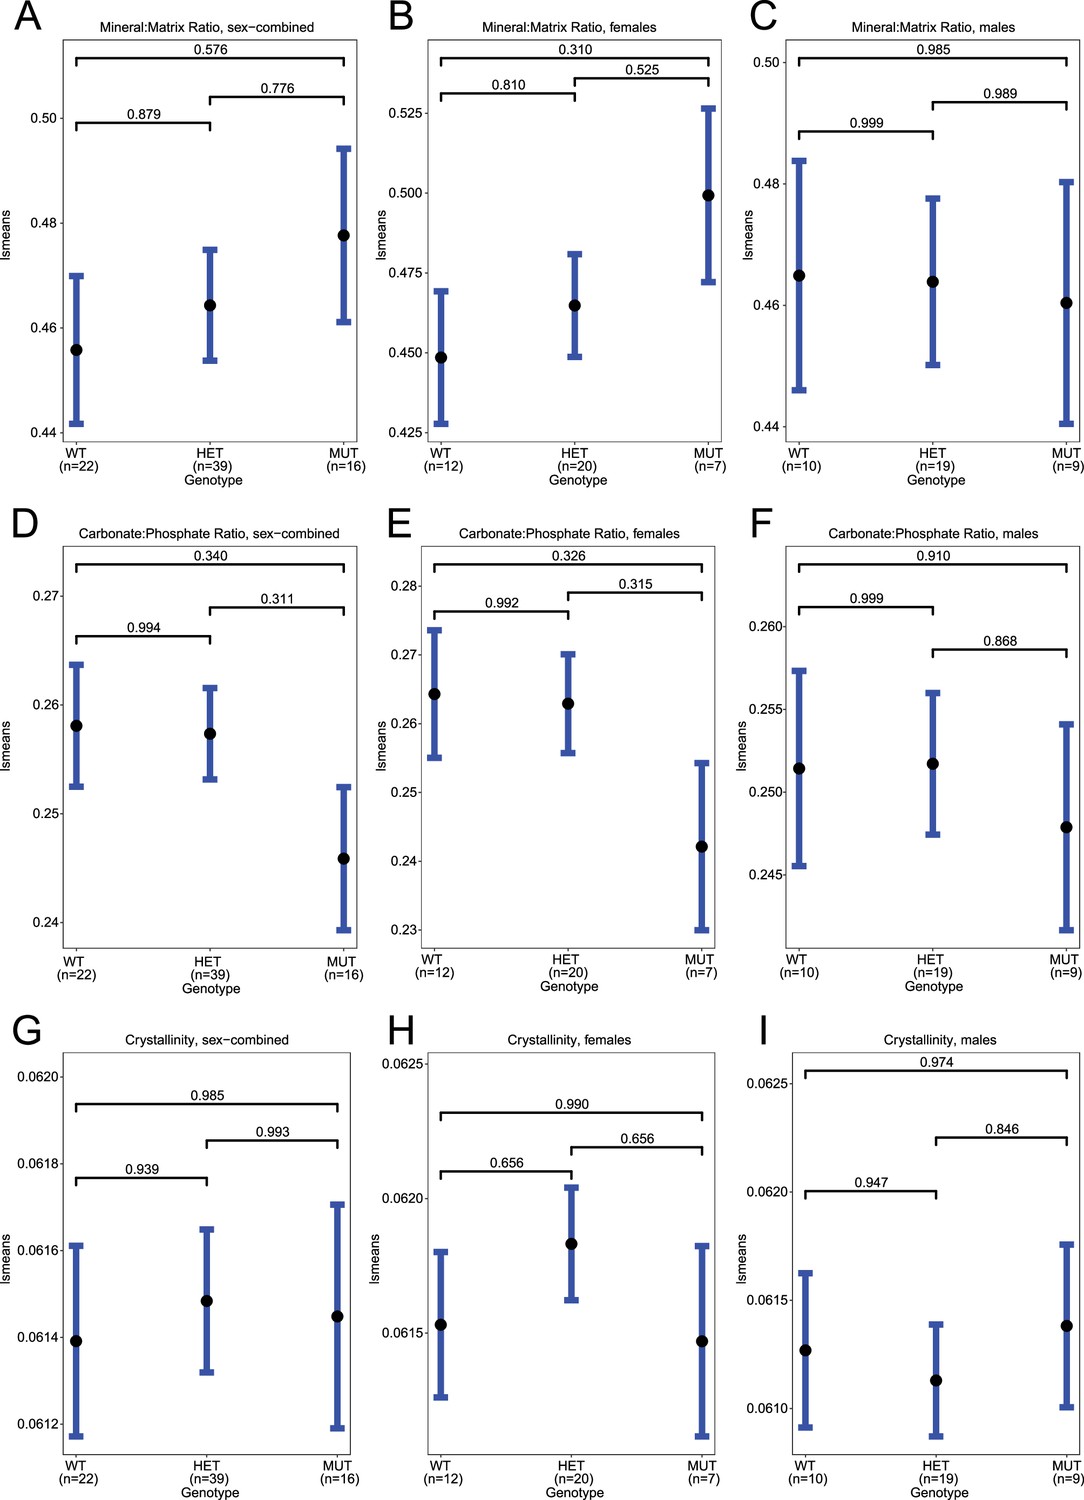
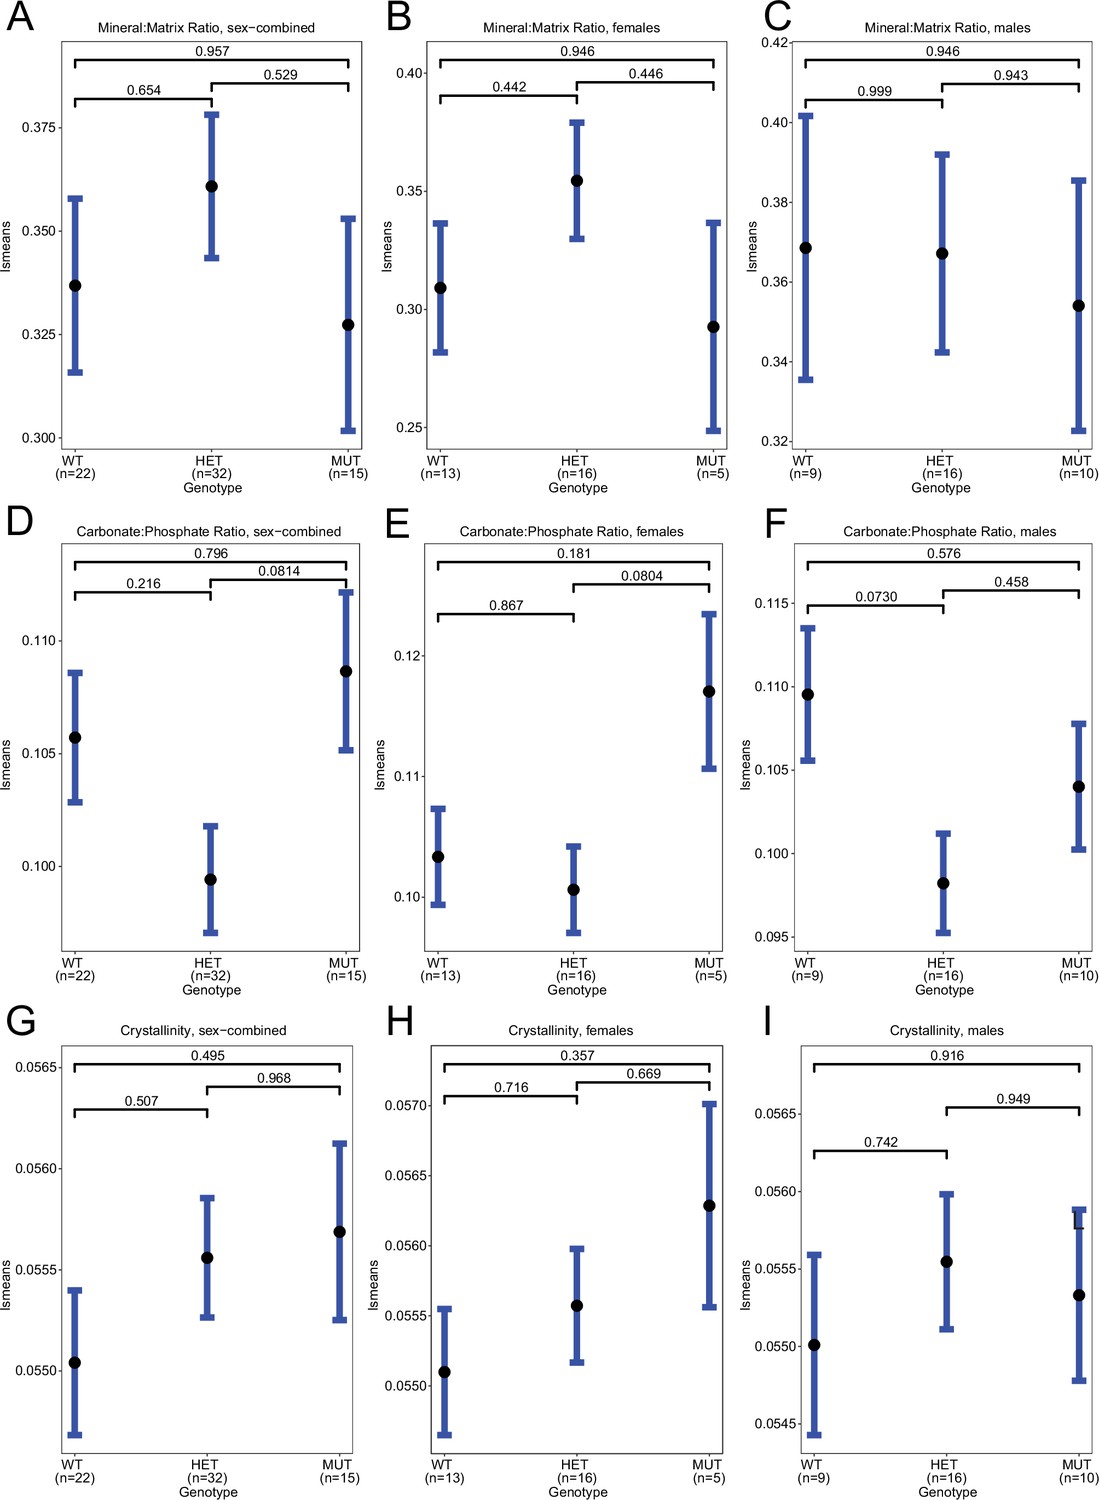
Raman spectroscopy in femur, means.
(A–C) Least-square means for mean(mineral:matrix) in sex-combined, female, and male samples, respectively. (D–F) Least-square means for mean(carbonate:phosphate) in sex-combined, female, and male samples, respectively. (G–I) Least-square means for mean(crystallinity) in sex-combined, female, and male samples, respectively. Contrast p values, adjusted for multiple comparisons, are presented.
Figure 4—figure supplement 4
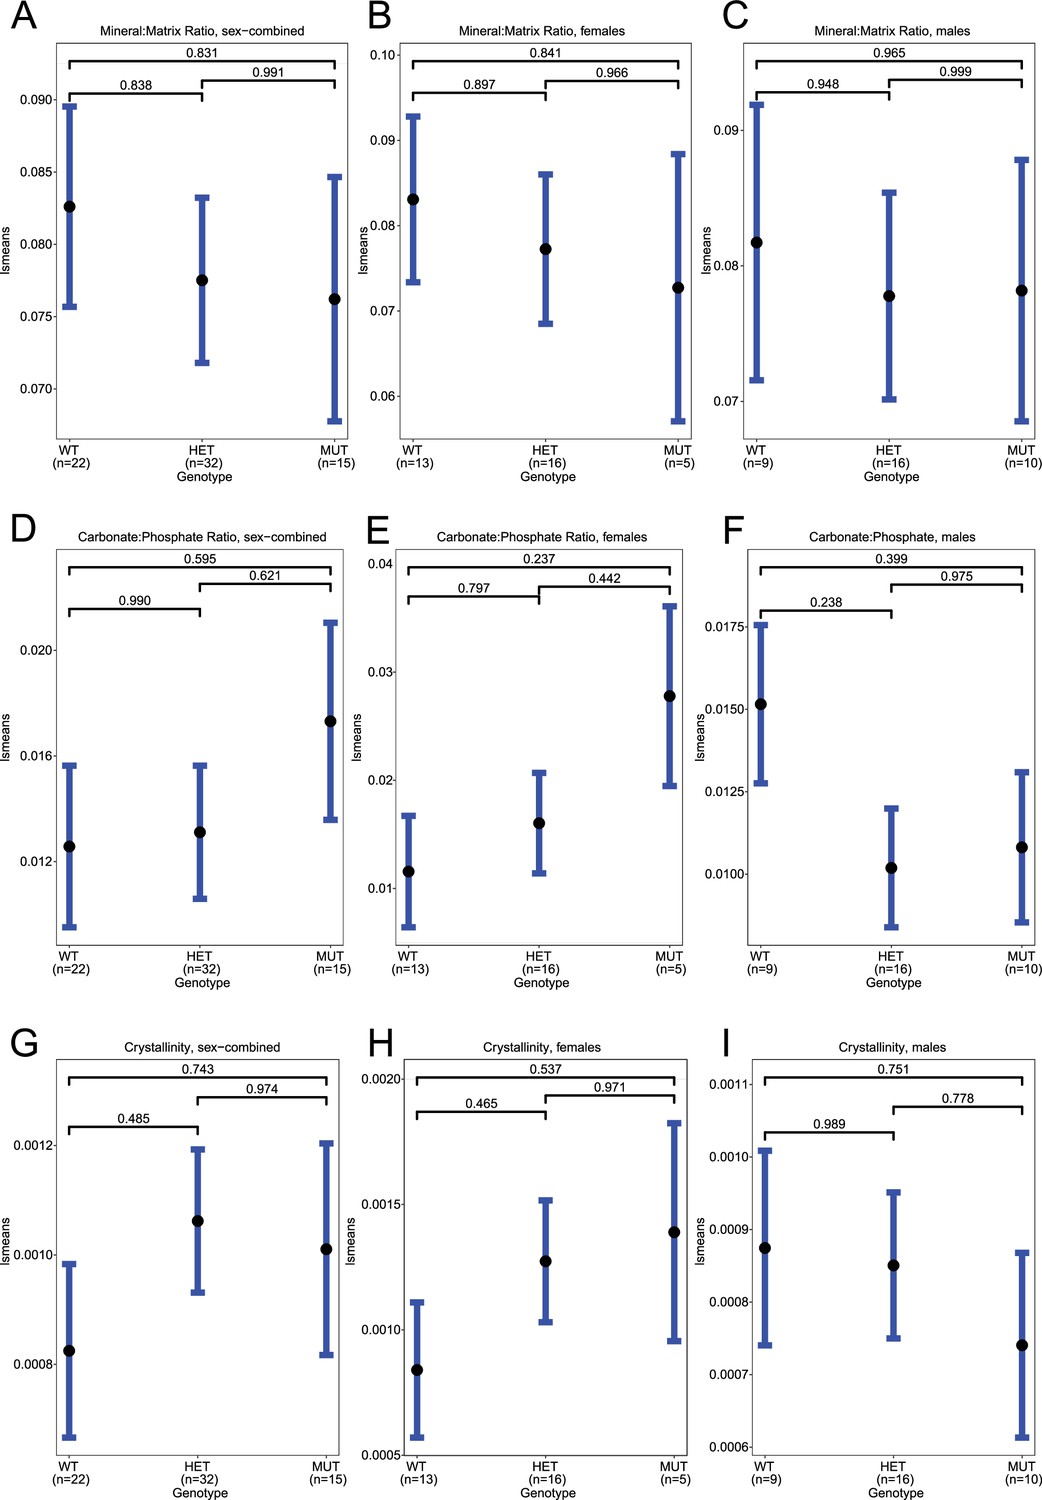
Raman spectroscopy in spines, means.
(A–C) Least-square means for mean(mineral:matrix) in sex-combined, female, and male samples, respectively. (D–F) Least-square means for mean(carbonate:phosphate) in sex-combined, female, and male samples, respectively. (G–I) Least-square means for mean(crystallinity) in sex-combined, female, and male samples, respectively. Contrast p values, adjusted for multiple comparisons, are presented.
Figure 4—figure supplement 5
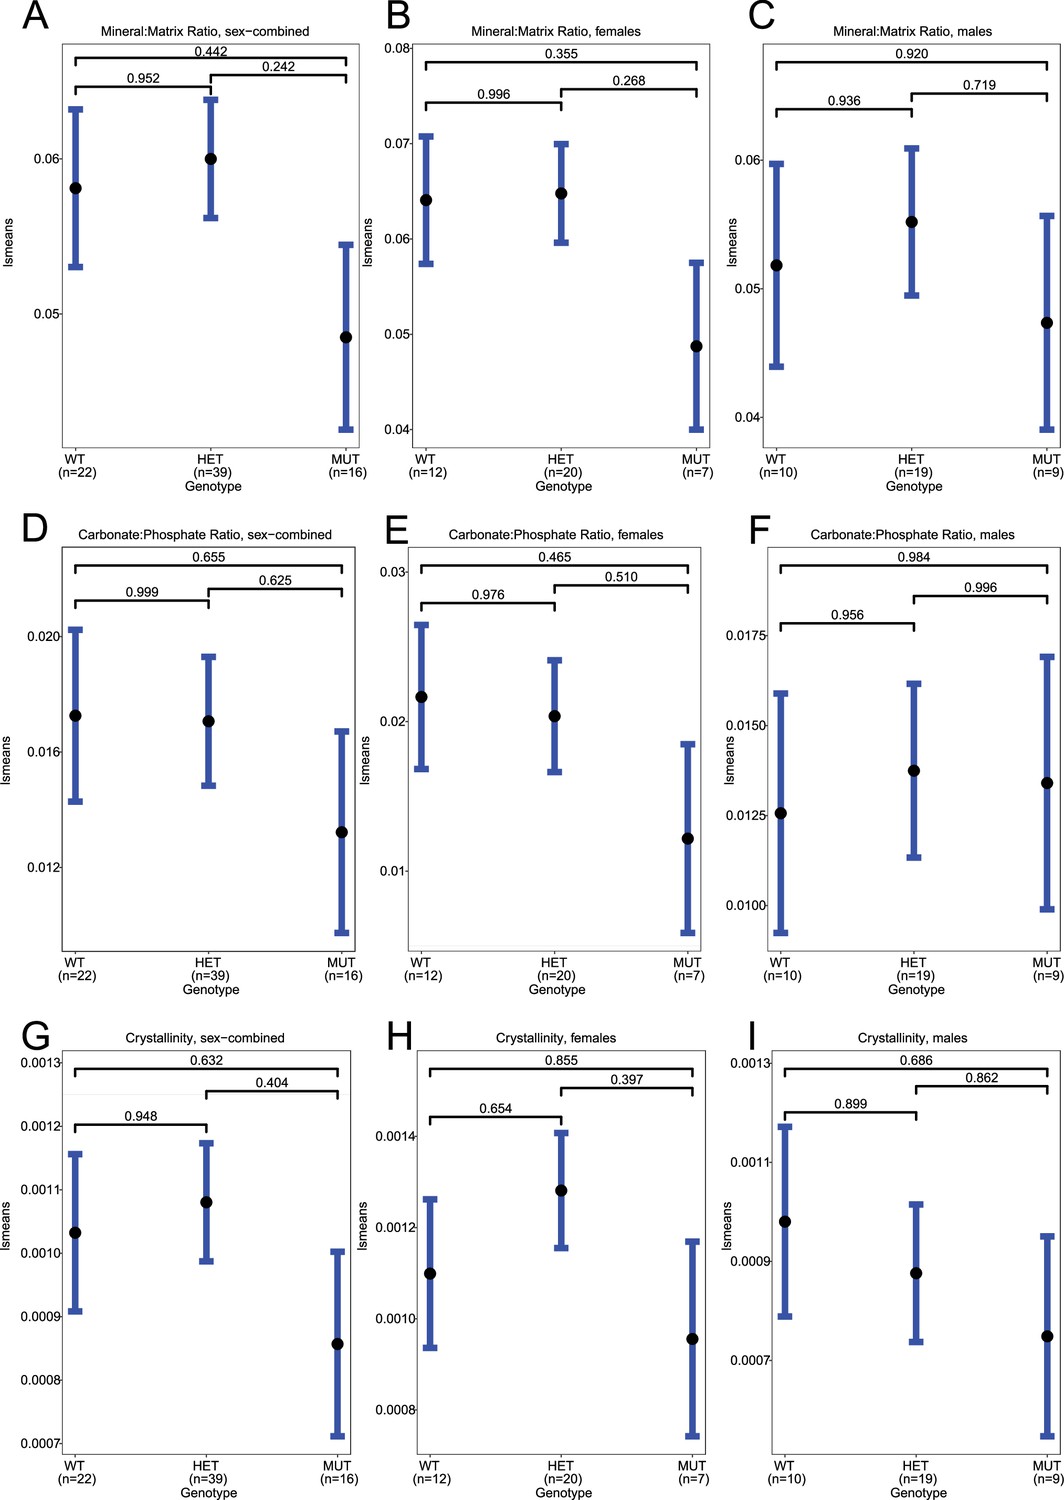
Raman spectroscopy in femurs, standard deviation.
(A–C) Least-square means for sd(mineral:matrix) in sex-combined, female, and male samples, respectively. (D–F) Least-square means for sd(carbonate:phosphate) in sex-combined, female, and male samples, respectively. (G–I) Least-square means for sd(crystallinity) in sex-combined, female, and male samples, respectively. Contrast p values, adjusted for multiple comparisons, are presented.
Figure 4—figure supplement 6
Raman spectroscopy in spines, standard deviation.
(A–C) Least-square means for sd(mineral:matrix) in sex-combined, female, and male samples, respectively. (D–F) Least-square means for sd(carbonate:phosphate) in sex-combined, female, and male samples, respectively. (G–I) Least-square means for sd(crystallinity) in sex-combined, female, and male samples, respectively. Contrast p values, adjusted for multiple comparisons, are presented.
Tables
Table 1
Top 10 protein-coding genes significant by colocalization (RCP ≥0.1) and TWAS, sorted by TWAS p value.
| Gene | Tissue with greatest RCP | Max. RCP | TWAS p value (Bonferroni) |
|---|---|---|---|
| SPTBN1 | Cells_Cultured_Fibroblasts | 0.9469 | <5 × 10−324 |
| CCDC170 | Spleen | 0.6582 | <5 × 10−324 |
| FAM3C | Artery_Tibial | 0.4917 | <5 × 10−324 |
| SEPT5 | Skin_Sun_Exposed | 0.4868 | 2.26 × 10−286 |
| FGFRL1 | Cells_Cultured_Fibroblasts | 0.1611 | 5.31 × 10−272 |
| GREM2 | Cells_Cultured_Fibroblasts | 0.9998 | 4.31 × 10−257 |
| GPATCH1 | Whole_Blood | 0.3564 | 3.44 × 10−226 |
| RHPN2 | Pituitary | 0.2181 | 8.71 × 10−221 |
| BMP4 | Brain_Cortex | 0.5468 | 5.49 × 10−169 |
| RUNX2 | Esophagus_Gastroesophageal_Junction | 0.2372 | 1.99 × 10−146 |
Table 2
Top 10 novel protein-coding genes significant by colocalization (RCP ≥0.5) and TWAS, sorted by TWAS p value.
| Gene | Tissue with greatest RCP | Max. RCP | TWAS p value (Bonferroni) | # GTEx tissues with RCP ≥0.5 |
|---|---|---|---|---|
| SPTBN1 | Cells_Cultured_fibroblasts | 0.9469 | <5 × 10−324 | 2 |
| PPP6R3 | Thyroid | 0.5291 | 5.7 × 10−93 | 1 |
| BARX1 | Colon_Transverse | 0.7764 | 6.36 × 10−63 | 1 |
| MEOX2 | Brain_Nucleus_accumbens_basal_ganglia | 0.6286 | 3.21 × 10−53 | 3 |
| RERE | Adipose_Subcutaneous | 0.6431 | 6.95 × 10−46 | 4 |
| SIPA1 | Nerve_Tibial | 0.9981 | 4.26 × 10−41 | 1 |
| CAPZB | Testis | 0.6716 | 3.64 × 10⁻³³ | 1 |
| B4GALNT3 | Artery_Aorta | 0.9241 | 2.67 × 10⁻³³ | 4 |
| TRPC4AP | Breast_Mammary_Tissue | 0.5577 | 8.62 × 10⁻³¹ | 3 |
| AXL | Minor_Salivary_Gland | 0.6205 | 9.74 × 10⁻³¹ | 3 |
Additional files
-
Supplementary file 1
Supplementary data files associated with this manuscript.
(a) 2156 protein-coding genes that are significant by S-MultiXcan transcriptome-wide association study (TWAS) analysis (Bonferroni p value ≤0.05). Columns are Ensembl ID, gene name, the nominal S-MultiXcan p value, the number of tissues available to S-MultiXcan, the number of independent components of variation among the tissues, and the Bonferroni-adjusted p value. (b) 1182 protein-coding genes that are significant in the fastEnloc colocalization analysis (regional colocalization probability [RCP] ≥0.1). Columns are Ensembl ID, signal cluster name from the expression quantitative trait loci (eQTL) analysis, the gene name, the RCP, and the colocalizing Genotype-Tissue Expression (GTEx) tissue. (c) The 512 protein-coding genes that are significant by both TWAS and colocalization (Bonferroni p value ≤0.05 and RCP ≥0.1). Columns are Ensembl ID, signal cluster name from the eQTL analysis, gene name, the RCP, the colocalizing GTEx tissue, the nominal S-MultiXcan p value, and the Bonferroni-adjusted p value. (d) Number of the 512 significantly colocalizing genes per GTEx tissue. Columns are the GTEx tissue and the number of unique colocalizing eQTL in the relevant tissue. (e) The ‘known bone gene’ list. Columns are gene name and Ensembl ID. (f) The 66 genes that are significant by both TWAS and colocalization (Bonferroni p value ≤0.05 and RCP ≥0.1), and are also members of the ‘known bone gene’ list. Columns are gene name and Ensembl ID. (g) Gene Ontology (GO) enrichments for the 512 protein-coding genes that are significant by both TWAS and colocalization (Bonferroni p value ≤0.05 and RCP ≥0.1). Only GO enrichments with a p value ≤0.05 are included. Columns are the GO IDs, GO terms, p values, the GO subontology (BP – Biological Process, CC – Cellular Component, MF – Molecular Function), and the Ensembl IDs for the genes that are members of the GO ontology. p values were calculated using a one-sided Fisher’s exact test, and were not adjusted for multiple comparisons. (h) The 863 genes closest to estimated bone mineral density (eBMD) genome-wide association study (GWAS) associations. These data were obtained from Morris et al., 2019. (i) 137 novel putatively causal BMD genes, after increasing RCP ≥0.5, and removing genes that were members of the ‘known bone gene’ list and genes with a nominal (p ≤ 0.05) alteration in BMD as determined by the International Mouse Phenotype Consortium (IMPC). Columns are Gene name, Ensembl ID, colocalization RCP, the tissue with the highest RCP, the S-Multixcan Bonferroni-adjusted p value, and the number of tissues that were significantly colocalizing. Note that TLN2 appears twice due to having the same RCP in two tissues. (j) Results of the differential expression analysis performed on RNA isolated from vertebrae. The analysis results show the difference in expression between mutant and wild-type mice. The columns are the Ensembl IDs, gene names, baseMean (the average of normalized count values, taken over all samples), log2 fold change, standard error of the log2 fold change estimate, the Wald statistic, the test p value, and the BH-adjusted p value.
- https://cdn.elifesciences.org/articles/77285/elife-77285-supp1-v1.xlsx
-
Transparent reporting form
- https://cdn.elifesciences.org/articles/77285/elife-77285-transrepform1-v1.docx
Download links
A two-part list of links to download the article, or parts of the article, in various formats.
Downloads (link to download the article as PDF)
Open citations (links to open the citations from this article in various online reference manager services)
Cite this article (links to download the citations from this article in formats compatible with various reference manager tools)
Transcriptome-wide association study and eQTL colocalization identify potentially causal genes responsible for human bone mineral density GWAS associations
eLife 11:e77285.
https://doi.org/10.7554/eLife.77285


