Human influenza virus infection elicits distinct patterns of monocyte and dendritic cell mobilization in blood and the nasopharynx
- Division of Immunology and Allergy, Department of Medicine Solna, Karolinska Institutet, Karolinska University Hospital, Sweden
- Division of Infectious Diseases, Department of Medicine Solna, Karolinska Institutet, Sweden
- Department of Infectious Diseases, Karolinska University Hospital, Sweden
- SomaLogic Operating Co., Inc,, United States
- Boulder Bioconsulting Inc, United States
- Department of Microbiology, Tumor and Cell Biology, Karolinska Institutet, Sweden
- Department of Clinical Microbiology, Karolinska University Hospital, Sweden
Figures
Figure 1 with 1 supplement
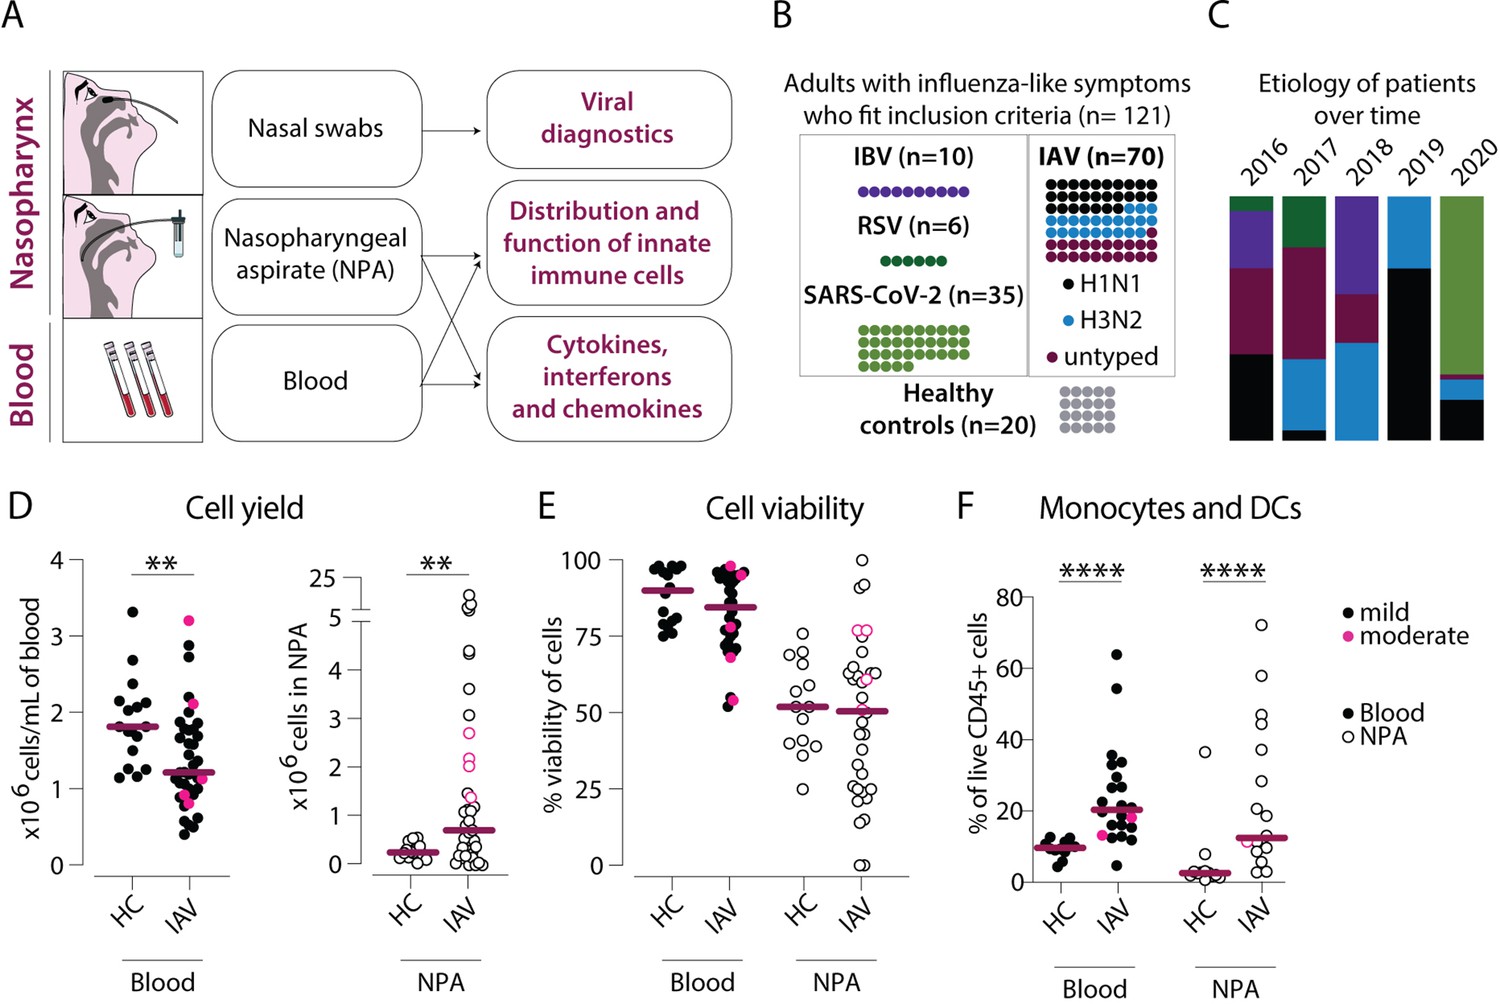
Cellular infiltration into the nasopharynx during influenza A virus (IAV) infection is largely due to accumulation of lineage negative HLA-DR+ cells.
(A) Nasal swabs, nasopharyngeal aspirates (NPA), and peripheral blood samples were collected from patients with acute symptoms of influenza-like symptoms and during their convalescence as well as from healthy controls (HCs). (B) Forty of 64 patients with influenza-like symptoms were confirmed to be infected with IAV by PCR and were included in the study. Further, 27 of the IAV patients were infected with H1N1, and 22 with H3N2. A variety of analyses were performed on acute (n=121) and convalescent (n=11) samples from the IAV patients and HC (n=20). (C) Graph depicts the relative distribution of IAV, IBV, respiratory syncytial virus (RSV), and severe acute respiratory syndrome coronavirus 2 (SARS-CoV-2) cases during each year of inclusion to illustrate the shifting trends in circulating respiratory viral illnesses over time. (D–F) Scatter plots show data from individual subjects and lines indicate median values. IAV patients with mild disease, as defined by peak respiratory sequential organ failure assessment (SOFA) or modified SOFA (mSOFA) score of 1 or 2 are indicated in black and those with moderate disease (mSOFA score of 3 or 4) are indicated in pink. (D) ×106 PBMCs (per mL blood, filled circles) and ×106 total NPA cells (open circles) obtained from IAV patients and HCs. (E) Cell viability of PBMCs and NPA from patients and HCs was assessed using Trypan Blue exclusion staining and manual counting. (F) Frequency of lineage (CD3, CD19, CD20, CD56, CD66abce) negative HLA-DR+ cells (monocytes and myeloid dendritic cells) of live CD45+ cells in blood and NPA from HCs (n=16) and IAV patients (n=22). Differences between IAV patients and HCs were assessed using Mann-Whitney test and considered significant at p<0.05 (**p<0.01, ****p<0.0001).
-
Figure 1—source data 1
Related to Figure 1D – blood.
- https://cdn.elifesciences.org/articles/77345/elife-77345-fig1-data1-v2.xlsx
-
Figure 1—source data 2
Related to Figure 1D – nasopharyngeal aspirates (NPA).
- https://cdn.elifesciences.org/articles/77345/elife-77345-fig1-data2-v2.xlsx
-
Figure 1—source data 3
Related to Figure 1E – blood.
- https://cdn.elifesciences.org/articles/77345/elife-77345-fig1-data3-v2.xlsx
-
Figure 1—source data 4
Related to Figure 1E – nasopharyngeal aspirates (NPA).
- https://cdn.elifesciences.org/articles/77345/elife-77345-fig1-data4-v2.xlsx
-
Figure 1—source data 5
Related to Figure 1F – blood.
- https://cdn.elifesciences.org/articles/77345/elife-77345-fig1-data5-v2.xlsx
-
Figure 1—source data 6
Related to Figure 1F nasopharyngeal aspirates (NPA).
- https://cdn.elifesciences.org/articles/77345/elife-77345-fig1-data6-v2.xlsx
Figure 1—figure supplement 1
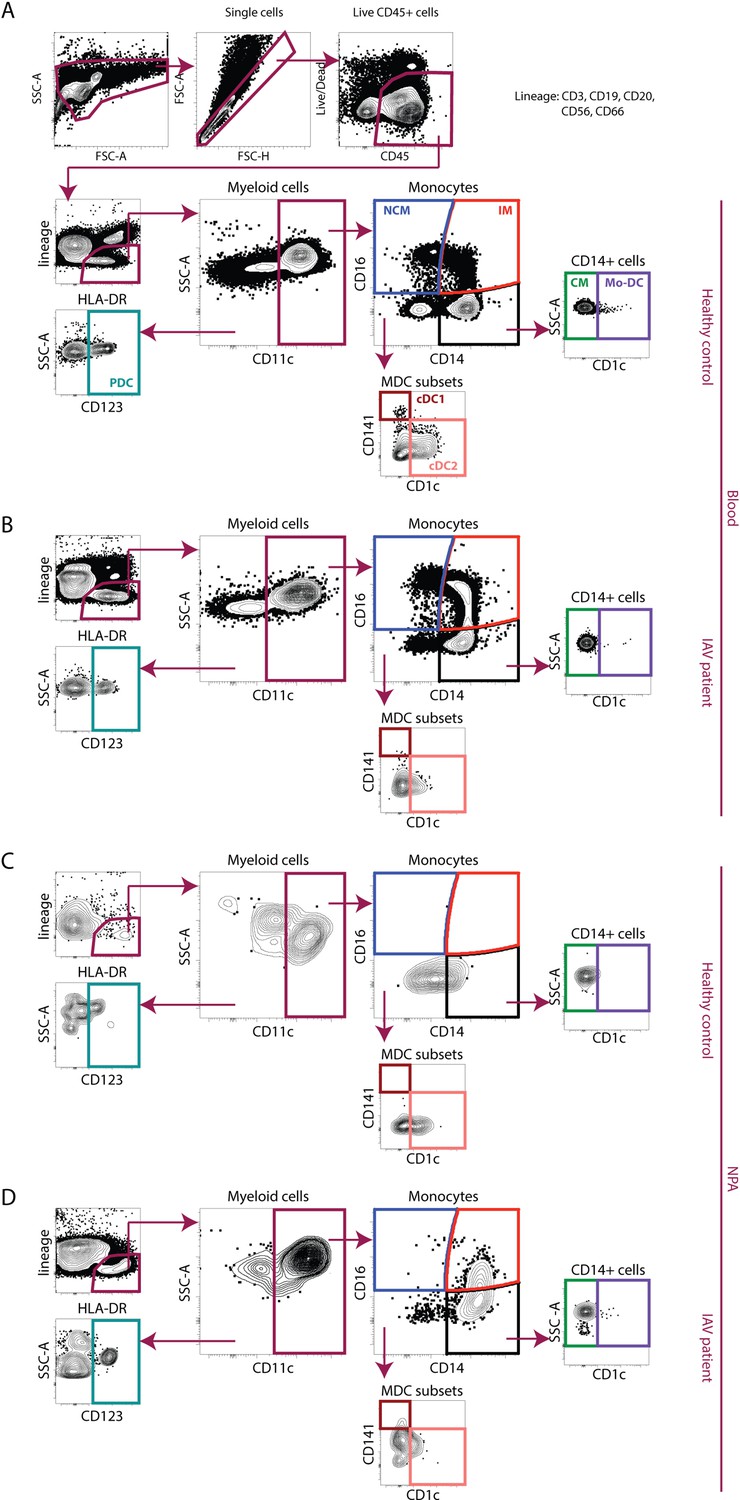
Gating strategy for identification of monocytes and dendritic cells from PBMCs and nasopharyngeal aspirates (NPA).
Representative sample showing gating on live CD45+ single cells, excluding cells expressing lineage markers (CD3, CD20, CD56, and CD66abce) and identification of HLA-DR-expressing cells. From the live CD45+, lineage negative, HLA-DR+ (lin–HLA-DR+) cells, CD11c– cells were gated upon to identify CD123+ plasmacytoid dendritic cells (DCs) (teal). From the CD11c+ myeloid cells, intermediate (CD14+CD16+) (IM, red) and nonclassical (NCM, CD14−CD16+) (blue) monocytes were identified. From CD11c+CD14 + cells, true classical monocytes (CD14+CD16−) (CM, green), and CD11c+CD14+CD1c+ monocyte-derived DCs (purple) were identified. From CD14−CD16− cells, two myeloid DC subsets cDC2 (coral) and cDC1 (maroon) were identified. Representative samples of using the antibody panel and gating strategy to analyse all seven subsets (CMs, IMs, NCMs, plasmacytoid DCs [PDCs], cDC1s, cDC2s, and monocyte-derived DCs [mo-DCs]) in blood samples from a (A) healthy control (HC) and (B) influenza A virus (IAV) patient and NPA samples from a (C) HC and (D) IAV patient are shown.
Figure 2 with 1 supplement
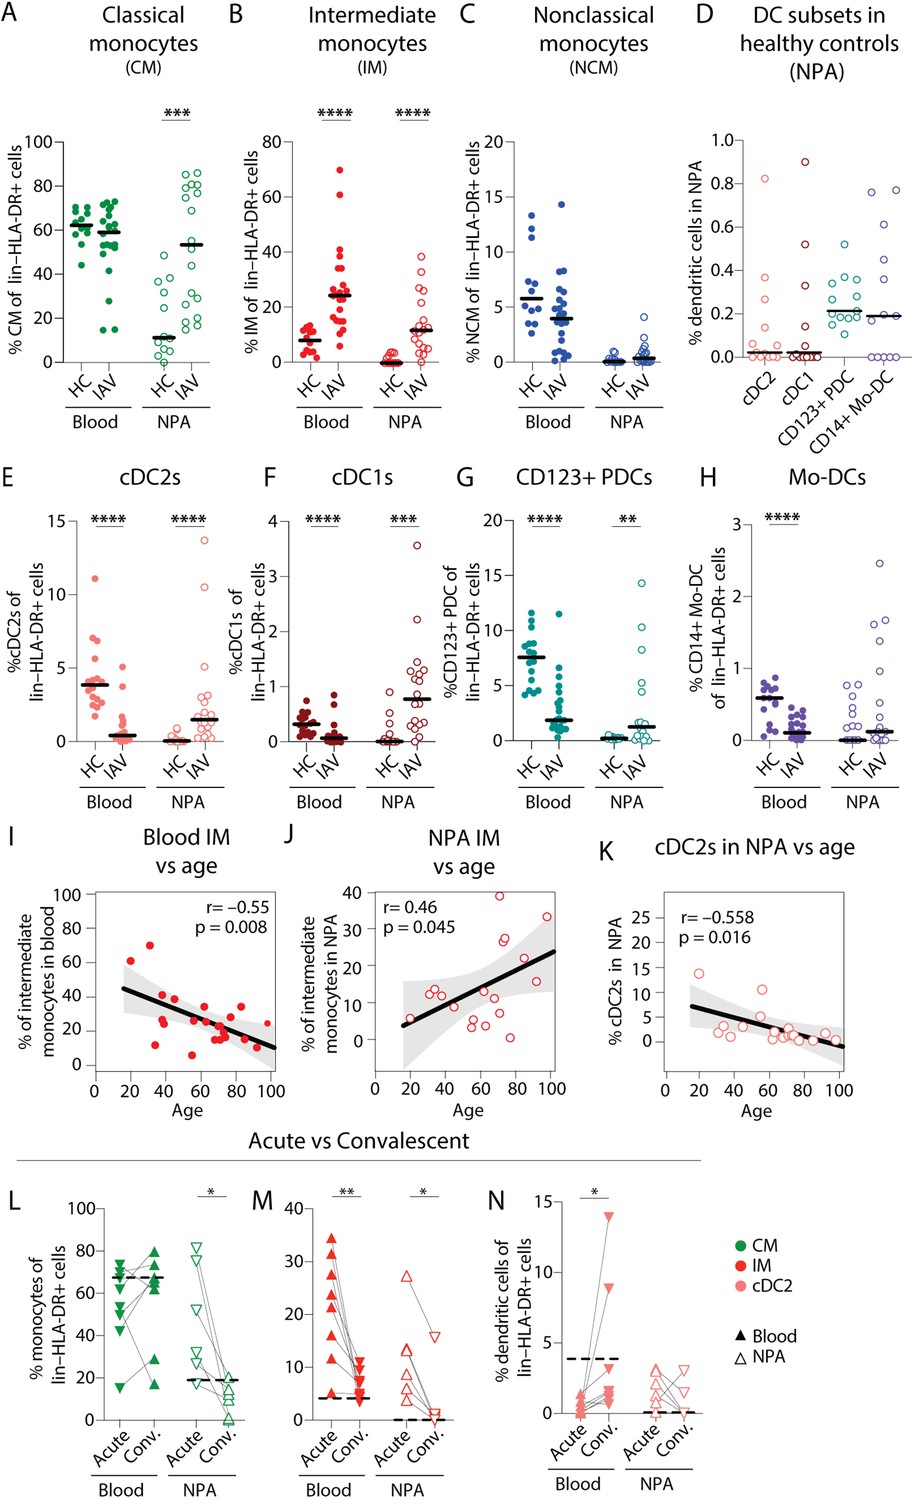
Intermediate monocyte and dendritic cell frequencies are significantly altered in blood and the nasopharynx from influenza A virus (IAV) patients compared to healthy controls.
(A–C) Scatter plots show frequencies of (A) CD14+CD16–CD1c– classical monocytes (CMs), (B) CD14+CD16+ intermediate monocytes (IMs), and (C) CD14–CD16+ nonclassical monocytes (NCMs) in PBMCs and nasopharyngeal aspirates (NPA) from healthy controls (HCs) (n=12) and IAV patients (n=22). (D) Scatter plots shows the frequencies of cDC2s (coral), cDC1s (maroon), CD123+ plasmacytoid dendritic cells (PDCs) (teal) and CD14+ monocyte-derived DCs (mo-DCs) (purple) in the NPA from HCs (n=16). (E–H) Graphs show frequencies of (E) cDC2s, (F) cDC1s, (G) CD123+ PDCs, and (H) mo-DCs expressed as a frequency of lin–HLA-DR+ cells in PBMCs and NPA from HCs (n=12) and IAV patients (n=22). Lines (A–H) indicate median values. Differences between IAV patients and HCs were assessed using Mann-Whitney test and considered significant at p<0.05 (**p<0.01, ***p<0.001, ****p<0.0001). (I–K) Scatter plots and line of fit display bivariate linear regression analysis between age of IAV patients and IM frequency in (I) blood and (J) NPA; and (K) between age and frequency of cDC2s in blood. The shaded area represents the 95% confidence region for the fitted line. R represents Spearman ρ and differences were considered significant at p<0.05. (L) Graphs depict frequencies of classical monocytes (CMs) (green), intermediate monocytes (IMs) (red), and cDC2s (coral) in blood (n=8) and the NPA (n=6) in the acute (upward triangles) and convalescent phase (downward triangles) in IAV patients. Dashed lines depict median frequency values from HCs in blood and NPA. Differences between acute and convalescent phase values were assessed using Wilcoxon matched-pairs signed rank test and considered significant at p<0.05 (*p<0.05 and **p<0.01).
-
Figure 2—source data 1
Related to Figure 2A – blood.
- https://cdn.elifesciences.org/articles/77345/elife-77345-fig2-data1-v2.xlsx
-
Figure 2—source data 2
Related to Figure 2A – nasopharyngeal aspirates (NPA).
- https://cdn.elifesciences.org/articles/77345/elife-77345-fig2-data2-v2.xlsx
-
Figure 2—source data 3
Related to Figure 2B – blood.
- https://cdn.elifesciences.org/articles/77345/elife-77345-fig2-data3-v2.xlsx
-
Figure 2—source data 4
Related to Figure 2B – nasopharyngeal aspirates (NPA).
- https://cdn.elifesciences.org/articles/77345/elife-77345-fig2-data4-v2.xlsx
-
Figure 2—source data 5
Related to Figure 2C – blood.
- https://cdn.elifesciences.org/articles/77345/elife-77345-fig2-data5-v2.xlsx
-
Figure 2—source data 6
Related to Figure 2C – nasopharyngeal aspirates (NPA).
- https://cdn.elifesciences.org/articles/77345/elife-77345-fig2-data6-v2.xlsx
-
Figure 2—source data 7
Related to Figure 2D – nasopharyngeal aspirates (NPA).
- https://cdn.elifesciences.org/articles/77345/elife-77345-fig2-data7-v2.xlsx
-
Figure 2—source data 8
Related to Figure 2E – blood.
- https://cdn.elifesciences.org/articles/77345/elife-77345-fig2-data8-v2.xlsx
-
Figure 2—source data 9
Related to Figure 2E – nasopharyngeal aspirates (NPA).
- https://cdn.elifesciences.org/articles/77345/elife-77345-fig2-data9-v2.xlsx
-
Figure 2—source data 10
Related to Figure 2F – blood.
- https://cdn.elifesciences.org/articles/77345/elife-77345-fig2-data10-v2.xlsx
-
Figure 2—source data 11
Related to Figure 2F – nasopharyngeal aspirates (NPA).
- https://cdn.elifesciences.org/articles/77345/elife-77345-fig2-data11-v2.xlsx
-
Figure 2—source data 12
Related to Figure 2G – blood.
- https://cdn.elifesciences.org/articles/77345/elife-77345-fig2-data12-v2.xlsx
-
Figure 2—source data 13
Related to Figure 2G – nasopharyngeal aspirates (NPA).
- https://cdn.elifesciences.org/articles/77345/elife-77345-fig2-data13-v2.xlsx
-
Figure 2—source data 14
Related to Figure 2H – blood.
- https://cdn.elifesciences.org/articles/77345/elife-77345-fig2-data14-v2.xlsx
-
Figure 2—source data 15
Related to Figure 2H – nasopharyngeal aspirates (NPA).
- https://cdn.elifesciences.org/articles/77345/elife-77345-fig2-data15-v2.xlsx
-
Figure 2—source data 16
Related to Figure 2I.
- https://cdn.elifesciences.org/articles/77345/elife-77345-fig2-data16-v2.xlsx
-
Figure 2—source data 17
Related to Figure 2J.
- https://cdn.elifesciences.org/articles/77345/elife-77345-fig2-data17-v2.xlsx
-
Figure 2—source data 18
Related to Figure 2K.
- https://cdn.elifesciences.org/articles/77345/elife-77345-fig2-data18-v2.xlsx
-
Figure 2—source data 19
Related to Figure 2L.
- https://cdn.elifesciences.org/articles/77345/elife-77345-fig2-data19-v2.xlsx
-
Figure 2—source data 20
Related to Figure 2M.
- https://cdn.elifesciences.org/articles/77345/elife-77345-fig2-data20-v2.xlsx
-
Figure 2—source data 21
Related to Figure 2N.
- https://cdn.elifesciences.org/articles/77345/elife-77345-fig2-data21-v2.xlsx
Figure 2—figure supplement 1
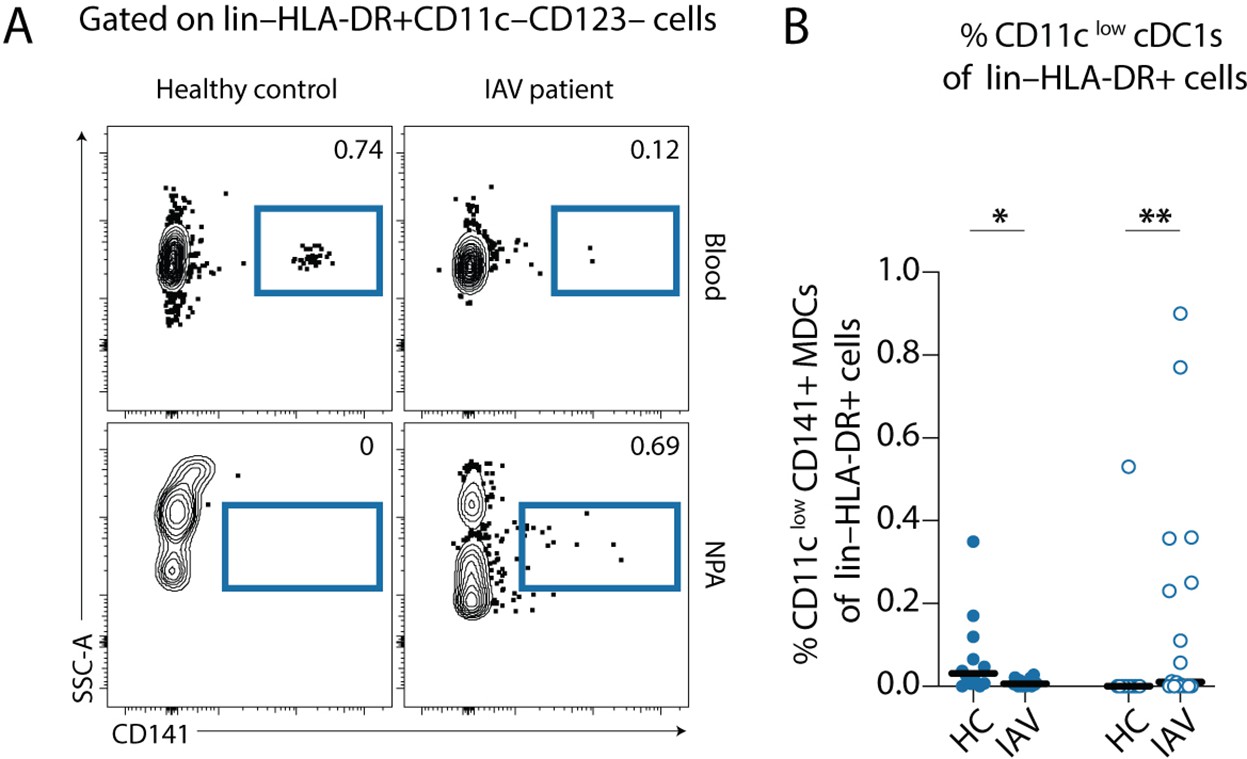
Gating strategy for identification of CD11clow cDC1s from PBMCs and nasopharyngeal aspirates (NPA).
(A) Representative samples showing gating on lin–HLA-DR+ CD11c–CD123– cells, CD141+ cells were gated upon to identify CD11clow cDC1s (indigo). (B) Scatter plots show the frequencies of CD11clow cDC1s (indigo), expressed as a frequency of lin–HLA-DR+ cells in PBMCs (filled) and NPA (empty) from healthy controls (HCs) (n=12) and influenza A virus (IAV) patients (n=22). Lines indicate median values. Differences between IAV patients and HCs were assessed using Mann-Whitney test and considered significant at p<0.05 (*p<0.05, **p<0.01).
Figure 3
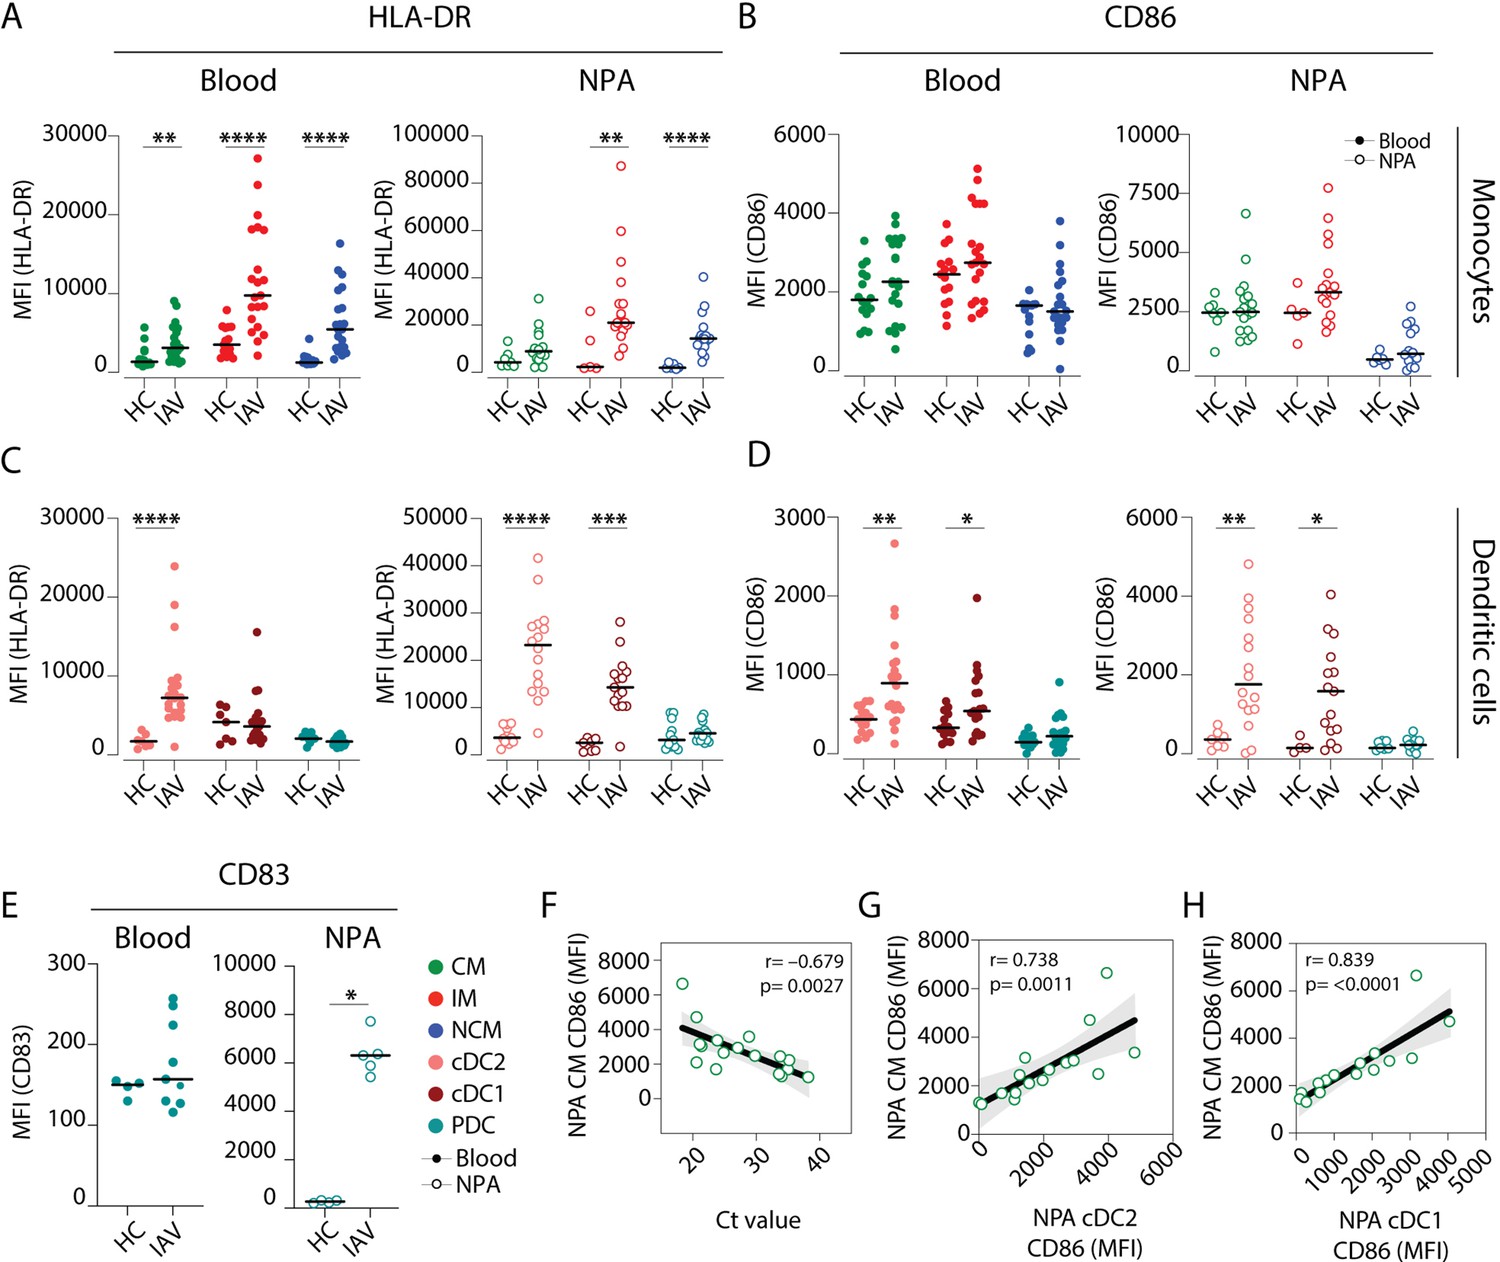
Intermediate monocytes and cDCs in the nasopharynx are more mature in influenza A virus (IAV) patients than in healthy controls.
(A–D) Scatter plots depict MFI of (A, C) HLA-DR and (B, D) CD86 surface expression on (A–B) monocyte (CD14+CD16– classical monocyte (CM): green, CD14+CD16+ intermediate monocyte (IM); red and CD14–CD16+ nonclassical monocyte (NCM): blue) and (C–D) dendritic cell (DC) (cDC2: coral; cDC1: maroon and plasmacytoid dendritic cell [PDC]: teal) subsets in blood (filled circles) and in the nasopharyngeal aspirates (NPA) (open circles) in healthy controls (HCs) (left, n=11) and IAV patients (right, n=19). (E) Scatter plot depicts MFI of CD83 expression on PDCs in blood (filled circles) and in the NPA (open circles). Differences between IAV patients and HCs were assessed by Mann-Whitney test and considered significant at p<0.05 (*p<0.05, **p<0.01, ***p<0.001, and ****p<0.0001). (F–H) Scatter plots and lines of fit display bivariate linear regression analysis between monocyte maturation status (CD86 surface expression [MFI]) of NPA CMs in IAV+ patients and (F) cycle threshold (Ct) values, (G) maturation status (CD86 surface expression [MFI]) of NPA CD1c+ myeloid DCs (MDCs) in IAV patients and (H) maturation status (CD86 surface expression [MFI]) of NPA CD141+ MDCs in in IAV patients. The shaded area represents the 95% confidence region for the fitted line. R represents Spearman ρ and differences were considered significant at p<0.05.
-
Figure 3—source data 1
Related to Figure 3A.
- https://cdn.elifesciences.org/articles/77345/elife-77345-fig3-data1-v2.xlsx
-
Figure 3—source data 2
Related to Figure 3B.
- https://cdn.elifesciences.org/articles/77345/elife-77345-fig3-data2-v2.xlsx
-
Figure 3—source data 3
Related to Figure 3C.
- https://cdn.elifesciences.org/articles/77345/elife-77345-fig3-data3-v2.xlsx
-
Figure 3—source data 4
Related to Figure 3D.
- https://cdn.elifesciences.org/articles/77345/elife-77345-fig3-data4-v2.xlsx
-
Figure 3—source data 5
Related to Figure 3E.
- https://cdn.elifesciences.org/articles/77345/elife-77345-fig3-data5-v2.xlsx
-
Figure 3—source data 6
Related to Figure 3F.
- https://cdn.elifesciences.org/articles/77345/elife-77345-fig3-data6-v2.xlsx
-
Figure 3—source data 7
Related to Figure 3G.
- https://cdn.elifesciences.org/articles/77345/elife-77345-fig3-data7-v2.xlsx
-
Figure 3—source data 8
Related to Figure 3H.
- https://cdn.elifesciences.org/articles/77345/elife-77345-fig3-data8-v2.xlsx
Figure 4
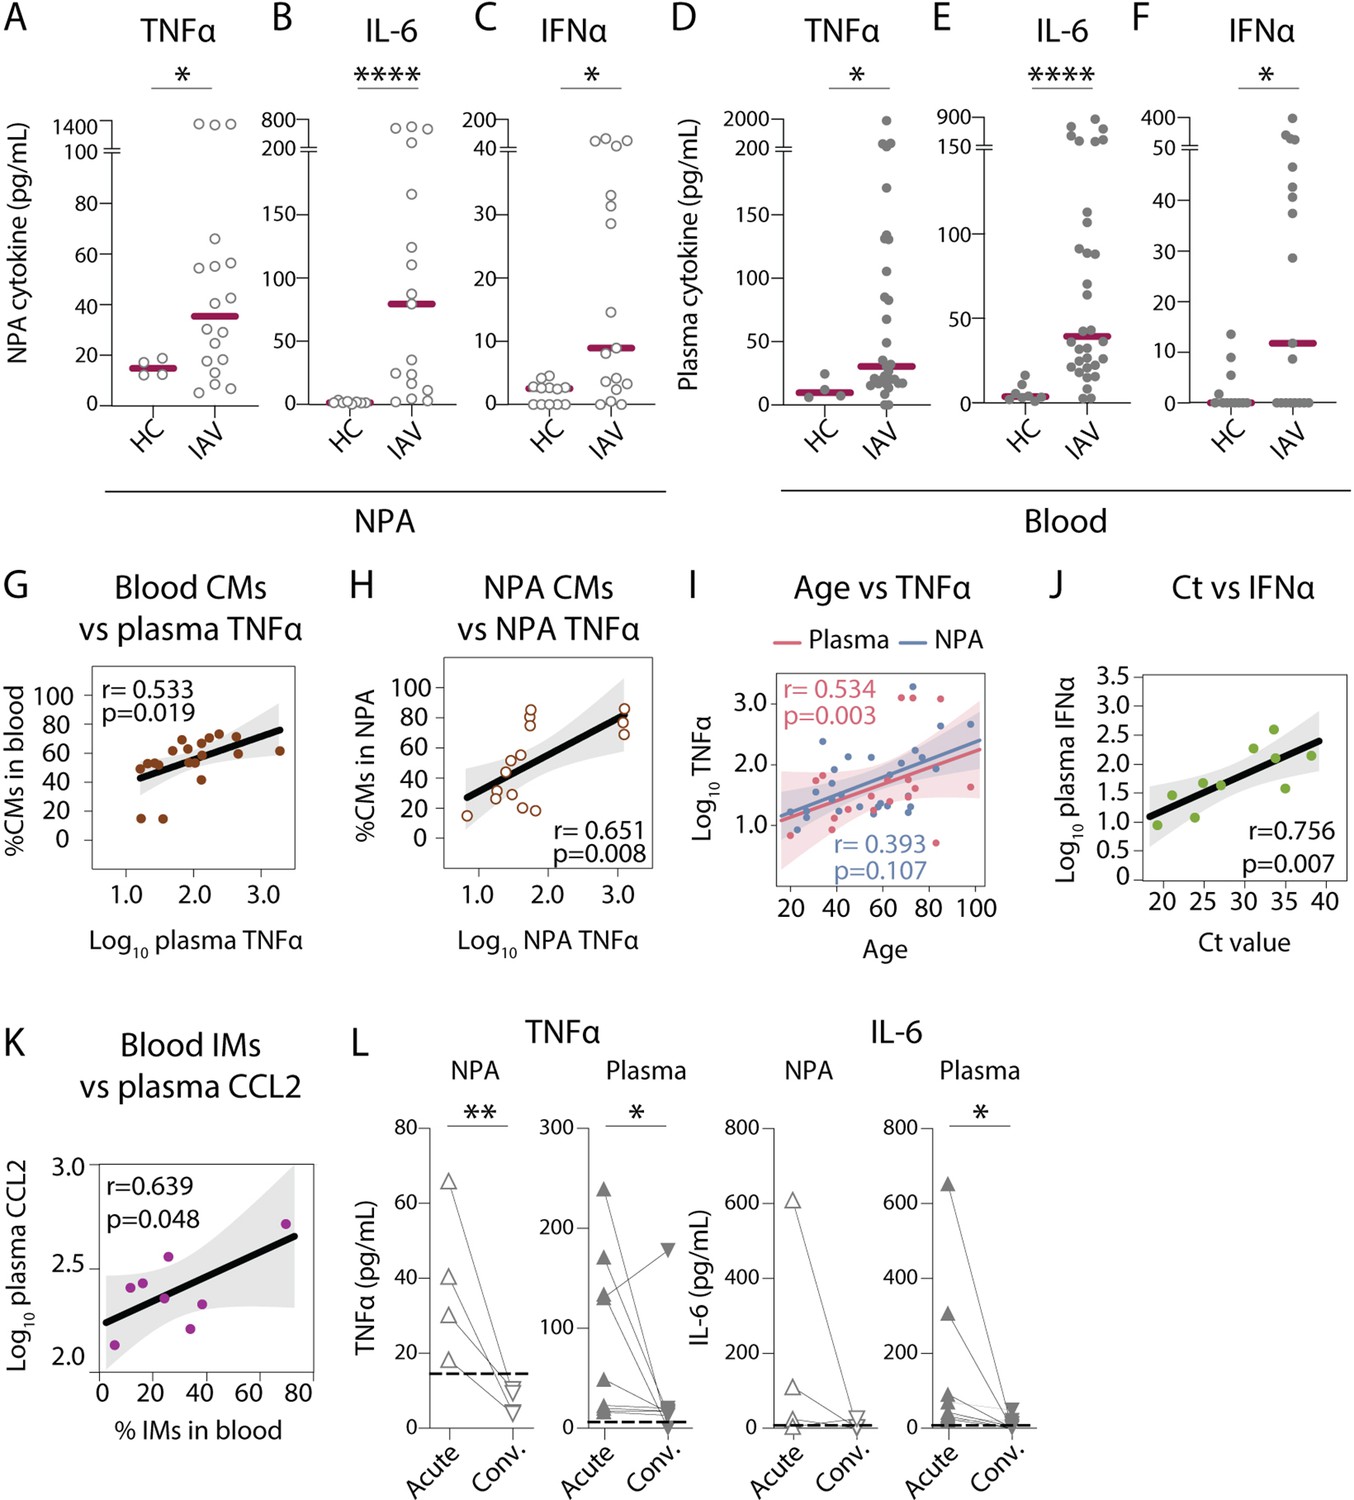
Nasopharyngeal and plasma levels of proinflammatory cytokines TNFα, IL-6, and IFNα are elevated during acute influenza A virus (IAV) infection.
(A–F) Graphs show concentrations of (A and D) TNFα, (B and E) IL-6, (C and F) IFNα in (A–C) nasopharyngeal aspirates (NPA) (open circles), and (D–F) plasma (filled circles) from healthy controls (HCs) (n=12) and IAV patients (n=31) as determined by ELISA. Lines indicate median concentration. Differences between IAV patients and HCs were assessed using Mann-Whitney test and considered significant at p<0.05 (*p<0.05, **p<0.01, ****p<0.0001). (G–K) Scatter plots and lines of fit display bivariate linear regression analysis between variables. The shaded area represents the 95% confidence region for the fitted line. R represents Spearman ρ and differences were considered significant at p<0.05. (G) Log10 plasma TNFα values vs. CD14+CD16 classical monocyte (CM) frequency in blood of IAV patients; (H) log10 NPA TNFα vs CM frequency in the NPA of IAV patients; (I) age vs. log10 TNFα values in plasma (pink) and NPA (blue) in IAV patients; (J) cycle threshold (Ct) values vs. log10 IFNα values in IAV patients (light green) and (K) log10 plasma CCL2 vs. intermediate monocyte (IM) frequency in blood of IAV patients. (L) Graphs depict TNFα and IL-6 levels in the NPA (n=4) and plasma (n=8) during the acute (upward triangles) and convalescent phase (downward triangles) in IAV patients. Dashed lines depict median frequency values from HCs in blood and NPA. Differences between acute and convalescent phase values were assessed using Wilcoxon matched-pairs signed rank test and considered significant at p<0.05 (*p<0.05 and **p<0.01).
-
Figure 4—source data 1
Related to Figure 4A.
- https://cdn.elifesciences.org/articles/77345/elife-77345-fig4-data1-v2.xlsx
-
Figure 4—source data 2
Related to Figure 4B.
- https://cdn.elifesciences.org/articles/77345/elife-77345-fig4-data2-v2.xlsx
-
Figure 4—source data 3
Related to Figure 4C.
- https://cdn.elifesciences.org/articles/77345/elife-77345-fig4-data3-v2.xlsx
-
Figure 4—source data 4
Related to Figure 4D.
- https://cdn.elifesciences.org/articles/77345/elife-77345-fig4-data4-v2.xlsx
-
Figure 4—source data 5
Related to Figure 4E.
- https://cdn.elifesciences.org/articles/77345/elife-77345-fig4-data5-v2.xlsx
-
Figure 4—source data 6
Related to Figure 4F.
- https://cdn.elifesciences.org/articles/77345/elife-77345-fig4-data6-v2.xlsx
-
Figure 4—source data 7
Related to Figure 4G.
- https://cdn.elifesciences.org/articles/77345/elife-77345-fig4-data7-v2.xlsx
-
Figure 4—source data 8
Related to Figure 4H.
- https://cdn.elifesciences.org/articles/77345/elife-77345-fig4-data8-v2.xlsx
-
Figure 4—source data 9
Related to Figure 4I.
- https://cdn.elifesciences.org/articles/77345/elife-77345-fig4-data9-v2.xlsx
-
Figure 4—source data 10
Related to Figure 4J.
- https://cdn.elifesciences.org/articles/77345/elife-77345-fig4-data10-v2.xlsx
-
Figure 4—source data 11
Related to Figure 4K.
- https://cdn.elifesciences.org/articles/77345/elife-77345-fig4-data11-v2.xlsx
-
Figure 4—source data 12
Related to Figure 4L.
- https://cdn.elifesciences.org/articles/77345/elife-77345-fig4-data12-v2.xlsx
Figure 5
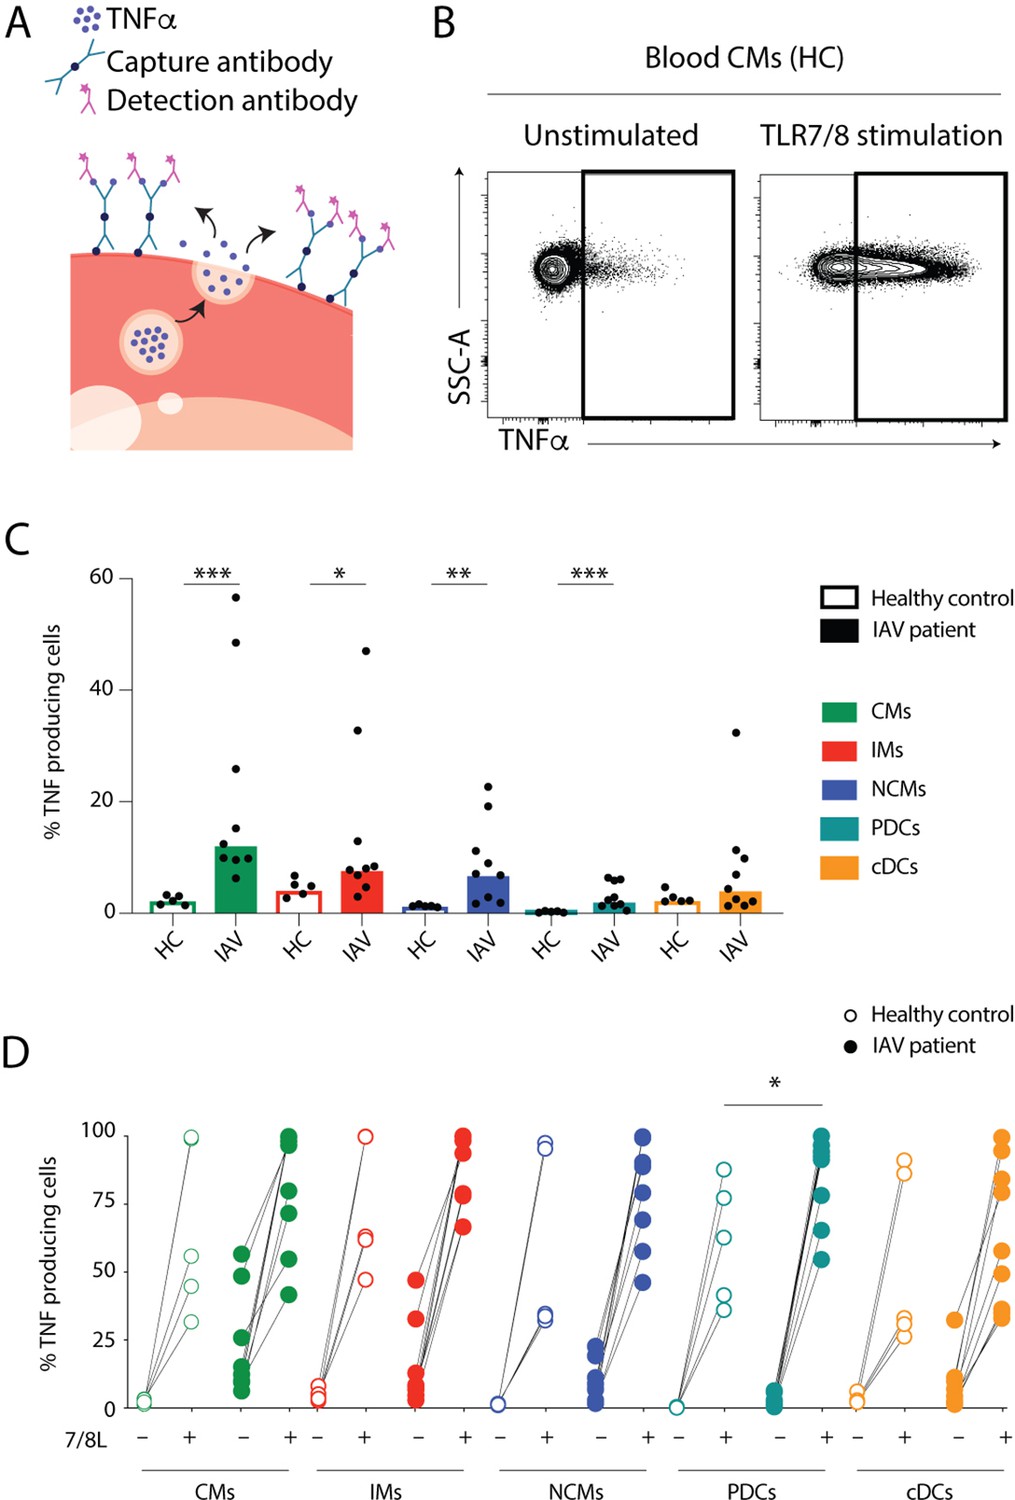
Monocytes and dendritic cells (DCs) from influenza A virus (IAV) patients produce TNFα ex vivo without stimulation.
(A) TNFα release assay: the capture antibody (green) immobilizes secreted TNFα on the cell surface of the TNFα-secreting cell. The PE-labelled detection antibody (pink) together with the phenotypic antibody panel allows detection of TNFα production in individual cell subsets by flow cytometry. (Illustrations were modified from Servier Medical Art, licensed under a Creative Commons Attribution 3.0 Unported License.) (B) Representative flow cytometry plots of TNFα-producing blood classical monocytes (CMs) from one healthy control (HC) after 2 hr at 37°C without (unstimulated) or with TLR7/8L stimulation. (C) Bar graphs display median frequency of TNFα-producing cells in CD14+CD16− CMs (green), CD14+CD16+ intermediate monocytes (IMs) (red), CD14–CD16+ nonclassical monocytes (NCMs) (blue), plasmacytoid DCs (PDCs) (teal), and total cDCs (orange) in blood in HCs (open, n=5) and IAV patients (filled, n=9) in the absence of TLR stimulation. Each dot represents an individual donor. (D) Graph displays frequency of TNFα-producing cells in monocyte and DC subsets from HCs (open, n=5) and IAV patients (filled n=9) in the absence (–) or presence (+) of TLR7/8L stimulation. Differences between IAV patients and HCs in (C) were assessed by Mann-Whitney test and in (D) with two-way ANOVA using Sidak’s multiple comparisons test and considered significant at p<0.05. (*p<0.05, **p<0.01, and ***p<0.001).
-
Figure 5—source data 1
Related to Figure 5C.
- https://cdn.elifesciences.org/articles/77345/elife-77345-fig5-data1-v2.xlsx
-
Figure 5—source data 2
Related to Figure 5D.
- https://cdn.elifesciences.org/articles/77345/elife-77345-fig5-data2-v2.xlsx
Figure 6
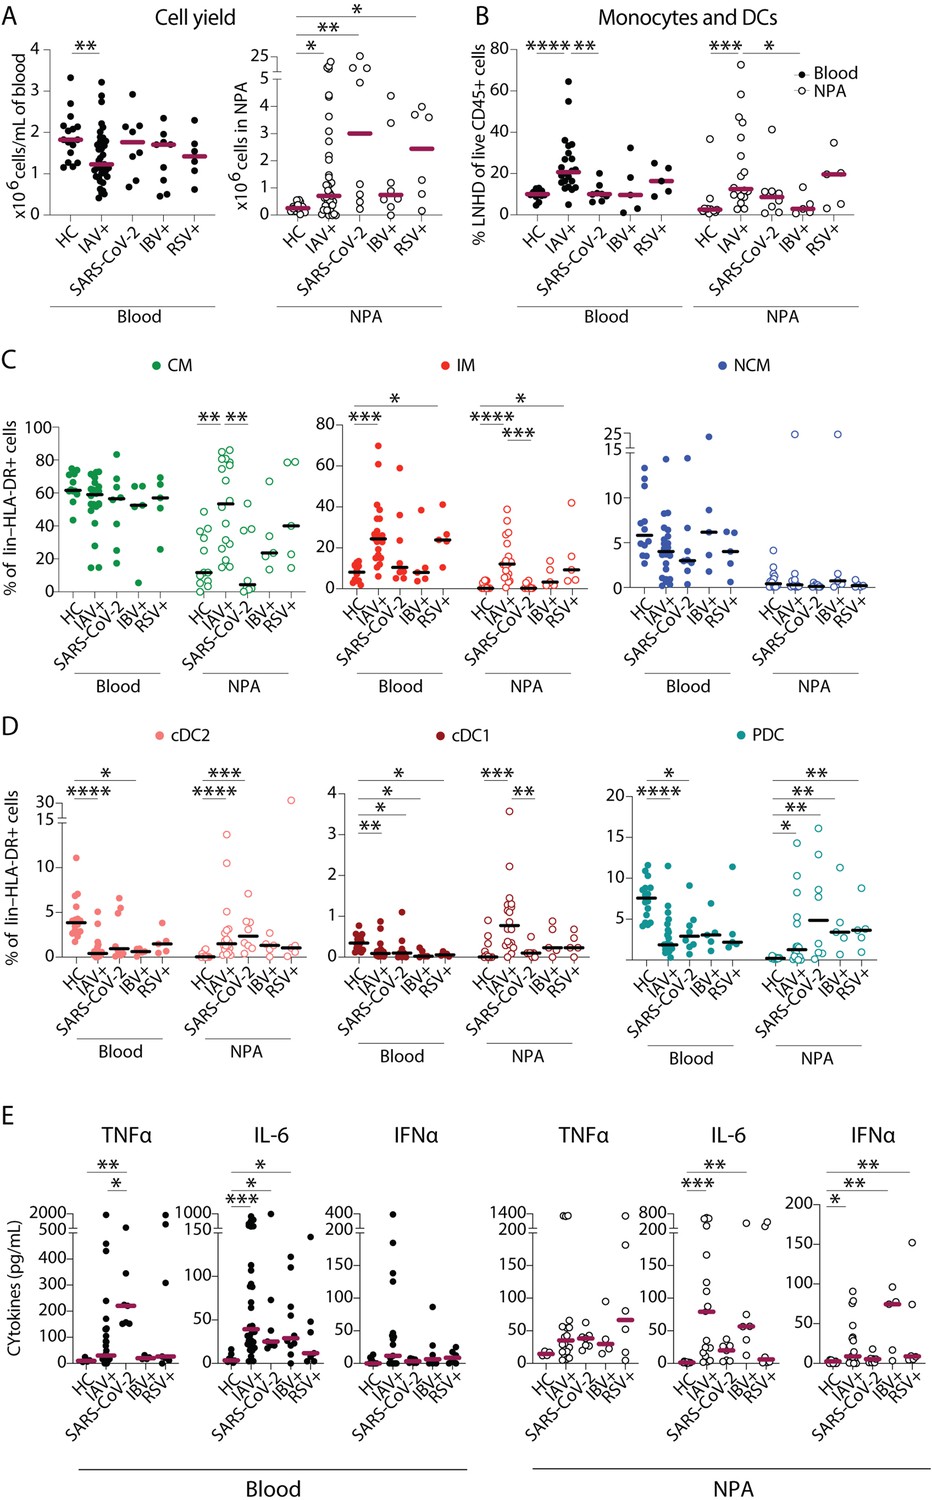
Severe acute respiratory syndrome coronavirus 2 (SARS-CoV-2) infection elicits a distinct pattern of innate immune response as compared to influenza A virus (IAV) infection.
(A–B) Scatter plots show data from individual subjects and lines indicate median values. (A) Cell yield per mL blood (×106 PBMCs, filled circles) and total nasopharyngeal aspirates (NPA) cells (×106 cells, open circles) obtained from patients (IAV n=22, SARS-CoV-2 n=8, influenza B virus [IBV] n=5 and respiratory syncytial virus [RSV] n=5), and healthy controls [HCs] (n=12). (B) Frequency of lineage negative HLA-DR+ cells of live CD45+ cells in blood (filled circles) and NPA (open circles) from HCs and patients. (C–D) Scatter plots show frequencies of (D) monocyte subsets (CD14+CD16− CM: green, CD14+CD16+ intermediate monocyte [IM]: red, CD14−CD16− nonclassical monocyte [NCM]: blue), and (E) dendritic cell [DC] subsets (cDC2: coral, cDC1: maroon, PDC: teal) in PBMCs (filled circles) and NPA (open circles) from HCs and patients. Graphs show data from individual subjects and lines represent median values. Differences between HCs or IAV patients and other patient groups were assessed using Kruskal-Wallis test with Dunn’s multiple comparisons test and considered significant at p<0.05 (*p<0.05, **p<0.01, ***p<0.001, and ****p<0.0001). (E) Graphs show concentrations of TNFα, IL-6, and IFNα in plasma (filled circles) and NPA (open circles) from HCs and patients as determined by ELISA. Lines indicate median concentration. Differences between IAV patients and HCs were assessed using Mann-Whitney test and considered significant at p<0.05 (*p<0.05, **p<0.01, and ***p<0.001).
-
Figure 6—source data 1
Related to Figure 6A – blood.
- https://cdn.elifesciences.org/articles/77345/elife-77345-fig6-data1-v2.xlsx
-
Figure 6—source data 2
Related to Figure 6A – nasopharyngeal aspirates (NPA).
- https://cdn.elifesciences.org/articles/77345/elife-77345-fig6-data2-v2.xlsx
-
Figure 6—source data 3
Related to Figure 6B – blood.
- https://cdn.elifesciences.org/articles/77345/elife-77345-fig6-data3-v2.xlsx
-
Figure 6—source data 4
Related to Figure 6B – nasopharyngeal aspirates (NPA).
- https://cdn.elifesciences.org/articles/77345/elife-77345-fig6-data4-v2.xlsx
-
Figure 6—source data 5
Related to Figure 6C – classical monocyte (CM).
- https://cdn.elifesciences.org/articles/77345/elife-77345-fig6-data5-v2.xlsx
-
Figure 6—source data 6
Related to Figure 6C – intermediate monocyte (IM).
- https://cdn.elifesciences.org/articles/77345/elife-77345-fig6-data6-v2.xlsx
-
Figure 6—source data 7
Related to Figure 6C nonclassical monocyte (NCM).
- https://cdn.elifesciences.org/articles/77345/elife-77345-fig6-data7-v2.xlsx
-
Figure 6—source data 8
Related to Figure 6D – cDC2.
- https://cdn.elifesciences.org/articles/77345/elife-77345-fig6-data8-v2.xlsx
-
Figure 6—source data 9
Related to Figure 6D – cDC1.
- https://cdn.elifesciences.org/articles/77345/elife-77345-fig6-data9-v2.xlsx
-
Figure 6—source data 10
Related to Figure 6D – plasmacytoid dendritic cell (PDC).
- https://cdn.elifesciences.org/articles/77345/elife-77345-fig6-data10-v2.xlsx
-
Figure 6—source data 11
Related to Figure 6E – blood.
- https://cdn.elifesciences.org/articles/77345/elife-77345-fig6-data11-v2.xlsx
-
Figure 6—source data 12
Related to Figure 6E – nasopharyngeal aspirates (NPA).
- https://cdn.elifesciences.org/articles/77345/elife-77345-fig6-data12-v2.xlsx
Figure 7
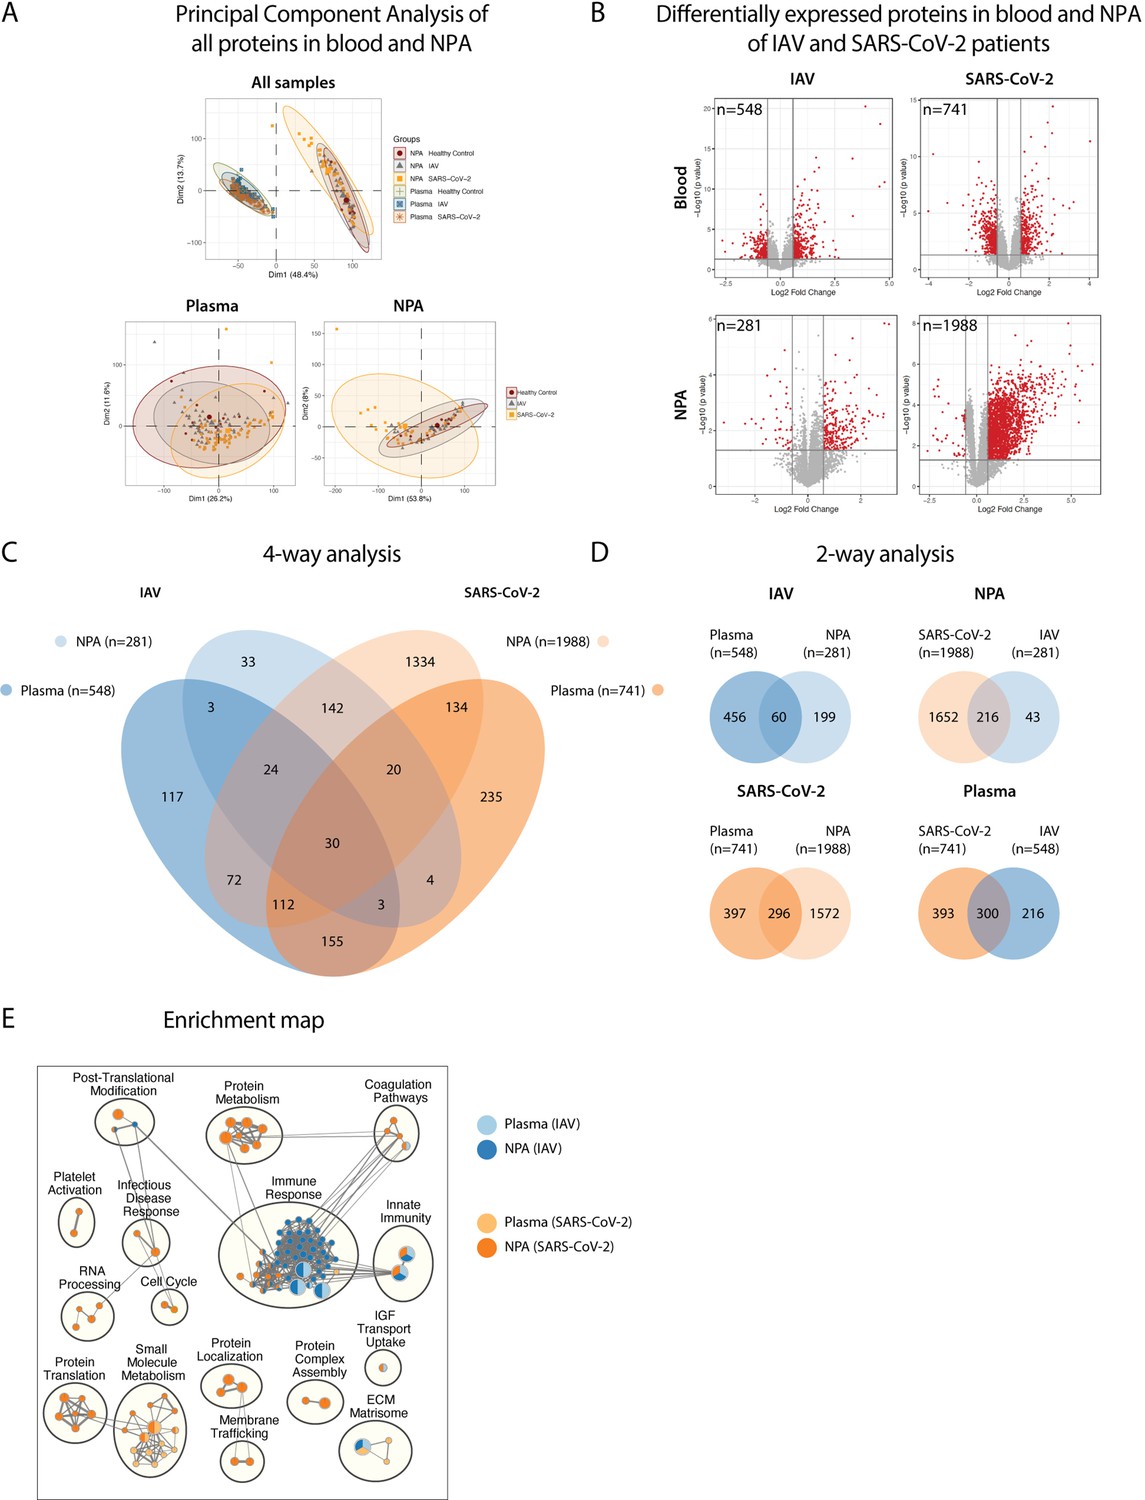
Pathway analysis delineates biological pathways and processes in influenza A virus (IAV) and severe acute respiratory syndrome coronavirus 2 (SARS-CoV-2) infection.
(A) Principal component analysis illustrates differences between proteins in plasma and NPA from 45 IAV and 34 SARS-CoV_2 patients, in comparison with 11 healthy controls, as assayed by the SomaScan proteomic platform. (B) Volcano plots show differentially expressed proteins (DEPs) in plasma and nasopharyngeal aspirates (NPA) of both IAV and SARS-CoV-2 patients. N reflects unique EnsembleGene symbols above the threshold (p<0.05 and log2 fold-change >1.5). (C) Four-way and (D) two-way analysis depicts unique or overlapping DEPs identified in plasma (lighter) and NPA (darker), and between IAV (blue) and SARS-CoV-2 (orange) patients. (E) G:profiler pathway enrichment comparing plasma (lighter) and NPA (darker) specimens from patients with IAV (blue) or SARS-CoV-2 (orange) infection. Cytoscape and EnrichmentMap were used for clustering and visualization of the enrichment results. Nodes represent enriched gene sets, clustered with related gene sets according to their gene content. Enrichment results were mapped as a network of gene sets (nodes). Node size is proportional to the total number of genes within each gene set. Proportion of shared genes between gene sets is represented as the thickness of the edge connecting nodes. The network map was manually curated by assigning functional categories to each cluster and by removing singleton gene sets. A complete list of enriched gene sets can be found in Table S2.
Tables
Table 1
Patient and control characteristics.
| Cohort | IAV | IBV | RSV | SARS-CoV-2 | Healthy controls | p-Value* |
|---|---|---|---|---|---|---|
| n | 70 | 10 | 6 | 35 | 20 | |
| Age, median (range) | 59 (20–98) | 54 (25–89) | 63 (32–88) | 52 (26–76) | 44 (22–59) | 0.009 |
| Male gender, n (%) | 29 (41) | 6 (60) | 2 (33) | 18 (51) | 12 (60) | 0.5 |
| Onset to inclusion, days, median [IQR] | 4 [2–5] | 5 [4–6] | 6 [4–7] | 12 [10–22] | – | <0.001 |
| Hospital admission, n (%) | 34 (49) | 2 (20) | 4 (67) | 24 (69) | – | 0.031 |
| Comorbidities | ||||||
| CCI, median [IQR] | 1.5 [0.0–4.0] | 0.0 [0.0–3.0] | 2.50 [2.0–3.0] | 1.0 [0.0–3.0] | – | 0.2 |
| BMI, median [IQR] | 25.9 [23.0–31.6] | 26.3 [23.4–29.4] | 26.0 [22.6–29.9] | 27.0 [25.4–30.5] | – | 0.8 |
| Hypertension, n (%) | 20 (29) | 1 (10) | 2 (33) | 9 (26) | – | 0.7 |
| Diabetes, n (%) | 7 (10) | 2 (20) | 2 (33) | 9 (26) | – | 0.073 |
| Current smoker, n (%) | 11 (17) | 1 (11) | 0 | 2 (5.9) | – | 0.4 |
| Laboratory analyses | ||||||
| CRP (mg/L), median [IQR] | 40 [24–67] | 34 [9–39] | 44 [33–62] | 102 [24–182] | 0 (0–0) | <0.001 |
| WBC (×109/L), median (IQR) | 6.4 [5.0–8.3] | 5.8 [5.3–9.0] | 8.9 [NA] | 6.7 [4.5–7.9] | 6.0 [5.0–6.8] | 0.3 |
| Lymphocytes (×109/L), median [IQR] | 1.0 [0.7–1.3] | 0.8 [0.7–0.9] | 1.1 [NA] | 1.20 [0.8–1.7] | 1.7 [1.5–2.0] | 0.048 |
| Neutrophils (×109/L), median [IQR] | 4.7 [2.7–6.3] | 4.6 [3.3–6.8] | 5.6 [NA] | 4.4 [2.7–6.6] | 3.2 [3.0–3.8] | 0.9 |
| Monocytes (×109/L), median [IQR] | 0.7 [0.5–0.8] | 0.5 [0.5–0.6] | 0.8 [NA] | 0.4 [0.3–0.6] | 0.5 [0.4–0.5] | 0.022 |
| Ct value, median [IQR] | 25.1 [22.1–31.1] | 27.2 [22.4–31.8] | 30.1 [25.8–35.9] | 27.1 [23.0–29.2] | – | 0.3 |
| Treatment | ||||||
| Tamiflu prescribed, n (%) | 35 (54) | 0 | 0 | 0 | – | – |
| Antibiotics prescribed, n (%) | 21 (33) | 2 (22) | 3 (50) | NA | – | 0.5 |
| Peak severity score | ||||||
| Mild disease, n (%) | 57 (81) | 10 (100) | 4 (67) | 15 (43) | – | <0.001 |
| Moderate disease, n (%) | 13 (19) | 0 | 2 (33) | 20 (57) | – | <0.001 |
-
*
Statistical significance was determined by Kruskal-Wallis rank sum test; Fisher’s exact test. CCI: Charlson comorbidity index. BMI: body mass index. CRP: C-reactive protein. WBC: white blood cells. Ct: cycle threshold. Normal range: BMI: 18.5–24.9, CRP <3 mg/L, WBC 3.5×10⁹/L to 8.8×10⁹/L, lymphocytes 1.1×10⁹/L to 3.5×10⁹/L, neutrophils 1.6×10⁹/L to 5.9×10⁹/L, monocytes 0.2×10⁹/L to 0.8×10⁹/L.
Appendix 1—table 1
Flow cytometry panels.
| Panel 1: Phenotyping of MNPs from PBMCs | |||
|---|---|---|---|
| Fluorochrome | Marker | Company | Clone |
| FITC | CD83 | BioLegend | HB15e |
| PerCp Cy5.5 | CD123 | BD | 7G3 |
| PE Cy7 | CD1c | Miltenyi | AD5-8E7 |
| PE Cy5 | CD11c | BD | B-Ly6 |
| PE TR | HLA-DR | Life Technologies | TU36 |
| PE | CD141 | Miltenyi | AD5-14H12 |
| APC-Cy7 | CD3 | BD | SK7 |
| CD19 | BioLegend | HIB19 | |
| CD20 | BD | L27 | |
| CD56 | BD | HCD56 | |
| CD66abce | Miltenyi | TET2 | |
| AF700 | CD16 | BioLegend | 3GE |
| APC | CD45 | BD | HI30 |
| BV786 | CD62L | BD | SK11 |
| BV650 | CD86 | BD | 2331 |
| BV605 | CCR2 | BioLegend | K036C2 |
| BV510 | CD14 | BD | M5E2 |
| V450 | CCR7 | BD | 150503 |
| DAPI | Live/Dead Blue | Thermo Fisher | Cat no: L34962 |
| Panel 2: Phenotyping of PBMCs following TLR stimulation-TNF-release assay | |||
| Fluorochrome | Marker | Company | Clone |
| FITC | CD83 | Biolegend | HB15e |
| PerCp Cy5.5 | CD123 | BD | 7G3 |
| PE Cy7 | CD1c | Miltenyi | AD5-8E7 |
| PE Cy5 | CD11c | BD | B-Ly6 |
| PE TR | HLA-DR | Life Technologies | TU36 |
| PE | TNF-α detection antibody | Miltenyi | (Reagent from 130-091-268) |
| APC-Cy7 | CD3 | BD | SK7 |
| CD19 | BioLegend | HIB19 | |
| CD20 | BD | L27 | |
| CD56 | BD | HCD56 | |
| CD66abce | Miltenyi | TET2 | |
| AF700 | CD16 | BioLegend | 3GE |
| APC | CD141 | Miltenyi | AD5-14H12 |
| BV786 | CD62L | BD | SK11 |
| BV650 | CD86 | BD | 2331 |
| BV605 | CCR2 | BioLegend | K036C2 |
| BV510 | CD14 | BD | M5E2 |
| V450 | CCR7 | BD | 150503 |
| DAPI | Live/Dead Blue | Thermo Fisher | Cat no: L34962 |
Additional files
-
Supplementary file 1
Flow cytometry panels.
- https://cdn.elifesciences.org/articles/77345/elife-77345-supp1-v2.xlsx
-
Supplementary file 2
List of enriched pathways from gprofiler.
- https://cdn.elifesciences.org/articles/77345/elife-77345-supp2-v2.xlsx
-
Transparent reporting form
- https://cdn.elifesciences.org/articles/77345/elife-77345-transrepform1-v2.docx
Download links
A two-part list of links to download the article, or parts of the article, in various formats.
Downloads (link to download the article as PDF)
Open citations (links to open the citations from this article in various online reference manager services)
Cite this article (links to download the citations from this article in formats compatible with various reference manager tools)
Human influenza virus infection elicits distinct patterns of monocyte and dendritic cell mobilization in blood and the nasopharynx
eLife 12:e77345.
https://doi.org/10.7554/eLife.77345


